 Pengpeng Dou
 Jie Wang
 Kun Wang
- 1Grassland Ecology Laboratory, College of Grassland Science and Technology, China Agricultural University, Beijing, China
- 2GuYuan National Grassland Ecosystem Field Station, Guyuan, China
Changes in species composition and diversity-productivity relationships during vegetation succession are of great significance for the restoration of degraded grasslands. However, the human intervention of grassland restoration mostly considers the single ecological (diversity) or production (biomass) function of grasslands, and does not fully consider the relationships between the two to improve the restoration effects. In this study, three vegetation types (desert grassland, sandy grassland and temperate savanna) were considered to simulate the three stages of restoration of degraded temperate savanna (early, middle and late restoration). Changes in species composition, diversity, and diversity-productivity relationships during the temperate savanna restoration were explored through spatiotemporal substitution. The results showed that with the progress of succession, xerophytes decreased significantly, mesophytes and hygrophytes increased, C4 plants decreased gradually, and C3 plants increased. The change of species richness was the main reason for community differences in the process of community succession, and species replacement mainly occurred between communities in the early and middle stages of succession. Species richness increased significantly from early to late stage of restoration. Latitude was significantly negatively correlated with species diversity. In the process of vegetation restoration, the impact of species richness, Pielou’s evenness, and β-diversity on biomass gradually developed positively and continued to increase, while the Simpson index showed the opposite effect. This study provides references for the restoration of temperate savanna and emphasizes the ecological and productive functions of the grassland should be taken into account in the restoration strategy.
1 Introduction
Grassland degradation is an important environmental problem that China and the world are facing at present (bo et al., 2022; Bardgett et al., 2021), but the degree of degradation and driving factors vary from place to place. In terms of the functional attributes of each ecosystem, it is necessary to give consideration to both ecological protection and production practices (Bengtsson et al., 2019). However, although we know that restoration strategies for degraded grasslands should be tailored to local conditions (Liu et al., 2019; Carbutt and Kirkman, 2022; Lyu et al., 2022), human interventions for grassland restoration tend to consider the single ecological (diversity) or productive (biomass) functions of grasslands (Guo, 2007). Moreover, the functions of grasslands have also changed during different restoration stages, which requires us to adjust strategies in time and respond flexibly. As we all know, the Chinese government has adopted a series of restoration projects for the treatment of degraded grasslands, such as reward and subsidy policies (Ding et al., 2022), returning farmland to grassland, rest grazing, grass-livestock balance (Hu et al., 2019), etc. These efforts have had a certain effect on the restoration of grasslands (Guo et al., 2021), but there are still some problems, such as the lack of targeted measures (Yan et al., 2021). Therefore, we need to make greater efforts to clarify the changes in community structure and ecosystem function during the restoration succession of degraded grasslands to serve the health of grasslands.
Otindag Sandy Land has formed a unique temperate savanna similar to tropical savanna around 8,000 years ago (Niu, 2018). It has been an excellent camp for grazing in the area for thousands of years. However, in recent years, the population surge, the reclamation of grassland under the implementation of grain-based policies, and overgrazing have led to serious grassland degradation (Liu and Wang, 2007), which has seriously affected the local ecological environment and economic development. Otindag Sandy Land is the nearest dust source area in the Beijing-Tianjin area. Under the implementation of the Beijing-Tianjin Sandstorm Source Control Project (Yang et al., 2015; Wu et al., 2019), the restoration of vegetation has achieved significant results, effectively playing an important role as an ecological barrier in the North China Plain. However, some studies have also shown that the degraded area in this area is higher than the restored area (Cong et al., 2022). The discrepancies in the findings reflect that the good effects of ecological engineering are not stable, as it is not appropriate to apply the same strategy to grasslands at different stages of degradation or restoration, which further indicates that our research on grassland restoration succession is insufficient.
At different stages of grassland restoration, actively balancing the ecological and productive functions of the grassland can help to obtain the best restoration effect (He et al., 2022). Community differences and diversity patterns under changes in species abundance and composition provide important references for restoration of degraded grasslands and conservation of biodiversity (Sluis, 2002; Nerlekar and Veldman, 2020). Understanding changes in the relationship between species diversity and productivity at different restoration stages will help us adjust strategies in time. Based on results from secondary succession of subtropical and temperate forests (Wang et al., 2010; Barrufol et al., 2013), coniferous forest succession (Taylor et al., 2020) and subalpine meadow succession (Jiang et al., 2020), the diversity-productivity relationship is complicated, such as unimodal, linear, etc. Obviously, these results cannot be directly applied to temperate savanna. Existing studies on the Otindag Sandy Land mainly focus on the aerial sowing area of Zhenglan Banner. On the one hand, the changes of functional plants in different restoration stages are explored (Mu et al., 2020). On the other hand, the changes of plant diversity in the process of vegetation restoration are concerned (Tian and Liu, 2015). These small-scale studies are insufficient to provide references for the succession of vegetation restoration in the entire Otindag Sandy Land. There are few studies on the vegetation changes in the restoration process of the temperate savanna, which may leave some important information missing, such as changes in species composition, diversity-productivity relationships. It is conceivable that the ecological restoration effect in this area is difficult to achieve effective improvement without data support.
In this study, based on the three vegetation types in the Otindag Sandy Land, we simulated the three stages of temperate savanna vegetation restoration through the spatiotemporal substitution method, and explored the changes in species composition, biodiversity, and productivity-biodiversity relationship during restoration succession. Specifically, there were three objectives as follows: 1) to explore whether the differences in community species composition during temperate savanna restoration are affected by the differences in richness or species replacement; 2) to examine whether plant diversity has continuously increased during the restoration of temperate savanna; 3) to explore whether the relationship between biodiversity and biomass has changed in different restoration stages. This study explores the changes in plant communities during the restoration of temperate savanna from the landscape scale, providing a reference for the implementation of regional ecological engineering and production practices.
2 Material and methods
2.1 Study area
The Otindag Sandy Land located in the central part of the Inner Mongolia Plateau, China (41°46′–44°24′N, 112°22–117°57′E, Figure 1) is a typical temperate savanna (Yu and Chen, 2007). The overall elevation of the area is higher in the southeast and lower in the northwest, due to the Greater Khingan Mountains in the east and the Yinshan Mountains in the southeast. Except for the southeast which is on the edge of China’s monsoon climate, the rest of the region has arid and semi-arid climates. The mean annual precipitation (MAP) decreases from southeast (∼400 mm) to northwest (∼200 mm). The mean annual temperature (MAT) increases from east to west, with an average of 1.6°C. The soil types are zonal chestnut soil and non-zonal aeolian soil. The vegetation is dominated by sandy vegetation such as Stipa capillata L, Agropyron cristatum L.) Gaertn, Leymus chinensis (Trin.) Tzvel, Caragana sinica (Buc’hoz) Rehd. And Ulmus pumila L.
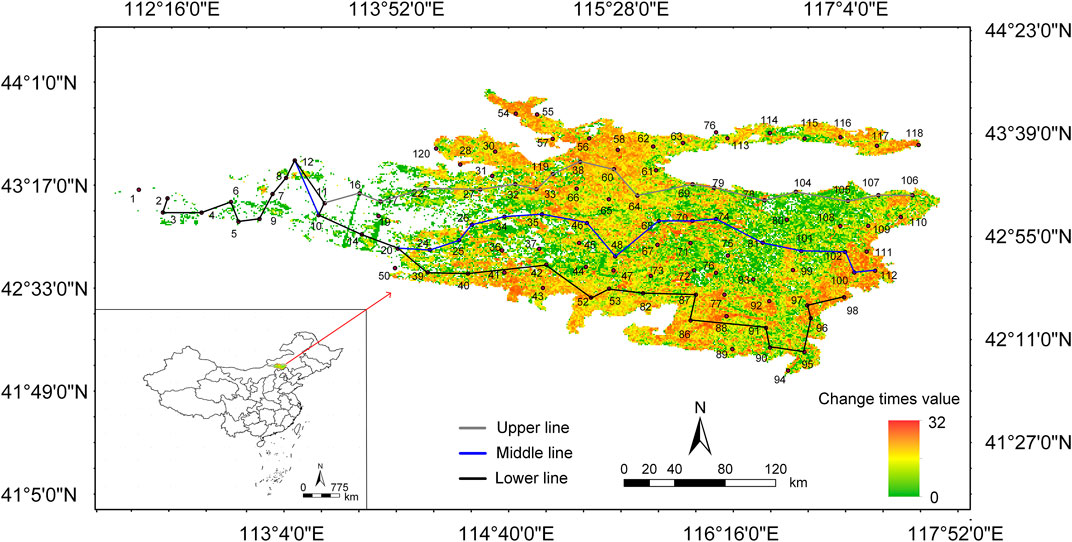
FIGURE 1. Distribution of vegetation type change times in the Otindag Sandy Land over 36 Years.
2.2 Field survey and sampling
Field data were collected from 107 study sites covering 10 counties in Inner Mongolia Autonomous Region, China (Figure 1). In each site, photos were taken to record the grassland types. Locations for the field study were related to different vegetation types including desert grassland, sandy grassland, typical grassland, Sandland Ulmus pumila L-dominated savanna, and Tara Ulmus pumila L-dominated savanna (Xue et al., 2018). Based on the landscape scale, the latter three grassland types were integrated into temperate savanna with a mixture of trees and grasses (Bond and Midgley, 2012). Therefore, the vegetation types recorded at the sampling sites mainly included desert grassland, sandy grassland and temperate savanna. We measured the degrees of degradation by the visual differences in biomass (Zhang et al., 2019), and the measurement results also found that the biomass increased significantly with the restoration of vegetation (Supplementary Figure SA2). We defined three vegetation types as three restoration stages (i.e., early, middle and late stages) using a spatiotemporal surrogate approach (Geng et al., 2022). We showed the number of large livestock and sheep in the Banner County involved in the Otindag Sandy Land in 2019 (Supplementary Figure SA1). Combined with the distribution of sampling points of each vegetation type, we can see that with the restoration of degraded grassland, the number of large livestock was increasing, while the number of sheep was higher in the early and late stages. There were three criteria to obtain rich information on species composition and minimize the potential disturbances from human activities: i) sites were located in the pre-made 20 ✕ 20 km grid; ii) sites were at least 50 m away from roads and >5 km from human habitations; and iii) Four plots with a distance of >10 m were placed randomly in four directions of the site. Elevation, latitude, and longitude of the sites were obtained from handheld GIS, while MAP and MAT from the WorldClim data website (https://www.worldclim.org/).
Field sampling was conducted from June 27 to July 31 in 2021 following standardized sample survey method. Four plots (1 × 1 m to grassland, 5 × 5 m to shrub, and 10 × 10 m to tree) from four directions of each site were established to represent the local condition (vegetation, soil types and so on) that covered an area of at least 200 m2–1,000 m2. We recorded the species, number of individuals and coverage of each plant in the quadrat (1 × 1 m). Species richness is the number of species in the quadrat. Aspect of the quadrat was measured by the compass of the handheld GPS, and the true north direction is 0°, increasing in clockwise direction (Yang et al., 2020). Slope was measured with a slope meter. All grasses were harvested for measurement of aboveground biomass. Three soil cores (5 cm; 0–20 cm depth) was collected randomly in the plot. One was used for belowground biomass, and the roots were screened with a 1 mm sieve. Another was divided into two parts (i.e., different depths: 0–10 cm and 10–20 cm) and used for soil water content measurement. The third was used for soil physicochemical properties. All biomass sample were dried at 60°C for 48 h 0–5 cm and 5–10 cm soil samples were taken with a 100 cm3 ring knife and dried to constant weight for soil bulk density calculation. In addition, combining with previous work on remote sensing image recognition, we calculated the number of changes in vegetation types at each sampling point in the past 36 years. According to different “change time”, three transect lines “upper line, middle line and lower line” were set up to study the change of the community during the whole restoration succession (Figure 1). At the same time, combined with the field survey, nine representative sampling points were selected for each type of grasslands (that was, each restoration stage).
2.3 Soil physicochemical properties
After field sampling, soil was air-dried and used for pH, electrical conductivity, total carbon C), and total nitrogen N) analyses. Soil pH and electrical conductivity (EC) were measured using pH meter and conductivity meter, respectively. After the soil has been pulverized, C and N were measured using Elemental Analyzer. Soil water content were calculated through the mass difference between before and after drying at 105°C.
2.4 Data analyses
Combined with the plant information recorded in the quadrat, we integrated the point data contained in each vegetation type. Beta diversity was calculated and broken down into the contribution of each species broken down into the contribution of each species (i.e., Species Contribution to Beta Diversity, SCBD). Then the species with SCBD greater than the average value were selected the main species in each restoration stage. We combined the flora website (http://www.iplant.cn/) and previous research to further confirm the characteristics of the species, such as life form, water-related characteristics, and photosynthesis (McCarron and Knapp, 2001; Wang, 2003; Wang, 2005; Liu and Wang, 2006; Chandrasekaran et al., 2016). Subsequently, we further analyzed the compositional differences of species in different restoration stages.
The main analyses were based on three sections. Firstly, biodiversity indices such as Shannon index, Simpson index, and Pielou’s evenness were calculated using the “diversity” function of the “vegan” package (Oksanen et al., 2015). Species distribution in three stages were described through non-metric multidimensional scaling. Secondly, β diversity was broken down into species replacement, richness difference, and nested structure, which was used to describe the reasons for differences among communities. At the same time, based on the number of changes in vegetation types over 36 years (Figure 1), three transects were designed to further explore the driving process of inter-community differences during restoration. Moreover, using the dispersal-niche continuum model to explore the main patterns of plant community construction in Otindag Sandy Land. Thirdly, whether there was a significant difference in the aboveground biomass, belowground biomass, and diversity index in the three restoration stages was completed through t-test. The relationship between diversity and biomass was analyzed through multiple regression. And the impact of environmental factors on biodiversity and biomass was analyzed through structural equation modeling. Statistical analyses were based on the GraphPad and R Software. p < 0.05 was statistically significant.
3 Results
3.1 Species composition in different restoration stages
There are differences in vegetation characteristics at different restoration stages (Figure 2; Table 1). Regarding plant life forms, perennial species first decreased and then increased, while annual plant showed the opposite change. With regard to plant characteristics, xerophyte decreased significantly, while mesophyte or wet species increased. When it came to types of photosynthesis in plants, we found C4 plants gradually decreased while C3 increased. As a transition period, mid-restoration shared some of the same species as both early and late (Figure 3), which further demonstrated the existence of community succession as restoration progresses. The dispersal-niche continuum index calculated by life form grouping was 4.81, which indicated that the plant community construction in the Otindag Sandy Land was dominated by the niche process.
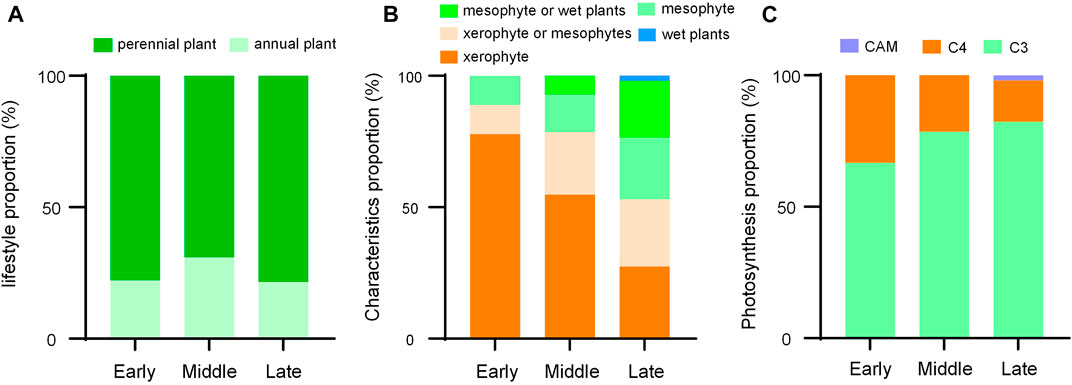
FIGURE 2. Species composition differences in different stages of restoration. CAM, Crassulacean acid metabolism.
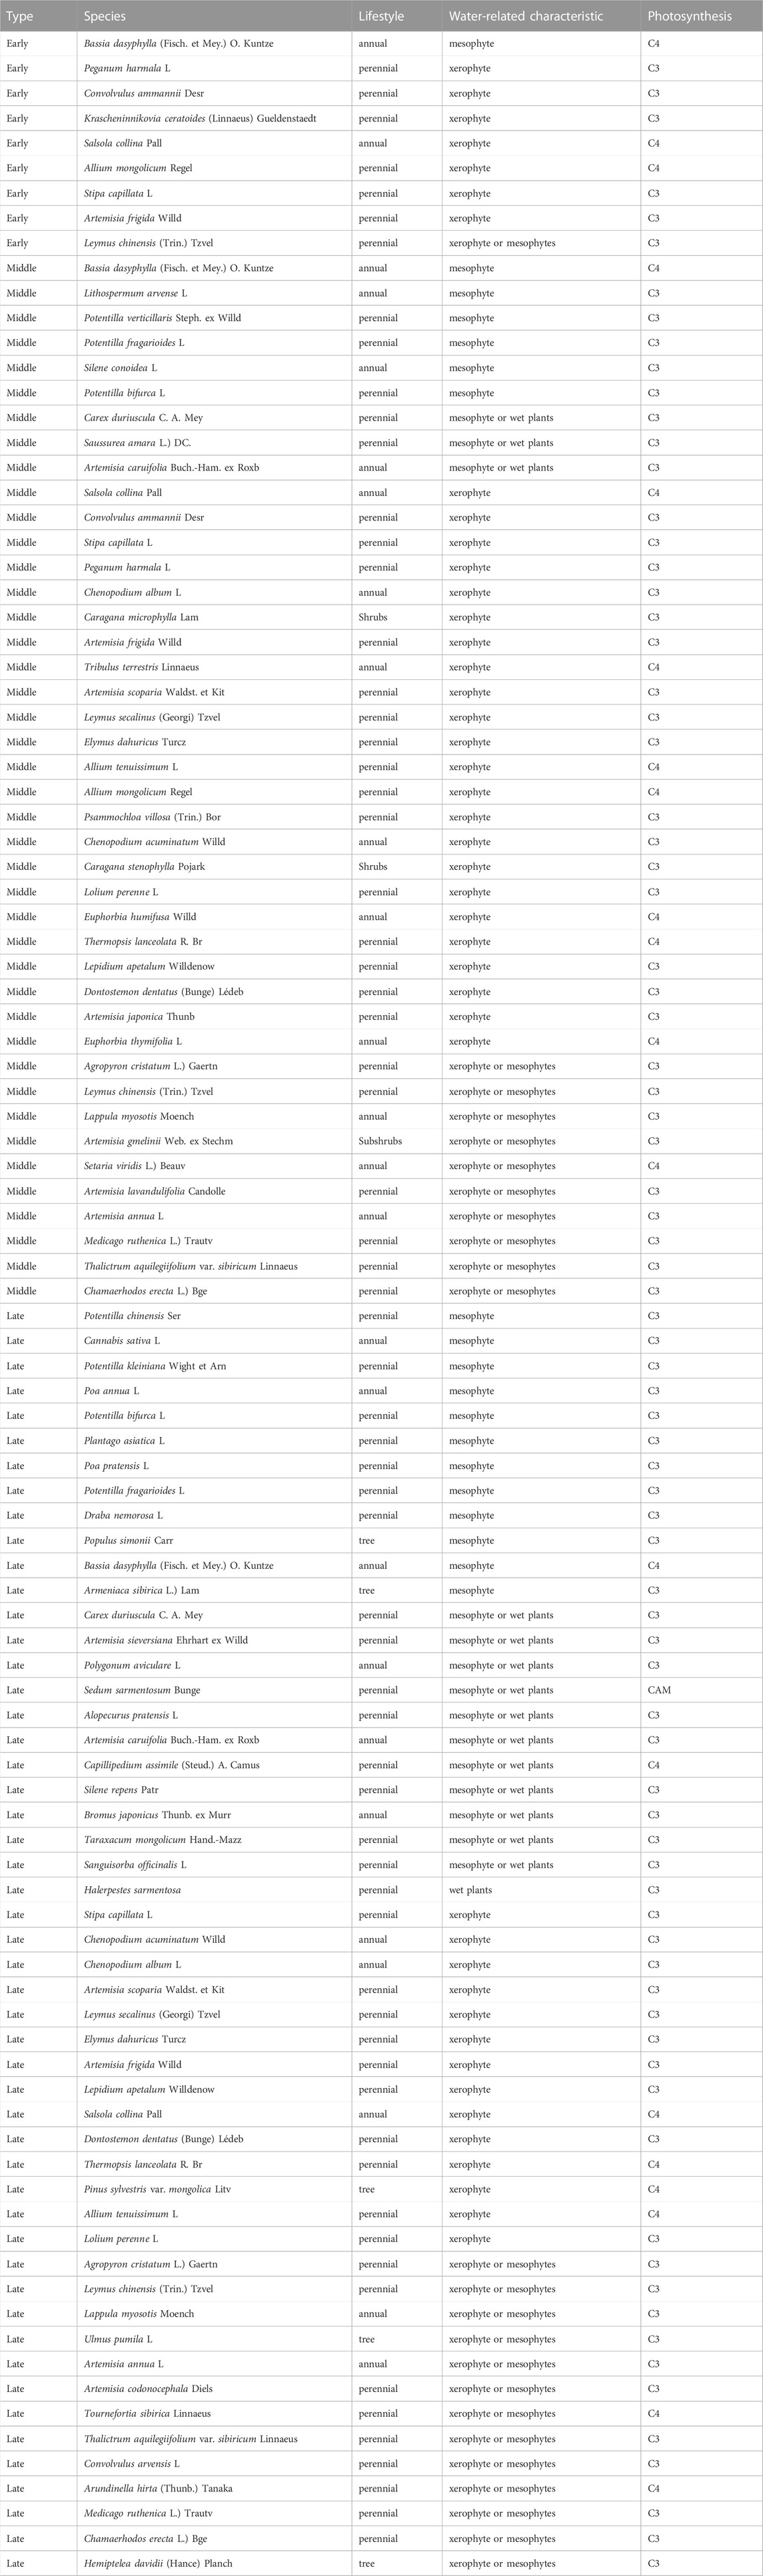
TABLE 1. Information on species that contribute more than average across ecosystems. CAM, Crassulacean acid metabolism.
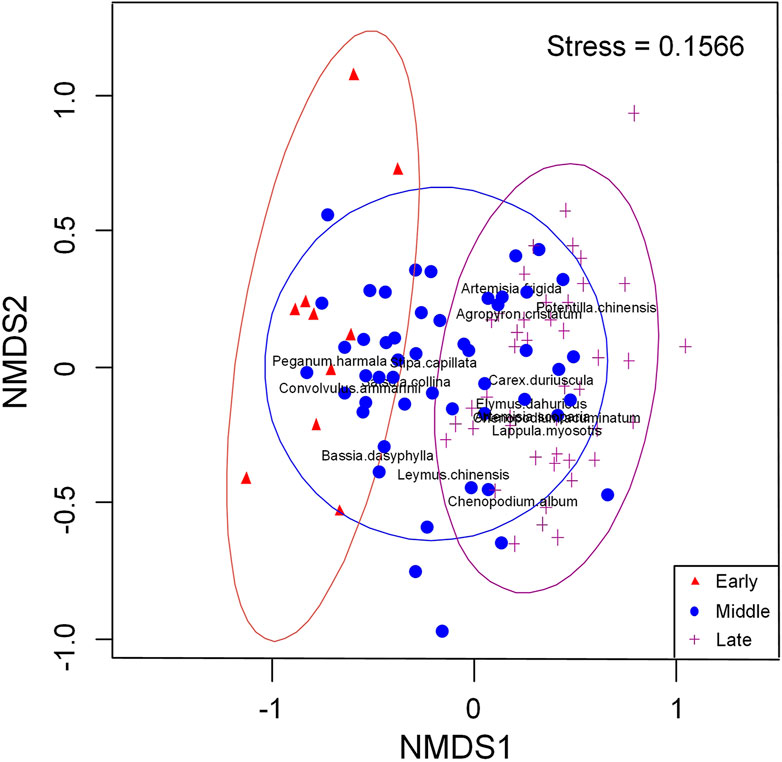
FIGURE 3. Species distribution of three stages of restoration through non-metric multidimensional scaling (NMDS).
Species replacement was the main reason for the difference of communities in early and middle stages of restoration, while species richness was for the late stage. Specifically, compared with the species replacement that existed in short distance, species richness could explain differences between long-distance communities (Figure 4A1). No differences in richness occurred between only one neighbor quadrat (14–20) at the middle stage of restoration (Figure 4B1). Conversely, the richness differences in two neighbor quadrat (48–47, 99–101) were larger (Figure 4C1). Moreover, species richness changes were the main cause of community differences during the succession process, except for the up line. Neighbor quadrat with species replacements were 8–12, 10–14, 14–20, 74–81, and 12–10 was the difference in species richness (Figure 5A1-B1).
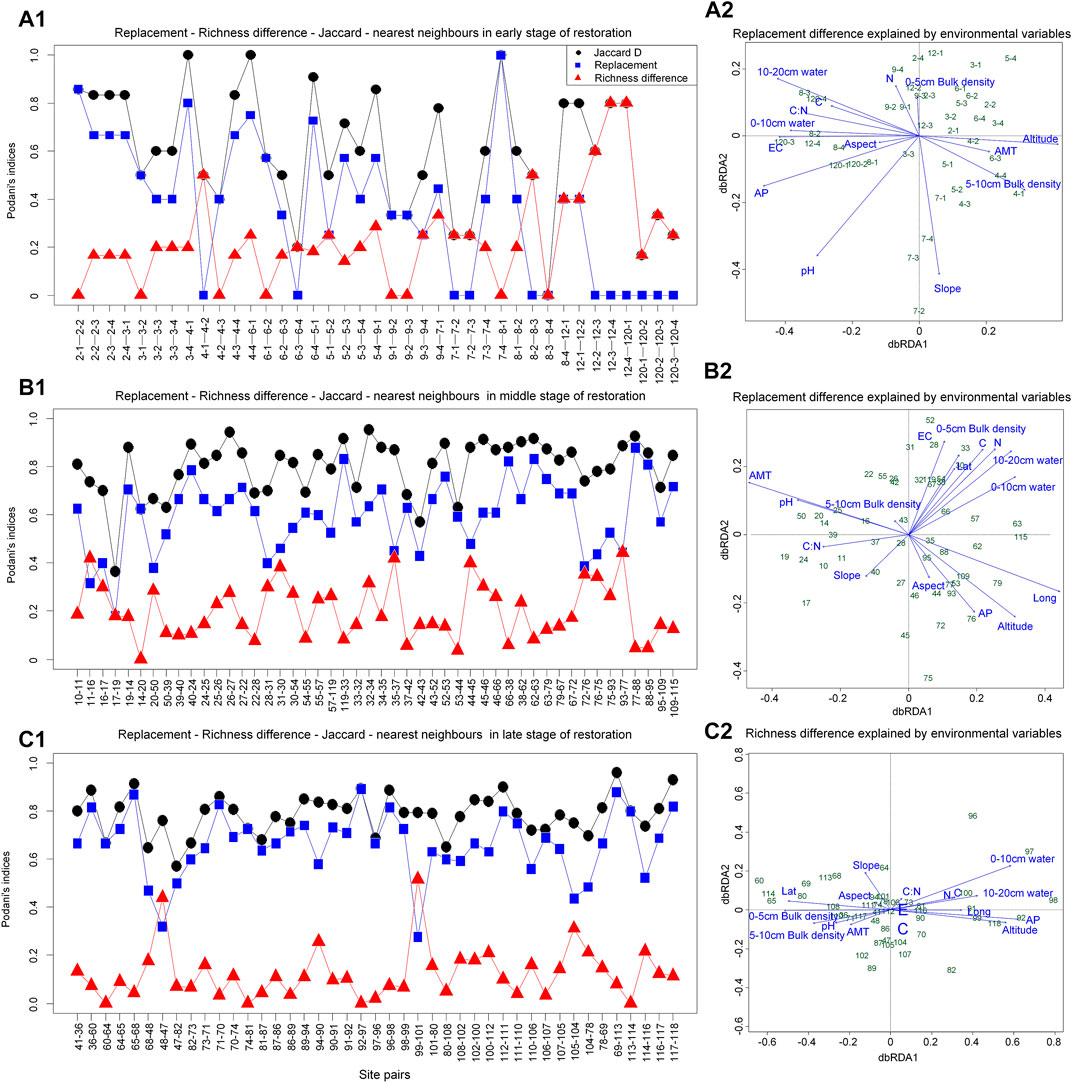
FIGURE 4. The reasons for differences among communities. C, total carbon; N, total nitrogen; EC, electrical conductivity; AP, annual precipitation; AMT, annual mean temperature; Lat, latitude; Long, longitude. The site numbers correspond to the numbers of the sampling points in Figure 1. The sample point data at the initial stage of restoration (Figure 4A1) is not averaged (that is, four replicates are used) to meet the sample size required for analysis.
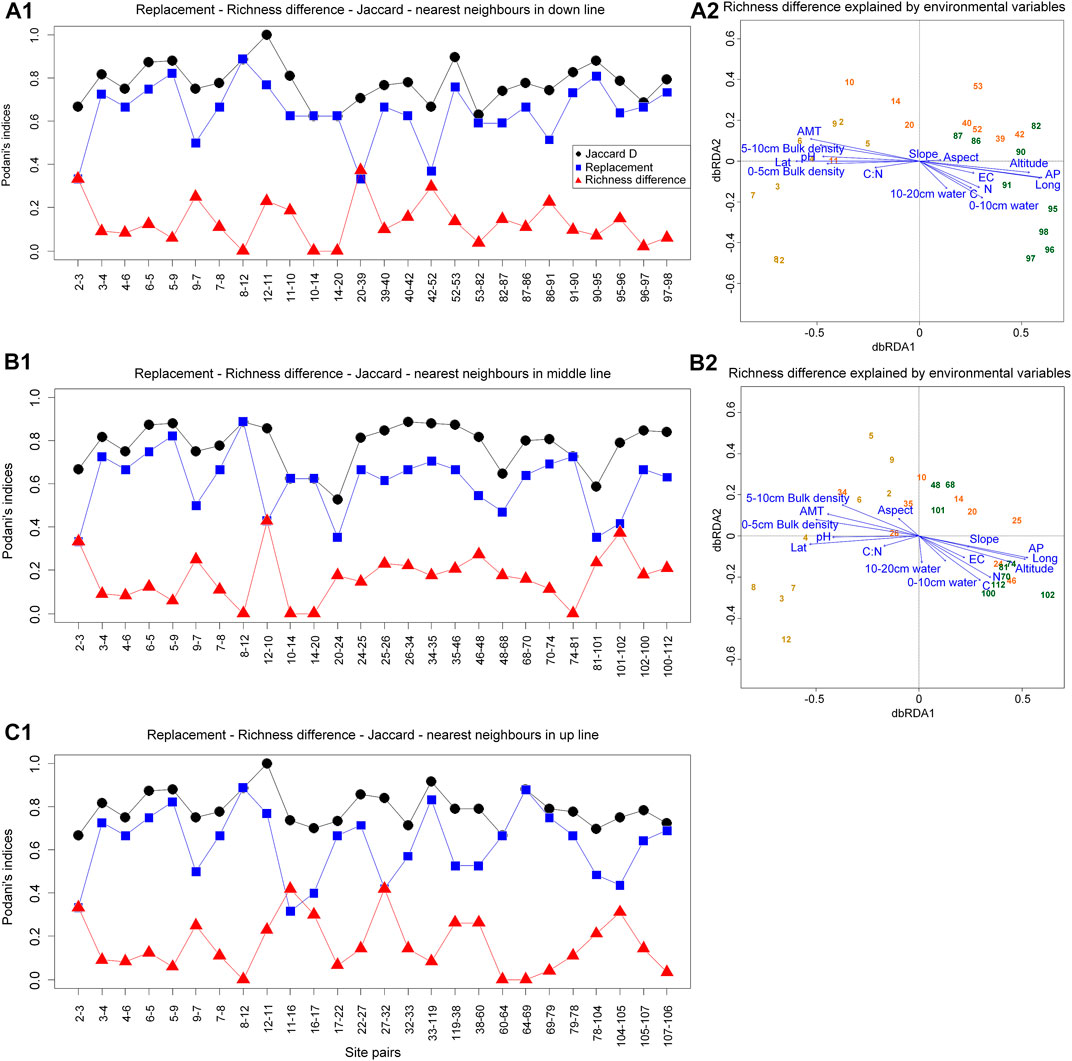
FIGURE 5. The reasons for differences among communities based on three restoration transects. C, total carbon; N, total nitrogen; EC, electrical conductivity; AP, annual precipitation; AMT, annual mean temperature; Lat, latitude; Long, longitude. The site numbers correspond to the numbers of the sampling points in Figure 1.
3.2 Species diversity in different restoration stages
Species richness increased significantly from early to late stage. Compared with the early period, the Shannon index, Simpson index, and Pielou’ evenness index in the middle and late periods all increased significantly, while β decreased, and there was no significant difference in the above indices between the two periods (Figure 6). Overall, latitude and AMT were all significantly negatively correlated with Richness, Shannon, Pielou’s evenness, and Simpson index (Supplementary Figure SA3). Grassland type (i.e., different restoration stages) decided the change of beta diversity (Supplementary Figure SA3). Similarly, drivers of species diversity have changed accordingly. Longitude and altitude were negatively correlated with Pielou’s evenness at early stage (Figure 7A). Longitude and altitude still had the same effect in mid and late periods, respectively (Figure 7B, C). AP were negatively correlated with Richness (Figure 7C).
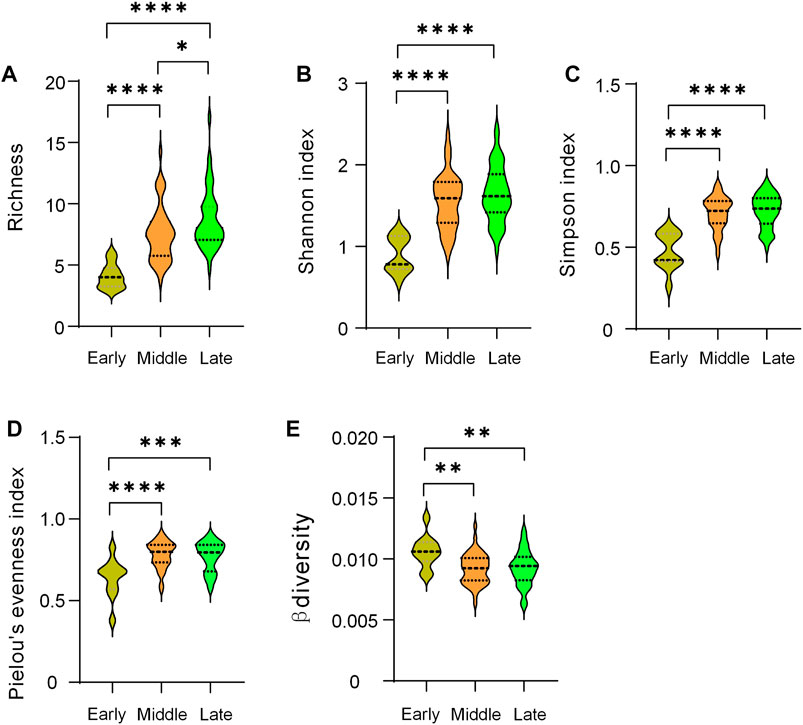
FIGURE 6. Comparison of biodiversity indices at different restoration stages. *, p < 0.05; **, p < 0.01; ***, p < 0.001; ****, p < 0.0001.
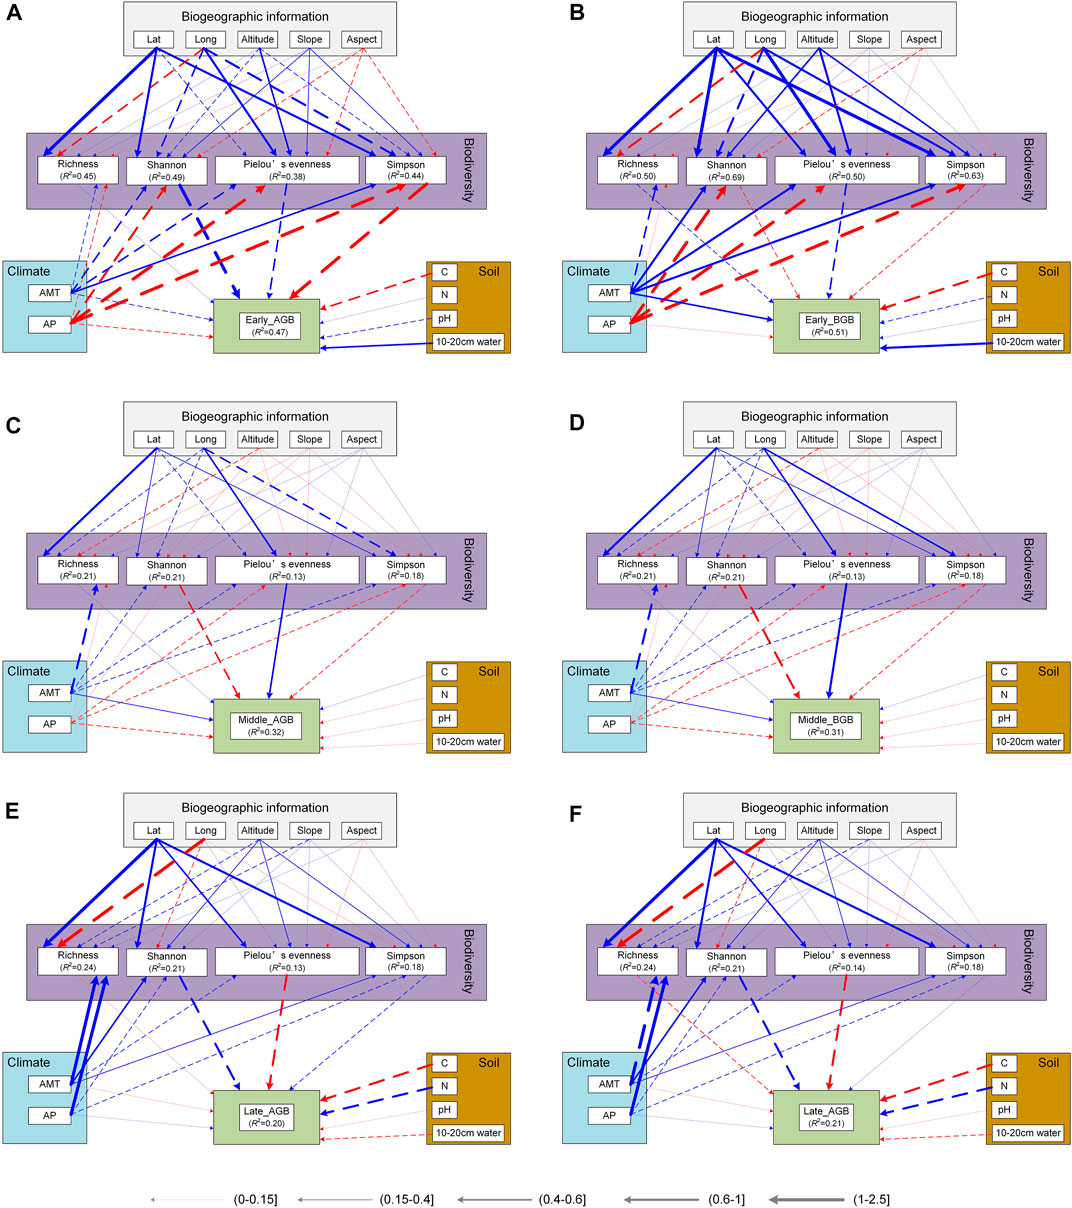
FIGURE 7. Structural Equation Modeling of driving factors of biomass in different restoration stages. The solid and dashed lines represent significant and insignificant relationships, respectively. Red and blue represent positive and negative effects, respectively. Line width is related to correlation. C, total carbon; N, total nitrogen; AP, annual precipitation; AMT, annual mean temperature; Lat, latitude; Long, longitude.
3.3 Productivity-biodiversity relationships in different restoration stages
Above-ground biomass increased significantly as the restoration succession proceeded, while below-ground biomass was significantly lower in the middle of the succession than in other periods (Figure 8). The environmental impact on biomass and the relationship between diversity and biomass, differed in different restoration stages. For aboveground biomass (AGB), 10–20 cm water content was significantly negative effect at early and middle stage of restoration (Figure 8A). AMT was negatively related to AGB at the middle stage (Figure 8C). For belowground biomass (BGB), AMT also had significantly negative impact at early and middle stage of restoration (Figures 8B, D). Longitude was indirectly and significantly positively correlated with AGB and BGB through its negative effect on the Pielou’ evenness index at middle stage (Figure 8C, D). Drivers of AGB and BGB biomass were not synchronized at different recovery stages (Figure 8A), but the effect of plant diversity was similar (Figure 9; Supplementary Table SA1). With the restoration of vegetation, the effects of species richness, Pielou’s evenness, and beta diversity gradually developed towards positive effects and kept increasing, while Simpson index showed the opposite effect.
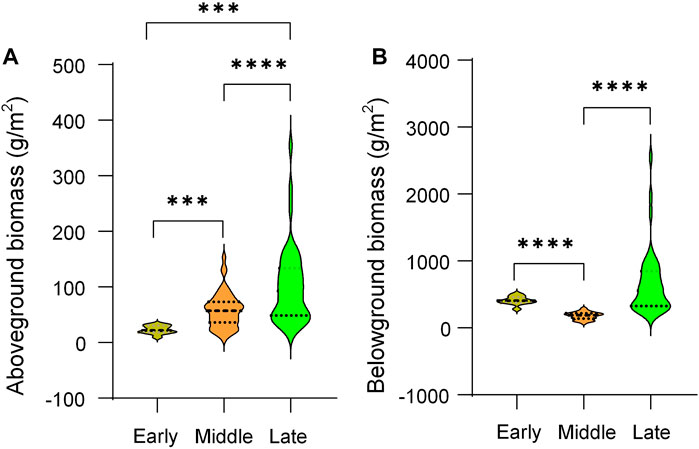
FIGURE 8. Comparison of aboveground and belowground biomass at different restoration stages. ***, p < 0.001; ****, p < 0.0001.
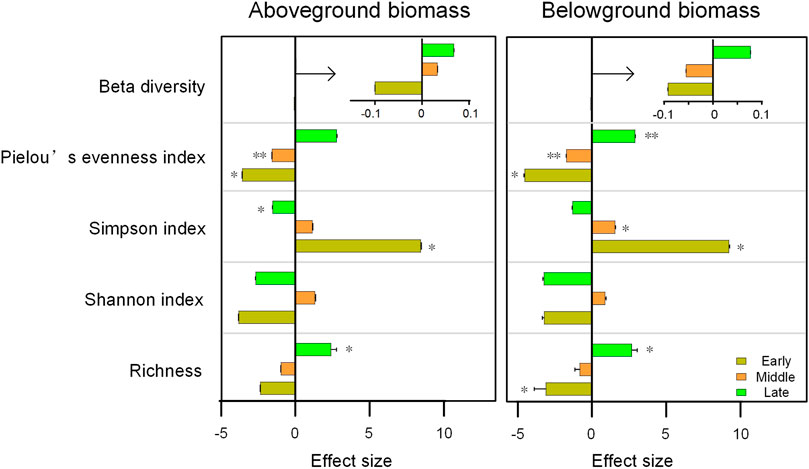
FIGURE 9. Comparison of the effects of plant diversity on aboveground and belowground biomass at different restoration stages. *, p < 0.05; **, p < 0.01.
4 Discussion
4.1 Species composition in different restoration stages
Differences in species composition at different restoration stages existed, but vegetation restoration was feasible from the perspective of community succession. As a special ecosystem similar to tropical savanna, Otindag Sandy Land formed the top succession vegetation of temperate savanna 8,800–6,270 years ago (Niu, 2018). Now, climate change and disturbances from human activities have resulted in varying degrees of degradation in the area (Liu and Wang, 2007; Liu et al., 2008). This study explored the composition and changes of community species from the perspective of succession to help the effective restoration of vegetation in the area. As the succession progresses, the characteristics of the species change significantly (Figure 2B, C), which further reflects the adaptation of the species to the local environment, such as drought, high and low temperature (VanWallendael et al., 2019). It should be noted here that the three restoration stages we selected were based on three typical vegetation types distributed in different places on a large scale. A high proportion of xerophytes appeared in the western part of Otindag Sand Land with less rainfall (desert grassland). Compared with C3 plants, the unique response strategies of C4 plants to high light, high temperature, and low moisture contribute to their survival under drought conditions (Zhou et al., 2018). In the middle and late stages of vegetation restoration, except for xerophytes, the proportion of plants with different characteristics increased, which not only reflected the high heterogeneity of the environment in the Otindag Sandy Land (Li et al., 2011), but also reflected the gradual succession of the community (Chang and Turner 2019). Therefore, we need to fully consider the community structure and select appropriate species according to the restoration stage of the grassland to improve the effect of ecological engineering.
Differences in community species composition during temperate savanna recovery are caused by differences in richness. Specifically, in the early and middle periods of restoration, the differences in community composition were mainly due to species replacement, while in the later period were differences in richness, which reflected that the environmental and spatial characteristics of metacommunities affected their species distribution patterns at least to a certain extent (Cottenie, 2005). For example, EC and AP explained the richness difference between 12–4 and 120–1 (Figure 4A1-A2). And similar pH was the reason for species replacement between 14 and 20 (Figure 4B1-B2). Also, similar altitude could explain the species replacement process of community between 74 and 81 (Figure 4B1-B2). We found only community of up line did not differ in species richness (Figure 5), which was consistent with the negative relationship between latitude and richness (Gillman et al., 2015). In addition, we found that the construction of plant communities in Otindag Sandy Land is dominated by niche processes, which further improves our understanding of ecological restoration design. In other words, based on the restoration stage of the grassland, we should choose to replace or increase species from the perspective of ecological niche.
4.2 Species diversity in different restoration stages
Changes in intercommunity diversity patterns during plant community succession were the result of choices of life history strategies in different environmental contexts (Denslow, 1980), especially the succession stages we chose based on different vegetation types. Unlike the hump-type diversity pattern that occurs during the succession of abandoned land (Sun et al., 2017), and arid and semi-arid forests (Geng et al., 2022), but similar to the succession of secondary forests (Wang et al., 2010), we found that species richness increased significantly with the succession of temperate savanna, which further reflected the importance of species richness differences in community succession (Figure 5). We found there were not significant difference in other diversity indices (Shannon, Simpson, Pielou’s evenness, and β diversity) between middle and late stage, which meant they peaked during the transition period. Although similar changes occurred in the abandoned land study (Gutko et al., 2001), Zhang et al. found a slight decrease in evenness (Zhang et al., 2000), while Wang et al. found it increased significantly during forest restoration on the Loess Plateau (Wang et al., 2022). These differences may be due to different environmental contexts and vegetation types. Furthermore, these results may also arise from our relatively coarse classification based on landscape scales. The result might be clearer if we add another mid-late stage (such as typical grassland or shrub meadow) as a transition between the mid- and late stages. Moreover, as an important part of the temperate savanna, the shrub taxa need further research on the role it plays in maintaining the community structure and function. The invasion of shrubs to grasslands may alter species interactions and community stability, thereby affecting biodiversity (Báez and Collins, 2008).
The latitudinal pattern of species richness, that is, low latitudes have high species richness, is a common phenomenon (Willig et al., 2003; Gillman et al., 2015), which was consistent with the results of this study (Figure 7A1). At the same time, we found that a significant negative correlation between precipitation and richness appeared in the late succession, which was inconsistent with the experimental precipitation results (Korell et al., 2021). Here, we need consider the special ecosystem, especially based on the interaction of trees, shrubs and grasses, the precipitation use efficiency of the temperate savanna system was twice that of the grassland (Jiang, 2011). Namely, understanding precipitation effects at different stages of restoration requires full consideration of community structure.
4.3 Productivity-biodiversity relationships in different restoration stages
The relationship between diversity and above- or below-ground biomass differed at different stages, but its effects on above- and below-ground biomass were similar (Figure 9). Overall, the positive effects of species richness and biomass were gradually enhanced, which may be related to the diversity of resources in different environmental backgrounds (Wang et al., 2022). And the effect was obvious under the conditions of abundant resources, which is a relatively common phenomenon (Tilman et al., 1996; Li et al., 2018; Dyola et al., 2022). Structural equation model showed that the correlation between the two was small (Figure 7), which may be due to the fact that there were more creeping low-biomass species in the quadrats, such as Potentilla acaulis L, Euphorbia thymifolia L, etc. The effects of Pielou’s evenness and Simpson index on aboveground and belowground biomass, respectively, were all inconsistent (Supplementary Figure SA3), which required further exploration of their status at different recovery stages. In addition, we only took 0–20 cm soil layer soil to measure belowground biomass, which may underestimate the contribution of deep-rooted woody plants such as shrubs to belowground biomass, even though the sampling was done in herbaceous quadrats. In the process of vegetation restoration, the role of dominant species was gradually decreasing, which need to be combined with changes in the intensity of grazing (Sanaei et al., 2021). Meanwhile, community biomass was more dependent on the increase of species evenness (Figure 9), which was consistent with the changes of environmental background (Fridley, 2001). For example, xerophytes were still dominant in the first two stages, while various types of plant species were relatively uniform in the later stage of recovery (Figure 2). This result reflected that the community had enough ecological niches to allow the coexistence of various species, which further proved that the community construction in this area was dominated by the ecological niche process (value >0). In addition to the direct effect of the environment on the biomass (Supplementary Table SA2), it can also be realized through the indirect effect on the diversity (Figure 7C, D). Therefore, in a system that considers ecological restoration and grazing simultaneously, it is necessary to further consider the coupling effect of environmental factors to promote the restoration of the system and maintain its sustainable development (Yachi and Loreau, 1999; Liu et al., 2015; Rahmanian et al., 2020; Xiang et al., 2021; Shao et al., 2022).
5 Conclusion
This study explored changes in plant species composition, diversity, and diversity-productivity relationships during temperate savanna restoration at the landscape scale. We found that the plant community construction in this area was mainly a niche process, which to some extent explained the species replacement and richness differences among communities in each restoration stage. The changes in plant characteristics at each recovery stage also confirmed the changes in plant diversity patterns, and further provided a possible basis for the changes in the diversity-productivity relationship. This study suggested that grassland ecological function and production function should be considered in the restoration strategy of temperate savanna, and the vegetation status and grassland use intensity and mode in each region should be fully investigated to promote effective vegetation restoration.
Data availability statement
The raw data supporting the conclusion of this article will be made available by the authors, without undue reservation.
Author contributions
PD, JW, and KW contributed to conception and design of the study. PD, JW, ZM, JH, and QG conducted field surveys and data collection. PD and KW performed the statistical analysis. PD wrote the first draft of the manuscript. All authors contributed to manuscript revision, read, and approved the submitted version.
Funding
This study is funded by the National Natural Science Foundation of China (42101355), the Outstanding Talents Program of China Agricultural University, and the Key Research and Development Projects of Ningxia Province, China (2022CMG03050).
Acknowledgments
We thank Lili Hou and Dr. Dunmei Lin for their field survey suggestions, Lina He for her language revisional suggestions, as well as Ting Wang for assistance with the experiments.
Conflict of interest
The authors declare that the research was conducted in the absence of any commercial or financial relationships that could be construed as a potential conflict of interest.
Publisher’s note
All claims expressed in this article are solely those of the authors and do not necessarily represent those of their affiliated organizations, or those of the publisher, the editors and the reviewers. Any product that may be evaluated in this article, or claim that may be made by its manufacturer, is not guaranteed or endorsed by the publisher.
Supplementary material
The Supplementary Material for this article can be found online at: https://www.frontiersin.org/articles/10.3389/fenvs.2023.1112779/full#supplementary-material
References
Báez, S., and Collins, S. (2008). Shrub invasion decreases diversity and alters community stability in northern Chihuahuan desert plant communities. PLOS ONE 3 (6), e2332. doi:10.1371/journal.pone.0002332
Bardgett, R., Bullock, J., Lavorel, S., Manning, P., Schaffner, U., Ostle, N., et al. (2021). Combatting global grassland degradation. Nat. Rev. Earth Environ. 2 (10), 720–735. doi:10.1038/s43017-021-00207-2
Barrufol, M., Schmid, B., Bruelheide, H., Chi, X., Hector, A., Ma, K., et al. (2013). Biodiversity promotes tree growth during succession in subtropical forest. Plos One 8 (11), e81246. doi:10.1371/journal.pone.0081246
Bengtsson, J., Bullock, J., Egoh, B., Everson, C., Everson, T., O'Connor, T., et al. (2019). Grasslands-more important for ecosystem services than you might think. Ecosphere 10 (2), e02582. doi:10.1002/ecs2.2582
Bo, X., Zhao, L., Zheng, L., Tan, L., Zheng, F., and Like, A. (2022). Review of the impact of grassland degradation on ecosystem service value. Open J. Appl. Sci. 12, 1083–1097. doi:10.4236/ojapps.2022.127074
Bond, W., and Midgley, G. (2012). Carbon dioxide and the uneasy interactions of trees and savannah grasses. Philosophical Trans. R. Soc. B-Biological Sci. 367 (1588), 601–612. doi:10.1098/rstb.2011.0182
Carbutt, C., and Kirkman, K. (2022). Ecological grassland restoration—a South African perspective. Land 11 (575), 575. doi:10.3390/land11040575
Chandrasekaran, M., Kim, K., Krishnamoorthy, R., Walitang, D., Sundaram, S., Joe, M., et al. (2016). Mycorrhizal symbiotic efficiency on C3 and C4 plants under salinity stress – A meta-analysis. Front. Microbiol. 7, 1246. doi:10.3389/fmicb.2016.01246
Chang, C., and Turner, B. (2019). Ecological succession in a changing world. J. Ecol. 107 (2), 503–509. doi:10.1111/1365-2745.13132
Cong, W., Li, X., Pan, X., Liu, X., Lu, Q., and Wang, F. (2022). A new scientific framework of dryland ecological quality assessment based on 1OAO principle. Ecol. Indic. 136, 108595. doi:10.1016/j.ecolind.2022.108595
Cottenie, K. (2005). Integrating environmental and spatial processes in ecological community dynamics. Ecol. Lett. 8 (11), 1175–1182. doi:10.1111/j.1461-0248.2005.00820.x
Denslow, J. (1980). Patterns of plant-species diversity during succession under different disturbance regimes. Oecologia 46 (1), 18–21. doi:10.1007/bf00346960
Ding, W., Jimoh, S., Hou, X., Shu, X., Dong, H., Bolormaa, D., et al. (2022). Grassland ecological subsidy policy and livestock reduction behavior: A case study of herdsmen in northern China. Rangel. Ecol. Manag. 81 (1), 78–85. doi:10.1016/j.rama.2022.01.002
Dyola, N., Sigdel, S., Liang, E., Babst, F., Camarero, J., Aryal, S., et al. (2022). Species richness is a strong driver of forest biomass along broad bioclimatic gradients in the Himalayas. Ecosphere 13 (6). doi:10.1002/ecs2.4107
Fridley, J. (2001). The influence of species diversity on ecosystem productivity: How, where, and why? Oikos 93 (3), 514–526. doi:10.1034/j.1600-0706.2001.930318.x
Geng, Q., Muhammad, A., Yuan, Z., Zheng, J., He, X., Ding, D., et al. (2022). Plant species composition and diversity along successional gradients in arid and semi-arid regions of China. For. Ecol. Manag. 524, 120542. doi:10.1016/j.foreco.2022.120542
Gillman, L., Wright, S., Cusens, J., McBride, P., Malhi, Y., and Whittaker, R. (2015). Latitude, productivity and species richness. Glob. Ecol. Biogeogr. 24 (1), 107–117. doi:10.1111/geb.12245
Guo, Q. (2007). The diversity–biomass–productivity relationships in grassland management and restoration. Basic Appl. Ecol. 8 (3), 199–208. doi:10.1016/j.baae.2006.02.005
Guo, X., Zhou, H., Dai, L., Li, J., Zhang, F., Li, Y., et al. (2021). Restoration of degraded grassland significantly improves water storage in alpine grasslands in the Qinghai-Tibet Plateau. Front. Plant Sci. 12, 778656. doi:10.3389/fpls.2021.778656
Gutko, Z., Brumelis, G., Liepins, I., Nikodemus, O., and Tabors, G. (2001). Plant species richness, and Shannon diversity and evenness during secondary succession on abandoned agricultural land in Latvia. Proc. Latv. Acad. Sci. Sect. B, Nat. Exact Appl. Sci. 55 (1), 36–42.
He, D., Deng, X., Jin, G., Wang, X., Zhang, Y., Sun, Z., et al. (2022). Ecological efficiency of grass-based livestock husbandry under the background of rural revitalization: An empirical study of Agro-Pastoral ecotone. Front. Environ. Sci. 10. doi:10.3389/fenvs.2022.848134
Hu, Z., Zhao, Z., Zhang, Y., Jing, H., Gao, S., and Fang, J. (2019). Does ‘Forage-Livestock Balance’ policy impact ecological efficiency of grasslands in China? J. Clean. Prod. 207, 343–349. doi:10.1016/j.jclepro.2018.09.158
Jiang, G. (2011). Vegetation biomass and net primary production of sparse forest grassland in Hunshandake Sandland. Sci. Techonology Rev. 29 (25), 30–37. doi:10.3724/SP.J.1011.2011.00110
Jiang, K., Tan, Z., He, Q., Wang, L., Zhao, Y., Sun, X., et al. (2020). Strong positively diversity-productivity relationships in the natural sub-alpine meadow communities across time are up to superior performers. Sci. Rep. 10 (1), 13353. doi:10.1038/s41598-020-70402-6
Korell, L., Auge, H., Chase, J., Harpole, W., and Knight, T. (2021). Responses of plant diversity to precipitation change are strongest at local spatial scales and in drylands. Nat. Commun. 12 (1), 2489. doi:10.1038/s41467-021-22766-0
Li, G., Li, Y., Liu, M., and Jiang, G. (2011). Vegetation biomass and net primary production of sparse forest grassland in hunshandake Sandland. Sci. Technol. Rev. 29 (25), 30–37. doi:10.3724/SP.J.1011.2011.00110
Li, S., Su, J., Lang, X., Liu, W., and Ou, G. (2018). Positive relationship between species richness and aboveground biomass across forest strata in a primary Pinus kesiya forest. Sci. Rep. 8 (1), 2227. doi:10.1038/s41598-018-20165-y
Liu, H., Zhou, C., Cheng, W., Long, E., and Li, R. (2008). Monitoring sandy desertification of Otindag Sandy Land based on multi-date remote sensing images. Acta Ecol. Sin. 28 (2), 627–635. doi:10.1016/S1872-2032(08)60029-3
Liu, J., Feng, C., Wang, D., Wang, L., Wilsey, B., and Zhong, Z. (2015). Impacts of grazing by different large herbivores in grassland depend on plant species diversity. J. Appl. Ecol. 52 (4), 1053–1062. doi:10.1111/1365-2664.12456
Liu, M., Dries, L., Huang, J., Min, S., and Tang, J. (2019). The impacts of the eco-environmental policy on grassland degradation and livestock production in Inner Mongolia, China: An empirical analysis based on the simultaneous equation model. Land Use Policy 88, 104167. doi:10.1016/j.landusepol.2019.104167
Liu, S., and Wang, T. (2007). Aeolian desertification from the mid-1970s to 2005 in Otindag sandy land, northern China. Environ. Geol. 51 (6), 1057–1064. doi:10.1007/s00254-006-0375-1
Liu, X., and Wang, R. (2006). Photosynthetic pathway and morphological functional types in the vegetation from North-Beijing agro-pastoral ecotone, China. Photosynthetica 44, 365–386. doi:10.1007/s11099-006-0038-1
Lyu, X., Li, X., Dang, D., Dou, H., Wang, K., Gong, J., et al. (2022). A perspective on the impact of grassland degradation on ecosystem services for the purpose of sustainable management. Remote Sens. 14 (20), 5120. doi:10.3390/rs14205120
McCarron, J., and Knapp, A. (2001). C3 woody plant expansion in a C4 grassland: Are grasses and shrubs functionally distinct? Am. J. Bot. 88 (10), 1818–1823. doi:10.2307/3558358
Mu, Z., Liu, G., Gui, R., Su, H., Li, H., Liu, L., et al. (2020). Dynamic changes of plant community structure at different recovery stages of aerial-seeding region in Otindag Sandy Land. J. Huazhong Agric. Univ. 39 (4), 46–56. doi:10.13300/j.cnki.hnlkxb.2020.04.007
Nerlekar, A., and Veldman, J. (2020). High plant diversity and slow assembly of old-growth grasslands. Proc. Natl. Acad. Sci. U. S. A. 117 (31), 18550–18556. doi:10.1073/pnas.1922266117
Niu, Z. (2018). Vegetation and climate changes during the holocene reflected by lacustrine records in chagan nur Otindag sandy land. Hohhot: Inner Mongolia University.
Oksanen, J., Blanchet, F., Friendly, M., Kindt, R., Legendre, P., and McGlinn, D. (2015). Vegan: Community Ecology package. R. Package Version 2 2-1 2, 1–2.
Rahmanian, S., Hejda, M., Ejtehadi, H., Farzam, M., Pysek, P., and Memariani, F. (2020). Effects of livestock grazing on plant species diversity vary along a climatic gradient in northeastern Iran. Appl. Veg. Sci. 23 (4), 551–561. doi:10.1111/avsc.12512
Sanaei, A., Sayer, E., Saiz, H., Yuan, Z., and Ali, A. (2021). Species co-occurrence shapes spatial variability in plant diversity-biomass relationships in natural rangelands under different grazing intensities. Land Degrad. Dev. 32 (15), 4390–4401. doi:10.1002/ldr.4044
Shao, J., Zhou, X., Groenigen, K., Zhou, G., Zhou, H., Zhou, L., et al. (2022). Warming effects on grassland productivity depend on plant diversity. Glob. Ecol. Biogeogr. 31 (3), 588–598. doi:10.1111/geb.13441
Sluis, W. (2002). Patterns of species richness and composition in re-created grassland. Restor. Ecol. 10 (4), 677–684. doi:10.1046/j.1526-100X.2002.01048.x
Sun, C., Chai, Z., Liu, G., and Xue, S. (2017). Changes in species diversity patterns and spatial heterogeneity during the secondary succession of grassland vegetation on the Loess Plateau, China. Front. Plant Sci. 8, 1465. doi:10.3389/fpls.2017.01465
Taylor, A., Gao, B., and Chen, H. (2020). The effect of species diversity on tree growth varies during forest succession in the boreal forest of central Canada. For. Ecol. Manag. 455, 117641. doi:10.1016/j.foreco.2019.117641
Tian, H., and Liu, G. (2015). Changes of plant diversity after aerial seeding in hunshandake sandy land-A case study in zhenglan banner of inner Mongolia. Bull. Soil Water Conservation 35 (2), 269–273. doi:10.13961/j.cnki.stbctb.2015.02.051
Tilman, D., Wedin, D., and Knops, J. (1996). Productivity and sustainability influenced by biodiversity in grassland ecosystems. Nature 379 (6567), 718–720. doi:10.1038/379718a0
VanWallendael, A., Soltani, A., Emery, N., Peixoto, M., Olsen, J., and Lowry, D. (2019). A molecular view of plant local adaptation: Incorporating stress-response networks, Annu. Rev. Plant Biol., 70, 559–583. doi:10.1146/annurev-arplant-050718-100114
Wang, K., Shao, R., and Shangguan, Z. (2010). Changes in species richness and community productivity during succession on the loess plateau (China). Pol. J. Ecol. 58 (3), 501–510. doi:10.1016/j.polar.2009.11.001
Wang, M., Lu, N., An, N., and Fu, B. (2022). Plant functional and phylogenetic diversity regulate ecosystem multifunctionality in semi-arid grassland during succession. Front. Environ. Sci. 9. doi:10.3389/fenvs.2021.791801
Wang, R. (2005). C3 and C4 photosynthetic pathways and life form types for native species from agro-forestry region, Northeastern China. Photosynthetica 43, 535–549. doi:10.1007/s11099-005-0086-y
Wang, R. (2003). Photosynthetic pathway and morphological functional types in the steppe vegetation from Inner Mongolia, North China. Photosynthetica 41, 143–150. doi:10.1023/A:1025837202277
Wang, Y., Du, J., Pang, Z., Liu, Y., Xue, K., Hautier, Y., et al. (2022). Unimodal productivity-biodiversity relationship along the gradient of multidimensional resources across Chinese grasslands. Natl. Sci. Rev. 9, nwac165. doi:10.1093/nsr/nwac165
Willig, M., Kaufman, D., and Stevens, R. (2003). Latitudinal gradients of biodiversity: Pattern, process, scale, and synthesis. Annu. Rev. Ecol. Evol. Syst. 34, 273–309. doi:10.1146/annurev.ecolsys.34.012103.144032
Wu, J., Ding, X., Li, C., Gao, Z., and Zhong, B. (2019). The monitoring and dynamic analysis for Otindag sandy land based on object-oriented method. 2019 10th international workshop on the analysis of multitemporal remote sensing images. MultiTemp, 1–4. doi:10.1109/Multi-Temp.2019.8866844
Xiang, M., Wu, J., Wu, J., Guo, Y., Lha, D., Pan, Y., et al. (2021). Heavy grazing altered the biodiversity-productivity relationship of alpine grasslands in Lhasa River Valley, Tibet. Front. Ecol. Evol. 9, 698707. doi:10.3389/fevo.2021.698707
Xue, C., Gao, Z., Sun, B., Li, C., Wang, Y., and Zhang, Y. (2018). Research on high resolution remote sensing recognition method of elm sparse forest in Otindag sandy land. Remote Sens. Land Resour. 30 (4), 74–81. doi:10.6046/gtzyyg.2018.04.12
Yachi, S., and Loreau, M. (1999). Biodiversity and ecosystem productivity in a fluctuating environment: The insurance hypothesis. Proc. Natl. Acad. Sci. U. S. A. 96 (4), 1463–1468. doi:10.1073/pnas.96.4.1463
Yan, H., Xue, Z., and Niu, Z. (2021). Ecological restoration policy should pay more attention to the high productivity grasslands. Ecol. Indic. 129, 107938. doi:10.1016/j.ecolind.2021.107938
Yang, X., Xu, B., Jin, Y., Qin, Z., Ma, H., Li, J., et al. (2015). Remote sensing monitoring of grassland vegetation growth in the Beijing-Tianjin sandstorm source project area from 2000 to 2010. Ecol. Indic. 51, 244–251. doi:10.1016/j.ecolind.2014.04.044
Yang, Z., Wen, C., Yang, L., Li, Z., Wei, W., and Zhang, Q. (2020). Effects of different restoration methods on ecosystem multifunctionality in the semi-arid loess small watershed. Acta Ecol. Sin. 40 (23), 8606–8617. doi:10.5846/stxb202002010187
Yu, S., and Chen, H. (2007). Characteristics and formation causes of temperate sparse forest grassland ecosystem in Inner Mongolia Plateau. Chin. J. Ecol. 26 (04), 549–554. doi:10.1371/journal.pone.0002332
Zhang, G., Yan, J., Zhu, X., Ling, H., and Xu, H. (2019). Spatio-temporal variation in grassland degradation and its main drivers, based on biomass: Case study in the Altay Prefecture, China. Glob. Ecol. Conservation 20, e00723. doi:10.1016/j.gecco.2019.e00723
Zhang, J., Yang, Q., Chen, T., and Chai, B. (2000). Changes in species diversity in the succession of plant communities of abandoned land in Luliang Mountain, Western Shanxi. Biodivers. Sci. 08 (4), 378–384. doi:10.17520/biods.2000053
Keywords: otindag sandy land, species richness, grassland restoration, species replacement, vegetation succession
Citation: Dou P, Miao Z, Wang J, Huang J, Gao Q, Wang K and Wang K (2023) The key to temperate savanna restoration is to increase plant species richness reasonably. Front. Environ. Sci. 11:1112779. doi: 10.3389/fenvs.2023.1112779
Received: 30 November 2022; Accepted: 04 January 2023;
Published: 13 January 2023.
Edited by:
Wang Junfeng, Northeast Normal University, ChinaReviewed by:
Xiaojing Qin, Henan Polytechnic University, ChinaYanming Gong, Xinjiang Institute of Ecology and Geography (CAS), China
Copyright © 2023 Dou, Miao, Wang, Huang, Gao, Wang and Wang. This is an open-access article distributed under the terms of the Creative Commons Attribution License (CC BY). The use, distribution or reproduction in other forums is permitted, provided the original author(s) and the copyright owner(s) are credited and that the original publication in this journal is cited, in accordance with accepted academic practice. No use, distribution or reproduction is permitted which does not comply with these terms.
*Correspondence: Kun Wang, d2FuZ2t1bkBjYXUuZWR1LmNu; Jie Wang, amlld2FuZzE3OEBjYXUuZWR1LmNu