 Rose Boahemaa Pinto1*
 Tom Barendse1
 Tim van Emmerik1
 Martine van der Ploeg1
 Frank Ohene Annor2,3Kwame Duah3Job Udo4Remko Uijlenhoet1,2
- 1Hydrology and Quantitative Water Management Group, Wageningen University and Research, Wageningen, Netherlands
- 2Department of Water Management, Faculty of Civil Engineering & Geosciences, Delft University of Technology, Delft, Netherlands
- 3Trans-African Hydro-Meteorological Observatory (TAHMO), Accra, Ghana
- 4HKV, Lijn in Water BV, Lelystad, Netherlands
Plastic pollution in rivers threatens ecosystems, increases flood risk due to its accumulations at hydraulic structures and its final emissions into the ocean threaten aquatic life, especially and probably most in coastal urbanized areas. Previous work suggests that plastic pollution in these urban rivers is influenced by hydrometeorological and anthropogenic factors. However, the transport dynamics of the plastics in such rivers are non-linear and complex and remain largely unresolved. Here, we show that tidal dynamics can be the main driver of plastic transport closest to the river mouth. Outside the tidal zone, rainfall and river discharge were identified to be more important drivers. We monitored plastic transport in the Odaw river, Ghana during the dry season. The Odaw drains the densely populated city of Accra and discharges into the Gulf of Guinea. Data were collected between March and May 2021 (dry season), using visual counting at four bridges along the river, of which two were located within the tidal zone. We explored the correlations between river plastic transport, and rainfall, tidal dynamics, and river discharge. Finally, we estimated the total plastic mass transport by using item-to-mass conversion data from previously published literature. We observed a peak in plastic transport at the upstream bridge within the tidal zone after an increase in rainfall (7.3 times larger). We found a gradient of the hydrometeorological factors driving plastic transport. Closer to the river mouth, tidal dynamics were more strongly correlated with plastic transport than upstream. The daily mass transport was estimated to be between 1.4–3.8 × 10² kg/d, which is lower than previous model estimates. These results add to the evidence of inconsistent correlations between plastic transport and hydrometeorological variables. Long-term monitoring data is required to further investigate this. The results also support the hypothesis that tidal dynamics are a crucial factor in controlling the emissions of plastics from rivers into the ocean. The findings provide a baseline for the Odaw river during the dry season and allow for comparison with the wet season. The approach adopted here also serves as a blueprint for similar urban river systems, regionally and globally.
1 Introduction
Plastic debris has become a major challenge in our natural environment invading all ecosystems on earth. It has been detected in terrestrial, fluvial, and coastal environments (Borelle et al., 2020). Recent global estimates indicate that between 0.8 and 2.7 million metric tons of riverine plastics are emitted into the oceans yearly with small urban rivers polluting the most (Meijer et al., 2021). Plastic transport in the riverine environment is an important process to understand since it connects most of the land-based sources of plastics to the marine environment (van Emmerik and Schwarz, 2020). The source of these plastics in rivers is mainly impacted by anthropogenic activities (Lebreton et al., 2017; Schmidt et al., 2017). However, the amount of such plastic transport in rivers depends on the interaction of multiple drivers, acting on different spatial and temporal scales (Haberstroh et al., 2021a; Haberstroh et al., 2021b; van Emmerik et al., 2022).
Mobilization of macroplastics in the riverine environments is mainly influenced by natural processes connected to meteorological conditions (strong winds, rain, floods) and anthropogenic processes (population density and urbanization) which are known to drive temporal and spatial variations of plastic transport in a river system (Haberstroh et al., 2021a). Some recent observational studies have demonstrated the relative importance of these factors (storms, heavy rainfall events) (Duncan et al., 2020; Schirinzi et al., 2020; Roebroek et al., 2021) on the transport patterns of plastics in urban water systems. An example is the study by Castro-Jiménez et al. (2019) which demonstrated that increased quantities of plastic load were associated with a heavy rainfall event, since the accumulated litter in the water system was flushed by that event within a very short time-period. This showed that high discharges preceded by heavy precipitation events have a stronger influence on the transport of plastics than low base flows. Although recent evidence suggests that the variation in plastic transport is controlled by these drivers, the relationship between such variables and plastic transport has been found to be inconsistent within, and among, river systems. Several studies observed a positive trend when correlating discharge to plastic transport (Castro-Jiménez et al., 2019; Wagner et al., 2019), although others have reported an inconsistent relationship between discharge and plastic transport within rivers (Constant et al., 2020; Stanton et al., 2020; Roebroek et al., 2022; van Emmerik et al., 2022). Consequently, the relationships between potential drivers and plastic transport rates are not yet fully understood, so further field monitoring is required to understand these dynamics.
In recent years, the number of field studies focusing on the monitoring of macroplastic transport in river networks has increased (Geraeds et al., 2019; Haberstroh et al., 2021a; Haberstroh et al., 2021b). However, Meijer et al. (2021) show that the most polluting small rivers located in Southeast Asia and West Africa have limited field-based plastic research. Due to the limited number of observational studies in these regions, not much is known yet on the temporal dynamics of plastic transport in these rivers, making global model estimates (Lebreton et al., 2017; Meijer et al., 2021) of their emission into the ocean highly uncertain. This study then focuses on the Odaw river, one of the most polluted coastal urban rivers in Accra, Ghana (Adank et al., 2011). This river is subject to intense environmental pollution due to it being located within a densely populated area characterized by the presence of commercial (trading) and industrial (such as plastic packaging and auto mechanics) activities. Due to the inadequate waste management structure along this river, most sections of the river are used as a garbage dumping receptacle (Larmie, 2019). Most of this litter comprises plastics driven by the rapid growth in single-use plastic consumption (Lau et al., 2020; Dasgupta et al., 2022). Previous model estimates indicate that, annually, 1.3 × 10⁶ kg of macroplastics are exported into the ocean through this river. With no field studies done for this river, not much is known yet on the spatial and temporal dynamics of plastic transport in the river.
This study therefore aims to provide a first quantitative assessment of riverine macroplastic transport as well as exploring the role of meteorological (rainfall) and hydrological (discharge and tides) drivers on plastic transport dynamics in the Odaw river. Focusing monitoring efforts on quantifying the riverine macroplastics in the Odaw and exploring the role of these drivers on plastic transport will provide insights into the factors that influence the spatial and temporal variability of plastic transport in the system, further assisting the modeling of plastic transport for this river. We expect this will assist policymakers in developing sustainable solutions to managing the plastic pollution issue in this river system. Also, since this is the first riverine macroplastic fieldwork carried out in Ghana, the method presented can be used by other researchers and citizen science-led projects in Ghana to monitor floating riverine macroplastics. The research was carried out at four bridge locations located downstream in the Odaw river on eight different days during the dry season (March to May 2021). Plastic litter was monitored using visual observation at these bridges. Rainfall, tide, and discharge were the driving indicators which were explored in relation to plastic transport dynamics in this system. Daily rainfall data obtained from the Trans-African Hydro-Meteorological Observatory (TAHMO), and tidal data obtained online (https://tides4fishing.com/gh/ghana/accra) were used to simulate discharges using a hydrodynamic model. Discharge was simulated since there were no measured data for the Odaw river. Statistical correlation tests were performed to understand the link between these drivers and the plastic transport in the river over the sampling period. With the results presented for this study, we emphasize the need for additional research over an extended temporal and spatial scale to better understand the response of plastic transport to the seasonal wet and dry cycle and the dynamic anthropogenic processes across the river catchment.
2 Methods
To explore the role of hydrometeorological factors in influencing the dynamics of plastic transport in the Odaw river, field monitoring of plastics using visual observation at four bridges along the river was first conducted to show the spatial distribution. To understand the relationship between the transport rate and the corresponding transport factors, rainfall data obtained from TAHMO, tidal data obtained online, and simulated discharges were statistically correlated with plastic transport using Pearson and Spearman rank correlation statistical techniques (Figure 1).
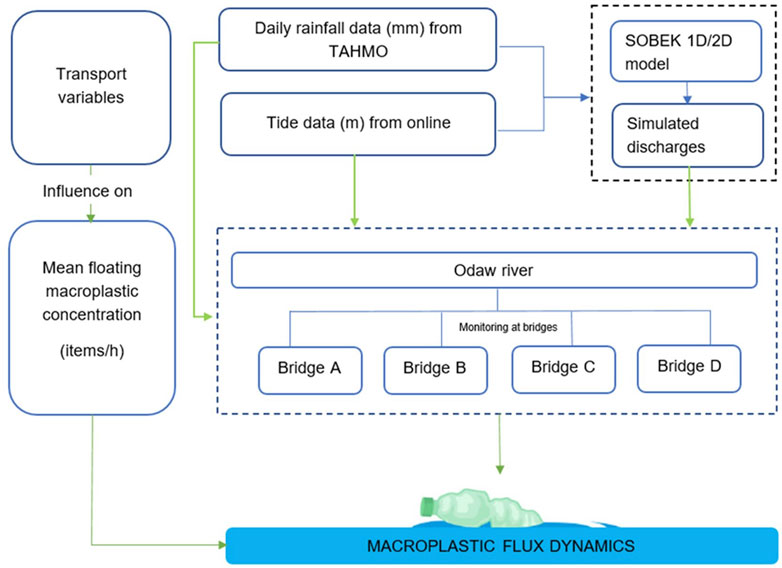
FIGURE 1. Methodological overview of the macroplastic transport dynamics in the Odaw river based on the three transport variables for the study. The data collection mode for each transport variable is shown in the first row. The black dashed box in the first row indicates the model used to simulate the discharges with the daily rainfall and tide as inputs. The arrow from each transport variable indicates the possible role of each transport variable in driving the dynamics of plastic concentration monitored for the Odaw river over the sampling period.
2.1 Study site
The Odaw river has a drainage basin of 270 km2 located in Accra, the coastal capital city of Ghana (Larmie, 2019). The river is approximately 30 km long and runs through the Accra metropolis with an interception weir located 1.32 km away from the river mouth (Resource Centre Network Ghana, 2021). The course of the river is natural but is channelised through some sections of the city to mitigate perennial flooding. The main tributaries of the Odaw are the Nima, Agbobgloshie, and South Kaneshie streams (Larmie, 2019). Hydrological data on discharges of the river are unavailable since the river is not gauged, however, modeled discharges showed a mean discharge of about 60 m3 s-1 (Zsoter et al., 2021). Along some sections of this river, there are slum settlements and commercial centers with a dense population located only a few meters away from the banks where waste is regularly dumped either on the riverbank or into the river itself. Some sections of the river are also badly choked with weeds and eroded sediments from land (Larmie, 2019). For this study, four bridge locations were selected (Figure 2). These locations were chosen because of their proximity to an urban area with a high population density which was assumed to contribute a high load of plastic litter into the river system. The bridge locations, their distance to the river mouth, and the width of each bridge across the river are given in Table 1.
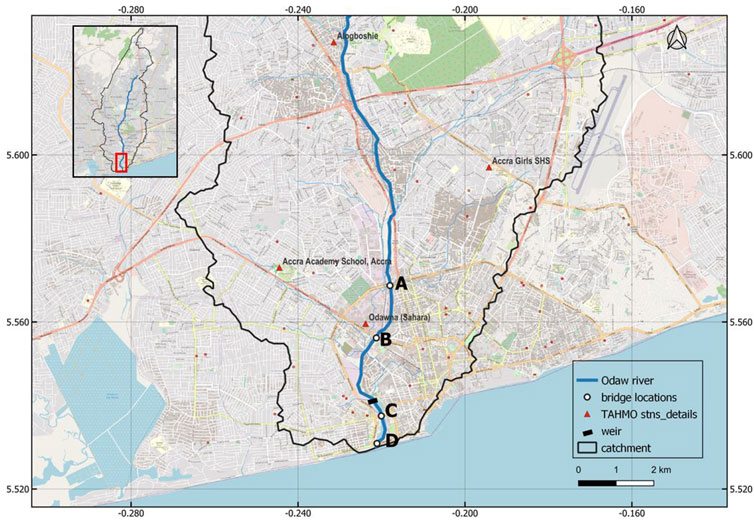
FIGURE 2. Overview of the study area of the Odaw river, the monitored bridges (A–D) used as measurement locations, and the TAHMO rain gauge stations found around the study area. Map source: OpenStreetMap Standard.
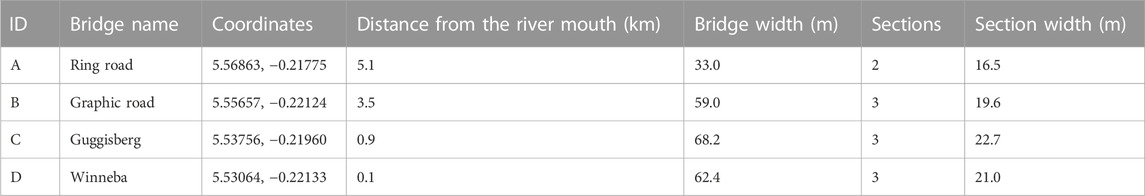
TABLE 1. Details of bridge measurement locations at which visual counting of plastics was performed.
2.2 Floating macroplastics observations
To quantify the floating macroplastic distribution along the Odaw river, visual counting from bridges was conducted. This method, described by González-Fernández and Hanke (2017) and van Emmerik et al. (2018), involved viewing the selected river from bridges. Each bridge was divided into two to three sections (16.5–22.7 m wide) based on the length of the bridge across the river. Floating macroplastics per section on the bridge were visually counted for 2 min. This exact observation was repeated for the remaining sections across the bridge until the complete river width was covered (indicated as a “sweep”). Four sweeps were done at each bridge on each sampling day. This provided a more representative dataset as plastic amounts vary throughout the day. On average, the plastic observations for each bridge with two observers lasted 30 min. To have an unobstructed view of the water surface, visual counting of the plastics was done facing the river upstream. Sampling was done in the dry season over 3 months (March-May) on eight different days between 20 March and 18 May 2021 (i.e., 20 March, 7, 12, 14 April, 13, 14, 17, and 18 May) to provide insight into the temporal variability of macroplastics in the river. To maximise observations within the limited time frame for this study, the selected days were chosen based on the availability of the field workers. The total observations during this study was 312. This ranged between 60 and 90 at each bridge depending on the bridge sections. During the sampling, the direction of the plastic transport was noted. Plastic transport in the downstream direction (ebb tide) was indicated as positive and upstream plastic transport (flood tide) was noted as negative. The total plastic transport,
An error and uncertainty analysis was performed for all observations carried out at each bridge during the sampling period. This was done by calculating the Standard Error (SE) and the Relative Standard Error (RSE) of the floating items per 2 min data collected. The analysis was carried out to show the reliability of the results estimated from the field data collected for this study.
2.3 Daily floating plastic mass estimation
The daily floating plastic mass transport,
2.4 Rainfall and tidal data
For this study, three factors driving the spatial and temporal variability in macroplastic transport within the river were considered: namely rainfall, tide, and discharge. Four TAHMO (van de Giesen et al., 2014) rain gauge stations (Accra Academy, Accra Girls, Alogboshie, and Odawna) were located within the study area. Rainfall data from these stations were accessible through the TAHMO website upon log in (see Supplementary Material for details). Daily rainfall data obtained from 20 March 2021 to 31 May 2021 were obtained from all the TAHMO rain gauges found within the study area. Tide data in height above mean sea level (m) was retrieved for the study area from the tides chart for Accra, Ghana online (Tide times and charts for Accra, 2021) (https://tides4fishing.com/gh/ghana/accra) (see Supplementary Material for the details). A time series of the tides during the sampling period was obtained by interpolating micro-tides of an hourly timestep within the macro-tides data downloaded online.
2.4.1 Hydrodynamic modeling of discharges
Since there was no field discharge data for the river, rainfall and tidal data obtained during the study were used to model discharges using SOBEK (Deltares, 2013). We used hydrodynamic modeling to compute the discharges throughout the river channel related to meteorological information and the watershed parameters. A 1D model of the Odaw river with a 2D grid in SOBEK was supplied by HKV (World Bank, 2017). This modeling software [SOBEK, (Deltares, 2013)] allows the simulation of rainfall-runoff processes for various rainfall events. To be able to simulate discharges in the river for an entire year, the original HKV model had to be adapted by removing the 2D grid to reduce the calculation time. Since the model from HKV was already calibrated, the input parameters for the adapted model were the initial values for discharges (m3/s) at the boundary and cross-section nodes and meteorological input data such as daily rainfall. To determine input discharges for the adapted model (without the 2D grid), the original model with the 2D grid was run eight different times for daily rainfall events that had return periods between 0.5 and 10 years. These were rainfall events between 2016 and 2020. The multiple runs were done to confirm the original model results to be used as input discharges in the adapted model. The adapted 1D model was then run using 2021 rainfall data from all four rainfall stations by averaging the daily rainfall data. Discharges were simulated with a 10-min calculation time step and an hourly output timestep for each rainfall event. To include the role of tides in the model, discharges were simulated using a 6-h time series of fluctuating tides and water levels as input for the downstream input node.
2.4.2 Statistical analysis
To explore the correlation between each transport variable (rainfall, tide, and discharge) and plastic transport, Pearson and Spearman correlations were calculated for each monitoring location. Both correlation tests were calculated to investigate whether the correlation is just linear (Pearson) or monotonic (Spearman). The p-values for each correlation were also computed to test if the correlation coefficients between each of the transport variables and the plastic transport were statistically significant or not. For this study, a p-value less than 0.05 (typically ≤ 0.05) was considered statistically significant (Wasserstein et al., 2019). The median plastic transport at each section of each bridge expressed as items/h was used for this correlation test. The median was selected for this correlation test to minimize the influence of outliers. The Pearson and Spearman rank coefficients are presented as ρp and ρs respectively in the results.
3 Results and discussion
3.1 Plastic transport variation in the Odaw river
Over the sampling period, average plastic transport was highest at bridge B (1041 items/h) (Figure 3). The lowest plastic transport on the other hand was observed at bridge A (402 items/h). Other than the peak transport observed at bridge C (9810 items/h) and D (2670 items/h) after a rainfall event, the average plastic transport observed at these bridges was low during the sampling period (C: 785 items/h; D: 322 items/h). Negative plastic transport was also measured on some sampling days at these bridges (C and D) due to the influence of the tides. Though the monitored locations along the river are within an urban area with similar inadequate waste disposal systems and anthropogenic influences (commercial activities), the high plastic transport at bridge B is due to the presence of the dense slum settlements located less than 2 m away from the river. Since this settlement is unauthorized, most generated waste is dumped directly into the river channel (Ernest et al., 2015) causing the peak in plastic abundance at bridge B.
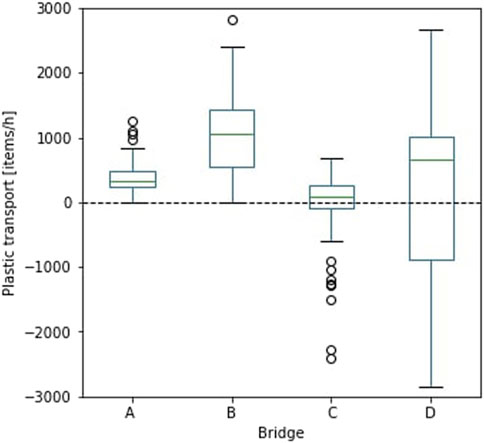
FIGURE 3. Observed floating macroplastics at each bridge (A–D) on the Odaw river for the different sampling days. On 20 March 2021, monitoring was done only upstream at bridges A and B. For clarity on the distribution of plastic transport at each of the bridges, the outliers above 3000 items/h were ignored in the plot.
The SE and RSE for observations at each bridge during the sampling period ranged between 1.1 and 8.2 items/2 min and between 8.1% and 25.0%, respectively. The RSE estimates for the data collected were all less than 30%. This estimate range according to Kendall (1946) meets the standard of data reliability. We conclude that the data presented in this study are subject to a limited sampling error and thus we can expect to obtain reliable results from the subsequent analyses.
3.2 Peak plastic transport varies along the river
At bridge A, peak mean plastic transport (1253 items/h) was observed on 7 April 2021 which was the same day peak transport was observed at bridge B (5520 items/h) (Figure 4). The peak observed at bridges A and B increased by a factor of 1.7 and 2.9 respectively compared to the average of the plastic transport estimated for the other sampling days at these two bridges. The peak plastic transport at these two bridges does not correspond to any hydrometeorological conditions as the measurement was done on a non-rainy day with low freshwater discharge. However, it is important to note that bridges A and B are located within the city centre which has high commercial activities (markets, bus stations, recreational centers). For bridges C and D, plastic transport across the different sampling days showed a similar trend over time with a sharp increase in transport on 12 April 2021. Plastic transport increased by a factor of 7.3 at bridge C and by a factor of 2.5 at bridge D compared to their respective averages. This increased transport could be connected to hydrometeorological conditions, as the increase was observed after a 5.3 mm/d rainfall event. This rainfall event could have facilitated new litter inputs into the river and remobilized some of the litter items deposited on the riverbanks to be transported to these sections of the river. This observation on 12 April 2021, also suggests that rainfall followed by increased discharge is an important driver for the mobilization of plastics and as such meteorological conditions play an important role in the transport of plastics (Schirinzi et al., 2020).
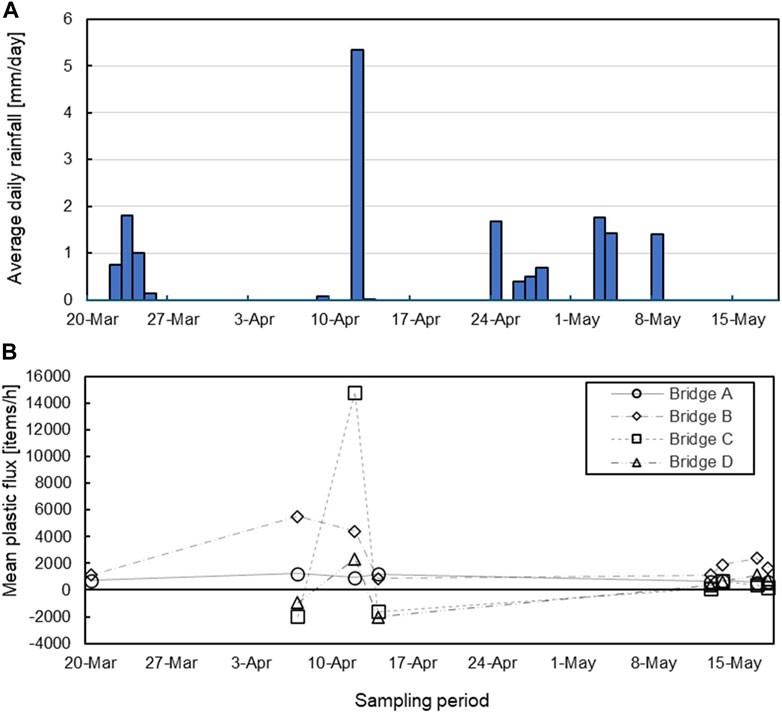
FIGURE 4. (A) Average daily rainfall data over the sampling period and (B) Floating plastic transport at each of the bridges for each sampling day.
3.3 Ebb and flood tide plastic transport
During the sampling period, the average plastic transport during ebb tide (1571 items/h) was higher than during flood tide (470 items/h) at all the bridges (Figure 5). Flood tide plastic transport was only observed at bridges C and D. At these two bridges, the difference in absolute plastic transport for both ebb and flood tide are between 272 and 1892 items/h. The lower difference between the two directional plastic transport was experienced at bridge D (272 items/h). The interactions between the tides and the river flow at this section influence the bidirectional flow of the plastics causing the accumulation of the plastics at this section of the river. These results, therefore, suggest that there is a retention of plastics at the river mouth and supports the assumptions that locations close to the ocean (tidal zones) are temporary sinks for plastics. This therefore has a major influence on the net export of plastics from the river into the ocean (Ivar do Sul et al., 2014; van Emmerik and Schwarz., 2020).
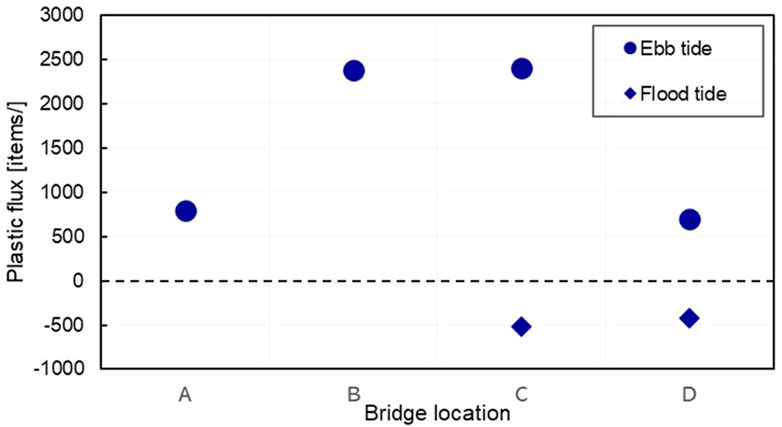
FIGURE 5. Mean plastic transport (items/h) for ebb and flood tide at each of the bridge locations (A–D) across the different sampling days.
3.4 Daily plastic mass transport in the Odaw river
The range of the plastic mass transport in the Odaw was highest at bridge B (3.1 × 10²–5.7 × 10² kg/d) (Table 2). On the other hand, the lowest range of plastic mass transport in the Odaw was found at bridge D (3.5 × 101–6.5 × 101 kg/d). This is the bridge within the tidal zone of the river and the closest to the river mouth. The magnitude of mass transport at bridge D was one order of magnitude lower than that at bridge B. Though bridge C is also within the tidal zone, its magnitude of mass transport was the same as that at bridge B. However, the mass transport at bridge B was 1.3 times higher than that at bridge C. Comparing our estimated range of values to the mass transport estimates of Vriend et al. (2020) for the Rhine river (1.3–9.7 kg/d), the magnitude of mass transport in the Odaw river was found to be higher. Though the sampling periods for plastic transport observations in both rivers were during low discharges, the differences in values could be explained by the difference in their catchment area, land use around the river, the topography and geometry of the river, population density, the waste management infrastructure, and the waste generation point away from the river (Lebreton et al., 2017; Meijer et al., 2021).
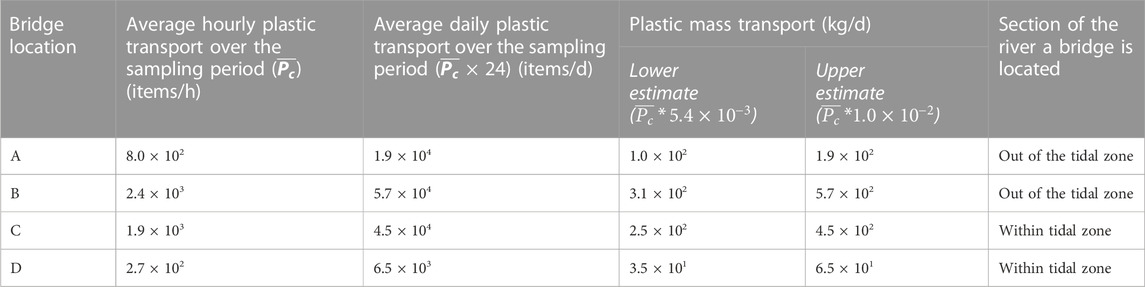
TABLE 2. Estimated daily plastic mass transport at each of the monitored bridges along the Odaw river. The table shows the upper and lower estimates of the daily plastic mass transport due to the range of average mass per plastic item (5.4–10.0g) used for the estimation.
However, comparing the range of daily plastic mass transport in the Odaw river to that of the Danube (4.2 × 10³ kg/d) (Lechner et al., 2014) and Ciliwung rivers (3.2 × 10³ kg/d) (van Emmerik et al., 2019a), our estimates were lower. A reason to account for this could be the fact that our field data did not have any mass statistics for the observed plastic items. Another reason could be that seasonality was not factored in the estimation of the daily plastic mass transport since the data collection was done only within the dry season. For the Danube river, the estimation of the mass transport accounted for seasonality with a daily sampling of micro and macroplastics on the water surface and within the water column over 2 years. Although the mass transport for the Ciliwung river was also performed on a shorter timescale as compared to the sampling days for this study, the entire water column was accounted for in the estimation of the daily plastic mass transport in that study and was not considered for the Odaw. Due to the limitations in our method as compared to these rivers, our estimate of the daily macroplastic transport in the Odaw river may therefore be an underestimation. However, understanding and comparing the magnitude of riverine transport of plastic debris in the Odaw river to other studied rivers is important to assess the severity of macroplastic pollution in the river as well as to provide some validation for global models.
The estimated average mass transport range at the downstream bridges (1.4 × 10²–2.6 × 10² kg/d) in the Odaw was lower as compared to the upstream bridges (2.1 × 10²–3.8 × 10² kg/d). The possible lower abundance of plastics downstream compared to upstream could be due to the deposition of plastics along its course downstream. Since the flow is low, there is a high probability of trapping due to the geometry of the river and the presence of retention mechanisms (hydraulic structures, vegetation, sediments). Due to the trapping of some plastics upstream, the number of plastics flowing downstream reduces. The results, therefore, indicate that more deposition of plastics is experienced upstream in the Odaw river as compared to downstream during dry seasons.
3.5 Strong correlation of rainfall and plastic transport at the downstream bridges
A weak and insignificant correlation was found between the plastic transport and rainfall at the upstream bridges (A and B) using both statistical correlation tests (ρp: 0.20–0.49, ρs: 0.25–0.41, p > 0.05) (Table 3). For the bridges downstream, a strong and significant correlation was found at bridge C (ρp: 0.99, p < 0.05) using the Pearson correlation test. On the other hand, for bridge D the correlation was good using both statistical tests (ρp: 0.63, ρs:0.61) although it was not statistically significant (p > 0.05). It is important to note that due to the single rainfall event during the sampling period, there was a bias in the statistics resulting in the high correlation coefficient value at bridge C.
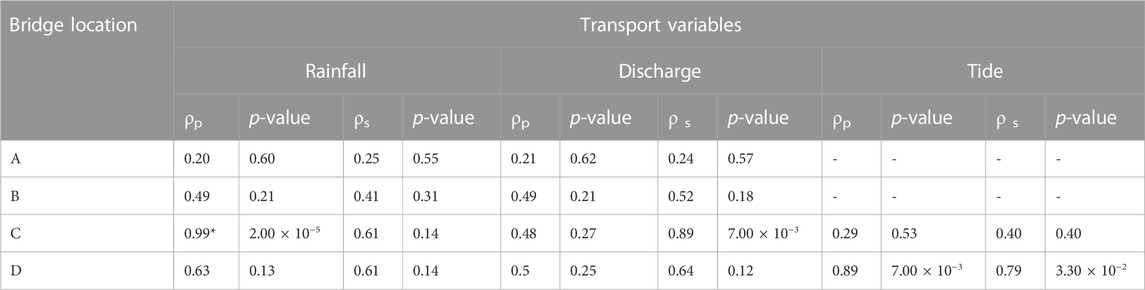
TABLE 3. Results of the correlation tests between the transport variables (rainfall, discharge, and tide) and the median plastic transport. The Pearson and Spearman rank coefficients in the table are represented by ρp and ρ s respectively. The very high correlation coefficient found at bridge B indicated by * is due to the single rainfall event during the sampling period suggesting a very strong correlation between the plastic transport and rainfall at this bridge.
The weak correlation at the upstream bridges may be due to the flushing of plastics from upstream towards the downstream bridges. As a consequence of this, less plastic transport was observed at these bridges (A and B) during and after the rainfall event. The flushing effect of these plastics from the upstream to the downstream bridges therefore explains the strong and significant relationship at bridge C. However, for bridge D, despite the correlation, it was not statistically significant. A possible reason for this, inferred from the fieldwork, is the possible deposition of some plastics at the section of the river between bridges C and D. This section of the river is a lagoon and since the rainfall on that day was low, there will be less flushing effect from bridge C towards D as compared to from bridge B to C.
The correlation seen at the downstream bridges shows that rainfall rates have an impact on the transport of plastics and as such the rate of rainfall is a factor in the transport of plastics further downstream in a river. Despite mentioning the role of rainfall rate on plastic transport for this system, the effect of the varying temporal increase in rainfall rate could not be ascertained because the fieldwork was only performed during the dry season. Therefore, a more conclusive statement on the role of rainfall rates on plastic transport can only be gained if sampling is also done during the wet season in this study area. In this case, the seasonality of the plastic transport can be gained and the difference in the impact of different rainfall rates on the plastic transport dynamics can be understood.
3.6 Higher tidal impact on plastic transport closest to the river mouth
Due to the low freshwater discharge during the sampling period, the effect of tides on the transport dynamics of plastics was seen at bridges C and D. For these bridges within the tidal zone of the river, a statistically strong and significant correlation was seen at bridge D (ρp: 0.89, ρs: 0.79, p < 0.05) as compared to bridge C (ρp: 0.29, ρs: 0.40, p > 0.05) which showed a weak and insignificant correlation of its plastic transport with the tides (Table 3).
The results show that the tide-dominated environment within the tidal zone of the river is situated at the river section around bridge D. This confirms the region of stronger influence of tidal impact on the transport dynamics of plastics within the tidal zone of the river. The results support the statement that a stronger effect of the tides on the flow dynamics of plastics is experienced in the region closest to the river mouth (van Emmerik et al., 2022). The results also indicate that the effect of tides on the dynamics of plastic transport is dependent on the distance of the section of the river within the estuary zone away from the river mouth (Krelling and Turra, 2019) and supports the statement from Xu et al. (2018), who mentioned that the average concentrations of plastics in an estuary are a function of the estuarine distance gradient. From the results, an indication of the section within the estuary where more plastics are likely to be trapped can be seen (Biltcliff-Ward et al., 2022).
3.7 Inconsistent correlation between discharges and plastic transport
A statistically significant relationship was observed only at bridge C using the Spearman correlation test (ρs: 0.89, p < 0.05) (Table 3). This significant relationship suggests an increase in discharge causes a corresponding increase in plastic transport. This relationship supports the hypothesis stated in previous works (Galgani et al., 2000; Nizetto et al., 2016; Castro-Jiménez et al., 2019; Honingh et al., 2020; Schirinzi et al., 2020) that the transport of plastics in a river is strongly dependent on the flow regime (i.e., high discharge conditions increase plastic transport and vice versa).
However, a weak and non-significant relationship was found at bridges A (ρp: 0.21, ρs: 0.24, p > 0.05), B (ρp: 0.49, ρs: 0.52, p > 0.05), and D (ρp: 0.50, ρs: 0.64, p > 0.05) using both Pearson and Spearman rank correlations. Although there is no certain explanation for these non-significant relationships, a possible reason to account for this could be because of the presence of retention mechanisms. These retention mechanisms (such as tides, and hydraulic infrastructure) could have accelerated or reduced the number of plastic items with the varying rates of discharges at the section of the river these bridges are located in. The results showed that there is not exactly a constant rate of correlation between plastic transport and discharges at these sections of the river. This then explains the uncertainty of a clear relationship between the two variables (discharges and plastic transport). The results perhaps show that retention mechanisms are an important factor to consider in explaining the non-trivial role of discharges to plastic transport in a river. Although these retention factors could explain the inconsistent link between discharges and plastic transport, it is important to realise that the correlation, especially in the non-tidal zone of the river (A and B) is not entirely robust because the discharges observed for this zone was the same except for the day it rained. This then shows the response of discharges after the rainfall event in this region supporting the statement that discharge rates increase after rainfall events (Chang et al., 2021).
4 Synthesis
Rainfall, tides, and discharge are important driving factors in the dynamics of plastic transport which are highly variable per location, river characteristics, and the rates of mismanaged waste. To explore the role of these transport variables on the dynamics of plastic transport, an effort was put into monitoring floating macroplastics in the Odaw river using the visual counting approach as applied in similar studies (Vriend et al., 2020; van Emmerik et al., 2022). To explore the relationship between each transport variable and plastic transport, a statistical correlation test (Pearson and Spearman rank) was performed. However, there were some limitations to the study. One limitation was the unavailability of field discharge data which may have limited some interpretations. Due to this limitation, discharges were simulated using the rainfall and tidal data obtained. Another limitation is that the field data collection was performed during the dry season with only a single rainfall event and just two discharge values at the non-tidal zone (A and B) of the river. Consequently, the potential seasonality in plastic transport dynamics as caused by the transport variables could not be explored within this study. Because of these limitations, this study answers only in part the question of the role of hydrometeorological factors (rainfall, tides, and discharges) on the transport dynamics of plastics in the Odaw river. To overcome these limitations, future research over an extended spatial and temporal scale is needed to explore how seasonal changes in rainfall and discharge affect the spatial and temporal variation of plastic transport.
Rain events may increase the plastic input in rivers owing to the remobilization of already deposited plastics on riverbanks (van Emmerik et al., 2022) or riverbeds to be transported in the river. This remobilization occurs when plastics stored/trapped on a floodplain or riverbed are carried by the rainfall-induced runoff to be flushed further downstream. This flushing effect, as stated in Castro-Jiménez et al. (2019), increases plastic input into a river and the potential travel-distance of macroplastic debris in the river depending on the intensity of rainfall. A study by Wong et al. (2020) showed a correlation between microplastic concentrations and precipitation in freshwater environments and also noted a strong impact of runoff on the plastics distribution. Our observations also showed the effect had by the flushing of macroplastics from the upstream section of the river to the lower reaches as demonstrated by the strong and significant correlation between plastic transport and rainfall at the downstream bridges (C and D). The results thus support the statement that occasional dry season rainfall can remobilize plastic deposits temporarily increasing their concentrations in the rivers (Haberstroh et al., 2021b). Although the relationship shown here was for a single rainfall event during the sampling period, it indicates the role that rainfall plays in the mobilisation and transport of plastics in the Odaw river.
A positive linkage between plastic transport and discharge would be expected but this relationship was found to be inconsistent in this study. Previous research has examined the relationship between discharge and plastic transport with studies such as Castro-Jiménez et al., 2019 and Wagner et al. (2019) showing a positive relationship between discharge and plastic concentration. However, more recent observations by Roebroek et al. (2022), van Emmerik et al. (2022), Constant et al. (2020), and Stanton et al. (2020) indicated no such correlation, with some studies actually reporting higher concentrations of plastic during low discharges thus showing the non-trivial role discharge may play in the transport of plastics in a river. For this study also, we found that plastic transport and discharges did not entirely positively correlate at certain locations within the river due to the longitudinal variation of watershed characteristics, channel characteristics, retention mechanisms (dams, weir, vegetation), and anthropogenic activities along the water system. These local characteristics along the river may have slowed/accelerated the plastic transport and as such resulted in certain locations with higher/lower plastic concentrations. Since all these conditions contribute to the alteration of the flow conditions at certain locations in a water channel, it is difficult to draw firm conclusions on the spatial and temporal response of the plastic transport to the varying flow regime within this river.
Previous studies (Ivar do Sul et al., 2014; van Emmerik and Schwarz, 2020), have shown that estuaries can act as temporary sinks for plastics because tides cause the bidirectional transport of material. During high tides, there is a circulation of water into and out of the estuary. These tidal dynamics lead to changes in water level, salinity concentration, and flow direction. Consequently, plastics found in tidal zones experience bi-directional transport (Haddout et al., 2022), and are thus stored there which actually reduces the plastic load that reaches the ocean. A study in the Goiana estuary (Brazil) showed that tides are the main driving force controlling plastic debris movement patterns in estuaries (Ramos et al., 2011). Other studies have also noted the long residence time of plastics in estuarian environments, favored by tidal regimes (Ivar do Sul et al., 2014; Tramoy et al., 2020). The impact had by tides was indeed observed in this study at the bridges (C and D) close to the river mouth. Given the spatial variability within an estuarine system, plastic distribution and retention are likely to be variable as can be seen from the results. A larger effect of the tides on the bidirectional flow of the plastics was seen at the bridge (D) which is closer to the river mouth than the river section at bridge C. At D (tide-dominated environment), high quantities of plastics were seen flowing upstream compared to the section at bridge C. The results helped to understand the region of influence of tides and how they impact the net export of these plastics into the ocean.
The magnitude of the estimated range of daily mass transport in the Odaw was higher than the Rhine river and lower than the Danube and Ciliwung rivers. This estimated daily mass transport of plastics for the Odaw is considered a rough estimate based on the average of the daily mean plastic transport at each of the monitored bridges during the sampling period which was only within the dry season, excluding the wet season and extreme events. Also, we estimated with a range of mass per plastic item from the literature and did not consider the plastic litter within the entire water column. Overall, this work shows that the transport and fate of plastics are non-uniform through the river and highly dependent on the rates of hydro-meteorological factors.
5 Conclusion
Daily floating plastic mass transport estimated for the Odaw river during the dry season was highest at the most downstream non-tidal location (3.1 × 10²–5.7 × 10² kg/d). Average daily plastic mass transport at the river mouth was lower as compared to the upstream bridges (non-tidal zone) in the Odaw river. A strong correlation was found between rainfall and plastic transport at the downstream bridges (tidal zone). The correlation at the downstream bridges indicates the role rainfall plays in the transport and abundance of plastics in the river. However, when relating discharges to plastic transport, a statistically significant correlation using Spearman rank was found only at the first bridge within the tidal zone of the river. From the results, we showed that the relationship between plastic transport and discharges varies among locations within this river system.
Within the tidal zone of the river, a higher tidal impact on the bidirectional flow of plastics was found at the bridge closest to the river mouth within the tidal region of the river. The results highlighted the tide-dominated environment within the tidal zone and showed that the abundance of plastics in the tidal zone is a function of the estuarine distance gradient.
Since this fieldwork was done during the dry season, we are limited to fully interpreting and understanding the relationship between the plastic transport patterns and their drivers over the annual timescale. Therefore, future research is required to look into the spatial and temporal dimensions of these transport processes. Despite the limitations of the study, the results provide an understanding of the dynamics of plastic transport and the driving factors in the dry season. With this paper, we aim to contribute to the future modeling of plastic transport in this river and hope to support policymakers by helping them to implement efficient mechanisms of managing the plastic pollution issue in this river.
Data availability statement
The datasets presented in this study can be found in online repositories. The names of the repository/repositories and accession number(s) can be found in the article/Supplementary Material.
Author contributions
Conceptualization, TB, RBP, TvE, and MvdP; Methodology, RBP, TvE, and MvdP; Data curation, TB and RBP; Formal Analysis, RBP and TB; Investigation, KD; Software, JU, TB, and RBP; Visualisation, RBP; Supervision, TvE and MvdP; Writing—original draft, RBP; Writing—review and editing, TvE, MvdP, RU, JU, FA, and KD.
Funding
The work of RBP is funded by the African Talent Programme supported by Wageningen University. The work of TvE is supported by the Veni research program The River Plastic Monitoring Project with project number 18211, which is (partly) funded by the Dutch Research Council (NWO). The work of MvdP is supported by the 4TU.Federation Plantenna project.
Acknowledgments
Special thanks to Joseph Acquah and Seth Toko for their assistance in the field. We thank Kryss Waldschläger, Louise Schreyers, Hadeel Al-Zawaidah, and Luca Galitelli for their valuable feedback on an earlier version of the manuscript. This paper is partly based on the MSc thesis “Analysis of macroplastic emissions through the Odaw river (Accra) into the ocean” by TB.
Conflict of interest
Author JU was employed by the company of HKV, Lijn in Water BV.
The remaining authors declare that the research was conducted in the absence of any commercial or financial relationships that could be construed as a potential conflict of interest.
Publisher’s note
All claims expressed in this article are solely those of the authors and do not necessarily represent those of their affiliated organizations, or those of the publisher, the editors and the reviewers. Any product that may be evaluated in this article, or claim that may be made by its manufacturer, is not guaranteed or endorsed by the publisher.
Supplementary material
The Supplementary Material for this article can be found online at: https://www.frontiersin.org/articles/10.3389/fenvs.2023.1125541/full#supplementary-material
References
Adank, M., Darteh, B., Moriarty, P., Osei-Tutu, H., Assan, D., and Rooijen, D. van. (2011). Towards integrated urban water management in the Greater Accra Metropolitan Area, Current status and strategic directions for the future. SWITCH/RCN Ghana. ISBN: 9789988148287.
Biltcliff-Ward, A., Stead, J. L., and Hudson, M. D. (2022). The estuarine plastics budget: A conceptual model and meta-analysis of microplastic abundance in estuarine systems. Coast. Shelf Sci. 275, 107963. doi:10.1016/j.ecss.2022.107963
Borelle, S. B., Ringma, J., Law, K. L., Monnahan, C. C., Lebreton, L., McGivern, A., et al. (2020). Predicted growth in plastic waste exceeds efforts to mitigate plastic pollution. Science 369, 1515–1518. doi:10.1126/science.aba3656
Castro-Jiménez, J., González-Fernández, D., Fornier, M., Schmidt, N., and Sempéré, R. (2019). Macro-litter in surface waters from the rhone river: Plastic pollution and loading to the NW mediterranean sea. Mar. Pollut. Bull. 146, 60–66. doi:10.1016/j.marpolbul.2019.05.067
Chang, W., Wan, J., Tan, J., Wang, Z., Jiang, C., and Huang, K. (2021). Responses of spring discharge to different rainfall events for single-conduit karst aquifers in Western Hunan Province, China. Int. J. Environ. Res. Public Health 18 (11), 5775. doi:10.3390/ijerph18115775
Constant, M., Ludwig, W., Kerhervé, P., Sola, J., Charrière, B., Sanchez-Vidal, A., et al. (2020). Microplastic fluxes in a large and a small mediterranean river catchments: The têt and the rhône, northwestern mediterranean sea. Sci. Total Environ. 716, 136984. doi:10.1016/j.scitotenv.2020.136984
Dasgupta, S., Sarraf, M., and Wheeler, D. (2022). Plastic waste cleanup priorities to reduce marine pollution: A spatiotemporal analysis for Accra and lagos with satellite data. Sci. Total Environ. 839, 156319. doi:10.1016/j.scitotenv.2022.156319
Deltares (2013). 1D/2D modelling suite for integral water solutions/SOBEK suite/hydrodynamics/SOBEK 3/SOBEK in DeltaShell. Technical reference manual version 3.0.1.29298. Delft: Deltares Systems. Deltares.
Duncan, E. M., Davies, A., Brooks, A., Chowdhury, G. W., Godley, B. J., Jambeck, J., et al. (2020). Message in a bottle: Open-source technology to track the movement of plastic pollution. PLoS ONE 15 (12), e0242459. doi:10.1371/journal.pone.0242459
Ernest, M. A., Pay, D., and Olufunke, C. O. (2015). The Challenge of urban flood control: The case of Accra’s Korle Lagoon the challenge of urban flood control: The case of Accra’s Korle Lagoon.
Galgani, F., Leaute, J. P., Moguedet, P., Souplet, A., Verin, Y., Carpentier, A., et al. (2000). Litter on the sea floor along European coasts. Mar. Pollut. Bull. 40, 516–527. doi:10.1016/s0025-326x(99)00234-9
Geraeds, M., van Emmerik, T., de Vries, R., and bin Ab Razak, M. S. (2019). Riverine plastic litter monitoring using Unmanned Aerial Vehicles (UAVs). Remote Sens. 11 (17), 2045. doi:10.3390/rs11172045
González-Fernández, D., and Hanke, G. (2017). Toward a harmonized approach for monitoring of riverine floating macro litter inputs to the marine environment. Front. Mar. Sci. 4, 86. doi:10.3389/fmars.2017.00086
Haberstroh, C. J., Arias, M. E., Yin, Z., and Wang, M. C. (2021a). Effects of hydrodynamics on the cross-sectional distribution and transport of plastic in an urban coastal river. Water Environ. Res. 93 (2), 186–200. doi:10.1002/wer.1386
Haberstroh, C. J., Arias, M. W., Yin, Z., and Wang, M. C. (2021b). Effects of urban hydrology on plastic transport in a subtropical river. ACS ES&T Water 1 (18), 1714–1727. doi:10.1021/acsestwater.1c00072
Haddout, S., Priya, K. L., Hoguane, A. M., Casila, J. C. C., and Ljubenkov, I. (2022). Relationship of salinity, temperature, pH, and transparency to dissolved oxygen in the bouregreg estuary (Morocco): First results. Water Pract. Technol. 17 (12), 2654–2663. doi:10.2166/wpt.2022.144
Honingh, D., van Emmerik, T., Uijttewaal, W., Kardhana, H., Hoes, O., and van de Giesen, N. (2020). Urban River water level increase through plastic waste accumulation at a rack structure. Front. Earth Sci. 8. doi:10.3389/feart.2020.00028
Ivar do Sul, J. A., Costa, M. F., Silva-Cavalcanti, J. S., and Araújo, M. C. B. (2014). Plastic debris retention and exportation by a mangrove forest patch. Mar. Pollut. Bull. 78, 252–257. doi:10.1016/j.marpolbul.2013.11.011
Kendall, M. G. (1946). The advanced theory of statistics. 2nd Ed. London, United Kingdom: Charles Griffin and Co., Ltd.
Krelling, A. P., and Turra, A. (2019). Influence of oceanographic and meteorological events on the quantity and quality of marine debris along an estuarine gradient. Mar. Pollut. Bull. 139, 282–298. doi:10.1016/j.marpolbul.2018.12.049
Larmie, S. (2019). “Republic of Ghana ministry of works and housing greater Accra resilient and integrated development project (GARID),” in The Environmental Impact Assessment [EIA] study for the dredging in the Odaw basin-Final report.
Lau, W. W. Y., Shiran, Y., Bailey, R. M., Cook, E., Stuchtey, M. R., Koskella, J., et al. (2020). Evaluating scenarios toward zero plastic pollution. Science 369, 1455–1461. doi:10.1126/SCIENCE.ABA9475
Lebreton, L. C. M., van der Zwet, J., Jan-Willem, D., Boyan, S., Anthony, A., and Julia, R. (2017). River plastic emissions to the world’s oceans. Nat. Commun. 8, 15611. Article number: 15611. doi:10.1038/ncomms15611
Lechner, A., Keckeis, H., Lumesberger-Loisl, F., Zens, B., Krusch, R., Tritthart, M., et al. (2014). The Danube so colourful: A potpourri of plastic litter outnumbers fish larvae in europe's second largest river. Environ. Pollut. 188, 177–181. doi:10.1016/j.envpol.2014.02.006
Meijer, L. J. J., van Emmerik, T., van der Ent, R., Schmidt, C., and Lebreton, L. (2021). More than 1000 rivers account for 80% of global riverine plastic emissions into the ocean. Sci. Adv. 7 (18), eaaz5803. doi:10.1126/sciadv.aaz5803
Nizetto, L., Bussin, G., Futter, M. N., Butterfield, D., and Whitehead, P. G. (2016). A theoretical assessment of microplastic transport in river catchments and their retention by soils and river sediments. Environ. Sci. Process. Impact 18, 1050–1059. doi:10.1039/c6em00206d
Ramos, J. A. A., Barletta, M., Dantas, D. V., Lima, A. R. A., and Costa, M. F. (2011). Influence of moon phase on fish assemblages in estuarine mangrove tidal creeks. J. Fish Biol. 78, 344–354. doi:10.1111/j.1095-8649.2010.02851.x
Resource Centre Network Ghana (2021). The Dead Odaw river - polluted with plastics, garbage & human excreta. Available at: https://www.washghana.net/node/227.
Roebroek, C. T. J., Harrigan, S., van Emmerik, T. H. M., Baugh, C., Eilander, D., Prudhomme, C., et al. (2021). Plastic in global rivers: Are floods making it worse? Environ. Res. Lett. 16 (2), 025003–025012. doi:10.1088/1748-9326/abd5df
Roebroek, C. T. J., Laufkötter, C., González-Fernández, D., and van Emmerik, T. (2022). The quest for the missing plastics: Large uncertainties in river plastic export into the sea. Environ. Pollut. 312, 119948. doi:10.1016/j.envpol.2022.119948
Schirinzi, G. F., Köck-Schulmeyer, M., Cabrera, M., González-Fernández, D., Hanke, G., Farré, M., et al. (2020). Riverine anthropogenic litter load to the Mediterranean Sea near the metropolitan area of Barcelona, Spain. Amsterdam: Science of the Total Environment, 714. doi:10.1016/j.scitotenv.2020.136807
Schmidt, C., Krauth, T., and Wagner, S. (2017). Export of plastic debris by rivers into the sea. Environ. Sci. Technol. 51 (21), 12246–12253. doi:10.1021/acs.est.7b02368
Stanton, T., Johnson, M., Nathanail, P., MacNaughtan, W., and Gomes, R. L. (2020). Freshwater microplastic concentrations vary through both space and time. Environ. Pollut. 263, 114481. doi:10.1016/j.envpol.2020.114481
Tide times and charts for Accra (2021). Ghana, and weather forecast for fishing in Accra in 2021. (tides4fishing.com).
Tramoy, R., Gasperi, J., Colasse, L., and Tassin, B. (2020). Transfer dynamic of macroplastics in estuaries–new insights from the seine estuary: Part 1. Long term dynamic based on date-prints on stranded debris. Mar. Pollut. Bull. 152, 110894. doi:10.1016/j.marpolbul.2020.110894
van de Giesen, N., Hut, R., and Selker, J. (2014). The trans-african hydro-meteorological observatory (TAHMO). WIREs Water 1 (4), 341–348. doi:10.1002/wat2.1034
van Emmerik, T., de Lange, S. I., Frings, R., Schreyers, L., Aalderink, H., Leusink, J., et al. (2022). Hydrology as driver of floating river plastic transport. Earth Space Sci. Open Archive. doi:10.1002/essoar.10510983.1
van Emmerik, T., Kieu-Le, T. C., Loozen, M., Oeveren, K. V., Strady, E., Bui, X. T., et al. (2018). A methodology to characterize riverine macroplastic emission into the ocean. Front. Mar. Sci. 5. doi:10.3389/fmars.2018.00372
van Emmerik, T., Loozen, M., van Oeveren, K., Buschman, F., and Prinsen, G. (2019a). Riverine plastic emission from Jakarta into the ocean. Environ. Resour. Lett. 14, 084033. doi:10.1088/1748-9326/ab30e8
van Emmerik, T., and Schwarz, A. (2020). Plastic debris in rivers. Wiley Interdiscip. Rev. Water 7 (1), 1–24. doi:10.1002/wat2.1398
van Emmerik, T., Strady, E., Kieu-Le, T. C., Nguyen, L., and Gratiot, N. (2019b). Seasonality of riverine macroplastic transport. Sci. Rep. 9 (1), 13549. doi:10.1038/s41598-019-50096-1
Vriend, P., van Calcar, C., Kooi, M., Landman, H., Pikaar, R., and van Emmerik, T. (2020). Rapid assessment of floating macroplastic transport in the rhine. Front. Mar. Sci. 7. doi:10.3389/fmars.2020.00010
Wagner, S., Klöckner, P., Stier, B., Römer, M., Seiwert, B., Reemtsma, T., et al. (2019). Relationship between discharge and river plastic concentrations in a rural and an urban catchment. Environ. Sci. Technol. 53 (17), 10082–10091. doi:10.1021/acs.est.9b03048
Wasserstein, R. L., Schirm, A. L., and Lazar, N. A. (2019). Moving to a world beyond “p < 0.05. American Statistician. American Statistical Association. doi:10.1080/0031305.2019.1583913
Wong, J. K. H., Lee, K. K., Tang, K. H. D., and Yap, P. S. (2020). “Microplastics in the freshwater and terrestrial environments: Prevalence, fates, impacts and sustainable solutions,” in Science of the total environment (Elsevier B.V). doi:10.1016/j.scitotenv.2020.137512
Xu, P., Peng, G., Su, L., Gao, Y., Gao, L., and Li, D. (2018). Microplastic risk assessment in surface waters: A case study in the changjiang estuary, China. Mar. Pollut. Bull. 133, 647–654. doi:10.1016/j.marpolbul.2018.06.020
Keywords: macroplastic, urban river, rainfall, tide, discharge
Citation: Pinto RB, Barendse T, van Emmerik T, van der Ploeg M, Annor FO, Duah K, Udo J and Uijlenhoet R (2023) Exploring plastic transport dynamics in the Odaw river, Ghana. Front. Environ. Sci. 11:1125541. doi: 10.3389/fenvs.2023.1125541
Received: 16 December 2022; Accepted: 31 January 2023;
Published: 13 February 2023.
Edited by:
Peiyue Li, Chang’an University, ChinaReviewed by:
Venkatramanan Senapathi, Alagappa University, IndiaAnish Kumar Warrier, Manipal Academy of Higher Education, India
Copyright © 2023 Pinto, Barendse, van Emmerik, van der Ploeg, Annor, Duah, Udo and Uijlenhoet. This is an open-access article distributed under the terms of the Creative Commons Attribution License (CC BY). The use, distribution or reproduction in other forums is permitted, provided the original author(s) and the copyright owner(s) are credited and that the original publication in this journal is cited, in accordance with accepted academic practice. No use, distribution or reproduction is permitted which does not comply with these terms.
*Correspondence: Rose Boahemaa Pinto, cm9zZS5waW50b0B3dXIubmw=