 Shaohua Wang
 Gang Fu
- 1International Research Center of Big Data for Sustainable Development Goals, Beijing, China
- 2Lhasa Plateau Ecosystem Research Station, Key Laboratory of Ecosystem Network Observation and Modeling, Institute of Geographic Sciences and Natural Resources Research, Chinese Academy of Sciences, Beijing, China
Soil moisture (SM) is closely correlated with ecosystem structure and function. Examining whether climate data (temperature, precipitation and radiation) and the normalized difference vegetation index (NDVI) can be used to estimate SM variation could benefit research related to SM under climate change and human activities. In this study, we evaluated the ability of nine algorithms to explain potential SM (SMp) variation using climate data and actual SM (SMa) variation using climate data and NDVI. Overall, climate data and the NDVI based on the constructed random forest models led to the best estimated SM (R2 ≥ 94%, RMSE ≤ 2.98, absolute value of relative bias: ≤ 3.45%). Randomness, and the setting values of the two key parameters (mtry and ntree), may explain why the random forest models obtained the highest accuracy in predicating SM. Therefore, the constructed random forest models of SMp and SMa in this study can be thus be applied to estimate spatiotemporal variations in SM and for other related scientific research (e.g., differentiating the relative effects of climate change and human activities on SM), at least for Tibetan grassland region.
1 Introduction
Soil moisture (SM) is related to the temperature sensitivity of ecological systems (Shen et al., 2015; Fu and Sun, 2022), plant growth and production (Fu and Shen, 2017; Fu et al., 2018; Fu et al., 2019; Zhang et al., 2021), plant α-diversity and community composition (Wang et al., 2021a; Wang et al., 2021b; Sun et al., 2021), soil microbial community (Yu et al., 2019a; Zhang et al., 2020; Zhang and Fu, 2021; Zong and Fu, 2021; Han et al., 2022a; Zhong and Fu, 2022), soil carbon, nitrogen and phosphorus flux and storage (Fu and Shen, 2016; Yu et al., 2019b; Fu and Shen, 2022). Surface measurement is undoubtedly the most accurate and easiest method of obtaining SM; however, this method still has its own insurmountable shortcomings (e.g., the temporal scale and especially the spatial scale at which it operates are relatively small, and the time and labor costs are high) (Yang et al., 2017; Nguyen et al., 2022). Many studies have been carried out to obtain SM data at larger spatial scales and for longer time series (Zeng et al., 2015; Bi et al., 2016; Meng et al., 2018). Simulation methods of SM based on microwave remote sensing technology (e.g., advanced scatterometer) have been proposed since the 1970s (Schmugge et al., 1980; Naeimi et al., 2009; Zeng et al., 2015; Karthikeyan et al., 2017). The spatial resolution of SM measurements based on microwave remote sensing technology is always relatively coarse (Yang et al., 2017; Zhang et al., 2018; Nguyen et al., 2022; Wu and Wen, 2022). Moreover, the accuracy of SM estimation using microwave remote sensing technology is often low and thus needs to be further improved, and such SM data need to be validated before usage (Chen et al., 2013; Ullah et al., 2018; Zheng et al., 2018; Li et al., 2022). All these disadvantages limit the usage usefulness of this approach in quantifying SM (van der Velde et al., 2014; Sun et al., 2016; Yang et al., 2017). Since its establishment, the temperature vegetation dryness index (TVDI) has been widely used in SM detection and management at large spatial and temporal scales (Sandholt et al., 2002; Zhao et al., 2014; Zormand et al., 2017; Ali et al., 2019; Fitriyah et al., 2019; Phan et al., 2020; Yuan et al., 2020). Generally, SM data are indirectly obtained using the TVDI approach and divided into multiple levels based on the TVDI values (Zormand et al., 2017; Yuan et al., 2020). Moreover, the accuracy of SM measurement based on the TVDI method is highly dependent on the accuracy of the normalized difference vegetation index (NDVI, derived from near-infrared and red-band reflectance) and land surface temperature (Yang et al., 2017). All these factors limit the usability of the TVDI-based approach. Some reanalysis data products (e.g., ERA5, JRA-55, CFSR, ERA-Interim and MERRA-2) can also provide SM datasets (Bao et al., 2010; Cheng et al., 2019; Wang et al., 2019; Li et al., 2022; Liu and Yang, 2022). These reanalysis SM datasets are convenient for related scientific research, but their accuracy still needs to be further improved (Ullah et al., 2018; Yang et al., 2020; Li et al., 2022; Liu and Yang, 2022), and their spatial resolution (e.g., 0.1 ×0.1) is relatively coarse (Yang et al., 2020; Liu and Yang, 2022). Compared to process/physics-based models of SM or satellite-derived SM products mentioned above, machine learning algorithms can have their own advantages in estimating SM. For example, R software is a popular open-source software, and some common machine learning algorithms have directly worked well on R software, but process/physics-based models of SM are not directly performed on R software. That is, process/physics-based models of SM need relative strong programming fundamental, but the machine learning algorithms based on R software do not need strong programming fundamental. The spatio-temporal resolution of SM products is fixed and generally coarse, but the spatio-temporal resolutions of SM in the machine learning algorithms can be set according to actual needs. Some studies have tried to quantify SM using various machine learning tools (e.g., random forest, extreme gradient boosting) (Cui et al., 2016; Yang et al., 2017; Cui et al., 2019; Tong et al., 2021; Guo et al., 2022; Jarray et al., 2022; Lei et al., 2022; Uthayakumar et al., 2022; Veloso et al., 2022; Wei et al., 2022). Although several previous studies confirmed that different machine learning tools can have varying performances in quantifying surface variables (Han et al., 2022b; Fu et al., 2022; He et al., 2022; Tian and Fu, 2022), it is still unclear which has the best performance in estimating SM (Tong et al., 2021; Zhang et al., 2022a; Nguyen et al., 2022). Earlier models for estimating SM generally have many model parameters (Wang et al., 2022a; Zhang et al., 2022a; Kisekka et al., 2022; Tramblay and Segui, 2022). However, these parameters have varying data accuracy, especially at large spatial and temporal scales (Lee et al., 2022). Moreover, there may be some autocorrelation between multiple model parameters. Thus, a model’s accuracy in estimating SM may not be always positively correlated with the number of parameters (Veloso et al., 2022). Accordingly, further studies are needed to find improved SM model.
Several earlier studies pointed out that precipitation can have stronger influences on ecological systems than temperature at various spatial and temporal scales on Tibetan Plateau (Fu et al., 2018; Wang et al., 2022b; Zhang et al., 2022b). Compared with precipitation, SM can more directly impact ecosystem structure and function on Tibetan Plateau (Shen et al., 2015; Shen et al., 2016; Fu et al., 2018). Accordingly, a great deal of studies have attempted to obtain SM with a more fine spatial scale over a larger area (Tong et al., 2021; Li et al., 2022; Liu and Yang, 2022; Wu and Wen, 2022), and investigated the influences of SM on various ecological systems on Tibetan Plateau (Fu et al., 2012; Yu et al., 2014; Zhong et al., 2016; Zhong and Fu, 2022). Compared to other regions in China, there are few SM observation stations in this area (Wang et al., 2022a). This directly affects the number of data available for direct measurement of surface SM and hence limits their application. Studies more often use precipitation and vapor pressure deficit rather than SM to reflect environmental water conditions, especially over relatively larger area (Shen et al., 2014; Wang et al., 2015; Fu et al., 2016), because data for the former are easier to obtain for Tibetan Plateau. Both warming and precipitation can directly affect SM, and solar short-wave radiation can increase soil temperature and air temperature (Klein et al., 2005; Fu et al., 2018). However, it is still unclear whether or not temperature, precipitation and radiation can be used to invert SM. Thus, it is necessary to construct a SM optimization model driven solely by climate factors. Previous studies found that human activities (e.g., grazing) can generally reduce SM at a single point or along a transect (Fu and Shen, 2016; Sun et al., 2021; Zhang and Fu, 2021). However, it is still unclear how SM can be used to respond to the combined effects of climate change and human activities on Tibetan Plateau. The development a SM optimization model driven simultaneously by climate factors and human activities is also needed. Furthermore, the relative impacts of climate change and human activities on SM on Tibetan Plateau also remain unclear. Therefore, further studies are needed to obtain both an optimum model of SM driven only by climate factors, and driven simultaneously by climate factors and human activities, respectively, on the Tibetan Plateau.
The NDVI, as one of the most common and important vegetation indices (Fu and Shen, 2022; Fu and Sun, 2022), can be easily and directly obtained from remote sensing satellite data (Shen et al., 2014; Wang et al., 2015). The earliest NDVI product can be dated back to the 1980s (Cortez, 2010; Fu et al., 2011). Some NDVI products provide long-time-series data on the Earth. Compared to other vegetation indices (e.g., enhanced vegetation index), the NDVI is much older. The NDVI, which is based on remote sensing satellite data, can measure effects induced by both climate change and by anthropogenic activities (Breiman, 2001; Wang et al., 2015). The NDVI has been validated as one of the most important variables affecting SM on Tibetan Plateau (Cui et al., 2016; Li et al., 2022). Accordingly, SM variation in the grassland systems of Tibet was estimated from climate data (i.e., temperature, precipitation and radiation) and the NDVI based on nine approaches. The main objectives of this study were to 1) compare the accuracies of different algorithms, and 2) examine whether climate data and NDVI can be used to estimate SM in Tibetan grassland systems. On one hand, the building models of SM can help scientists to save time by abandoning soil moisture field surveys. On the other hand, this study can provide services for better solving various ecological and environmental problems related to SM. For example, this study would not only facilitate estimating spatiotemporal variations in SM, but also facilitate differentiating between the effects of climate change and human activities on SM. This study can also provide services for better perform the studies related to ecosystem structure and function because SM is more closely correlated to ecosystem structure and function than precipitation on the Tibetan Plateau (Shen et al., 2015; Shen et al., 2016; Fu et al., 2018).
2 Materials and methods
2.1 Data
The study area was located in the grassland systems of Tibet. The sampling sites were located from 28.37° N to 33.17° N and 79.69° E to 95.68° E in free-grazing areas, and from 29.28° N to 33.17° N and from 83.25° E to 92.01° E in fenced areas (Figure 1). The annual temperature of the sampling sites ranged from −0.22°C to 9.81°C in free-grazing areas and from −0.40°C to 6.16°C in fenced areas. The annual precipitation of the sampling sites ranged from 26.88 mm to 674.03 mm in free-grazing areas and from 163.79 mm to 663.44 mm in fenced areas. The annual maximum NDVI of the sampling sites ranged from 0.0606 to 0.8016 in free-grazing areas, and from 0.1199 to 0.6923 in fenced areas.
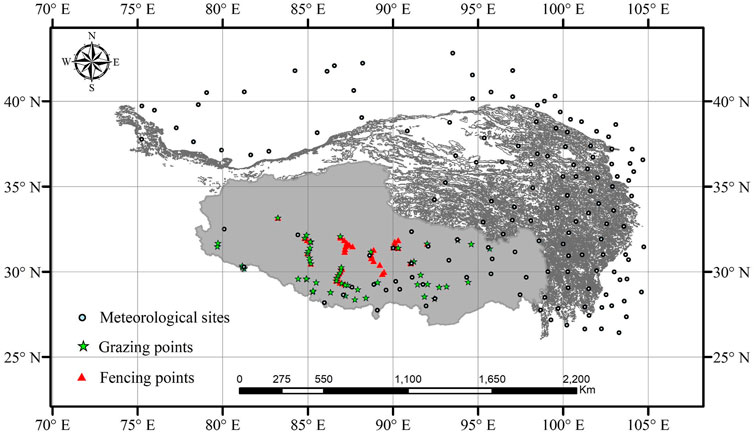
FIGURE 1. Sampling points.
Documented results suggest that SM in non-grazing areas is not affected by anthropogenic activities (Han et al., 2022b; Fu et al., 2022; Tian and Fu, 2022). Refer to some previous studies (Han et al., 2022b; Tian and Fu, 2022), SM under non-grazing conditions were referred to SMp. Based on the monthly meteorological data (temperature, precipitation and radiation) from 145 meteorological stations, we obtained the raster meteorological data in 2011, 2013–2018 and 2020 (spatial resolution of 1 km × 1 km, temporal resolution of 1 month) through spatial interpolation using the Anusplin software (Fu et al., 2017; Tian and Fu, 2022). Temperature, precipitation and radiation data were obtained from spatial interpolated meteorological data, which often have higher accuracy (Fu et al., 2017; Tian and Fu, 2022). Temperature, precipitation and radiation have been validated as important variables affecting SM on Tibetan Plateau (Cui et al., 2016; Li et al., 2022; Liu and Yang, 2022). Accordingly, air temperature, precipitation and radiation data were used to model SMp to facilitate our study on the spatial-temporal variations in SMp.
Documented results suggest that SM in grazing areas is influenced by both climate change and anthropogenic activities (Han et al., 2022b; Fu et al., 2022; Tian and Fu, 2022). Refer to some previous studies (Han et al., 2022b; Tian and Fu, 2022), SM under grazing conditions were referred to SMa. Air temperature, precipitation, radiation and NDVI data were used to model SMa, facilitating our study on the spatial-temporal variations in SMa. By combining the two constructed models of SMp and SMa, we were able to differentiate between the effects of climate change and human activities on SM.
The MOD13A3 NDVI (1 km × 1 km, 1 month) was used in this study. The reasons why MOD13A3 NDVI is applied in this study are due to the following grounds. 1) The ultimate objective of constructing a SM model was to aid the high-quality development of livestock husbandry in Tibet. That is, we aimed to focus on the change in grassland productivity during drought conditions and its impact on the high-quality development of livestock husbandry in Tibet. Although fine spatio-temporal resolution soil drought can have a negative impact on grassland productivity, it does not have a fatal impact on the high-quality development of livestock husbandry in Tibet. Only a large area of soil drought would adversely impact the high-quality development of livestock husbandry in Tibet. In addition, using ultra-fine spatio-temporal resolution can increase the financial cost of SM management, and therefore, is not of great significance for the high-quality development of livestock husbandry in Tibet. On the contrary, moderate spatio-temporal resolution (e.g., 1 km × 1 km, 1 month) in SM monitoring can ensure the high-quality development of livestock husbandry in Tibet. 2) Grazing areas constitute one of the main land use types for Tibetan grassland systems. Tibet is vast and sparsely populated (Tibet covers about one-eighth of China’s total land area, with a population of about 3.51 million). As grassland productivity is generally relatively low in Tibet, 100 ha (1 km × 1 km) of grassland is often not enough to support the grazing activities of a grazing family. A grazing family can often have more than one 100-ha grasslands. Therefore, grazing activities will not be limited to one 100-ha area. Grazing behaviors, such as rotating grazing areas, can reduce the impacts of soil drought on grassland productivity and grazing activities. 3) About 13% of the total grassland area cannot be used for grazing activities in Tibet.
We collected fresh soil samples and other related field works in 2011, 2013–2018 and 2020. We collected 280 and 206 fresh soil samples at the depths of 0–10 and 10–20 cm in non-grazing areas, and 275 and 218 fresh soil samples at the depths of 0–10 and 10–20 cm, respectively, in grazing areas. At each sampling site, three to five soil quadrats were randomly arranged within 1 km × 1 km. The size of each soil quadrat was 50 cm × 50 cm. Within any one 50 cm × 50 cm quadrat, we used a soil auger with a diameter of about 4 cm to collect fresh soil samples. Five auger-collected fresh soil samples were mixed into a fresh soil sample for any one 50 cm × 50 cm quadrat. Then, we weighed and recorded the aluminum boxes using a balance with an accuracy of 0.01 g in the field. After loading fresh soil samples into aluminum boxes, we weighed and recorded the total weight of the aluminum boxes and the fresh soil samples using the same balance. Then, all the aluminum boxes containing fresh soil samples were taken back to the laboratory and oven-dried at 105°C for 48 h (Sun et al., 2021). After fresh soil samples were oven-dried, we weighed and recorded the total weight of the aluminum boxes and the oven-dried soil samples using the same balance. We calculated SM based on the weight of the aluminum boxes, the total weight of the aluminum boxes and the fresh soil samples, and the total weight of the aluminum boxes and the oven-dried soil samples. Observed SMp was 1.05%–51.67%, and 1.13%–60.11% at the depths of 0–10 and 10–20 cm, respectively. Observed SMa was 0.33%–36.73%, and 0.86%–27.49% at the depths of 0–10 and 10–20 cm, respectively.
2.2 Statistical analyses
We randomly selected 30 groups of temperature, precipitation, radiation, NDVI and SM data from the 280 and 206 groups in non-grazing areas and 275 and 218 groups in grazing areas at the depths of 0–10 and 10–20 cm, respectively. These 30 groups data were used to validate the accuracy of the SM models based on four parameters (i.e., linear slope, relative bias, R2: determination coefficient, RMSE: root-mean-square error) (Fu et al., 2011; Han et al., 2022b; Tian and Fu, 2022). When we conducted the linear regressions between simulated and observed SM, constraining the intercept to go through the origin, following the protocol of previous studies (Fu et al., 2011; Han et al., 2022b; Tian and Fu, 2022). The closer the slope and the R2 are to 1, the higher the accuracy of constructed SM model is. The lower RMSE and absolute value of relative bias are, the higher the accuracy of constructed SM model is. Nine algorithms (i.e., random forest, generalized boosted regression, multiple linear regression, artificial neural network, generalized linear regression, conditional inference tree, eXtreme gradient boosting, support vector machines and recursive regression trees) were used to estimate SM in this research (Supplementary Tables S1, S2). The packages used in this study also included the randomForest, rpart, stats, e1071, gbm and rminer packages (Freund and Schapire, 1997; Breiman, 2001; Cortez, 2010; Han et al., 2022b; Tian and Fu, 2022). Both the gbm and gbm.perf functions of the gbm package were used to conduct generalized boosted regression models of SM. The gbm.perf function optimized the trees used in the generalized boosted regression SM models. All the statistical analyses were performed using R version 4.1.2.
3 Results
3.1 Main parameters of the nine algorithms
Among the constructed recursive regression tree, random forest, and multiple linear regression models, random forest models had the highest abilities in explaining the SM variation, but the multiple linear regression models had the lowest abilities in explaining the SM variation (Supplementary Tables S1, S2). Among the constructed random forest, generalized boosted regression and support vector machine models, the generalized boosted regression models had the greatest trees, but support vector machine models had the lowest support vectors (Supplementary Table S1). The error values among the conditional inference tree, artificial neural network, generalized linear regression and eXtreme gradient boosting models were comparable (Supplementary Table S2). The error values of the constructed eXtreme gradient boosting models for SMp at 10–20 cm depth and SMa at 0–10 and 10–20 cm depths were greatest (Supplementary Tables S2). The error values of the constructed conditional inference tree models for SMp at 0–10 cm depth and SMa at 0–10 and 10–20 cm depths were lowest (Supplementary Tables S2).
3.2 Accuracy evaluation for the nine algorithms
The slopes between simulated SM based on the eXtreme gradient boosting algorithm and observed SM were the most far away from one among the nine algorithms (Figures 2, 3, 4, 5). The simulated SM based on the random forest algorithm explained the most SM variation at 0–10 cm depth among the nine algorithms (Figures 2, 3, 4, 5). The simulated SM based on the random forest algorithm and generalized boosted regression explained the more SM variation at 10–20 cm depth than the other seven algorithms (Figures 2, 3, 4, 5). Both the absolute values of relative bias, and RMSE values between the simulated SM based on the eXtreme gradient boosting algorithm and the observed SM were the largest among the nine algorithms (Table 1). In contrast, the absolute values of relative bias between the simulated SMp based on the random forest algorithm and the observed SMp were the lowest among the nine algorithms (Table 1). Similarly, the absolute values of relative bias between the simulated SMa based on the random forest algorithm and the observed SMa at 0–10 cm depth were the lowest among the nine algorithms (Table 1). In contrast, the absolute values of relative bias between the simulated SMa based on the generalized boosted regression and the observed SMa at 10–20 cm depth were the lowest among the algorithms (Table 1). The RMSE values between the simulated SM based on random forest algorithm and the observed SM were the lowest among the nine algorithms (Table 1).
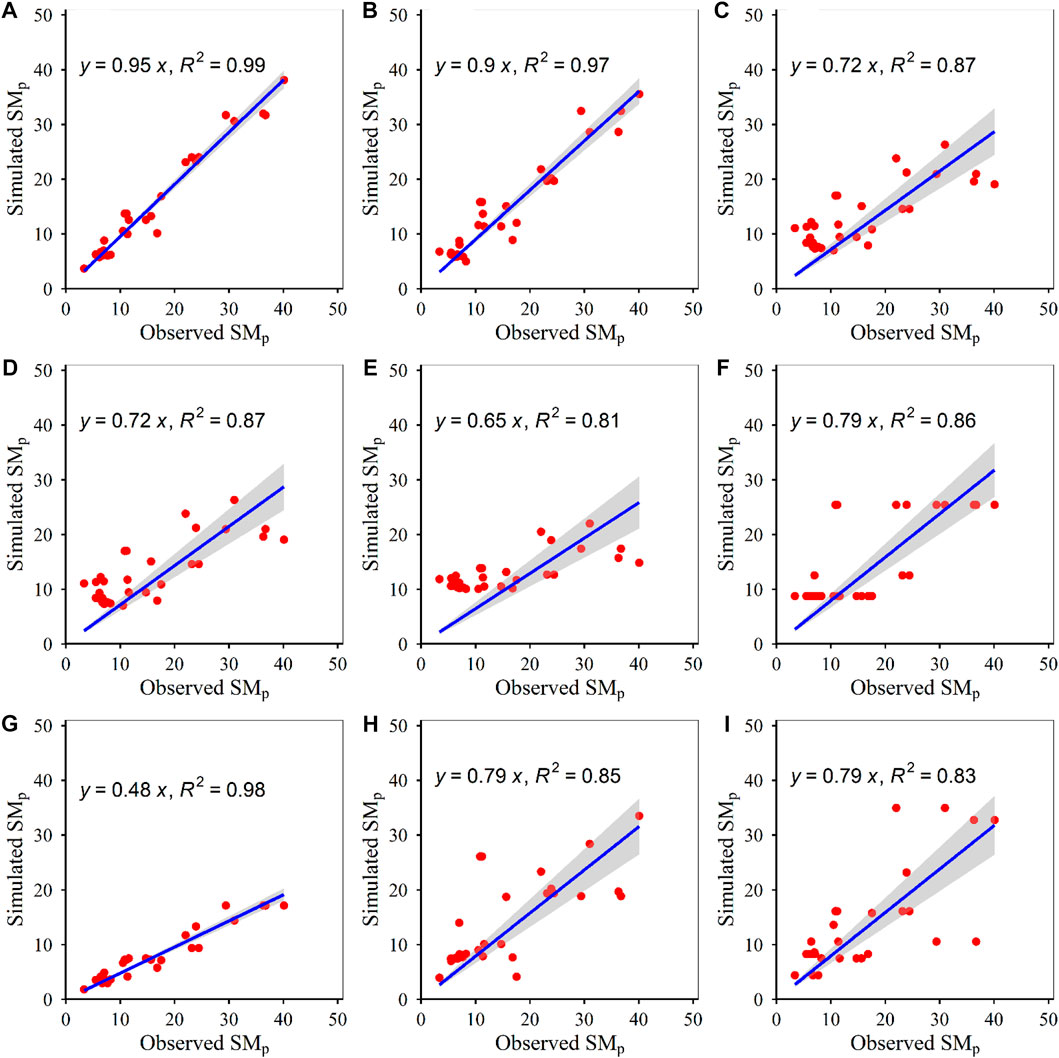
FIGURE 2. Relationships between simulated and observed potential soil moisture (SMp) at the depth of 0–10 cm for (A) random forest, (B) generalized boosted regression, (C) multiple linear regression, (D) artificial neural network, (E) generalized linear regression, (F) conditional inference tree, (G) eXtreme gradient boosting, (H) support vector machine and (I) recursive regression tree, respectively. The solid lines indicate the linear fitted lines between simulated and observed soil moisture. All the linear regressions were significant at p < 0.05. The intercepts were constrained to pass through zero.
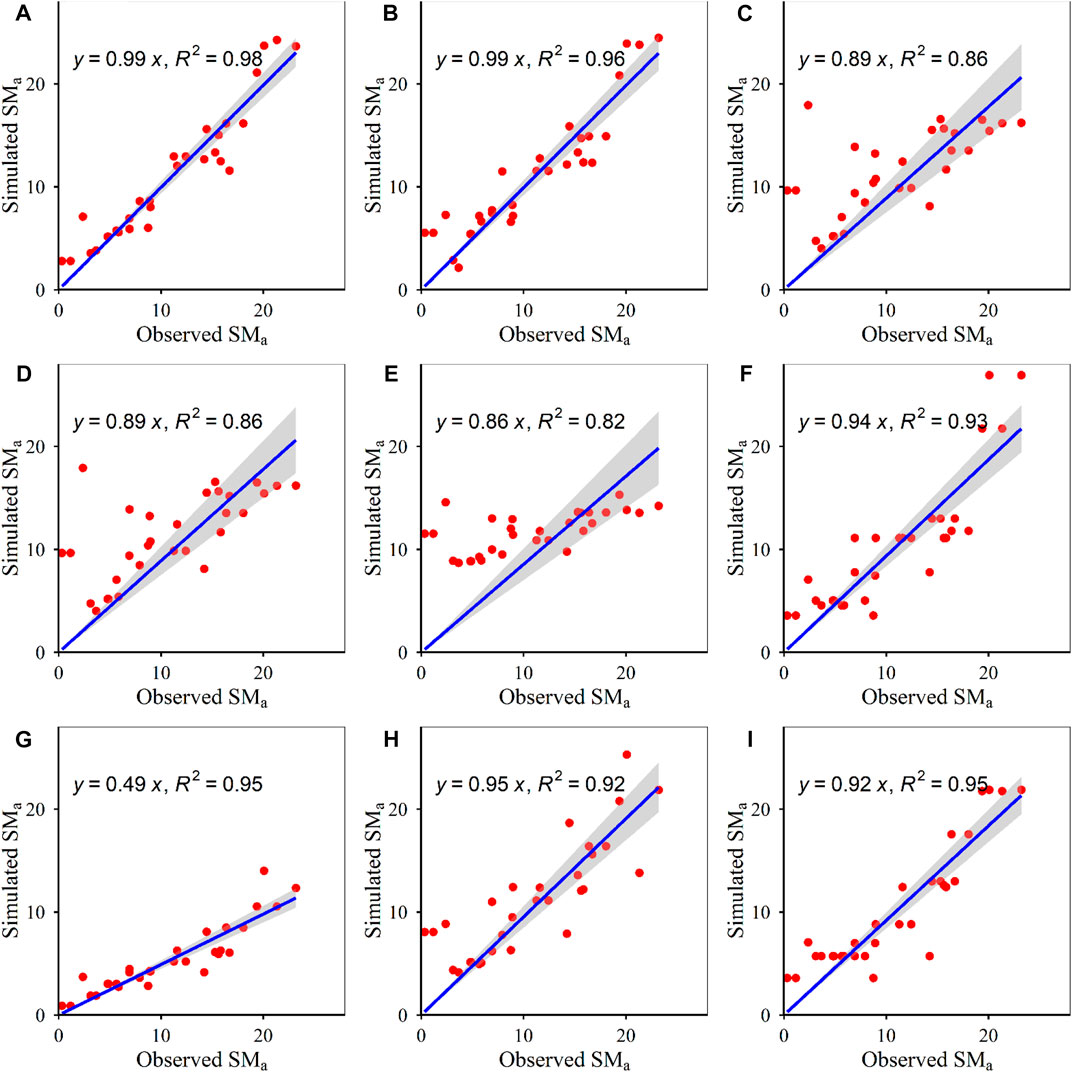
FIGURE 3. Relationships between simulated and observed actual soil moisture (SMa) at the depth of 0–10 cm for (A) random forest, (B) generalized boosted regression, (C) multiple linear regression, (D) artificial neural network, (E) generalized linear regression, (F) conditional inference tree, (G) eXtreme gradient boosting, (H) support vector machine and (I) recursive regression tree, respectively. The solid lines indicate the linear fitted lines between simulated and observed soil moisture. All the linear regressions were significant at p < 0.05. The intercepts were constrained to pass through zero.
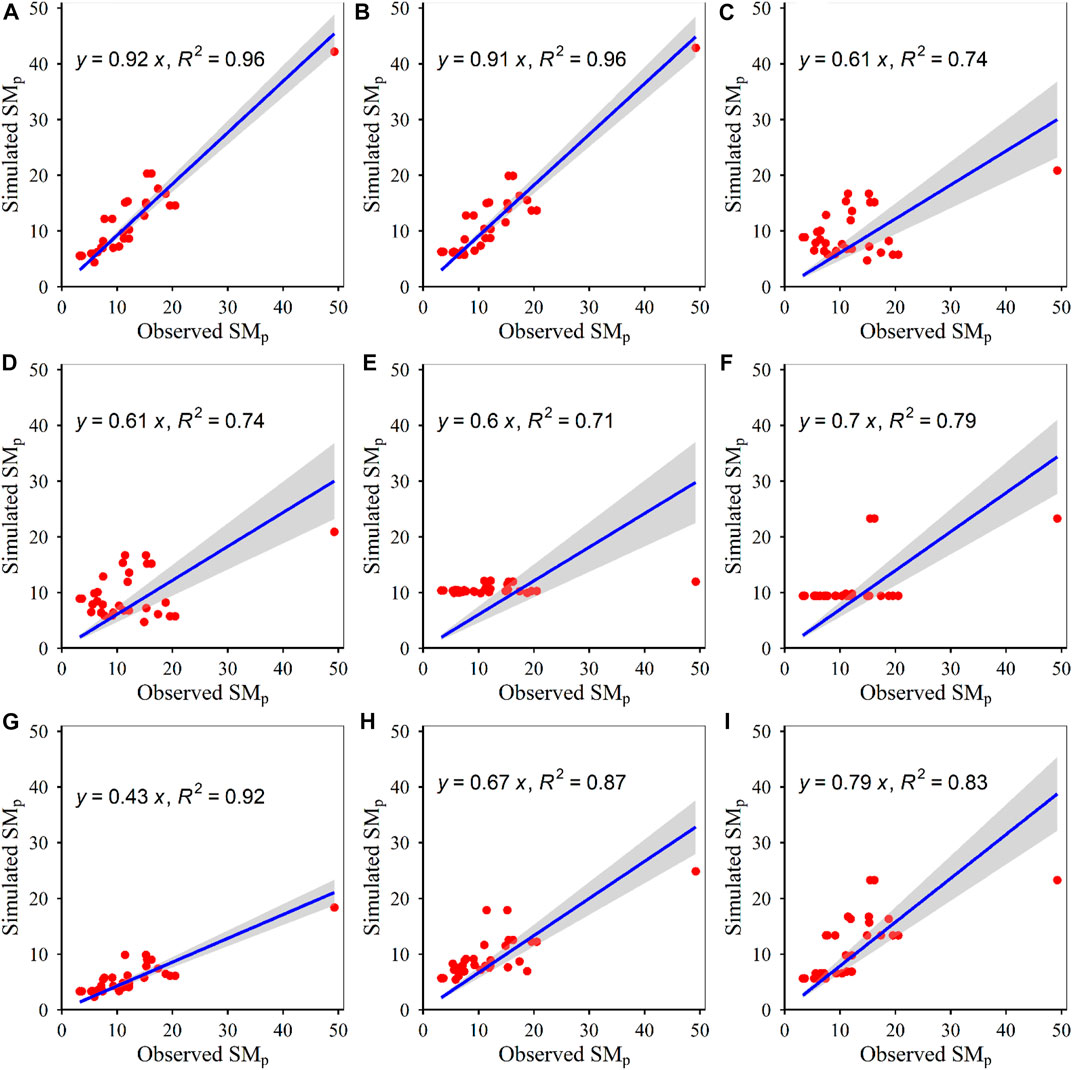
FIGURE 4. Relationships between simulated and observed potential soil moisture (SMp) at the depth of 10–20 cm for (A) random forest, (B) generalized boosted regression, (C) multiple linear regression, (D) artificial neural network, (E) generalized linear regression, (F) conditional inference tree, (G) eXtreme gradient boosting, (H) support vector machine and (I) recursive regression tree, respectively. The solid lines indicate the linear fitted lines between simulated and observed soil moisture. All the linear regressions were significant at p < 0.05. The intercepts were constrained to pass through zero.
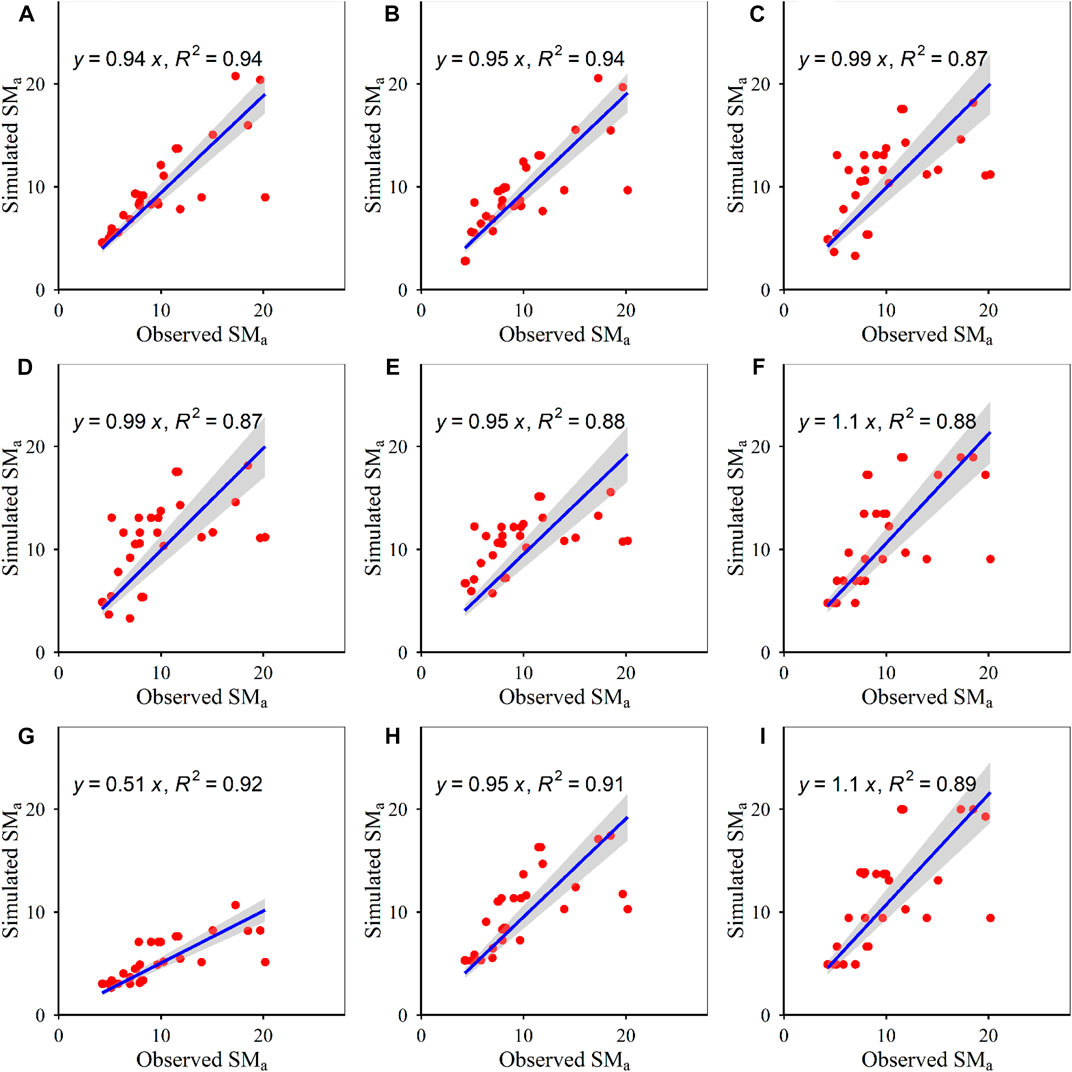
FIGURE 5. Relationships between simulated and observed actual soil moisture (SMa) at the depth of 10–20 cm for (A) random forest, (B) generalized boosted regression, (C) multiple linear regression, (D) artificial neural network, (E) generalized linear regression, (F) conditional inference tree, (G) eXtreme gradient boosting, (H) support vector machine and (I) recursive regression tree, respectively. The solid lines indicate the linear fitted lines between simulated and observed soil moisture. All the linear regressions were significant at p < 0.05. The intercepts were constrained to pass through zero.
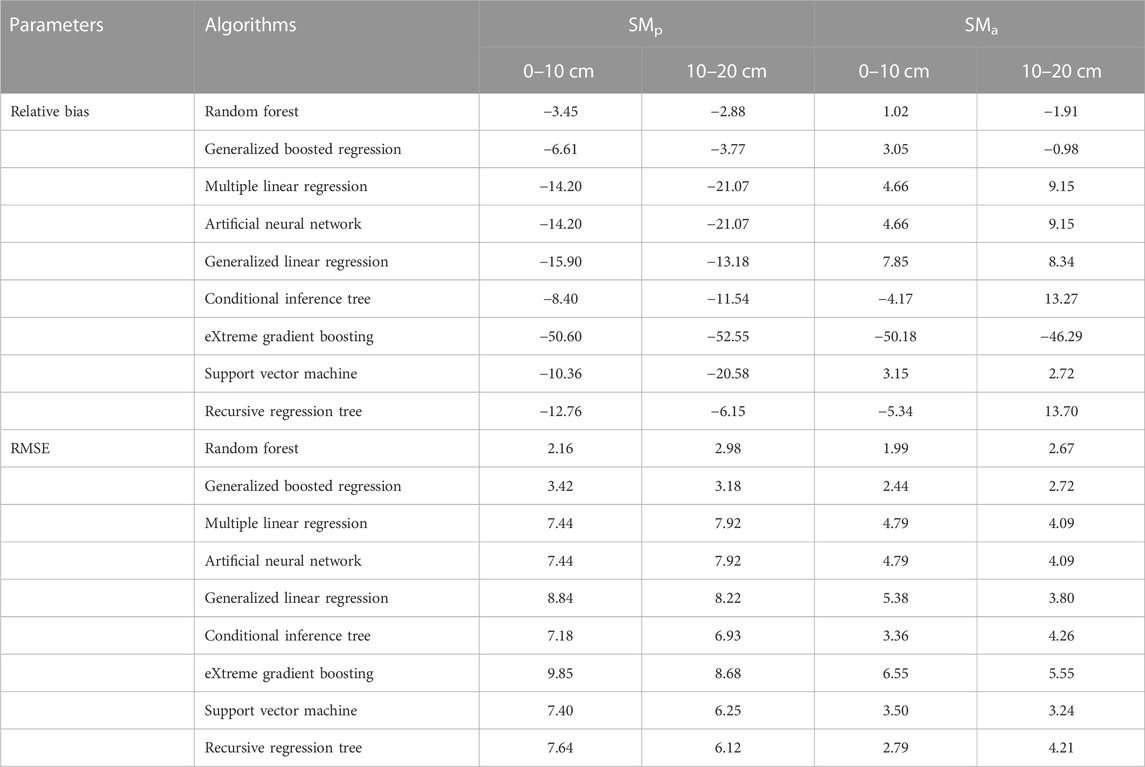
TABLE 1. The relative bias (%) and RMSE values between simulated and observed SM (n = 30).
4 Discussion
Besides the NDVI, there are several other variables (e.g., NDMI: normalized difference moisture index, slope, aspect or topographic position index) that rely on remote sensing technology. However, we only combined the NDVI and three meteorological variables to simulate SMa in this study. The reasons for this are as follows. We can download the NDVI product for free, which is not the case for every variable (e.g., NDMI derived from near-infrared and short-wave infrared reflectance). Although the NDVI may suffer from saturation effects, this phenomenon is not common in the grassland system regions of Tibet (Wang et al., 2015; Fu and Shen, 2017; Fu et al., 2019; Han et al., 2022b; Fu et al., 2022; Tian and Fu, 2022), especially for the sampling sites in this study (the maximum of NDVI value was 0.8016). Although slope, aspect, longitude, latitude and elevation may be correlated with SM (Sun et al., 2022; Zhang and Fu, 2022), these variables do not change, at least not in the short-term, and may not even change at all. Thus, they are less able to indicate temporal variation (e.g., inter-annual variation and seasonal variation) in SM. Multiple years of SM data may have been collected at the same sampling point in this study. Moreover, these four independent variables (i.e., temperature, precipitation, radiation and NDVI) can estimate ≥ 87% of the SM variation based on random forest (Supplementary Table S1). The constructed random forest SMa models using air temperature, precipitation, radiation and the NDVI had adequate predicted accuracies (RMSE ≤ 2.67, absolute value of relative bias ≤ 1.91%) (Table 1).
Our finding was in accordance with some previous studies which demonstrated that random forest models had the better performance than other models (Wang et al., 2022a; Das et al., 2022; Kisekka et al., 2022). For example, the correlation coefficient (R = 0.71) between the constructed SM from the random forest models and observed SM was greater than that (R = 0.55) between the constructed SM from the geostatistics technique models and observed SM for the Maqu area (Tong et al., 2021). This phenomenon may be due to their different model parameters and algorithms (Han et al., 2022b; Tian and Fu, 2022). For example, both random forest and support-vector machine provide some users-adjusted model parameters, but multiple linear regression does not provide (Han et al., 2022b; Tian and Fu, 2022). The predicted accuracies of SM estimation based on the constructed random forest models in this study were no lower than those found in earlier studies performed on (Zeng et al., 2015; Bai et al., 2017; Deng et al., 2018; Tong et al., 2021; Wu and Wen, 2022) and beyond (Zormand et al., 2017; Ma et al., 2020; Yuan et al., 2020; Zhang et al., 2022a; Wang et al., 2022c; Jarray et al., 2022; Manninen et al., 2022; Zeyliger et al., 2022) Tibetan Plateau. For example, an earlier study demonstrated that SM at the depth of 0–10 cm, according to the global land data assimilation system (GLDAS) Noah, can only explain about 71% of the variation in observed SM at the depth of 0–10 cm in Naqu, and the RMSE values between the GLDAS Noah and observed SM were 4.47–5.03 (Chen et al., 2021a). The AMSR2, SMAP, GLDAS-Noah and ERA5 SM can only explain < 85% of the variation in observed SM on Tibetan Plateau (Li et al., 2022). Simulated SM from data assimilation of multisource remote sensing can only explain about ≤ 75% of the variation in observed SM on Tibetan Plateau (Chen et al., 2021b). Estimated SM based on the TVDI method can only explain < 71% of the variation in observed SM on Tibetan Plateau (Yang et al., 2017). Estimated SM based on the constructed artificial neural network model only explained ≤ 80% of the variation in observed SM on Tibetan Plateau (Cui et al., 2016; Cui et al., 2019), and only explained about 37% of the variation in observed SM in the Xiliaohe River Basin (Guo et al., 2022). Estimated SM based on the random forest models can only explain < 65% of the variation in observed SM at the global scale (Lei et al., 2022). Estimated SM based on the extreme gradient boosting regression, CatBoost gradient boosting regression, random forest regression and support vector machine can explain about 89%, 79%, 37% and 49%, respectively, of the variation in observed SM in the cropland area of Western Australia (Nguyen et al., 2022). Therefore, the constructed random forest can be used to monitor SM changes under the disturbances of climate change and human activities, at least for Tibetan grassland systems.
Since the data used in this study were only obtained from Tibet, it means that when the models constructed in this study were extrapolated to the regions outside Tibet, it needed to be careful, or it needed to be further checked for accuracy. Therefore, we need to further carry out research in areas outside Tibet. Moreover, the uncertainty of NDVI data (Decuyper et al., 2020; Shen et al., 2020; Shen et al., 2022) may also cause some uncertainties for the models of SM constructed by this study. The probable spatial-temporal mismatch between dependent and independent variables may also result in some uncertainty (Han et al., 2022b; Tian and Fu, 2022).
5 Conclusion
In summary, our study was the first to attempt to validate that the use of climate data and the NDVI to estimate the variation in observed SM in Tibetan grassland systems at two depths of 0–10 cm and 10–20 cm based on nine algorithms. The climate data utilized to estimate SMp variation included air temperature, precipitation and radiation. Air temperature, precipitation, radiation and the NDVI were used to estimate SMa variation. The efficiencies of the nine algorithms in estimating SM variation varied. Overall, the random forest models had the strongest ability to estimate SM variation. In contrast, the eXtreme gradient boosting models had the worst ability to estimate SM variation. About 94%–99% of the variation in observed SM can be explained by the simulated SM based on the random forest models. The slopes between the simulated SM based on random forest models and observed the SM were 0.92–0.99. The RMSE values between the simulated SM based on the random forest models and the observed SM were ≤ 2.98. In contrast, the RMSE values between the simulated SM based on the eXtreme gradient boosting models and the observed SM were ≥ 5.55. The absolute values of relative biases between observed SM and simulated SM based on the random forest models were ≤ 3.45%. In contrast, the absolute values of relative biases between observed SM and simulated SM based on the eXtreme gradient boosting models were ≥ 46.29%. Thus, climate data and the NDVI cannot always be used to estimate the variation in observed SM, depending on the algorithms chosen. The constructed random forest models of SMp using air temperature, precipitation and radiation, and the constructed random forest models of SMa using air temperature, precipitation, radiation and NDVI can be used to solve several ecological and environmental problems related to SM (e.g., the impacts of climate change on plant productivity and soil carbon pool due to variation in SM), at least for Tibetan grassland systems.
Data availability statement
The original contributions presented in the study are included in the article/Supplementary Material, further inquiries can be directed to the corresponding author.
Author contributions
Conceptualization, GF and SW; methodology, GF; software, SW; validation, GF; formal analysis, GF and SW; investigation, GF; resources, SW; data curation, GF; writing—original draft preparation, GF and SW; writing—review and editing, GF and SW; visualization, SW; supervision, SW; project administration, SW; funding acquisition, GF and SW.
Funding
This research was funded by Youth Innovation Promotion Association of Chinese Academy of Sciences [2020054], National Natural Science Foundation of China [31600432], Bingwei Outstanding Young Talents Program of Institute of Geographic Sciences and Natural Resources Research, Chinese Academy of Sciences [2018RC202], Science and Technology Project of Tibet Autonomous Region [XZ202101ZD0003N,XZ202101ZD0007G, XZ202201ZY0003N, XZ202202YD0009C], STS Project of Chinese Academy of Sciences [KFJ-STS-QYZD-2021-22-003], and Construction of Fixed Observation and Experimental Station of First and Try Support System for Agricultural Green Development in Zhongba County.
Conflict of interest
The authors declare that the research was conducted in the absence of any commercial or financial relationships that could be construed as a potential conflict of interest.
Publisher’s note
All claims expressed in this article are solely those of the authors and do not necessarily represent those of their affiliated organizations, or those of the publisher, the editors and the reviewers. Any product that may be evaluated in this article, or claim that may be made by its manufacturer, is not guaranteed or endorsed by the publisher.
Supplementary material
The Supplementary Material for this article can be found online at: https://www.frontiersin.org/articles/10.3389/fenvs.2023.1130448/full#supplementary-material
References
Ali, S., Tong, D. M., Xu, Z. T., Henchiri, M., Wilson, K., Shi, S. Q., et al. (2019). Characterization of drought monitoring events through MODIS-and TRMM-based DSI and TVDI over South Asia during 2001-2017. Environ. Sci. Pollut. Res. 26, 33568–33581. doi:10.1007/s11356-019-06500-4
Bai, X. J., He, B. B., Li, X., Zeng, J. Y., Wang, X., Wang, Z. L., et al. (2017). First assessment of sentinel-1A data for surface soil moisture estimations using a coupled water cloud model and advanced integral equation model over the Tibetan plateau. Remote Sens. 9, 714. doi:10.3390/rs9070714
Bao, Q., Liu, Y. M., Shi, J. C., and Wu, G. X. (2010). Comparisons of soil moisture datasets over the Tibetan Plateau and application to the simulation of Asia summer monsoon onset. Adv. Atmos. Sci. 27, 303–314. doi:10.1007/s00376-009-8132-5
Bi, H. Y., Ma, J. W., Zheng, W. J., and Zeng, J. Y. (2016). Comparison of soil moisture in GLDAS model simulations and in situ observations over the Tibetan Plateau. J. Geophys. Research-Atmospheres 121, 2658–2678. doi:10.1002/2015jd024131
Chen, T., Gu, Z. S., Dai, H., and Ma, P. F. (2021). Applicability evaluation of soil moisture from CMIP6 in Tibetan Plateau. Plateau Mt. Meteorology Res. 41, 41–48.
Chen, W. J., Huang, C. L., Yang, Z. L., and Zhang, Y. (2021). Retrieving accurate soil moisture over the Tibetan plateau using multisource remote sensing data assimilation with simultaneous state and parameter estimations. J. Hydrometeorol. 22, 2751–2766. doi:10.1175/jhm-d-20-0298.1
Chen, Y. Y., Yang, K., Qin, J., Zhao, L., Tang, W. J., and Han, M. L. (2013). Evaluation of AMSR-E retrievals and GLDAS simulations against observations of a soil moisture network on the central Tibetan Plateau. J. Geophys. Research-Atmospheres 118, 4466–4475. doi:10.1002/jgrd.50301
Cheng, M. L., Zhong, L., Ma, Y. M., Zou, M. J., Ge, N., Wang, X., et al. (2019). A study on the assessment of multi-source satellite soil moisture products and reanalysis data for the Tibetan plateau. Remote Sens. 11, 1196. doi:10.3390/rs11101196
Cortez, P. (2010). “Data mining with neural networks and support vector machines using the R/rminer tool,” in Proceedings of the 10th Industrial Conference on Data Mining, Berlin, Germany, 2010 Jul 12-14, 572–583.
Cui, Y. K., Long, D., Hong, Y., Zeng, C., Zhou, J., Han, Z. Y., et al. (2016). Validation and reconstruction of FY-3B/MWRI soil moisture using an artificial neural network based on reconstructed MODIS optical products over the Tibetan Plateau. J. Hydrol. 543, 242–254. doi:10.1016/j.jhydrol.2016.10.005
Cui, Y. K., Xiong, W. T., Hu, L., Liu, R. H., Chen, X., Geng, X. Z., et al. (2019). “Ieee. Applying a machine learning method to obtain long time and spatio-temporal continuous soil moisture over the Tibetan Plateau,” in Proceedings of the IEEE International Geoscience and Remote Sensing Symposium (IGARSS), Yokohama, Japan, Jul 28-Aug 02, 2019, 6986–6989.
Das, B., Rathore, P., Roy, D., Chakraborty, D., Jatav, R. S., Sethi, D., et al. (2022). Comparison of bagging, boosting and stacking algorithms for surface soil moisture mapping using optical-thermal-microwave remote sensing synergies. Catena 217, 106485. doi:10.1016/j.catena.2022.106485
Decuyper, M., Chavez, R. O., Cufar, K., Estay, S. A., Clevers, J. G. P. W., Prislan, P., et al. (2020). Spatio-temporal assessment of beech growth in relation to climate extremes in Slovenia - an integrated approach using remote sensing and tree-ring data. Agr. For. Meteorol. 287, 107925. doi:10.1016/j.agrformet.2020.107925
Deng, M. S., Meng, X. H., Ma, Y. S., and An, Y. Y. (2018). Analysis on soil moisture characteristics of Tibetan Plateau based on GLDAS. J. Arid Meteorology 36, 595602.
Fitriyah, A., Fatikhunnada, A., Okura, F., Nugroho, B. D. A., and Kato, T. (2019). Analysis of the drought mitigated mechanism in terraced paddy fields using CWSI and TVDI indices and hydrological monitoring. Sustainability 11, 6897. doi:10.3390/su11246897
Freund, Y., and Schapire, R. E. (1997). A decision-theoretic generalization of on-line learning and an application to boosting. J. Comput. Syst. Sci. 55, 119–139. doi:10.1006/jcss.1997.1504
Fu, G., Li, S. W., Sun, W., and Shen, Z. X. (2016). Relationships between vegetation carbon use efficiency and climatic factors on the Tibetan Plateau. Can. J. Remote Sens. 42, 16–26. doi:10.1080/07038992.2016.1131115
Fu, G., and Shen, Z. (2022). Asymmetrical warming of growing/non-growing season increases soil respiration during growing season in an alpine meadow. Sci. Total Environ. 2022, 152591. doi:10.1016/j.scitotenv.2021.15259110.1016/j.scitotenv.2021.152591
Fu, G., and Shen, Z. X. (2017). Clipping has stronger effects on plant production than does warming in three alpine meadow sites on the Northern Tibetan Plateau. Sci. Rep. 7, 16330. doi:10.1038/s41598-017-16645-2
Fu, G., and Shen, Z. X. (2016). Response of alpine plants to nitrogen addition on the Tibetan plateau: A meta-analysis. J. Plant Growth Regul. 35, 974–979. doi:10.1007/s00344-016-9595-0
Fu, G., Shen, Z. X., and Zhang, X. Z. (2018). Increased precipitation has stronger effects on plant production of an alpine meadow than does experimental warming in the Northern Tibetan Plateau. Agr. For. Meteorol. 249, 11–21. doi:10.1016/j.agrformet.2017.11.017
Fu, G., Shen, Z. X., Zhang, X. Z., Shi, P. L., Zhang, Y. J., and Wu, J. S. (2011). Estimating air temperature of an alpine meadow on the Northern Tibetan Plateau using MODIS land surface temperature. Acta Ecol. Sin. 31, 8–13. doi:10.1016/j.chnaes.2010.11.002
Fu, G., Shen, Z. X., Zhang, X. Z., and Zhou, Y. T. (2012). Response of soil microbial biomass to short-term experimental warming in alpine meadow on the Tibetan Plateau. Appl. Soil Ecol. 61, 158–160. doi:10.1016/j.apsoil.2012.05.002
Fu, G., Sun, W., Li, S. W., Zhang, J., Yu, C. Q., and Zhenxi, S. (2017). Modeling aboveground biomass using MODIS images and climatic data in grasslands on the Tibetan Plateau. J. Resour. Ecol. 8, 42–49. doi:10.5814/j.issn.1674-764x.2017.01.006
Fu, G., and Sun, W. (2022). Temperature sensitivities of vegetation indices and aboveground biomass are primarily linked with warming magnitude in high-cold grasslands. Sci. Total Environ. 2022, 157002. doi:10.1016/j.scitotenv.2022.15700210.1016/j.scitotenv.2022.157002
Fu, G., Wang, J., and Li, S. (2022). Response of forage nutritional quality to climate change and human activities in alpine grasslands. Sci. Total Environ. 2022, 157552. doi:10.1016/j.scitotenv.2022.15755210.1016/j.scitotenv.2022.157552
Fu, G., Zhang, H. R., and Sun, W. (2019). Response of plant production to growing/non-growing season asymmetric warming in an alpine meadow of the Northern Tibetan Plateau. Sci. Total Environ. 650, 2666–2673. doi:10.1016/j.scitotenv.2018.09.384
Guo, X. M., Fang, X. Q., Yang, L. L., and Cao, Y. (2022). Estimation of root zone soil moisture in the Xiliaohe River Basin based on artificial neural network. Remote Sens. Nat. Resour. doi:10.6046/zrzyyg.2022108
Han, F., Fu, G., Yu, C., and Wang, S. (2022). Modeling nutrition quality and storage of forage using climate data and normalized-difference vegetation index in alpine grasslands. Remote Sens. 14, 3410. doi:10.3390/rs1414341010.3390/rs14143410
Han, F. S., Yu, C. Q., and Fu, G. (2022). Warming alters elevation distributions of soil bacterial and fungal communities in alpine grasslands. Glob. Ecol. Conserv. 39, e02306. doi:10.1016/j.gecco.2022.e0230610.1016/j.gecco.2022.e02306
He, B. H., Jia, B. Y., Zhao, Y. H., Wang, X., Wei, M., and Dietzel, R. (2022). Estimate soil moisture of maize by combining support vector machine and chaotic whale optimization algorithm. Agric. Water Manage. 2022, 107618. doi:10.1016/j.agwat.2022.107618
Jarray, N., Ben Abbes, A., Rhif, M., Dhaou, H., Ouessar, M., and Farah, I. R. (2022). SMETool: A web-based tool for soil moisture estimation based on eo-learn framework and machine learning methods. Environ. Model. Softw. 157, 105505. doi:10.1016/j.envsoft.2022.105505
Karthikeyan, L., Pan, M., Wanders, N., Kumar, D. N., and Wood, E. F. (2017). Four decades of microwave satellite soil moisture observations: Part 2. Product validation and inter-satellite comparisons. Adv. Water Resour. 109, 236–252. doi:10.1016/j.advwatres.2017.09.010
Kisekka, I., Peddinti, S. R., Kustas, W. P., McElrone, A. J., Bambach-Ortiz, N., McKee, L., et al. (2022). Spatial-temporal modeling of root zone soil moisture dynamics in a vineyard using machine learning and remote sensing. Irrigation Sci. 40, 761–777. doi:10.1007/s00271-022-00775-1
Klein, J. A., Harte, J., and Zhao, X. Q. (2005). Dynamic and complex microclimate responses to warming and grazing manipulations. Glob. Change Biol. 11, 1440–1451. doi:10.1111/j.1365-2486.2005.00994.x
Lee, J., Park, S., Im, J., Yoo, C., and Seo, E. (2022). Improved soil moisture estimation: Synergistic use of satellite observations and land surface models over CONUS based on machine learning. J. Hydrol. 2022, 127749. doi:10.1016/j.jhydrol.2022.127749
Lei, F. N., Senyurek, V., Kurum, M., Gurbuz, A. C., Boyd, D., Moorhead, R., et al. (2022). Quasi-global machine learning-based soil moisture estimates at high spatio-temporal scales using CYGNSS and SMAP observations. Remote Sens. Environ. 2022, 113041. doi:10.1016/j.rse.2022.113041
Li, N., Zhou, C. Y., and Zhao, P. (2022). The validation of soil moisture from various sources and its influence factors in the Tibetan plateau. Remote Sens. 14, 4109. doi:10.3390/rs14164109
Liu, Y. X. Y., and Yang, Y. P. (2022). Multi-depth evolution characteristics of soil moisture over the Tibetan Plateau in the past 70 years using reanalysis products. Front. Environ. Sci. 10, 10. doi:10.3389/fenvs.2022.979853
Ma, C. F., Li, X., and McCabe, M. F. (2020). Retrieval of high-resolution soil moisture through combination of sentinel-1 and sentinel-2 data. Remote Sens. 12, 2303. doi:10.3390/rs12142303
Manninen, T., Jaaskelainen, E., Lohila, A., Korkiakoski, M., Rasanen, A., Virtanen, T., et al. (2022). Very high spatial resolution soil moisture observation of heterogeneous subarctic catchment using nonlocal averaging and multitemporal SAR data. IEEE Trans. Geosci. Remote Sens. 60, 1–17. doi:10.1109/tgrs.2021.3109695
Meng, X., Li, R., Luan, L., Lyu, S., Zhang, T., Ao, Y., et al. (2018). Detecting hydrological consistency between soil moisture and precipitation and changes of soil moisture in summer over the Tibetan Plateau. Clim. Dyn. 51, 4157–4168. doi:10.1007/s00382-017-3646-5
Naeimi, V., Scipal, K., Bartalis, Z., Hasenauer, S., and Wagner, W. (2009). An improved soil moisture retrieval algorithm for ERS and METOP scatterometer observations. IEEE Trans. Geosci. Remote Sens. 47, 1999–2013. doi:10.1109/tgrs.2008.2011617
Nguyen, T. T., Ngo, H. H., Guo, W. S., Chang, S. W., Nguyen, D. D., Nguyen, C. T., et al. (2022). A low-cost approach for soil moisture prediction using multi-sensor data and machine learning algorithm. Sci. Total Environ. 833, 155066. doi:10.1016/j.scitotenv.2022.155066
Phan, V. H., Dinh, V. T., and Su, Z. B. (2020). Trends in long-term drought changes in the mekong river delta of vietnam. Remote Sens. 12, 2974. doi:10.3390/rs12182974
Sandholt, I., Rasmussen, K., and Andersen, J. (2002). A simple interpretation of the surface temperature/vegetation index space for assessment of surface moisture status. Remote Sens. Environ. 79, 213–224. doi:10.1016/s0034-4257(01)00274-7
Schmugge, T. J., Jackson, T. J., and McKim, H. L. (1980). Survey of methods for soil moisture determination. Water Resour. Res. 16, 961–979. doi:10.1029/WR016i006p00961
Shen, X., Liu, B., Henderson, M., Wang, L., Jiang, M., and Lu, X. (2022). Vegetation greening, extended growing seasons, and temperature feedbacks in warming temperate grasslands of China. J. Clim. 35, 5103–5117. doi:10.1175/jcli-d-21-0325.1
Shen, X., Liu, B., Jiang, M., and Lu, X. (2020). Marshland loss warms local land surface temperature in China. Geophys. Res. Lett. 47. doi:10.1029/2020gl087648
Shen, Z. X., Fu, G., Yu, C. Q., Sun, W., and Zhang, X. Z. (2014). Relationship between the growing season maximum enhanced vegetation index and climatic factors on the Tibetan Plateau. Remote Sens. 6, 6765–6789. doi:10.3390/rs6086765
Shen, Z. X., Li, Y. L., and Fu, G. (2015). Response of soil respiration to short-term experimental warming and precipitation pulses over the growing season in an alpine meadow on the Northern Tibet. Appl. Soil Ecol. 90, 35–40. doi:10.1016/j.apsoil.2015.01.015
Shen, Z. X., Wang, J. W., Sun, W., Li, S. W., Fu, G., Zhang, X. Z., et al. (2016). The soil drying along the increase of warming masks the relation between temperature and soil respiration in an alpine meadow of northern Tibet. Pol. J. Ecol. 64, 125–129. doi:10.3161/15052249pje2016.64.1.011
Sun, S. B., Chen, B. Z., Chen, J., Che, M. L., and Zhang, H. F. (2016). Comparison of remotely-sensed and modeled soil moisture using CLM4.0 with in situ measurements in the central Tibetan Plateau area. Cold Reg. Sci. Technol. 129, 31–44. doi:10.1016/j.coldregions.2016.06.005
Sun, W., Li, S., Wang, J., and Fu, G. (2021). Effects of grazing on plant species and phylogenetic diversity in alpine grasslands, Northern Tibet. Ecol. Eng. 2021, 106331. doi:10.1016/j.ecoleng.2021.10633110.1016/j.ecoleng.2021.106331
Sun, W., Qi, H., and Fu, G. (2022). Response of vegetation precipitation use efficiency to experimental warming in alpine grasslands of Northern Tibet. Pratacultural Sci. 39, 1069–1079. doi:10.11829/j.issn.1001-0629.2021-0637
Tian, Y., and Fu, G. (2022). Quantifying plant species α-diversity using normalized difference vegetation index and climate data in alpine grasslands. Remote Sens. 14, 5007. doi:10.3390/rs1419500710.3390/rs14195007
Tong, C., Wang, H. Q., Magagi, R., Goita, K., and Wang, K. (2021). Spatial gap-filling of SMAP soil moisture pixels over Tibetan plateau via machine learning versus geostatistics. Ieee J. Sel. Top. Appl. Earth Observations Remote Sens. 14, 9899–9912. doi:10.1109/jstars.2021.3112623
Tramblay, Y., and Segui, P. Q. (2022). Estimating soil moisture conditions for drought monitoring with random forests and a simple soil moisture accounting scheme. Nat. Hazards Earth Syst. Sci. 22, 1325–1334. doi:10.5194/nhess-22-1325-2022
Ullah, W., Wang, G. J., Gao, Z. Q., Hagan, D. F. T., and Lou, D. (2018). Comparisons of remote sensing and reanalysis soil moisture products over the Tibetan Plateau, China. Cold Reg. Sci. Technol. 146, 110–121. doi:10.1016/j.coldregions.2017.12.003
Uthayakumar, A., Mohan, M. P., Khoo, E. H., Jimeno, J., Siyal, M. Y., and Karim, M. F. (2022). Machine learning models for enhanced estimation of soil moisture using wideband radar sensor. Sensors 22, 5810. doi:10.3390/s22155810
van der Velde, R., Salama, M. S., Pellarin, T., Ofwono, M., Ma, Y., and Su, Z. (2014). Long term soil moisture mapping over the Tibetan plateau using Special Sensor Microwave/Imager. Hydrology Earth Syst. Sci. 18, 1323–1337. doi:10.5194/hess-18-1323-2014
Veloso, M. F., Rodrigues, L. N., and Fernandes, E. I. (2022). Evaluation of machine learning algorithms in the prediction of hydraulic conductivity and soil moisture at the Brazilian Savannah. Geoderma Reg. 30, e00569. doi:10.1016/j.geodrs.2022.e00569
Wang, J. J., Wu, F., Shang, J. L., Zhou, Q., Ahmad, I., and Zhou, G. S. (2022). Saline soil moisture mapping using Sentinel-1A synthetic aperture radar data and machine learning algorithms in humid region of China's East Coast. Catena 213, 106189. doi:10.1016/j.catena.2022.106189
Wang, J., Li, M., Yu, C., and Fu, G. (2022). The change in environmental variables linked to climate change has a stronger effect on aboveground net primary productivity than does phenological change in alpine grasslands. Front. Plant Sci. 12, 798633. doi:10.3389/fpls.2021.79863310.3389/fpls.2021.798633
Wang, J. W., Yu, C. Q., and Fu, G. (2021). Asymmetrical warming between elevations may result in similar plant community composition between elevations in alpine grasslands. Front. Ecol. Evol. 9. doi:10.3389/fevo.2021.75794310.3389/fevo.2021.757943
Wang, J., Yu, C., and Fu, G. (2021). Warming reconstructs the elevation distributions of aboveground net primary production, plant species and phylogenetic diversity in alpine grasslands. Ecol. Indic. 133, 108355. doi:10.1016/j.ecolind.2021.10835510.1016/j.ecolind.2021.108355
Wang, L., Fang, S. B., Pei, Z. F., Wu, D., Zhu, Y. C., and Zhuo, W. (2022). Developing machine learning models with multisource inputs for improved land surface soil moisture in China. Comput. Electron. Agric. 192, 106623. doi:10.1016/j.compag.2021.106623
Wang, Q., van der Velde, R., Ferrazzoli, P., Chen, X. L., Bai, X. J., and Su, Z. B. (2019). Mapping soil moisture across the Tibetan Plateau plains using Aquarius active and passive L-band microwave observations. Int. J. Appl. Earth Obs. Geoinf. 77, 108–118. doi:10.1016/j.jag.2019.01.005
Wang, S. H., Sun, W., Li, S. W., Shen, Z. X., and Fu, G. (2015). Interannual variation of the growing season maximum normalized difference vegetation index, MNDVI, and its relationship with climatic factors on the Tibetan Plateau. Pol. J. Ecol. 63, 424–439. doi:10.3161/15052249pje2015.63.3.012
Wei, C., Weng, F., Wu, S., Wu, D., and Zhang, P. (2022). Retrieval of soil moisture from FengYun-3D microwave radiation imager operational and recalibrated data using random forest regression. Atmosphere 13, 637. doi:10.3390/atmos13040637
Wu, X. J., and Wen, J. (2022). Recent progress on modeling land emission and retrieving soil moisture on the Tibetan plateau based on L-band passive microwave remote sensing. Remote Sens. 14, 4191. doi:10.3390/rs14174191
Yang, S. H., Li, R., Wu, T. H., Hu, G. J., Xiao, Y., Du, Y. Z., et al. (2020). Evaluation of reanalysis soil temperature and soil moisture products in permafrost regions on the Qinghai-Tibetan Plateau. Geoderma 377, 114583. doi:10.1016/j.geoderma.2020.114583
Yang, T., Chen, X. W., Wei, W., Huang, Z. Q., Yang, Z. Y., and Jiang, L. L. (2017). Soil moisture retrieval in the Tibetan plateau using optical and passive microwave remote sensing data. Chin. J. Geophysics-Chinese Ed. 60, 2556–2567. doi:10.6038/cjg20170705
Yu, C. Q., Han, F. S., and Fu, G. (2019). Effects of 7 years experimental warming on soil bacterial and fungal community structure in the Northern Tibet alpine meadow at three elevations. Sci. Total Environ. 655, 814–822. doi:10.1016/j.scitotenv.2018.11.309
Yu, C. Q., Shen, Z. X., Zhang, X. Z., Sun, W., and Fu, G. (2014). Response of soil C and N, dissolved organic C and N, and inorganic N to short-term experimental warming in an Alpine meadow on the Tibetan Plateau. Sci. World J. 2014, 1–10. doi:10.1155/2014/15257610.1155/2014/152576
Yu, C. Q., Wang, J. W., Shen, Z. X., and Fu, G. (2019). Effects of experimental warming and increased precipitation on soil respiration in an alpine meadow in the Northern Tibetan Plateau. Sci. Total Environ. 647, 1490–1497. doi:10.1016/j.scitotenv.2018.08.111
Yuan, L. N., Li, L., Zhang, T., Chen, L. Q., Zhao, J. L., Hu, S., et al. (2020). Soil moisture estimation for the Chinese loess plateau using MODIS-derived ATI and TVDI. Remote Sens. 12, 3040. doi:10.3390/rs12183040
Zeng, J., Li, Z., Chen, Q., Bi, H., Qiu, J., and Zou, P. (2015). Evaluation of remotely sensed and reanalysis soil moisture products over the Tibetan Plateau using in-situ observations. Remote Sens. Environ. 163, 91–110. doi:10.1016/j.rse.2015.03.008
Zeyliger, A., Chinilin, A., and Ermolaeva, O. (2022). Spatial interpolation of gravimetric soil moisture using EM38-mk induction and ensemble machine learning (case study from dry steppe zone in volgograd region). Sensors 22, 6153. doi:10.3390/s22166153
Zhang, G., Shen, Z., and Fu, G. (2021). Function diversity of soil fungal community has little exclusive effects on the response of aboveground plant production to experimental warming in alpine grasslands. Appl. Soil Ecol. 168, 104153. doi:10.1016/j.apsoil.2021.10415310.1016/j.apsoil.2021.104153
Zhang, G., Shen, Z., and Fu, G. (2022). Geo-distribution patterns of soil fungal community of pennisetum flaccidum in Tibet. J. Fungi 8, 1230. doi:10.3390/jof8111230
Zhang, H., and Fu, G. (2022). Responses of phylogenetic diversity of soil fungal community to grazing in alpine grasslands of the Northern Tibet. Acta Agrestia Sin. 30, 21–28.
Zhang, H., and Fu, G. (2021). Responses of plant, soil bacterial and fungal communities to grazing vary with pasture seasons and grassland types, northern Tibet. Land Degrad. Dev. 32, 1821–1832. doi:10.1002/ldr.3835
Zhang, H., Li, S., Zhang, G., and Fu, G. (2020). Response of soil microbial communities to warming and clipping in alpine meadows in Northern Tibet. Sustainability 12, 5617. doi:10.3390/su1214561710.3390/su12145617
Zhang, Q., Fan, K. K., Singh, V. P., Sun, P., and Shi, P. J. (2018). Evaluation of remotely sensed and reanalysis soil moisture against in situ observations on the himalayan-Tibetan plateau. J. Geophys. Research-Atmospheres 123, 7132–7148. doi:10.1029/2017jd027763
Zhang, Y. Y., Chen, Y. B., Chen, L. F., Xu, S. C., and Sun, H. Z. (2022). A machine learning-based approach for generating high-resolution soil moisture from SMAP products. Geocarto Int., 1–22. doi:10.1080/10106049.2022.2105406
Zhao, C. H., Alateng, T., and Destech Publicat, I. (2014). “Retrieval of soil moisture in Mongolian plateau using MODIS data and temperature vegetation drought index (TVDI) method,” in Proceedings of the International Conference on GIS and Resource Management (ICGRM), Guangzhou, China, Jan 03-05, 2014, 292–300.
Zheng, D. H., van der Velde, R., Wen, J., Wang, X., Ferrazzoli, P., Schwank, M., et al. (2018). Assessment of the SMAP soil emission model and soil moisture retrieval algorithms for a Tibetan desert ecosystem. IEEE Trans. Geosci. Remote Sens. 56, 3786–3799. doi:10.1109/tgrs.2018.2811318
Zhong, Z., and Fu, G. (2022). Response of soil fungal species, phylogenetic and functional diversity to diurnal asymmetric warming in an alpine agricultural ecosystem. Agr. Ecosyst. Environ. 335, 107993. doi:10.1016/j.agee.2022.107993
Zhong, Z. M., Shen, Z. X., and Fu, G. (2016). Response of soil respiration to experimental warming in a highland barley of the Tibet. SpringerPlus 5, 137. doi:10.1186/s40064-016-1761-0
Zong, N., and Fu, G. (2021). Variations in species and function diversity of soil fungal community along a desertification gradient in an alpine steppe. Ecol. Indic. 131, 108197. doi:10.1016/j.ecolind.2021.10819710.1016/j.ecolind.2021.108197
Keywords: soil quality, global change, random forest, alpine ecosystem, alpine region, ‘third pole’, Tibetan plateau, NDVI
Citation: Wang S and Fu G (2023) Modelling soil moisture using climate data and normalized difference vegetation index based on nine algorithms in alpine grasslands. Front. Environ. Sci. 11:1130448. doi: 10.3389/fenvs.2023.1130448
Received: 23 December 2022; Accepted: 31 January 2023;
Published: 10 February 2023.
Edited by:
Dafeng Hui, Tennessee State University, United StatesReviewed by:
Xiangjin Shen, Northeast Institute of Geography and Agroecology, Chinese Academy of Sciences, ChinaHu Liu, Northwest Institute of Eco-Environment and Resources (CAS), China
Yan Jianwu, Shaanxi Normal University, China
Copyright © 2023 Wang and Fu. This is an open-access article distributed under the terms of the Creative Commons Attribution License (CC BY). The use, distribution or reproduction in other forums is permitted, provided the original author(s) and the copyright owner(s) are credited and that the original publication in this journal is cited, in accordance with accepted academic practice. No use, distribution or reproduction is permitted which does not comply with these terms.
*Correspondence: Gang Fu, ZnVnYW5nQGlnc25yci5hYy5jbg==, ZnVnYW5nMDlAMTI2LmNvbQ==