 Boyu Liu
 Lingda Wu1
- 1Science and Technology on Complex Electronic System Simulation Laboratory, Space Engineering University, Beijing, China
- 2Beijing Institute of Remote Sensing Information, Beijing, China
- 3School of New Media Art and Design, Beihang University, Beijing, China
- 4Naval aviation university, Yantai, China
Synthetic Aperture Radar Interferometry (InSAR) has grown significantly over the past few decades, which were mainly used in remote sensing applications. Most InSAR applications (e.g., terrain mapping and monitoring) utilized a key technique called phase unwrapping Phase unwrapping obtained the absolute phase from the wrapped phase for the subsequent application. However, the collected wrapped phase inevitably contains noise due to the influence of factors such as atmosphere and temperature in the InSAR acquisition stage. This noise made it challenging to obtain the absolute phase from the wrapped phase. This study proposed a deep learning framework (PUnet) for phase unwrapping form InSAR data. pUnet was a robust framework using U-net as the basic structure combined with an attention mechanism and positional encoding, facilitating accurate phase unwrapping from the wrapped phase. Through comparative experiments with typical phase unwrapping algorithms, we demonstrated that pUnet could obtain absolute phases with high accuracy and robustness than from the wrapped phase under various levels of noise.
1 Introduction
Synthetic Aperture Radar Interferometry (InSAR) is a hotspot in satellite Earth observation research. It obtains single look complex (SLC) imagery obtained through dual-antenna or iterative orbital observations. A digital elevation model (DEM) can be generated from two or more SLC images, through the use of processes such as filtering, co-registration, interference, terrain deflattening, spectral filtering, phase unwrapping, and geo-coding. In these steps, phase unwrapping (hereinafter referred to as PU) is a relatively difficult step (Costantini, 1998a). Many previous evidence has proposed phase-unwrapping algorithms with significant effects, which could be generally divided into three categories: path-following, optimization-based, and integrated denoising and unwrapping methods.
Path-following methods are the most common in PU, the rationale of which is to choose reliable integrated paths to obtain correct PU results. In the path-following method, the integration path may be determined by the residual distribution or the quality map. In other words, the path-following method may guarantee that the input phase fringes of the PU result are consistent with the rewrapped phase fringes. Path-following methods typically have low time and space complexity, and their PU accuracy in high-quality regions is credible (Ghiglia and Pritt, 1998). Classical path-following methods included the quality-guided algorithm (Xu and Cumming, 1999; Zhao et al., 2011; Herraez et al., 2016; Jian, 2016; Gao et al., 2019; Chen et al., 2022), the branch-cut algorithm (Goldstein et al., 1988), the mask-cut algorithm (Gao and Yin, 2012), and the minimum discontinuity algorithm (Ghiglia and Romero, 1996; An et al., 2000; Yu et al., 2013; Liu et al., 2018). The path-following algorithm has the advantage of low computational cost; however, this is accompanied with poor adaptability. Overall, this method has relatively low PU accuracy in low-quality regions.
Optimization-based methods used different objective functions to minimize the difference between the unwrapped phase gradient and the estimated gradient as much as possible (Yamaki and Hirose, 2007). A representative approach is the Lp-norm method. Among them, when p = 1, the Lp-norm PU method is equal to the minimum cost flow (MCF) PU method (Costantini, 1998b) and the Flynn minimum discontinuity method (Flynn, 1997; Xu et al., 2016). Some evidence (Ghiglia and Romero, 1996; Ferretti et al., 2007) have provided typical algorithms for p ≤ 1. Many statistics-based methods existed in addition to the Lp-norm method (Nico et al., 2000; Chen, 2001; Dias and Leitao, 2002; Ying et al., 2006; Dias and Valadao, 2007; Chen and Zebker, 2011). A major benefit of these methods is that multiple priors (e.g., SAR image intensity or interferogram coherence) can be efficiently fused. In particular, the SNAPHU method is one representative statistics-based method a statistical cost model to compute the most probable PU solution proposed in (Chen and Zebker, 2011).
In the traditional InSAR processing flow, phase denoising and phase unwrapping were two separate steps (i.e., denoising is followed by unwrapping). However, the evidence showed that this two-step approach inevitably introduced some additional processing errors, as each step had different algorithmic approximations and assumptions. For instance, in order to specifically illustrate the error caused by the approximation and assumption of the algorithm, the PU algorithm named SpInPhase is divided into two part (Hongxing et al., 2015) Particularly, in the first step, SpInPhase solved the phase de-noising problem through dictionary learning and sparse coding methods. In the second step, SpInPhase solved the PU problem after phase denoising with Markov random fields. However, in the first step of the sparse coding denoising algorithm, the researchers used the L1 norm as an approximation of the L0 norm to address the problem that the L0 norm was a non-convex function. This approximation method may inevitably introduce errors and result in excessive residual noise in the interferogram. These residual noises may be misjudged as phase features by the PU algorithm, which may contribute to biased PU results. The appearance of this bias may not be due to the defects of the PU algorithm itself. Instead, it is from the misleading information left in the previous step (phase denoising). Therefore, the PU may be affected by the error of the denoising step algorithm if the denoising and unwrapping algorithms are improved separately. In order to solve the unavoidable error in the two-step method, Relevant studies generally provided two solutions. First, the errors contained in such algorithms could be solved by adding anti-noise ability and robustness to the PU algorithm. The other solution adopted some integrated denoising and unwrapping methods (Zhou et al., 2021a; Zhou et al., 2021b; Yuan et al., 2022; Zhang et al., 2022; Zhou et al., 2022) (i.e., PU performed simultaneously with phase noise filtering) which used a combination of denoising and unwrapping to recover the information of noisy pixels. The problems of the existing integrated denoising and unwrapping methods may be that the computational cost is higher than others. Due to the complex features and high noise level of InSAR images, the computational cost of such methods is generally high, and the consistency of solutions still needs to be paid attention to.
With the wide use of deep learning methods in computer vision and image processing, more and more researchers adopted them to solve the PU problem. The most commonly used is the Deep Learning Performed Wrap Count method (hereinafter abbreviated as DLPWC method). Although the phase value of each pixel in the interferogram is different, the wrap counts are the same within one fringe period. Phase un-wrapping may thus be viewed as a classification or segmentation problem; that is, the wrap count corresponding to the phase value of each pixel is treated as a class label (Liang et al., 2018; Spoorthi et al., 2018; Zhan et al., 2019; Zhang et al., 2019; Wu et al., 2020). Liang et al. (2018) first proposed this idea. On the other hand, Spoorthi et al. (2018) proposed a phase data set generation method, where the generated data set was used to train the network for the purpose of predicting wrap counts, and post-processing with clustering-based smoothness which is performed to alleviate the classification imbalance. Zhang et al. (2019) have used three networks to perform phase unwrapping in the sequence which were respectively oriented to wrapped phase denoising, wrap count prediction, and post-processing. One study verified the phase unwrapping capability of the proposed network, DeepLab-V3, and proposed the use of refined post-processing (Zhan et al., 2019). Similarly, Wu et al. (2020) have optimized the phase unwrapping method in Doppler optical coherence tomography by exploiting multi-scale context information and full-resolution residual blocks. This type of method (Sica et al., 2020; Li et al., 2022) was derived from traditional machine learning algorithms and fitted well with the principles of phase un-wrapping. The common advantages were the simple network structure the short training time, and the accuracy of unwrapping. However, there are some drawbacks (i.e., poor anti-noise and insufficient feature extraction capability), which may result in decreased PU accuracy when the noise level in the interferogram is high. Specifically, the “absolute phase” in the sample pair was saved as an integer in the training set (test set) of the DLPWC method. For example, if the integer on a pixel is n, it means that in a sample pair, the difference between the real absolute phase and the corresponding interferogram on the pixel is nπ. The fact is that these methods treated the PU problem as a classification problem (treat the integer n on each pixel as a classification label), so they had poor noise recognition ability and weak noise resistance. Therefore, DLPWC is generally used together with other de-noising algorithms.
Another deep learning-based PU method is the deep regression method. This method appeared relatively late. In this context, PU could be viewed as a regression problem (He et al., 2019; Wang et al., 2019; Dardikman-Yoffe et al., 2020; Qin et al., 2020; Park et al., 2021; Perera and De Silva, 2021), where the neural network directly learned the mapping between the wrapped phase and the absolute phase. Such a mapping relationship was the most direct and intuitive. However, the unwrapped phase did not strictly follow the stipulation of adding or subtracting an integer number of 2π to the phase value on each pixel of the wrapped phase in the PU principle. A recent study (2019) proposed a deep regression method and verified the superiority of this method in terms of anti-noise and anti-aliasing (Wang et al., 2019). He et al. (2019) tested the phase unwrapping performance of a bidirectional recurrent neural network (RNN) and 3D-ResNet using MRI data. Dardikman-Yoffe et al. (2020) disclosed a sample set of biological cells and confirmed the accuracy and robustness of deep regression methods. In order to obtain higher accuracy, Qin et al. (2020) adopted a larger capacity Res-UNet to solve the phase unwrapping problem. Although the computational cost of this method was higher, they reported significant benefits. Some studies (Park et al., 2021; Perera and De Silva, 2021) tested the PU performance of long short-term memory (LSTM) networks and Generative Adversarial Networks (GANs), demonstrating their effectiveness. In general, the deep regression method did not fully match the principle of PU when compared with the DLPWC method; however, a more complete network structure could be used to improve accuracy. On the other hand, the anti-noise capability of a deep regression method will become stronger with the improvement of the feature extraction ability of the network. The problem is that the noise models assumed by the existing deep regression methods were too simple (e.g., Gaussian white noise is directly added to the phase value of each pixel of the interferogram (Wang et al., 2019). In the research area of InSAR denoising, two common simulated noise models are the complex Gaussian noise model and the coherent noise model. A study first proposed the coherent noise model (Deledalle et al., 2011), which may be considered as the most suitable analogue noise model for InSAR imaging principle. Some researchers studied the relationship between the complex Gaussian noise model and the coherent noise model and proved the effectiveness of the complex Gaussian noise model for practical denoising applications when testing the anti-noise ability of the models (Hongxing et al., 2015). Therefore, the PU performance may fall short when dealing with real-world interferograms with high noise levels. Their robustness and feature extraction ability still need to be improved.
Based on the evidence above, we proposed an architecture for PU of interferometric synthetic apertures (i.e., PUnet) to improve the robustness of PU and reduce the pre-processing steps before pU. A robust framework was formed through pUnet combining spatial attention (Woo et al., 2018), self-attention (Vaswani et al., 2017), and positional encoding (Vaswani et al., 2017) to deeply and multi-dimensionally mine the features of interferograms based on U-net. In addition, we demonstrated the effectiveness of pUnet through testing and analysis of simulated and real-world data under different conditions.
Our key contributions are summarized as follows:
1) We proposed a simple, robust, and effective framework for PU of SAR interferometric images (i.e., PUnet). U-net was the basic structure of PUnet and supplemented by an attention module, targeting achieving the functions of synchronously completing interferometric phase denoising and phase unwrapping. Some function of PUnet (i.e., synchronize denoising and phase unwrapping) could avoid the error caused by approximation in traditional two-step cascade algorithms.
2) We proposed a learning block (Phase Unwrapping Learning Block; abbreviated as PULB) for phase feature extraction. PULB consists of multiple branches aimed to extract phase features from different perspectives using different methods, which eventually obtain multi-scale features. The traditional feature extraction method involved solving the problem of insufficient feature extraction by adding more convolution layers. Our proposed PULB may simplify the network structure and greatly reduce layer depth.
3) We proposed an attention module to enhance phase feature learning. The attention module was used to extract the deep feature information in the high-dimensional feature map after completing down-sampling. The module was mainly composed of three components: Spatial attention, positional encoding, and self-attention, which performed feature extraction on high-dimensional feature maps from different dimensions and further strengthened the feature extraction capability of the network.
The structure of this paper was as follows: In Section 2, we introduced the PU problem model. In Section 3, we introduced the structure and details of PUnet. In Section 4, we conducted quantitative and qualitative experiments on pUnet and other advanced algorithms, using simulated and real-world interferograms under different extreme conditions. Finally, our conclusions are presented in Section 5.
2 Problem model
2.1 Problem model of PU
The interferometric phase is typically acquired in the form of a complex-valued image. However, the obtained interferogram is not the actual application signal and only reflects the properties of the actual application signal. The synthetic aperture radar interferometry technology maps the signal to the interval [−π, π) by performing the complex phase angle operation on the actual signal; this is the process of phase wrapping. Taking a two-dimensional interferogram as an example, the definition of the phase unwrapping operation on each pixel point (x, y) was provided in formula (1), where
Some physical quantities were related to the absolute phase in some published applications. Thus, it is necessary to restore the interferometric phase (i.e., the wrapping phase) X to the absolute phase Y using an algorithm. This process is called phase unwrapping. As described in Section 1, the DLPWC methods, k (x, y) is treated as an integer in most traditional algorithms (i.e., wrap count). Eq. 2 shows the relationship between the absolute phase
where
2.2 Discussion of two problem models
The model described in Equation 1 was in line with the principle of pU. As mentioned above, the deep learning method aimed to realize PU was to treat PU as a classification problem. Furthermore, it involved treating the wrap count k (x, y) as the label of the class. This method may achieve good PU results in the early stage of the proposal. However, the DLPWC method has been found to have insufficient robustness through in-depth study (Wang et al., 2022). It is also noted that this model cannot often accurately determine the wrap counts corresponding to the pixels on these special terrains if there are complex interferometric fringes or low-amplitude stripes in the interferogram. Additionally, the DLPWC method can recognize the noise as phase information at the pixel point when the noise level in the interferogram is high, which may result in a misjudgment of the wrap count. Some recent research have continuously proposed new methods to improve the robustness of DLPWC methods. For example, one study proposed estimated wrap count in a differential term by focusing on the variation of k (x, y)rather than absolute value, and then integrating them appropriately (Sica et al., 2020). This operation may make the network not overly sensitive to the value of the absolute phase during training, ultimately contribute to generalization ability. The DLPWC method has the benefits of fitting well with the principle of pU. However, robustness and stability still need to be solved for such methods (Wang et al., 2022).
The model described in Equation 2 was proposed from the perspective of deep learning. From Equation 1, PU was an ill-posed inverse problem. As k (x, y) was discrete, the traditional algorithms to solve this kind of problem approximated it by a continuous function to obtain the final solution (e.g., (Hongxing and LingdaPUMA-SPA, 2014)). As mentioned above, the discrete term is usually made continuous by use of the differential term in PU methods based on deep learning. The proposed model in Equation 2 could effectively avoid this problem instead of treating the PU problem as a regression problem. Using the feature relationship, the mapping relationship corresponding to each pixel point (i.e., the mapping relationship between the wrapped phase and the absolute phase) was learned. Although this method did not fully conform to the principle of PU, it was possible to obtain accurate PU results on the premise theoretically that the feature relationship between phase values was fully learned. As introduced in Section 1, they have been valued by previous research although deep regression methods based on Equation 2 model appeared relatively late. They were characterized by strong robustness and could learn the mapping relationship effectively between the wrapped phase value and absolute phase value on special terrain or objects.
In general, the deep learning methods based on Model 1) were reasonable in terms of the principle of pU. The results showed significant performance in solving the PU problem. However, considering the possible noise and interference in the interference phase, their robustness and anti-noise capability need to be further studied. The deep learning methods based on Model 2) have a clear purpose and effectively avoid the trouble caused by the ill-posed nature of pU. However, there is no denying that more room are still needed for improvement in deep regression methods in terms of feature learning as real-world interferograms tend to contain many special terrains and objects.
3 The proposed PUnet
This section showed the details of PUnet. The characteristics of the InSAR wrapped phase were complex and informative. There was typically irregular noise in the wrapped phase considering the influence of factors such as atmosphere and temperature in the acquisition. Such noise could seriously impact PU performance. In order to eliminate the influence of noise, the traditional cascaded wrapped phase processing flow included the two steps of denoising and pU. It was important to emphasize that the former step inevitably resulted in unknown effects on the latter. We proposed pUnet to solve the denoising and PU problems in one step which was based on the idea of deep regression and took advantages of the power of modern GPUs and the rapid development of deep learning methods. Specifically, we considered two aspects: 1) Deep learning methods had advantages over traditional algorithms in capturing spatial features; and 2) Extraction of the mapping relationship between the noisy wrapped phase and the absolute phase is feasible with a strong GPU and adequate training on numerous samples.
3.1 Overview of PUnet
The architecture of pUnet was illustrated in Figure 1. The overall design of pUnet was inspired by U-net (Ronneberger et al., 2015). Its main components were a five-stage encoder, the attention module, a four-stage decoder, and bridge paths in the middle. In the encoder and decoder, we proposed a PU learning block (PULB) for PU feature extraction. The details of the PULB were provided in Section 3.2. The multi-channel feature map output by each encoder was connected with the next layer of encoders by a 2 × 2 max-pooling operation (i.e., down-sampling). The bridge paths in the middle were used to connect the contraction and expansion paths. Specifically, we directly established skip connections between the feature maps in the shrinking path without the max-pooling operation and the corresponding positions in the expanding path. Before up-sampling, we incorporated an attention module to extract features from high-dimensional feature maps from different dimensions. The attention module mainly consisted of three parts: Spatial attention, positional encoding, and self-attention. The details of the attention module were provided in Section 3.3.
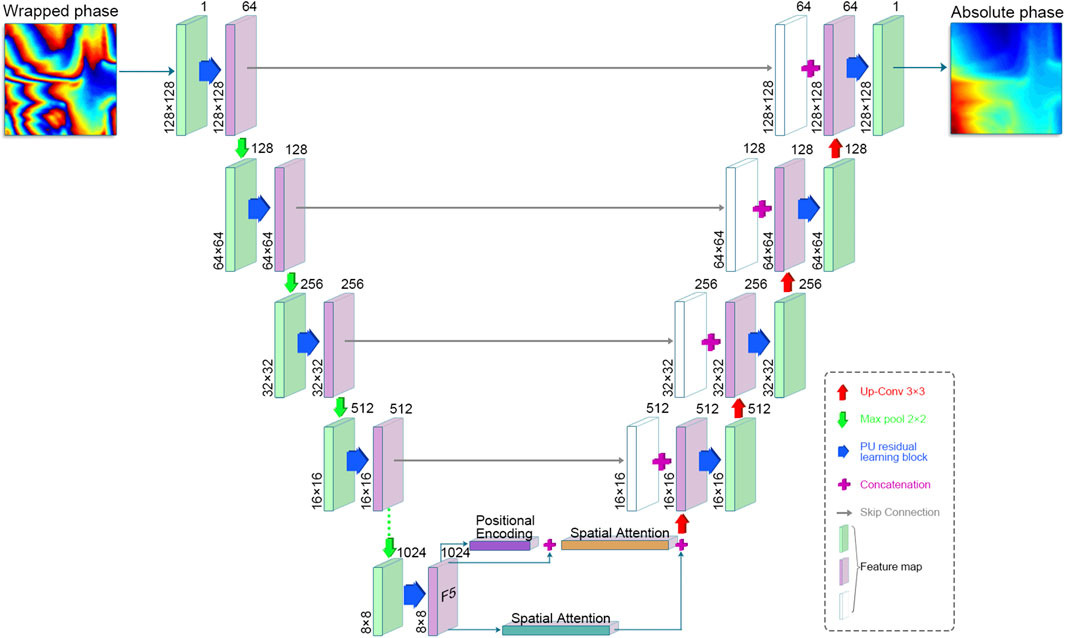
FIGURE 1. Architecture of the proposed PUnet.
3.2 PULB
As is known, convolutional neural networks employed multiple convolution layers for feature extraction. When dealing with samples with complex features, methods such as concatenating multiple convolutional layers or increasing the layer depth are often used to improve the feature learning ability of the network. Although these methods are effective, they increase the computational cost and are not conducive to the extraction of multi-scale feature information. We aimed to design a feature learning block with a branch-parallel form inside, which could effectively extract multi-scale feature information without increasing the layer depth. PULB was inspired by the previous study (Szegedy et al., 2016), and its specific content consisting of five branches was shown in Figure 2. The design idea was to learn different features through these five branches, and then combined the learned features in a specific way. Each branch was composed of Conv + BN or Conv + BN + ReLU. The PULB designed under the concept of “inception architecture” (Krieger et al., 2007) can control the layer depth of the network through a multi-branch parallel approach, thus making the network training more efficient. In addition, PULB can avoid gradient explosion by this connection.
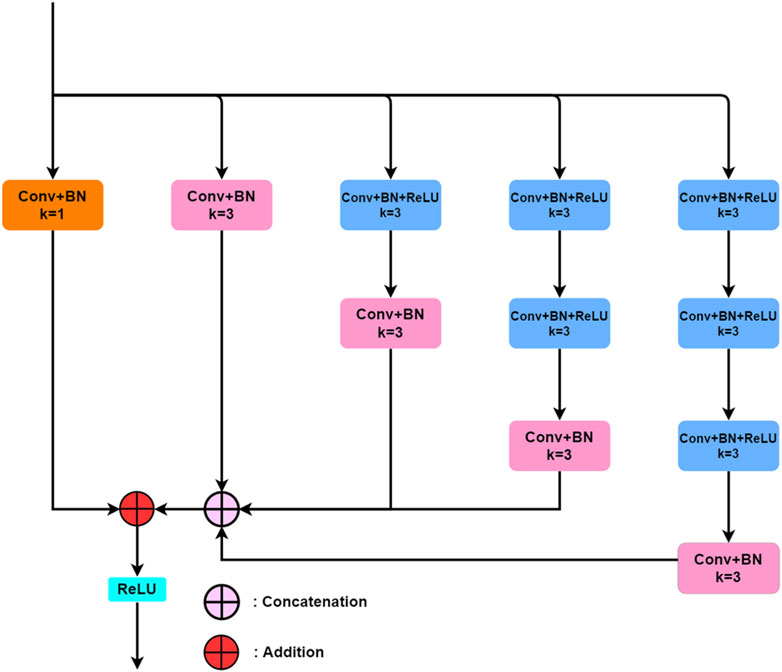
FIGURE 2. The PU residual learning block.
3.3 Attention module
To improve the feature extraction ability of the network, we added an attention module before up-sampling, as shown in Figure 3A. The main components included spatial attention, positional encoding, and self-attention. These three components respectively performed feature extraction on different dimensions of the feature map. Figure 3B showed a schematic diagram. The function of spatial attention was to find the important channels among the 1024 channels, according to the dimension of the number of feature map channels. The positional encoding filtered the meaningful parts from in the 1 × 1 × 1024 feature vector, corresponding to each pixel on the 8 × 8 feature map. Specifically, position encoding embedded the rows and columns in the feature map, and then found the location of important pixels. Finally, self-attention achieved global supervision of all 1024 × 8 × 8 feature values in all channels. Figures 3C, D showed the details of spatial attention and self-attention respectively. The spatial attention and self-attention in this part were inspired by the Scaled Dot-Product Attention (Vaswani et al., 2017). It is noted that we performed convolution operations on Query (Q), Key (K), and Value (V) in spatial attention. The positional encoding obtained the weight corresponding to each 1 × 1×1024 feature vector through the embedding operation. As the output calculated by the positional encoding did not contain the original input, we used skip connections to add the weight information calculated from the original input and the position encoding, which was then passed to the self-attention module.
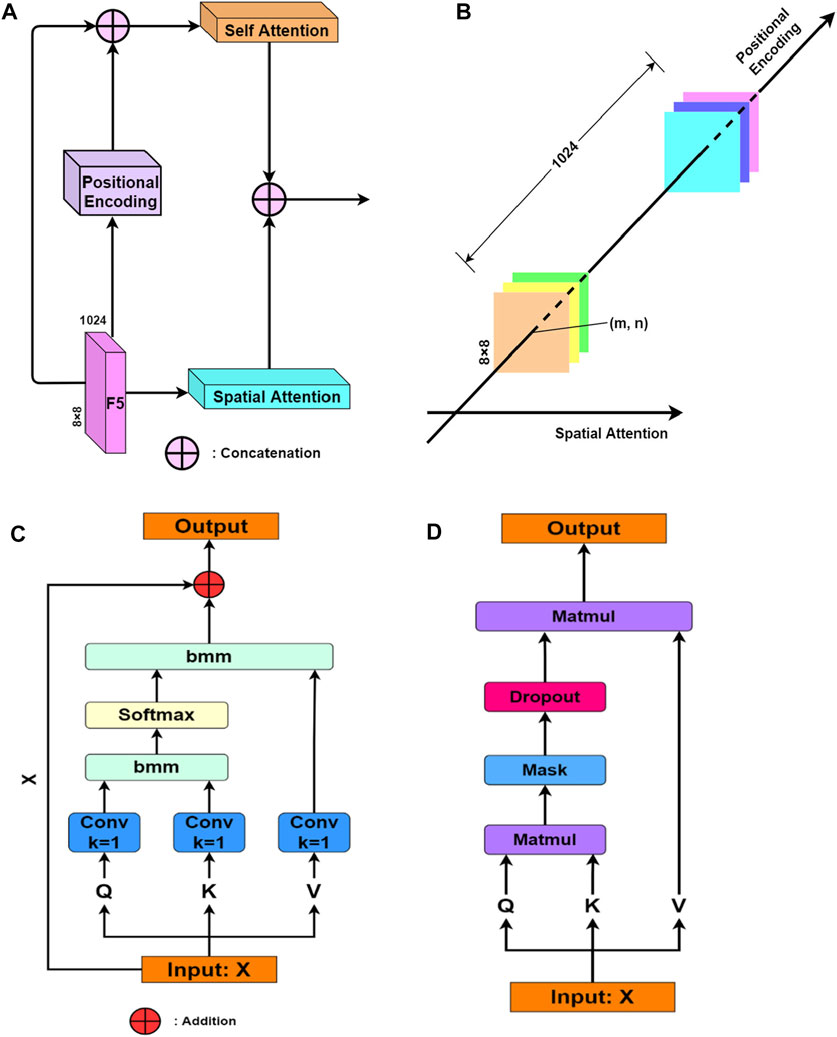
FIGURE 3. (A) Connections in the attention module; (B) Schematic diagram of features of different dimensions targeted by different attentions; (C) Spatial attention; and (D) Self-attention.
In general, the attention module was divided into two branches: One branch was spatial attention, which was used to extract important information in the channel number dimension. The other branch included positional encoding and self-attention, which were responsible for extracting the feature information of the 1 × 1 × 1024 feature vector corresponding to each pixel and global supervision respectively. Finally, the information generated from the two branches was fused.
4 Experiments
4.1 Training set and test set
Assuming that the absolute phase to be determined corresponding to the pixel point (x, y) in the interferogram is
where j is the imaginary unit;
Our data generation method was inspired by the previous study (Ghiglia and Pritt, 1998). First, we generated an initial square matrix with random size (ranging from 1 × 1 to 30 × 30), value range (1–100), and distribution type (uniform or Gaussian). Among these, the size determined the number and position of extreme points in the final absolute phase, while the range of values determined the gradient of the absolute phase. Next, we used interpolation and bilinear methods to enlarge the matrix. The size used for the experiments in this study was 128 × 128. We generated a total of 22,000 absolute phase–wrapped phase image pairs. Among all image pairs, 20,000 image pairs were used as the training set, while the remaining 2,000 were used as the test set. In the PU experiments with noisy wrapped phases, the noise setup was as described in Equation 4. We added independent and identically distributed Gaussian noises
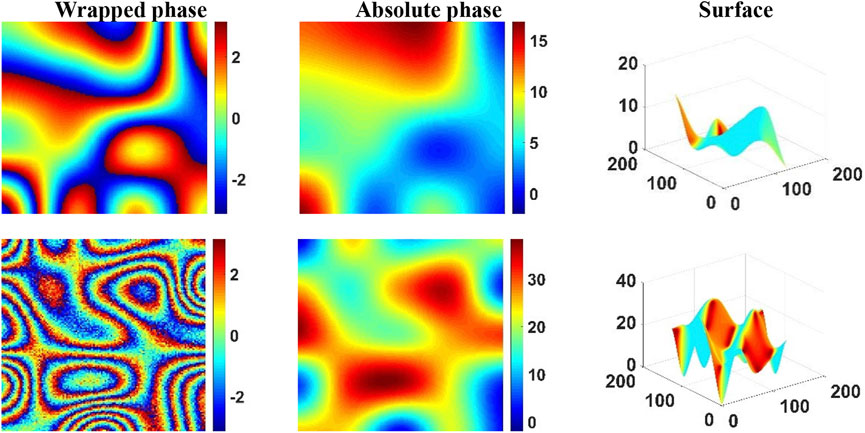
FIGURE 4. Example of training set samples.
Our proposed pUnet was trained on an NVIDIA Tesla V100 GPU for a training duration of 8 h (with PyTorch 1.4.0) with a total of 100 epochs with a learning rate of 0.005. The loss function of pUnet was the absolute value loss (i.e., L1 loss).
4.2 Evaluation criteria and comparison algorithms
In the quantitative analysis of simulated and real-world InSAR data experiments, we employed the root mean square error (RSME) and structural similarity (SSIM) to evaluate the PU performance of the different algorithms, calculated as follows:
where
In the experiments detailed below, we chose REPU (Chen and Zebker, 2011) and DLPU (Wang et al., 2019) as algorithms for comparison. REPU was a statistics-based PU algorithm, which was a traditional algorithm that has been shown to perform well in the PU field recently, while DLPU was a deep regression method with fairly good stability. Their selection was mainly based on two considerations: 1) REPU has been shown to have significantly effective PU performance in previous studies, even comparable to some recent Deep Learning-Performed Wrap Count methods under special conditions. Therefore, REPU was chosen as a representative algorithm which treats Equation 1 as the research model. 2) DLPU was a deep regression method with better PU performance, which has been proposed more recently. It has been confirmed to have strong stability and good anti-noise performance. Therefore, DLPU was chosen as a representative of the algorithm which treats Equation 2 as the research model.
4.3 Simulated experiments
We conducted experiments on the proposed pUnet and the two algorithms selected for comparison. Three algorithms were tested on the test sets with four different noise levels. Next, the correct absolute phase was uniformly expressed as the Ground truth. Table 1 presented the PU results of REPU, DLPU, and pUnet for 2000 samples in the test set under different noise conditions. The evaluation criteria obtained after the testing of 2000 test samples under each noise level were averaged. The result indicated that REPU performs well when the interferogram did not contain noise in Table 1. However, as the noise level increases, the PU performance of REPU gradually decreased. Differently, the PU performance of DLPU was much less affected by noise level than REPU, and the PU performance of the proposed pUnet was relatively stable under different noise levels. From the quantitative evaluation criteria of pUnet and DLPU, the deep learning methods presented advantages in terms of anti-noise ability. As shown below, we detailed specific experimental results combined to verify the robustness and anti-aliasing effect of pUnet from different perspectives. At the same time, we conducted a detailed analysis of the advantages and disadvantages of the two comparison algorithms.
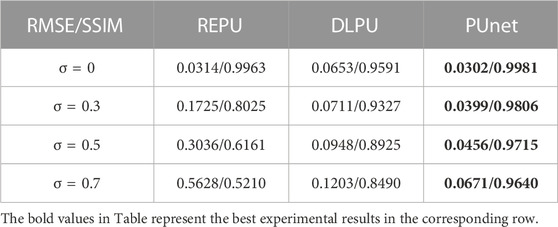
TABLE 1. Average root means square error/average structural similarity (RMSE/SSIM) between Ground truth and PU with REPU, DLPU, and pUnet under different noise conditions and 2000 simulated samples.
Figure 5 showed the test results for REPU, DLPU, and pUnet on some samples when σ = 0. For ease of description, we use “noise level-algorithm name-sequence number of columns” to locate each subgraph. For example, the subgraph on the third row and the first column in Figure 5 could be expressed as "σ = 0-REPU-1". We took the interferometric fringe density as the main screening condition and selected four test samples with obvious differences in this condition. The higher the density of interferometric fringed, the easier it was to judge the relationship between adjacent pixels. Dense interferometric fringes were much beneficial for REPU, which was good at calculating the gradient relationship between the phase values of adjacent pixels. From "σ = 0-REPU-1″ and "σ = 0-REPU-2″, it is clear that REPU had a unique advantage under the condition of no noise in the interferogram, when the density of interferometric fringes was large. As shown by "σ = 0-REPU-3″ and "σ = 0-REPU-4″, the PU performance of REPU could decrease when the interferometric fringe density was lower. In contrast, the results of both DLPU and pUnet were relatively stable at different fringe densities. In particular, the two evaluation criteria of "σ = 0-PUnet-3″ and "σ = 0-PUnet-4″ were both stable and better than "σ = 0-PUnet-1″ and "σ = 0-PUnet-2″, indicating that pUnet maintained a good feature extraction ability when the interferogram features were relatively simple, and there was no over-fitting.
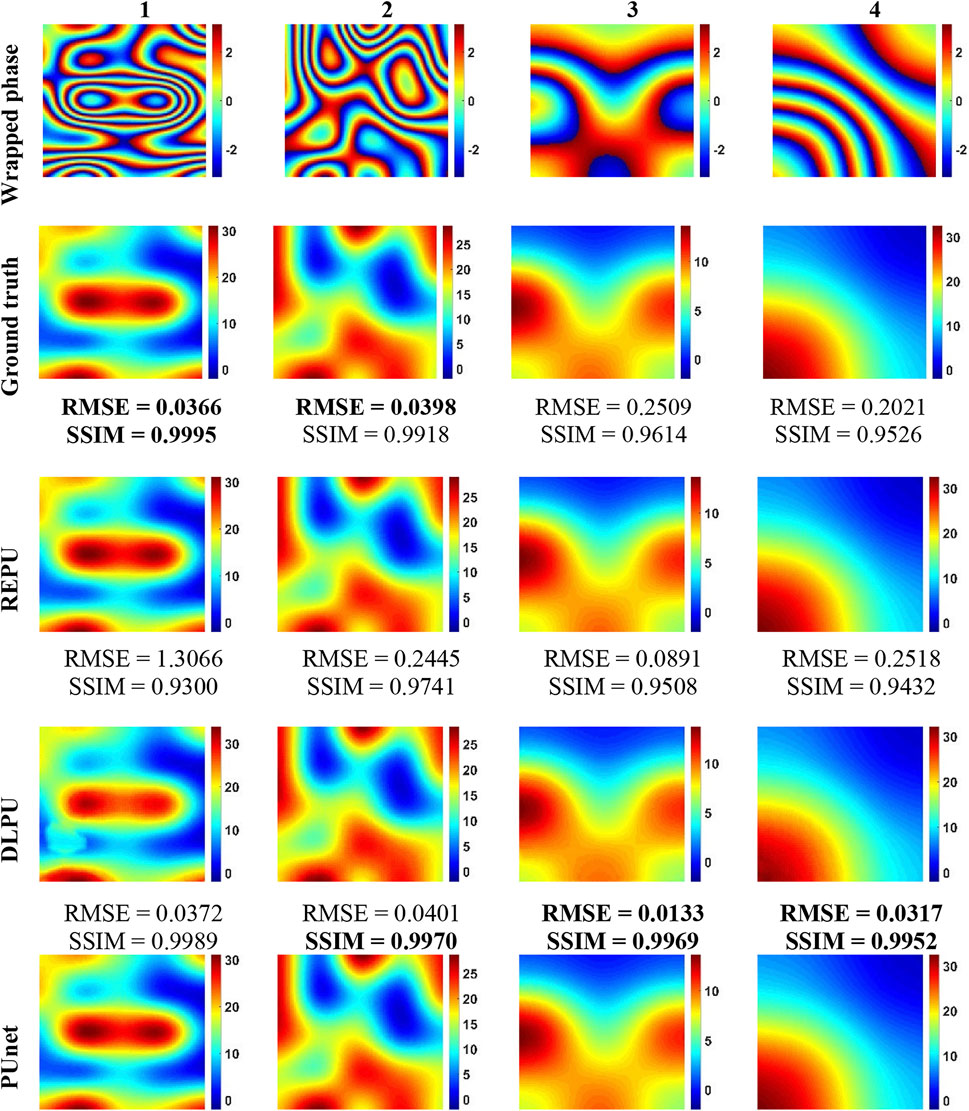
FIGURE 5. PU results of REPU, DLPU, and pUnet on the four wrapped phases drawn from the test set with σ = 0. From top to bottom: the wrapped phase, the correct absolute phase (Ground truth), the PU of REPU, the PU of DLPU, and the PU of PUnet. Above the subgraphs in the third to fifth rows are the quantization results corresponding to the subgraphs.
As shown in Figure 6, in order to test the anti-aliasing performance, we selected the noise-free wrapping phase with irregular interferometric fringe density and complex terrain features to conduct specific error analysis regarding the PU capabilities of REPU, DLPU, and PUnet. In terms of PU error, pUnet had the smallest error range (as evidenced by the right scales in Figures 6F–J). The PU results of REPU, DLPU, and pUnet based on the SSIM analysis indicated that the detail preservation ability of the absolute phases calculated by the three algorithms could be recognized. It showed that the RMSE of REPU was poor and the SSIM results were not significantly deficient, suggesting that the accuracy of the PU results of REPU in some regions was low, which can be corroborated from Figure 6D. In contrast, Figures 6H–L indicated that it was not difficult to find that the error distributions of DLPU and pUnet were more uniform. This may verify the unique advantages of deep learning methods in feature extraction. It is important to emphasize that pUnet can control the error within a pretty small range. Simultaneously, pUnet presented strong anti-aliasing effect in the PU experiment under the condition of irregular fringe density (Figure 6). It could both control the error within a small range and not appear, as shown in Figure 7D, where the error was very prominent in a certain part of the absolute phase.
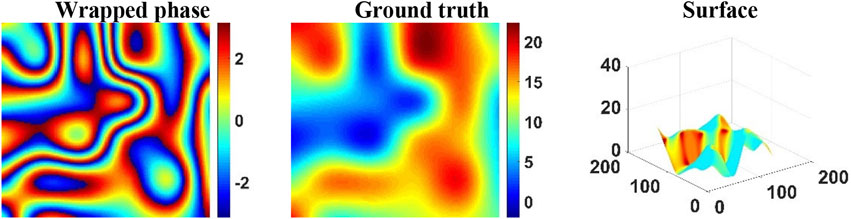
FIGURE 6. Test samples for error analysis with σ = 0. From left to right: Wrapped phase, Ground truth, and Surface of Ground truth.
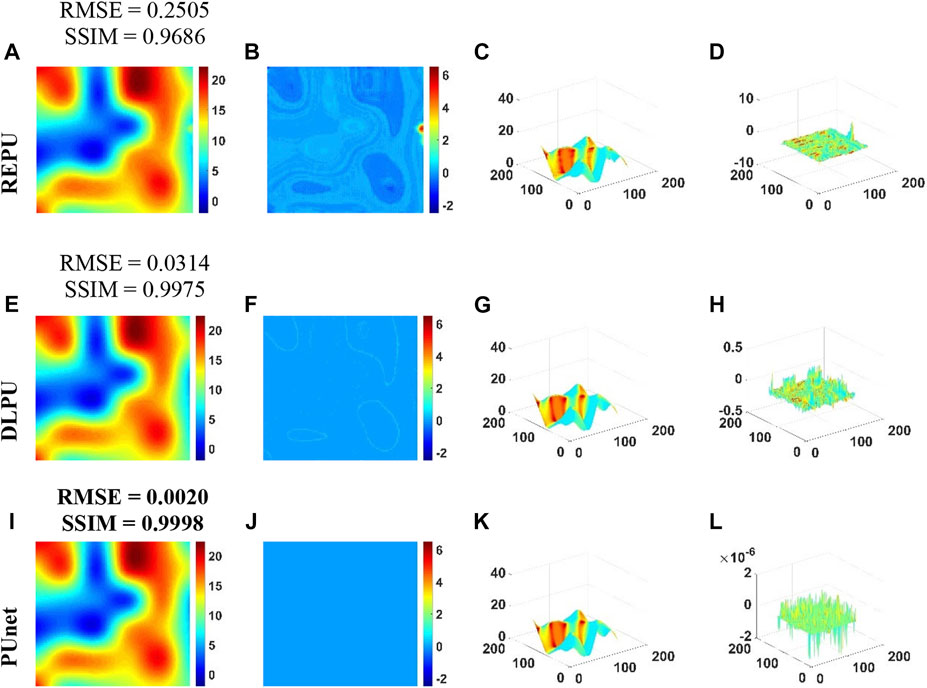
FIGURE 7. PU Error Analysis of REPU, DLPU, and PUnet with σ = 0. (A–D) is the PU result, PU error, PU surface and PU error surface of REPU, respectively. (E–H) is the PU result, PU error, PU surface and PU error surface of DLPU, respectively. (I–L) is the PU result, PU error, PU surface and PU error surface of PUnet, respectively. Above the subgraph in the first column is the quantization result corresponding to the subgraph.
In order to verify whether pUnet can complete the phase unwrapping of the noisy wrapped phase in one step (i.e., one-step PU), we selected the wrapped phase with different noise levels in the test set with σ = 0.7, respectively; then, for REPU, DLPU, and PUnet, we conducted quantitative and qualitative analysis of PU performance. Figure 8 illustrated the PU results for the three algorithms. “Wrapped phase-3″ was a very noisy sample. The evaluation criteria of "σ = 0.7-REPU-3" (RMSE = 0.6436, SSIM = 0.1562) indicated that the PU effect of REPU was not good when the noise level was high. As a traditional cascaded PU algorithm, REPU relied on independent denoising algorithms under high noise conditions. However, the anti-noise performance of REPU itself could not be ignored. The result of "σ = 0.7-REPU-3″ showed that, when there was a small amount of noise in the wrapping phase, the PU result of REPU still had a strong ability for detail preservation (SSIM = 0.9643); however, there were more estimation errors in some special areas (RMSE = 0.2356) at the same time. The PU performances of DLPU and pUnet on “Wrapped phase-3″ were much better than that of REPU. By comparing "σ = 0.7-DLPU-3″ and "σ = 0.7-PUnet-3″, the RMSE values of DLPU and pUnet were similar when the noise level in the wrapped phase was high; however, there was a gap between DLPU and PUnet, in terms of SSIM. Through comparison of "σ = 0.7-DLPU-3″, "σ = 0.7-PUnet-3″, and “Ground truth-3″, pUnet was much stronger than DLPU in terms of detail preservation.
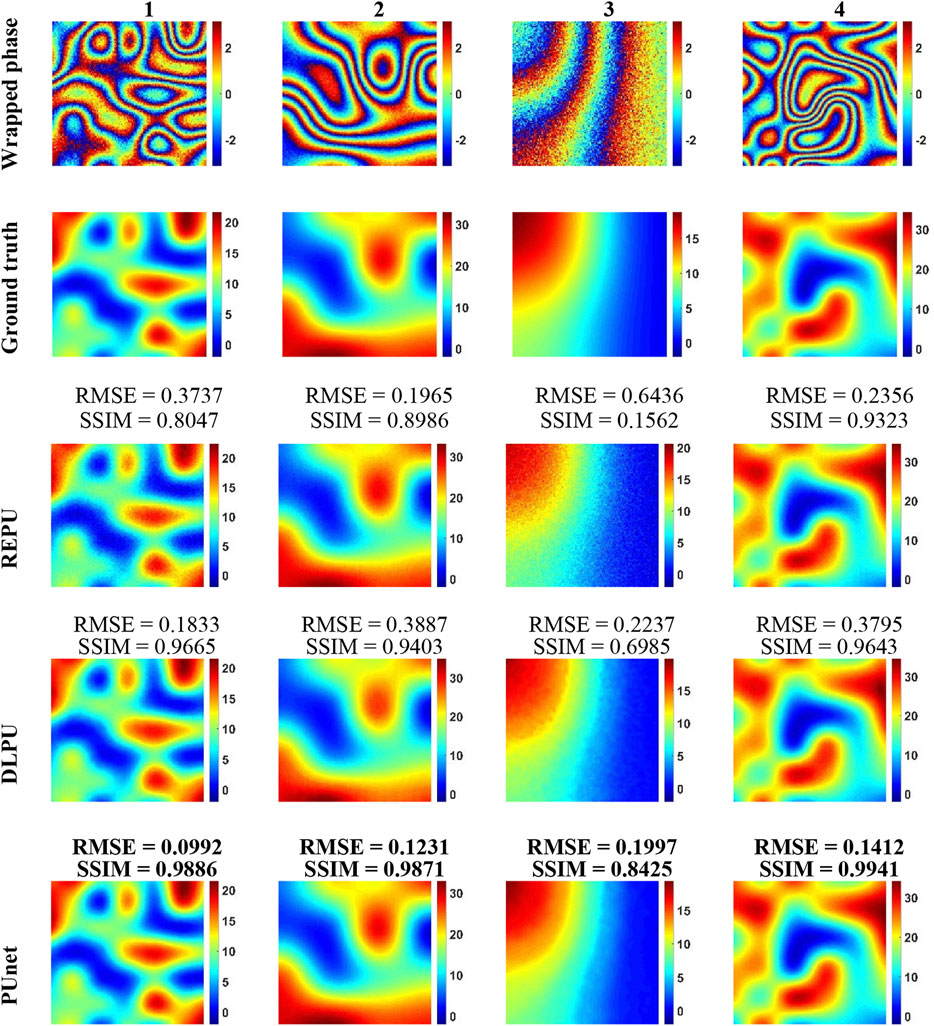
FIGURE 8. PU results of REPU, DLPU, and pUnet on the four wrapped phases drawn from the test set with σ = 0.7. From top to bottom: Wrapped phase, the correct absolute phase (Ground truth), the PU of REPU, the PU of DLPU and the PU of PUnet. Above the subgraphs in the third to fifth rows are the quantization results corresponding to the subgraphs.
In order to further test the robustness and anti-noise ability of PUnet, we selected a test sample with relatively uniform distribution of interferometric fringes and high noise level and conducted specific error analysis for pUnet and the other two comparison algorithms. Figures 9B, D illustrated that it was almost uniformly distributed in an interval at higher noise levels despite the fact that the PU error of REPU was larger. Combined with Figure 9C, the ability of REPU to estimate the absolute phase information in the package phase could not be underestimated in the case of almost only noise interference and no other special terrain. On the other hand, this proved that the noise immunity of REPU was weak. Compared with DLPU, pUnet had better PU performance, no matter which metric (RMSE, SSIM) was analyzed. Figures 9J–L both proved the good anti-noise ability and good detail preservation ability of PUnet. This could be confirmed through comparison of the surfaces in Figure 9K; Figure 10. The robustness and anti-aliasing of pUnet could be verified by combining the PU experimental results of the wrapped phase with high noise level and the test results for the noise-free wrapped phase above.
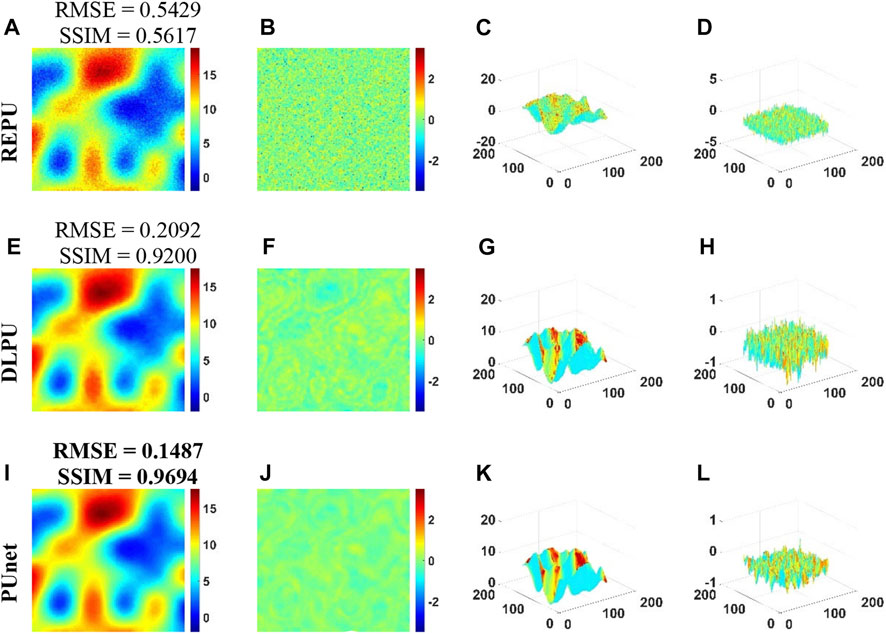
FIGURE 9. PU Error Analysis of REPU, DLPU, and PUnet with σ = 0.7. (A–D) is the PU result, PU error, PU surface and PU error surface of REPU, respectively. (E–H) is the PU result, PU error, PU surface and PU error surface of DLPU, respectively. (I–L) is the PU result, PU error, PU surface and PU error surface of PUnet, respectively. Above the subgraph in the first column is the quantization result corresponding to the subgraph.

FIGURE 10. PU Error Analysis of REPU, DLPU, and pUnet with σ = 0.7. From left to right: PU, PU error, surface of PU, and surface error of pU. Above the subgraph in the first column is the quantization result corresponding to the subgraph.
4.4 Real-world InSAR data experiments
We then tested the PU performance of REPU, DLPU, and pUnet on real-world InSAR data (Ronneberger et al., 2015). As REPU was a PU algorithm with a traditional cascaded framework, it was not able to handle high-level noise despite the fact of its anti-noise ability. Therefore, we used real-world InSAR data with lower noise to test the three algorithms to avoid the additional error caused by the introduction of a denoising algorithm. At the same time, considering that the quantitative analysis results can reflect the performance of the algorithms well, we finally chose to obtain real-world data from the digital elevation model (DEM) generated from the InSAR data collected by the TerraSAR satellite. Specifically, we obtained the absolute phase by removing the geocoding in the DEM. We performed the
Table 2 provided the PU results of REPU, DLPU, and pUnet on the 400 real-world (128 × 128) InSAR data samples (shown in the form of RMSE and SSIM). Figure 11 showed four wrapping phases randomly selected from the 400 real-world InSAR samples and their computation results by three algorithms. From Table 2 and Figure 11, the PU results of REPU, DLPU, and pUnet were all significantly effective in terms of detail preservation, where pUnet had a stable advantage in detail retention ability. REPU was not sufficiently capable in discriminating the details of the wrapped phase. Compared with the PU results of the three algorithms for “Wrapped phase-3″, REPU lacked the ability to recognize and reconstruct details (see the black boxes in the figure). From the performance comparison of the algorithms, pUnet presented strong stability when considering real-world InSAR data in terms of the RMSE.
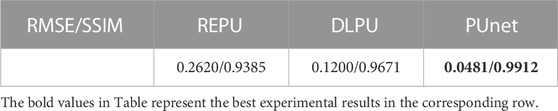
TABLE 2. Average root means square error/average structural similarity (RMSE/SSIM) between Ground truth and PU of REPU, DLPU, and pUnet under different noise conditions and 2000 real-world samples.

FIGURE 11. PU results of REPU, DLPU, and pUnet on four wrapped phases extracted from real-world InSAR data. From top to bottom: Wrapped phase, the correct absolute phase (Ground truth), the PU of REPU, the PU of DLPU and the PU of PUnet. Above the subgraphs in the third to fifth rows are the quantization results corresponding to the subgraphs.
Figure 12 showed a sample selected from real-world InSAR data with complex features. These data are prone to aliasing effect in the PU process. We used this sample for specific error analysis of REPU, DLPU, and PUnet. Combining the Ground truth in Figures 13A, D and Figure 12, REPU slightly aliased and lost a lot of detail in the upper half of the image (red part in Figure 13A). In contrast, from Figure 13H, the error margin of the PU result of DLPU was much smaller than that of REPU. However, comparing the Surfaces in Figure 13G; Figure 12, the PU results of DLPU were over-fitted from the details in the black box. Figure 13J–L indicated that pUnet only had a slight error in the overlap of interference fringes, which are prone to aliasing effects. Furthermore, we could infer the excellent ability of PUnet, in terms of detail preservation by comparing the Ground truth and Surface in Figure 13I–K; Figure 12.
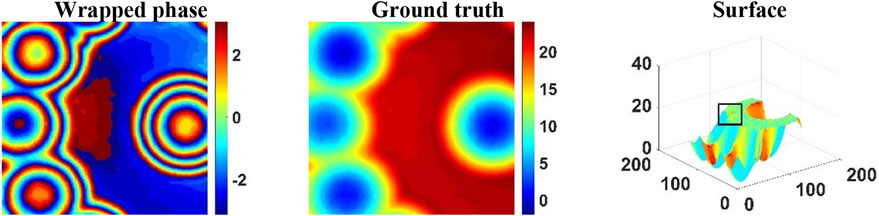
FIGURE 12. Test samples from real-world InSAR data for error analysis. From left to right: Wrapped phase, Ground truth, and Surface of Ground truth.
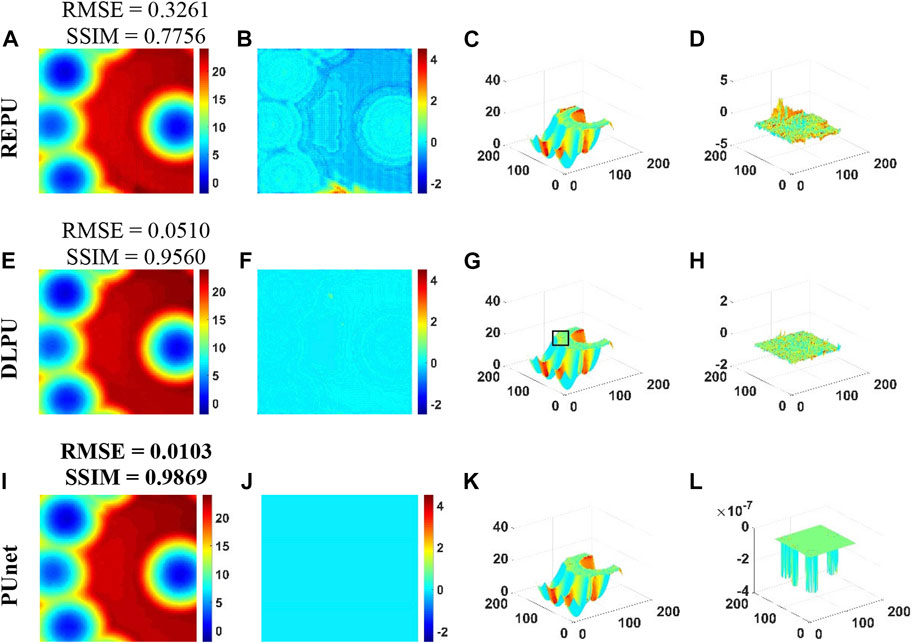
FIGURE 13. PU Error Analysis of REPU, DLPU, and PUnet on test samples from real-world InSAR data. (A–D) is the PU result, PU error, PU surface and PU error surface of REPU, respectively. (E–H) is the PU result, PU error, PU surface and PU error surface of DLPU, respectively. (I–L) is the PU result, PU error, PU surface and PU error surface of PUnet, respectively. Above the subgraph in the first column is the quantization result corresponding to the subgraph.
Table 3 showed the PU performance of REPU, DLPU and pUnet on real world InSAR data with coherent noise. The PU result of REPU was significantly affected by the coherent noise. The anti-noise ability of DLPU and pUnet was still effective for coherent noise. As shown in Figure 14 Figure 15, DLPU and pUnet were far better than REPU in noise resistance. Regarding RMSE and SSIM, pUnet had stable advantages over DLPU. The result of the experiment of coherent noise has proved that pUnet had the function of removing coherent noise in PU process, reflecting the robustness of PUnet.
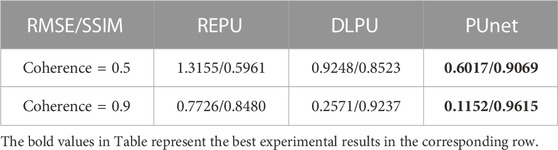
TABLE 3. Average root means square error/average structural similarity (RMSE/SSIM) between Ground truth and PU of REPU, DLPU, and pUnet under different noise conditions and 400 real-world samples.
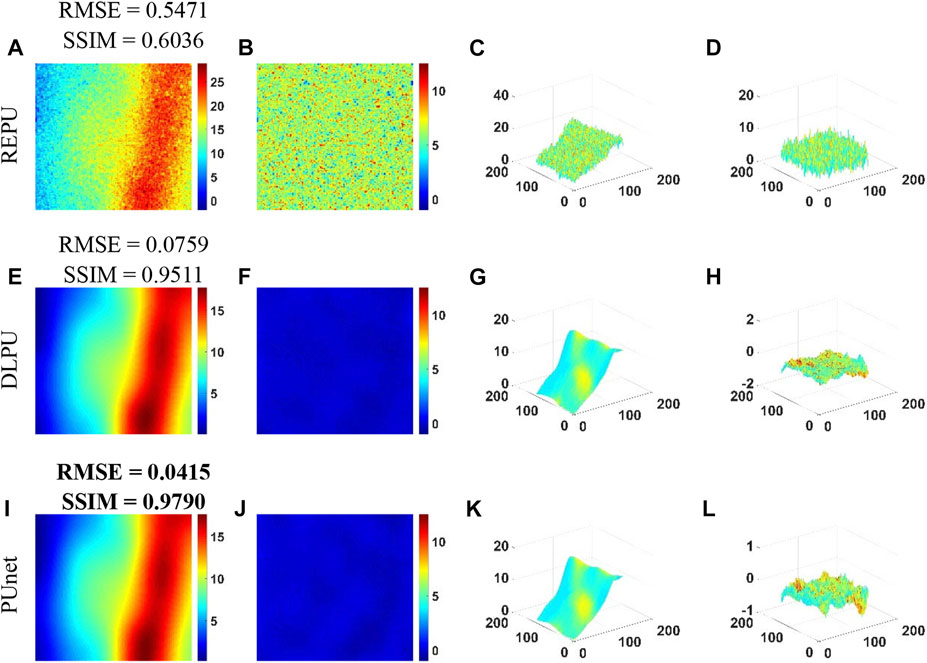
FIGURE 14. PU Error Analysis of REPU, DLPU, and PUnet on test samples from real-world InSAR data with Coherent noise (coherence = 0.5). (A–D) is the PU result, PU error, PU surface and PU error surface of REPU, respectively. (E–H) is the PU result, PU error, PU surface and PU error surface of DLPU, respectively. (I–L) is the PU result, PU error, PU surface and PU error surface of PUnet, respectively. Above the subgraph in the first column is the quantization result corresponding to the subgraph.
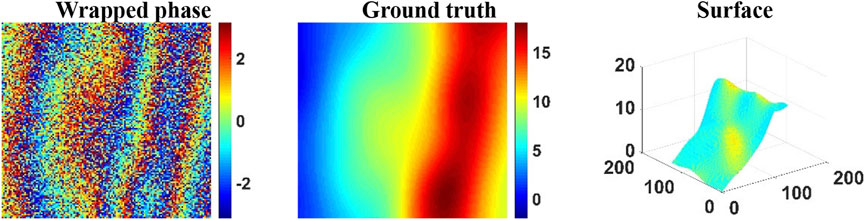
FIGURE 15. PU Error Analysis of REPU, DLPU, and pUnet on test samples from real-world InSAR data with Coherent noise (coherence = 0.5). From left to right: PU, PU error, surface of PU, and surface error of pU. Above the subgraph in the first column is the quantization result corresponding to the subgraph.
Considering that DLPU and our proposed pUnet had considerable anti-noise ability, we selected three InSAR images (Figure 16A–C) collected by the European Remote Sensing Satellite (ERS) and published by European Space Agency (ESA) to conduct qualitative experiments on DLPU and PUnet. This test posed a serious challenge to the anti-noise ability of DLPU and pUnet because the selected images contained unknown noise and the noise level was high. The selected images corresponded to the area of Evaggelistria, Greece (from
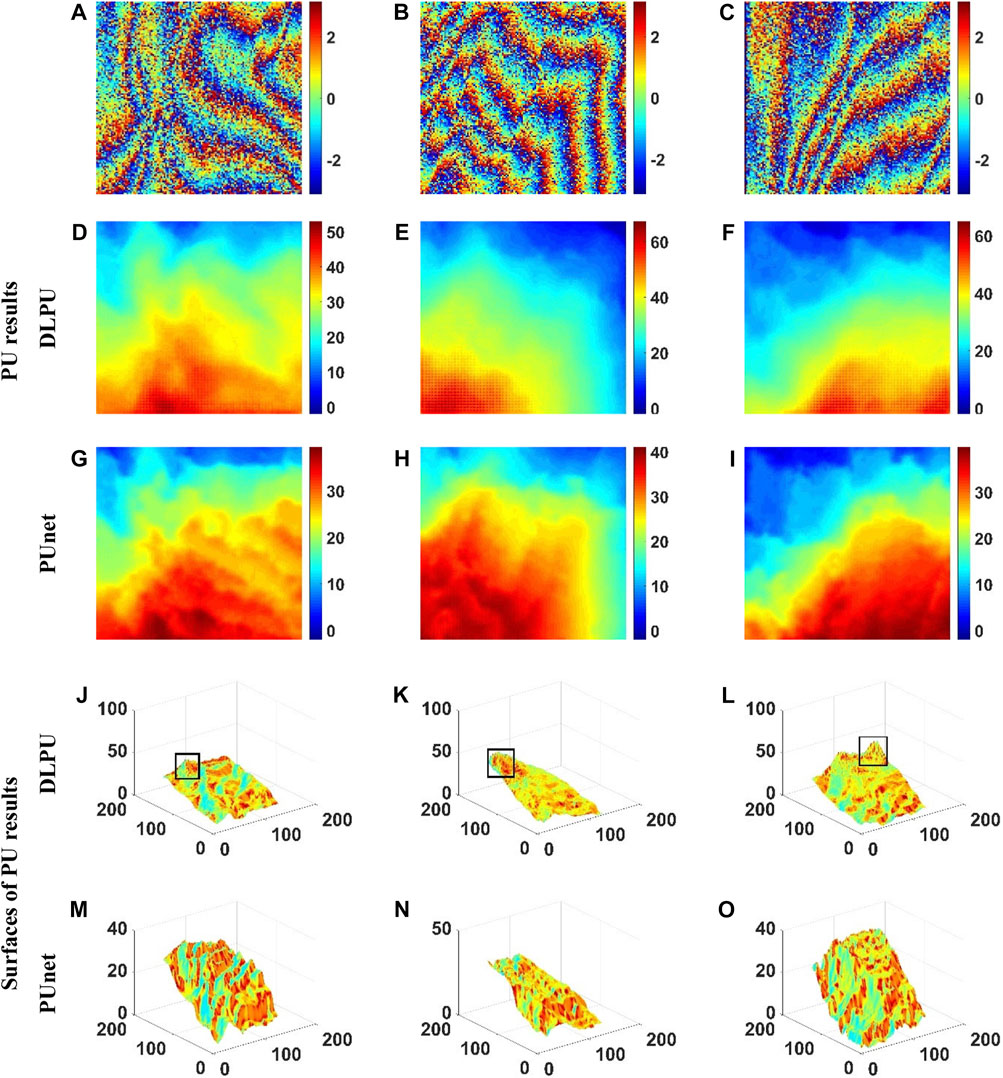
FIGURE 16. PU experiments of DLPU and pUnet on real-world InSAR data collected by the European Remote Sensing Satellite (ERS): (A–C) Real-world wrapped phases used for testing; (D–F) the PU results of DLPU; (G–I) the PU results of PUnet; (J–L) the surface of the PU result of DLPU; and (M–O) the surface of the PU result of PUnet.
Figure 16 presented the PU results of DLPU (σ = 0.7) and PUnet (σ = 0.7) on the three InSAR images with unknown noise. Although there was no ground truth as a benchmark, the significant difference between the PU results of DLPU and pUnet can be found. Comparing Figures 16D–F; Figures 16G–I, the PU results of DLPU were missing a lot of detail. In areas with large elevation differences, pUnet was much stronger than DLPU in terms of detail retention which was demonstrated by the red areas in Figure 16D–I; Figures 16G–I. Furthermore, the details in the black boxes in Figures 16J–L also demonstrated that the PU results of DLPU had many errors in regions with large elevation differences. In addition, DLPU seriously omitted topographic information contained in the wrapped phase under the double interference of unknown noise and irregular interference fringes. It could be demonstrated through comparison of Figures 16K, N. In contrast, the curved surfaces of the PU results of pUnet presented in Figures 16M–O are satisfactory, demonstrating the strong anti-noise ability of PUnet.
4.5 Discussion on the efficiency of three algorithms
Our experiments were performed on a graphics workstation configured with an Intel Xeon Gold 5120T CPU and an NVIDIA Tesla V100 GPU. The second row of Table 4 provided time required for DLPU and pUnet to complete training on the same training set (20,000 training samples). The third row of Table 4 showed the average test time of REPU, DLPU, and pUnet for each test sample in the simulated (2000 test samples) and real-world (400 test samples) data experiments. DLPU was trained on an NVIDIA Tesla V100 GPU for a training duration of 9 h (with PyTorch 1.4.0) with a total of 100 epochs with a batch size of 32 and a learning rate of 0.005. There was not much difference in training time between DLPU and pUnet on the same training set, but pUnet presented a slight advantage. It may be that the design concept of Inception (Szegedy et al., 2016) was applied in the design of the encoder (decoder) of PUnet. As shown in Figure 2, we used 1 × 1 con-volution in the first branch to reduce the dimension of the feature map, resulting in the decrease of the computational complexity. On the other hand, this multi branch parallel structure was more efficient than the series structure of multi modules used in DLPU because the parallel structure can play more effectively the performance of GPU to improve the training efficiency. In the test time of a single sample, the difference between the operation time of DLPU and pUnet was also small. it is noted that the test time of DLPU and pUnet for a single test sample was almost the same for the simulation and real-world data experiments. The real-world data contained many special terrain types and objects which were not found in the simulation test set indicating that the test time of DLPU and pUnet was not significantly impacted regardless of whether the test sample contained special terrain and objects. This finding was also consistent with the principle of deep regression methods. In addition, we applied the network model when we adopted a deep regression method to test the test samples. The feature information of the model was obtained from training to perform regression operations on the test samples and not directly related to the features contained in the test samples. Both DLPU and pUnet showed good PU results on the real-world data, which may further verify that deep regression methods could extract more deep feature information from many training samples. This information enabled the network model to adapt and identify complex features in the test set and eventually achieved good results in testing. At the same time, the findings showed that there was a gap in the testing time of REPU for a single test sample between the simulation and the real-world data. REPU judged and learned the gradient information between each pixel in the interferogram based on a probability model. Therefore, the presence of special terrain and objects in the test sample may affect the test time of REPU. This effect was more significant than that for DLPU and PUnet.
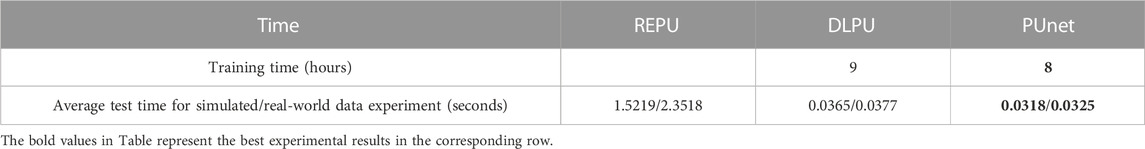
TABLE 4. The training time of DLPU and pUnet in the simulation experiments, and the test time of REPU, DLPU, and pUnet in the simulation and real-world data experiments.
In general, the computational efficiency of REPU, DLPU, and pUnet needs to be considered. When dealing with data with complex features, the efficiency of REPU may be significantly reduced; therefore, DLPU and pUnet were significantly effective when processing large batches of data.
5 Conclusion
This study proposed PUnet, a simple, robust, and remarkably efficient framework for PU of SAR interferometric images. It had a good phase unwrapping effect on the noisy wrapped phase and could effectively unwrap the clean wrapped phase. pUnet presented good performance under different levels of interference and noise levels, both in simulation experiments and experiments on real InSAR data. In terms of quantitative results, the performance of pUnet in various indicators was more stable than other algorithms used for comparison (simulation experiments: noise-free phase unwrapping, RMSE = 0.0302, SSIM = 0.9981; noise variance 0.32/2 phase unwrapping, RMSE = 0.0399, SSIM = 0.9806; noise variance 0.52/2 phase unwrapping, RMSE = 0.0456, SSIM = 0.9715; noise variance 0.72/2 phase unwrapping, RMSE = 0.0671, SSIM = 0.9640; real-world InSAR data phase unwrapping: RMSE = 0.0481, SSIM = 0.9912). Furthermore, pUnet maintained advantageous detail preservation in the absolute phase in the qualitative analysis. It is also noted that pUnet achieved sufficient extraction of phase features when considering a simple structure. Specifically, we proposed a phase unwrapping learning block, which replaced the traditional convolutional layers. Simultaneously, we only used the attention module to extract the depth information of the high-dimensional feature maps instead of using the attention module excessively, after completing all down-sampling. This design could simplify the network structure and control the computational cost of the network. Future study needs to focus on developing a phase unwrapping function based on pUnet that can be applied to interferometric phases in more complex environments.
Data availability statement
The original contributions presented in the study are included in the article/supplementary material, further inquiries can be directed to the corresponding author.
Author contributions
All authors listed have made a substantial, direct, and intellectual contribution to the work and approved it for publication.
Funding
This research was funded by the National Natural Science Foundation of China, grant number 61801513 and 61902201.
Acknowledgments
We sincerely thank Professor J.M. Bioucas-Dias for his help in this study.
Conflict of interest
The authors declare that the research was conducted in the absence of any commercial or financial relationships that could be construed as a potential conflict of interest.
Publisher’s note
All claims expressed in this article are solely those of the authors and do not necessarily represent those of their affiliated organizations, or those of the publisher, the editors and the reviewers. Any product that may be evaluated in this article, or claim that may be made by its manufacturer, is not guaranteed or endorsed by the publisher.
References
An, L., Xiang, Q. S., and Chavez, S. (2000). A fast implementation of the minimum spanning tree method for phase unwrapping. Ieee. Trans. Med. Imag. 19, 805–808. doi:10.1109/42.876306
Chen, C. (2001). Statistical-cost network-flow approaches to two-dimensional phase unwrapping for radar interferometry. Stanford, CA: Ph.D. dissertation, Stanford Univ.
Chen, C. W., and Zebker, H. A. (2011). Two-dimensional phase unwrapping with use of statistical models for cost functions in nonlinear optimization. J. Opt. Soc. Amer. A, Opt. Image Sci. 18, 338–351. doi:10.1364/JOSAA.18.000338
Chen, S., Zhang, J., Zhan, R., Zhu, R., and Wang, W. (2022). Few shot object detection for SAR images via feature enhancement and dynamic relationship modeling. Remote Sens. 14, 3669. doi:10.3390/rs14153669
Costantini, M. A. (1998). A novel phase unwrapping method based on network programming. IEEE Trans. Geosci. Remote Sens. 36, 813–821. doi:10.1109/36.673674
Costantini, M. (1998). A novel phase unwrapping method based on network programming. IEEE Trans. Geosci. Remote Sens. 36, 813–821. doi:10.1109/36.673674
Dardikman-Yoffe, G., Roitshtain, D., Mirsky S, K., Turko N, A., Habaza, M., and PhUn-Net, T. Shaked N. (2020). PhUn-net: Ready-to-use neural network for unwrapping quantitative phase images of biological cells. Biomed. Opt. Express 11, 1107. doi:10.1364/BOE.379533
Deledalle, C. A., Denis, L., and Tupin, F. N. L-InS. A. R. (2011). NL-InSAR: Nonlocal interferogram estimation. IEEE Trans. Geosci. Remote Sens. 49, 1441–1452. doi:10.1109/TGRS.2010.2076376
Dias, J. M. B., and Leitao, J. M. N. (2002). The ZπM algorithm: A method for interferometric image reconstruction in SAR/SAS. IEEE Trans. Image Process. 11, 408–422. doi:10.1109/TIP.2002.999675
Dias, J. M. B., and Valadao, G. (2007). Phase unwrapping via graph cuts. IEEE Trans. Image Process. 16, 698–709. doi:10.1109/TIP.2006.888351
Ferretti, A., Monti-Guarnieri, A., Prati, C., and Rocca, F. (2007). InSAR principles: Guidelines for SAR interferometry processing and interpretation. Netherlands: ESA: Noordwijk.
Flynn, T. J. (1997). Two-dimensional phase unwrapping with minimum weighted discontinuity. J. Opt. Soc. Amer. A, Opt. Image Sci. 10, 2692–2701. doi:10.1364/JOSAA.14.002692
Gao, D., and Yin, F. (2012). Mask cut optimization in two-dimensional phase unwrapping. IEEE Geosci. Remote Sens. Lett. 9, 338–342. doi:10.1109/LGRS.2011.2168940
Gao, Y., Zhang, S., Li, T., Chen, Q., Zhang, X., and Li, S. (2019). Refined two-stage programming approach of phase unwrapping for multi-baseline SAR interferograms using the unscented kalman filter. Remote Sens. 11, 199. doi:10.3390/rs11020199
Ghiglia, D. C., and Pritt, M. D. (1998). Two-dimensional phase unwrapping: Theory, algorithms, and software. Wiley.
Ghiglia, D. C., and Romero, L. A. (1996). Minimum Lp-norm two-dimensional phase unwrapping. J. Opt. Soc. Amer. A, Opt. Image Sci. 13, 1999–2013. doi:10.1364/JOSAA.13.001999
Goldstein, R. M., Zebker, H. A., and Werner, C. L. (1988). Satellite radar interferometry: Two-dimensional phase unwrapping. Radio Sci. 23, 713–720. doi:10.1029/RS023i004p00713
He, J., Sandimo, C., Zeng, D., Vasanawala, S., and Cheng, J. (2019). Deep spatiotemporal phase unwrapping of phasecontrast MRI data. Proc. Int. Soc. Magn. Reson. Med. 27, 1962.
Herraez, M. A., Villatoro, F. R., and Gdeisat, M. A. (2016). A robust and simple measure for quality-guided 2D phase unwrapping algorithms. IEEE Trans. Image Process. 25, 2601–2609. doi:10.1109/TIP.2016.2551370
Hongxing, H., and LingdaPUMA-Spa, W. (2014). PUMA-SPA: A phase unwrapping method based on puma and second-order polynomial approximation. IEEE Geosci. Remote Sens. Lett. 11, 1906–1910. doi:10.1109/LGRS.2014.2313854
Hongxing, H., Bioucas-Dias, J. M., and Katkovnik, V. (2015). Interferometric phase image estimation via sparse coding in the complex domain. IEEE Trans. Geosci. Remote Sens. 53, 2587–2602. doi:10.1109/TGRS.2014.2361919
Jian, G. (2016). Reliability-map-guided phase unwrapping method. IEEE Geosci. Remote Sens. Lett. 13, 716–720. doi:10.1109/LGRS.2016.2539298
Krieger, G., Menini, A. T-X., Fiedler, H., Hajnsek, I., Werner, M., Younis, M., et al. (2007). TanDEM-X: A satellite formation for high-resolution SAR interferometry. IEEE Trans. Geosci. Remote Sens. 45 (11), 3317–3341. doi:10.1109/TGRS.2007.900693
Li, L., Zhang, H., Tang, Y., Wang, C., and Gu, F. (2022). InSAR phase unwrapping by deep learning based on gradient information fusion. IEEE Geosci. Remote Sens. Lett. 19, 1–5. doi:10.1109/LGRS.2021.3127318
Liu, Y., Han, Y., Li, F., and Zhang, Q. (2018). Speedup of minimum discontinuity phase unwrapping algorithm with a reference phase distribution. Opt. Commun. 417, 97–102. doi:10.1016/j.optcom.2018.02.025
Nico, G., Palubinskas, G., and Datcu, M. (2000). Bayesian approaches to phase unwrapping: Theoretical study. IEEE Trans. Signal Process. 48 (9), 2545–2556. doi:10.1109/78.863057
Park, S., Kim, Y., and Moon, I. (2021). Automated phase unwrapping in digital holography with deep learning. Biomed. Opt. Express 12, 7064. doi:10.1364/BOE.440338
Perera, M. V., and De Silva, A. (2021). A joint convolutional and spatial quad-directional LSTM network for phase unwrapping. ICASSP, 4055–4059. doi:10.1109/ICASSP39728.2021.9414748
Qin, Y., Wan, S., Wan, Y., Weng, J., Liu, W., and Gong, Q. (2020). Direct and accurate phase unwrapping with deep neural network. Appl. Opt. 59, 7258. doi:10.1364/AO.399715
Ronneberger, O., Fischer, P., and Brox, T. (2015). U-Net: Convolutional networks for biomedical image segmentationInternational conference on medical image computing and computer-assisted intervention. Springer International Publishing.
Sica, F., Calvanese, F., Scarpa, G., and Rizzoli, P. (2020). A CNN-based coherence-driven approach for InSAR phase unwrapping. IEEE Geosci. Remote Sens. Lett. 99, 1–5. doi:10.1109/LGRS.2020.3029565
Spoorthi, G. E., Gorthi, S., and Gorthi, R. K. S. S. (2018). PhaseNet: A deep convolutional neural network for two-dimensional phase unwrapping. IEEE Signal Process. Lett. 26, 54–58. doi:10.1109/LSP.2018.2879184
Szegedy, C., Vanhoucke, V., Ioffe, S., Shlens, J., and Wojna, Z. (2016). Rethinking the inception architecture for computer vision. IEEE Conf. Comput. Vis. Pattern Recognit. (CVPR). IEEE, 2818–2826. doi:10.1109/CVPR.2016.308
Vaswani, A., Shazeer, N., Parmar, N., Uszkoreit, J., Jones, L., Gomez, A. N., et al. (2017). Attention is all you need. arXiv.
Wang, K., Li, Y., Qian, K., Di, J., and Zhao, J. (2019). One-step robust deep learning phase unwrapping. Opt. Express 27, 15100. doi:10.1364/OE.27.015100
Wang, K., Qian, K., Di, J., and Zhao, J. (2022). Deep learning spatial phase unwrapping: A comparative review. Adv. Photonics Nexus 1, 014001. doi:10.1117/1.APN.1.1.014001
Woo, S., Park, J., Lee, J. Y., and Kweon, S. (2018). Cbam: Convolutional block attention module. Cham: Springer.
Wu, C., Qiao, Z., Zhang, N., Li, X., Huang, Y., Song, H., et al. (2020). Phase unwrapping based on a residual en-decoder network for phase images in Fourier domain Doppler optical coherence tomography. Biomed. Opt. Express. 11, 1760. doi:10.1364/BOE.386101
Xu, J., An, D., Huang, X., and Yi, P. (2016). An efficient minimum-discontinuity phase-unwrapping method. IEEE Geosci. Remote Sens. Lett. 13, 666–670. doi:10.1109/LGRS.2016.2535159
Xu, W., and Cumming, I. (1999). A region-growing algorithm for InSAR phase unwrapping. IEEE Trans. Geosci. Remote Sens. 37, 124–134. doi:10.1109/36.739143
Yamaki, R., and Hirose, A. (2007). Singularity-spreading phase unwrapping. IEEE Trans. Geosci. Remote Sens. 45, 3240–3251. doi:10.1109/TGRS.2007.906973
Ying, L., Liang, Z., Munson, D., Koetter, R., and Frey, B. (2006). Unwrapping of MR phase images using a Markov random field model. IEEE Trans. Med. Imag. 25, 128–136. doi:10.1109/TMI.2005.861021
Yu, H., Xing, M., and Bao, Z. (2013). A fast phase unwrapping method for large-scale interferograms. IEEE Trans. Geosci. Remote Sens. 51, 4240–4248. doi:10.1109/TGRS.2012.2229284
Yuan, Z., Chen, T., Xing, X., Peng, W., and Chen, L. (2022). BM3D denoising for a cluster-analysis-based multibaseline InSAR phase-unwrapping method. Remote Sens. 14, 1836. doi:10.3390/rs14081836
Zhan, T., Jiang, S., Zhao, Z., Dixit, K., Zhou, X., Hou, J., et al. (2019). Rapid and robust two-dimensional phase unwrapping via deep learning. Opt. Express. 27, 23173. doi:10.1364/OE.27.023173
Zhang, J., Tian, X., Shao, J., Luo, H., and Liang, R. (2019). Phase unwrapping in optical metrology via denoised and convolutional segmentation networks. Opt. Express. 27, 14903. doi:10.1364/OE.27.014903
Zhang, Y., Zhang, S., Gao, Y., Li, S., Jia, Y., and Li, M. (2022). Adaptive square-root unscented kalman filter phase unwrapping with modified phase gradient estimation. Remote Sens. 14, 1229. doi:10.3390/rs14051229
Zhao, M., Huang, L., Zhang, Q., Su, X., Asundi, A., and Kemao, Q. (2011). Quality-guided phase unwrapping technique: Comparison of quality maps and guiding strategies. Appl. Opt. 50, 6214–6224. doi:10.1364/AO.50.006214
Zhou, L., Yu, H., Lan, Y., and Xing, M. (2021). Deep learning-based branch-cut method for InSAR two-dimensional phase unwrapping. IEEE Trans. Geosci. Remote Sens. 10, 1–15. doi:10.1109/TGRS.2021.3099997
Zhou, L., Yu, H., Lan, Y., and xing, m. (2021). Artificial intelligence in interferometric synthetic aperture radar phase unwrapping: A review. IEEE Geoscience Remote Sens. Mag. 9, 10–28. doi:10.1109/MGRS.2021.3065811
Keywords: synthetic aperture radar interferometry (InSAR), phase unwrapping, attention mechanism, positional encoding, robust feature extraction
Citation: Liu B, Wu L, Song X, Hao H, Zou L and Lu Y (2023) PUnet: A robust framework for phase unwrapping in interferometric SAR. Front. Environ. Sci. 11:1138399. doi: 10.3389/fenvs.2023.1138399
Received: 12 January 2023; Accepted: 20 February 2023;
Published: 07 March 2023.
Edited by:
Flavio Cannavò, National Institute of Geophysics and Volcanology, ItalyReviewed by:
Zhipeng Fu, Peng Cheng Laboratory, ChinaXiangli Meng, Beijing Jiaotong University, China
Copyright © 2023 Liu, Wu, Song, Hao, Zou and Lu. This is an open-access article distributed under the terms of the Creative Commons Attribution License (CC BY). The use, distribution or reproduction in other forums is permitted, provided the original author(s) and the copyright owner(s) are credited and that the original publication in this journal is cited, in accordance with accepted academic practice. No use, distribution or reproduction is permitted which does not comply with these terms.
*Correspondence: Boyu Liu, bGl1Ym95dTAxMDhAMTYzLmNvbQ==