 Hamid Gholami
 Aliakbar Mohammadifar
 Kathryn E. Fitzsimmons
 Yue Li
 Dimitris G. Kaskaoutis
- 1Department of Natural Resources Engineering, University of Hormozgan, Bandar-Abbas, Hormozgan, Iran
- 2Department of Geosciences, University of Tuebingen, Tuebingen, Germany
- 3State Key Laboratory of Loess and Quaternary Geology, Institute of Earth Environment, Chinese Academy of Sciences, Xi’an, China
- 4CAS Center for Excellence in Quaternary Science and Global Change, Xi’an, China
- 5University of Chinese Academy of Sciences, Beijing, China
- 6Institute for Environmental Research and Sustainable Development, National Observatory of Athens, Athens, Greece
Predicting land susceptibility to wind erosion is necessary to mitigate the negative impacts of erosion on soil fertility, ecosystems, and human health. This study is the first attempt to model wind erosion hazards through the application of a novel approach, the graph convolutional networks (GCNs), as deep learning models with Monte Carlo dropout. This approach is applied to Semnan Province in arid central Iran, an area vulnerable to dust storms and climate change. We mapped 15 potential factors controlling wind erosion, including climatic variables, soil characteristics, lithology, vegetation cover, land use, and a digital elevation model (DEM), and then applied the least absolute shrinkage and selection operator (LASSO) regression to discriminate the most important factors. We constructed a predictive model by randomly selecting 70% and 30% of the pixels, as training and validation datasets, respectively, focusing on locations with severe wind erosion on the inventory map. The current LASSO regression identified eight out of the 15 features (four soil property categories, vegetation cover, land use, wind speed, and evaporation) as the most important factors controlling wind erosion in Semnan Province. These factors were adopted into the GCN model, which estimated that 15.5%, 19.8%, 33.2%, and 31.4% of the total area is characterized by low, moderate, high, and very high susceptibility to wind erosion, respectively. The area under curve (AUC) and SHapley Additive exPlanations (SHAP) of game theory were applied to assess the performance and interpretability of GCN output, respectively. The AUC values for training and validation datasets were estimated at 97.2% and 97.25%, respectively, indicating excellent model prediction. SHAP values ranged between −0.3 and 0.4, while SHAP analyses revealed that the coarse clastic component, vegetation cover, and land use were the most effective features of the GCN output. Our results suggest that this novel suite of methods is highly recommended for future spatial prediction of wind erosion hazards in other arid environments around the globe.
1 Introduction
Soil erosion by water and wind are the two main processes leading to its degradation (Webb et al., 2016; Duniway et al., 2019; Soloki and Noori Nahad, 2019; Liu et al., 2021; Jia et al., 2022). Soil erosion by wind is an environmental hazard, which threatens land productivity and ecosystems, reduces atmospheric visibility during dust storms, and affects ecosystems, animal, and human health (Gregory et al., 2004). Wind erosion affects ∼28% of degraded land worldwide (Oldeman, 1994; Borrelli et al., 2014). However, predicting susceptibility to wind erosion remains a difficult task to be accurately quantified (Webb and Strong, 2011; Forootan, 2022). On the other hand, predicting land susceptibility to wind erosion is highly beneficial for mitigating its negative consequences, such as depletion of soil organic carbon, decreased soil depth, reduced soil structure stability in situ, increased dust aerosol loading, degradation of air quality, and increased respiratory diseases off-site (Xu et al., 2018; Gholami et al., 2020a; Gholami et al., 2021a; Tian et al., 2021; Boroughani et al., 2022).
Wind erosion is a serious environmental problem in large areas of Iran, especially in the central, eastern, and southern parts of the country (Gholami et al., 2020a; Gholami et al., 2020b). It is estimated that an area of 23.8 million ha is affected by wind erosion, of which 51% is susceptible to aeolian entrainment, 31% experiences significant aeolian transport, and 18% represents the area dominated by sedimentation (Ahmadi, 1999). The frequency of dust storms has increased substantially across Iran over the last 20 years, exacerbated by prolonged dry conditions during 2000–2002 and 2008–2010 (Akoglu et al., 2015; Duniway et al., 2019; Hamzeh et al., 2021; Rashki et al., 2021). In order to mitigate the effects of wind erosion and associated dust storms on the atmosphere, geosphere, and biosphere, the prediction and mapping of land susceptibility to wind erosion are essential (Gholami et al., 2020c; Jafari et al., 2022; Pourhashemi et al., 2022).
Wind erosion depends on a range of variables such as vegetation cover, land surface characteristics, and climatic parameters (Gillette, 1979; Parajuli et al., 2014; Padarian et al., 2020). The contribution of each variable to erosion susceptibility remains poorly understood and is highly region-specific, while it is necessary to be defined in order to effectively model the spatial distribution of wind erosion hazards (Gholami et al., 2021c; Kannangara et al., 2022). Feature selection (FS) is a critical step in the application of data mining (DM) models (Kursa and Rudnicki, 2010). Various FS algorithms, such as Boruta, leave one feature out (LOFO), and DM models (e.g., random forest, tree-based genetic algorithms, multivariate adaptive regression spline (MARS), CForest, and Cubist), have been widely used to select key controlling factors for environmental hazards such as flood, land subsidence, landslides, and dust emissions (Hamza et al., 2019; Effrosynidis and Arampatzis, 2021).
Data mining (DM) is a component of data science (DS), which has frequently been widely used for spatial predictions in environmental and hydrological sciences (Gibert et al., 2018; Chowdhuri et al., 2021a; Chen et al., 2021; Saha et al., 2021; Arabameri et al., 2022; Chowdhuri et al., 2022; Saha et al., 2022). Over the past few years, different types of DM models (e.g., ANFIS, frequency ratio, weights of evidence, Cubist, CForest, and extreme gradient boosting) have been applied to map land susceptibility to wind erosion and dust emissions in various parts of Iran, vulnerable to wind erosion, desertification, and climate change (Gholami et al., 2020a; Boroughani et al., 2020; Gholami et al., 2020c). Furthermore, recurrent neural network (RNN), restricted Boltzmann machine (RBM), gcForest, bidirectional long short-term memory (Bi-LSTM), and Gaussian copula-based multivariate model, as deep learning (DL) models, have been used for the spatial modeling of dust provenance over the globe (Gholami et al., 2021a; Gholami et al., 2021c). DL modeling is specifically interesting because this approach overcomes many of the restrictions placed on the modeling process by traditional machine learning (ML) or shallow models. In comparison with the traditional or shallow models, different architectures of DL transform the data presentation at one level into a representation at a higher level (LeCun et al., 2015). DL is increasingly being used as a tool to investigate a range of scientific problems, including spatial modeling of environmental issues (Chowdhuri et al., 2021b; Mohammadifar et al., 2021b; Gholami and Mohammadifar, 2022; Mohammadifar et al., 2022). Typical DL models can be divided into four classes, namely, stacked auto-encoder (SAE), deep belief network (DBF), recurrent neural network (RNN), and convolutional neural network (CNN) (Zhang et al., 2018), of which CNN is one of the most popular for prediction goals (Reiss and Bogenberger, 2016; Zhang et al., 2016). One branch of CNN, the convolutional graph neural networks (ConvGNNs), has been applied to a wide range of research topics including computer vision (Monti et al., 2017), natural language processing, traffic prediction (Li et al., 2018), social analysis (Backstrom and Leskovec, 2011), bioinformatics, and fraud detection (Akoglu et al., 2015; Zhang et al., 2017; Zhang et al., 2019), but has not yet been investigated for environmental issues. The ConvGNN approach shows promising results for environmental hazard prediction due to the advantage of graphs to capture structural relations between data over analysis of data in isolation. Overall, ConvGNNs (Zhang et al., 2019) can be classified into the spectral-based techniques (Defferrard et al., 2016; Kipf and Welling, 2016) and spatial-based techniques (Monti et al., 2017; Veličković et al., 2017). In addition, aspects of game theory may be used to assess the interpretability of predictive DM and DL models. Previous environmental studies have successfully made use of SHapley Additive exPlanations (SHAP) from game theory to interpret predictive DM models for digital soil mapping and soil erosion by water (Padarian et al., 2020; Mohammadifar et al., 2021a). These early results indicate that it may be beneficial to explore game theory through SHAP, in order to assess the interpretability of our GCN model outputs for wind erosion.
This study aimed to investigate novel tools for the prediction of susceptibility to wind erosion on the central Iranian Plateau (Semnan Province). To the best of our knowledge, this work is the first attempt at mapping wind erosion hazards by combining LASSO regression, graph convolutional networks (GCNs), and game theory. Game theory (SHAP) was applied to assess the interpretability of the DL results. The main objectives and goals of this study were as follows: 1) the identification of the most important factors controlling wind erosion for the study area using LASSO regression, 2) the spatial prediction of land susceptibility to wind erosion by applying a GCN deep learning model with Monte Carlo dropout, 3) the evaluation of the GCN model using the receiver-operating characteristic area under curve (ROC-AUC) approach, and 4) the examination of the interpretability of our predictive GCN model using game theory. We assess, on the basis of our case study, whether this approach could be applied for spatial mapping of dryland hazards such as wind erosion and dust plume transport worldwide.
2 Materials and methods
2.1 Study area
Semnan Province is a region covering 97,322 km2 in the northern part of the central Iranian Plateau, lying on the southern margins of the Alborz mountain range (Figure 1). The region is hyper-arid to semi-arid, with rough terrain and low population density, covering the northern part of the Kavir Desert. The altitude of the study area ranges substantially from 658 m in the south and central parts to 3,885 m in the north. Mean annual precipitation follows a steep gradient from 75 mm in the hyper-arid south to 699 mm in the more mountainous and vegetated northern part. The topography and climatic conditions contribute to significant variability in soil organic carbon stock (OCS) contents across the province, with values ranging from near zero in the central and southern parts to 78% in the north.
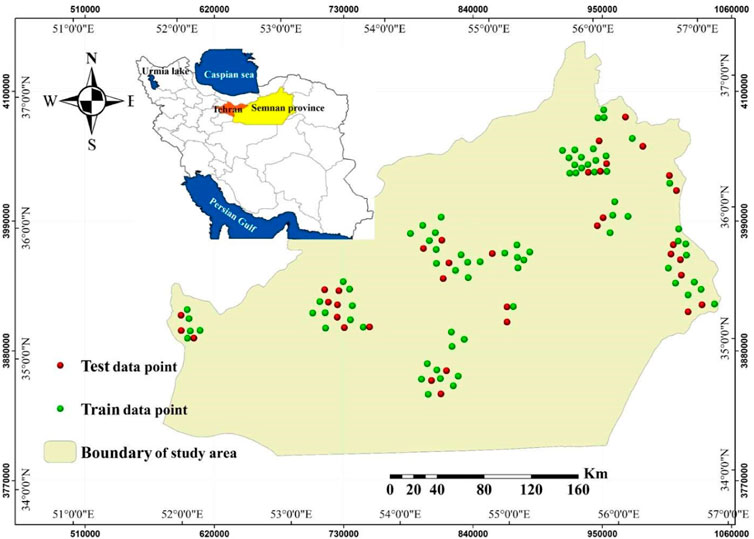
FIGURE 1. Location of Semnan Province in the Iranian map and the inventory map of wind erosion with training and test data points.
2.2 Mapping factors controlling wind erosion
Initially, maps for 15 potential factors controlling wind erosion in Semnan Province were generated (S1 and S2). The potential factors were selected based on previous studies investigating land susceptibility to wind erosion in Iran (Gholami et al., 2020b; Gholami et al., 2020c; Gholami et al., 2021b). These factors include topography, which is expressed through a digital elevation model (DEM), and spatial distribution of precipitation, evaporation, surface wind speed, normalized difference vegetation index (NDVI), soil bulk density, nitrogen and organic carbon stock (OCS), surface cation exchange capacity (CEC), proportion of surface sediment of clay, silt, sand, and percentage of the coarse fragment, lithology, and land use. The topographical data for the DEM were downloaded from https://earthexplorer.usgs.gov with a spatial resolution of 30 m × 30 m. Climatic/meteorological data (precipitation, evaporation, and wind speed) were derived and interpolated from measurements at 27 synoptic meteorological stations in Semnan Province and surrounding areas averaged over the period 2012–2019, and mapped in ArcGIS. The NDVI data were retrieved for June 2020 using the MODIS (Moderate Resolution Imaging Spectroradiometer) satellite sensor on the assumption that June is representative for average annual vegetation cover in Semnan Province. We assume that since vegetation in the province is sparse and comprises bushes, shrubs, and minimal tree cover, variability in NDVI values is minimal over the spring and summer months in Semnan Province. Soil characteristics were obtained from publicly available data (https://soilgrids.org) and mapped with a spatial resolution of 50 m × 50 m. The geology of Semnan Province is characterized by a number of lithological units ranging in age from Paleozoic through to Quaternary. In this study, we used existing geological maps generated by the Iranian Geological Survey and Mineral Exploration department. Furthermore, we incorporated land use maps for the year 2020 from the Iran Forest, Rangeland, and Watershed Management Organization (IFRWMO). Since the spatial resolution of potential factors in various constructed maps is not uniform, all input layers used for modeling were converted to a consistent spatial resolution of 50 × 50 m. The details of input data used in the modeling process are presented in Table 1. It should be noted that most of the variables here are used as controls for the topographical, land use, and soil characteristics of the examined area that are fixed and not changed along season.
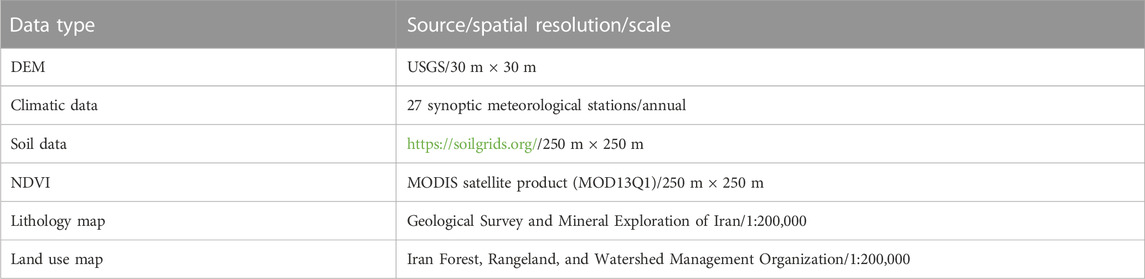
TABLE 1. Details of input data used in the modeling process.
2.3 Inventory map of wind erosion
We then developed an inventory map for predicting land susceptibility to wind erosion (Gholami et al., 2020a) over the study region, using a previously generated map of the regions for which active wind erosion has been monitored from the IFRWMO. Furthermore, 70% and 30% of the pixels (80 pixels and 33 pixels, respectively) in these regions (Figure 1) were randomly selected for training and test (validation) datasets, to build a new predictive model. We additionally selected 80% (training) and 20% (validation) of the training dataset for our predictive models.
3 Mapping wind erosion hazards using LASSO regression, deep learning, and game theory
In Figure 2, we summarize our workflow for mapping of land susceptibility and wind erosion hazards in Semnan Province, including feature selection by LASSO regression, the GCN deep learning model, and game theory-based interpretation. This workflow may be applied in other dryland environments and for spatial mapping of various environmental hazards around the globe. Each step is detailed in the following subsections.
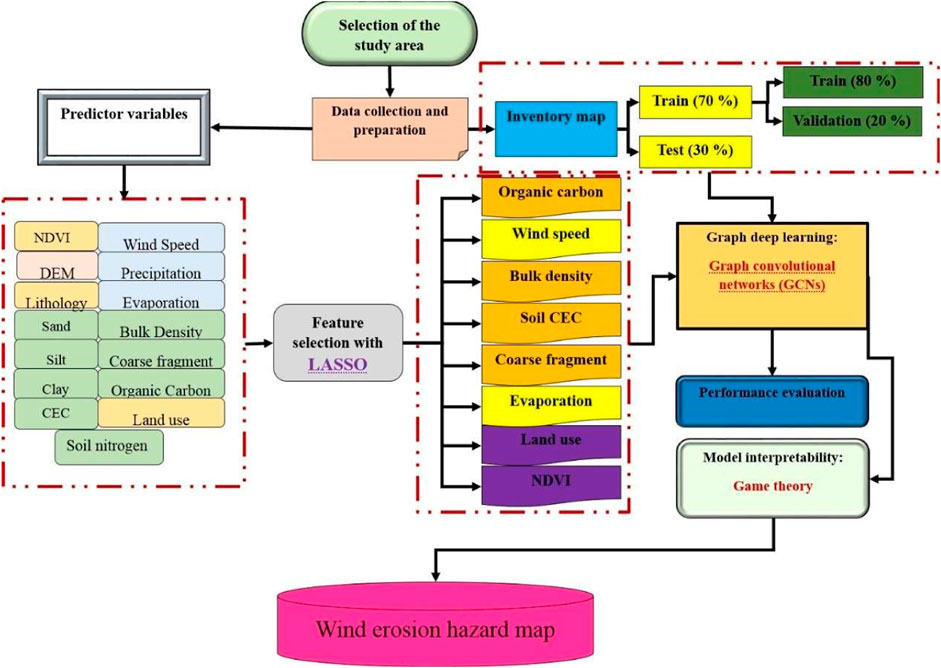
FIGURE 2. Flow chart of the key steps in mapping of wind erosion hazards in Semnan Province, Iran, using feature selection, graph convolutional networks (GCNs), and game theory.
3.1 Feature selection by LASSO regression
Feature selection (FS) describes the process of narrowing down the potential factors (explanatory features or variables), which can be used to describe a response feature (Fonti and Belitser, 2017). In this case, the response feature is the susceptibility to wind erosion and the explanatory features are the 15 parameters (potential factors) mapped in Supplementary Figures S1, S2.
The most influential factors controlling wind erosion in our study area were selected using the LASSO regression, a type of FS algorithm proposed by Tibshirani (1996). LASSO is considered to be the optimal approach for FS in our study since it combines the qualities of ridge regression and subset selection, thus improving the model’s accuracy and interpretability. LASSO is a regression analysis that performs both variable selection and regularization in order to enhance the prediction accuracy and interpretability of the resulting model, which is a major reason for its selection against other regression approaches. Furthermore, LASSO is a forward-looking variable selection method for regression, which is a type of penalized least-squares approach incorporating L1-penalty function (Muthukrishnan and Rohini, 2016). The LASSO approach transforms each coefficient by a constant component λ, truncating at 0, with the objective of minimizing prediction errors (Fonti and Belitser, 2017). Therefore, LASSO decreases the residual sum of squares, subject to the sum of the absolute value of the coefficient being less than a constant. During the application of FS, the features (variables) that still had a non-zero coefficient after the shrinking process were selected to be part of our model. The LASSO can be written as follows:
where
3.2 Graph convolutional networks
Here, we undertake the first known study using convolutional graph neural networks (ConvGNNs) to investigate wind erosion susceptibility. The first adoption of neural network approaches to directed acyclic graphs was reported by Sperduti and Starita (1997). Neural networks have since been more widely applied in the form of graph neural networks (GNNs) of various kinds for a wide range of applications (Gori et al., 2005; Scarselli et al., 2009; Gallicchio and Micheli, 2010). Among these, graph convolutional networks (GCNs; Figure 3), first proposed by Kipf and Welling (2016), are a type of spectral-based convolutional GNN (Wu et al., 2020), which introduce a first-order approximation of Chebyshev spectral CNNs (hereafter ChebNet) (Defferrard et al., 2016).
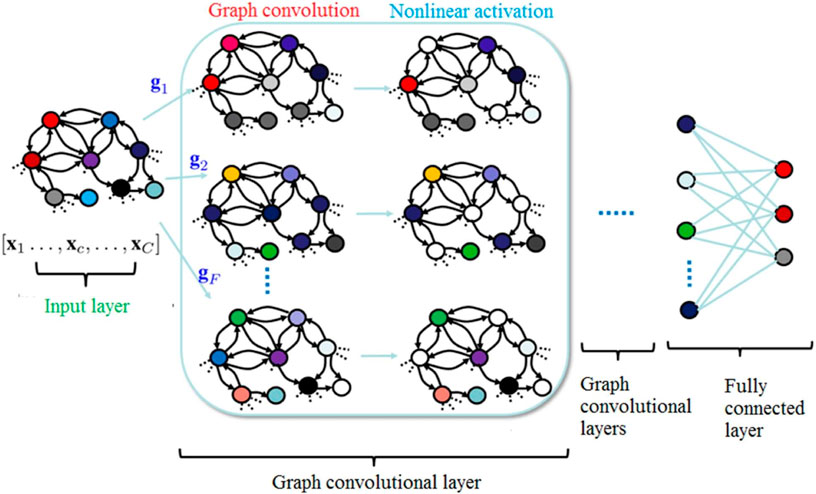
FIGURE 3. Conceptual diagram of our graph convolutional network (GCN) model for predicting land susceptibility to wind erosion.
In this study, we train GCNs using a Monte Carlo dropout (Gal and Ghahramani, 2016). Assuming K = 1 and λmax = 2, the equation of
where, K, G, Θ, and X indicate the layer index, a graph, the learnable model variable, and the feature vector, respectively.
To restrain the number of variables and avoid over-fitting, we assumed θ = θ0 = −θ1 for our GCNs, leading to the following definition of graph convolution:
To allow multiple channels of inputs and outputs, our GCN modifies Eq. 3 into a compositional layer as follows:
where
The predicted susceptibility values for all the pixels ranged between 0 and 1, with higher values indicating higher susceptibility to wind erosion. We divided susceptibility predictions into four classes: low (0–0.25), moderate (0.25–0.50), high (0.50–0.75), and very high (0.75–1).
3.3 Assessing GCN performance to spatial modeling of wind erosion
Previous studies have used several statistical indicators to assess the reliability and feasibility of predictive DM and DL models in environmental challenges (Gholami et al., 2021a; Gholami et al., 2021c), including root-mean-square error (RMSE), mean absolute error (MAE), mean bias error (MBE), the Nash–Sutcliffe efficiency coefficient (NSC), Taylor diagram, and the receiver-operating characteristic–area under curve (ROC-AUC). In this study, we applied the ROC-AUC (Hong et al., 2017) to evaluate the developed GCN model for spatial prediction of wind erosion susceptibility in Semnan Province. Using the area under curve (AUC) value, we classified the accuracy of the model prediction into five categories: poor (50%–60%), moderate (60%–70%), good (70%–80%), very good (80%–90%), and excellent (90%–100%) (Tibshirani, 1996).
3.4 Interpretability of GCNs using game theory
In addition, we interpreted our GCN model for predicting wind erosion hazards using the game theory approach of SHapley Additive exPlanations (SHAP) (Lundberg and Lee, 2017; Kannangara et al., 2022). SHAP values indicate the contribution of a given factor to the final predictions of a model. SHAP specifies the explanation as follows:
where g,
For calculating SHapley values, we fit a model fSU(i), involving factor i, and another additional model, fs. All possible subsets S ⊆ F comprise the empty set and the set F of all factors. The final factor contribution,
4 Results and discussion
4.1 Discriminating important from non-important features influencing wind erosion
The results of the LASSO regression, which was used to select the important factors responsible for wind erosion, are presented in Figure 4; Table 2. Figure 4 shows that AUC values decrease with the increasing number of the potential factors controlling wind erosion, which indicates that the model’s accuracy increases when more potential factors are considered within the LASSO regression.
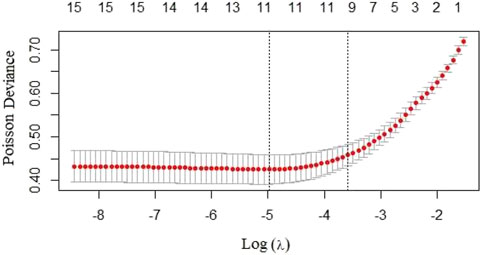
FIGURE 4. Plot constructed by the least absolute shrinkage and selection operator (LASSO) regression for feature selection. The X-axis of the plot is the log of lambda [Log(λ)], which implies that for a value of 2 in the x-axis, the lambda value is 100. The numbers at the top of the plot indicate the number of predictors included in the model. The position of red points along the Y-axis indicates the area under curve (AUC) values corresponding to the number of the variables shown on the top x-axis.
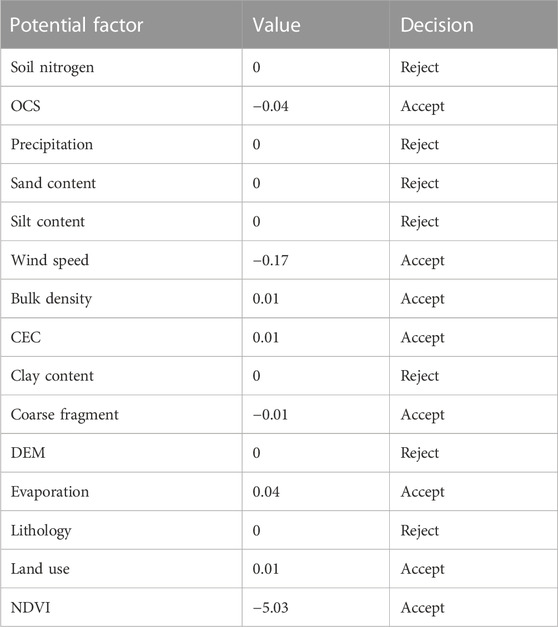
TABLE 2. Values of the potential factors controlling wind erosion, as estimated by the least absolute shrinkage and selection operator (LASSO) regression.
Out of the 15 features examined as potential factors controlling wind erosion, seven were identified as non-important in our study area and were excluded from further analysis. These non-important factors comprise soil nitrogen, precipitation, sand, silt, and clay content; topography (DEM); and lithology.
The LASSO regression identifies precipitation as a non-important factor for land susceptibility to wind erosion hazards in Semnan Province. Precipitation is generally considered an important factor controlling aeolian erosion and dust storms since low precipitation has a positive feedback effect for reducing soil moisture and vegetation growth, thereby enhancing erosion by wind (Sissakian et al., 2013; Parajuli et al., 2014). In the case of Semnan, the mountainous areas within the province receive relatively high rainfall and have a correspondingly lower vulnerability to aeolian erosion. This context reduces the relative importance of precipitation for dust emission in the study region, highlighting the sensitivity of local factors in the LASSO regression process. This suggests that in other arid regions, the current non-important factors may be highly sensitive to land susceptibility to wind erosion (Gholami et al., 2020a; Gholami et al., 2021a; Gholami et al., 2021c).
Although percentage fractions of unconsolidated silt, clay, and sand often influence dust emission and transport (Bagheri-Bodaghabadi and Jafari, 2022), our LASSO regression classified these factors as non-important for Semnan Province. Clearly, then, the fact that our LASSO regression finds typically influential factors to be non-important for our study region indicates that the classification of the importance of potential factors is highly region-specific and depends on local geographical, land cover, and meteorological conditions. Important factors are likely to depend on the type of soil, the dimension of desert areas, and topography.
LASSO criteria identified eight features as important variables for wind erosion in Semnan Province: wind speed, evaporation, OCS, bulk density, cation exchange capacity (CEC), coarse fragment, land use, and NDVI. Only these eight features entered into the spatial modeling process using GCNs to predict land susceptibility to wind erosion hazards in Semnan Province.
4.2 Map of wind erosion hazards
Figure 5 shows the map of susceptibility to wind erosion in Semnan Province, as produced by the GCN deep learning model using the eight important factors (Figure 4; Table 2).
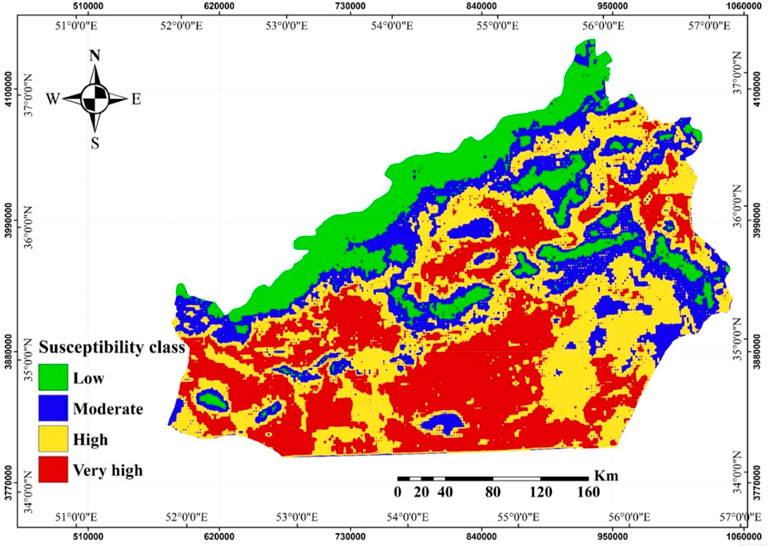
FIGURE 5. Map of wind erosion hazards generated by the graph convolutional network (GCN) model in Semnan Province, Iran.
According to the results, a substantial proportion of the region (c. 65%) exhibits high or very high susceptibility to wind erosion, which is 33.2% (= 32,300 km2) and 31.4% (= 30,581 km2), respectively. Areas classified as having low and moderate susceptibility to wind erosion represent 15.5% (= 15,136 km2) and 19.8% (= 19,305 km2) of the total area in Semnan Province, respectively.
The southern and central parts of the study area are classified as having very high susceptibility to wind erosion (Figure 5) and, therefore, suffer from extreme soil erosion hazards. These areas lie within the Kavir Desert, which is known as a generation point (dust source) for dust storms impacting the whole central Iranian Plateau (Bagheri-Bodaghabadi and Jafari, 2022; Marjovvi et al., 2022). The Kavir Desert experiences high evaporation rates, low surface soil moisture, and high wind speeds; it contains only sparse vegetation cover and has low soil OCS and low CEC. Furthermore, these regions contain substantial unconsolidated fine-grained sand at the surface, sourced by alluvial input from inland streams. Dry river beds and ephemeral lakes have long been recognized as areas with high potential for wind erosion and dust emissions across the Middle East (Rashki et al., 2017). Such areas, with high sediment availability and frequent high wind speeds, often become the major sources of erodible sand for dust/sand storms in Semnan Province.
The part of Semnan Province with the lowest susceptibility to wind erosion is located in the north within the Alborz mountain range. This area (c. 35.5% of the province) is characterized by steep slopes, relatively high vegetation cover, and low evaporation rates, as well as by high proportions of silt-sized sediment and coarse fragments on the surface (Supplementary Figures S1, S2). Each of these factors represents negative feedback for wind erosion (Parajuli et al., 2019) and is likely to contribute to the GNS assessment of low susceptibility in our study. Although this part of Semnan Province was found to have the lowest susceptibility to wind erosion, it is nevertheless the part of the Iranian Plateau that is more susceptible to wind erosion than other areas (Gholami et al., 2020c; Gholami et al., 2021b).
Figure 6 summarizes the results of sensitivity analysis for our GCN deep learning model. We found that the most sensitive features for the model are surface coarse fragment cover, evaporation, and land use; these factors exhibit the highest slopes on the graph and the largest variation in the normalized predictor change. The high importance of these features for soil susceptibility to wind erosion indicates strong regional dependence specific for Semnan Province. Using the same deep learning methods, we would likely find the deciding factors to be different in other arid environments (Gholami et al., 2021b; Gholami et al., 2021c; Gholami and Mohammadifar, 2022).
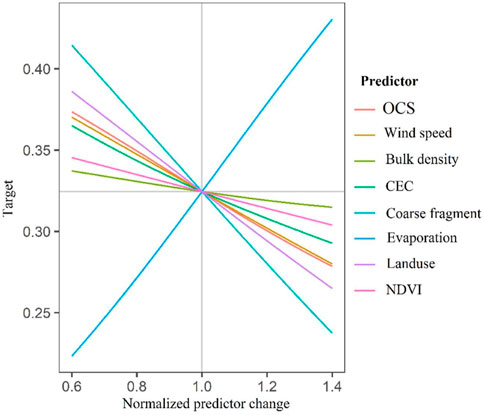
FIGURE 6. Graph convolutional network (GCN) model sensitivity analysis.
Overall, wind erosion and its contribution to desertification and land degradation is controlled by the arid climate, high evaporation rates, low precipitation, sparse vegetation cover, and intense winds (Keramat et al., 2011) in Semnan Province and in central Iran, more broadly. However, the balance and drivers of the determining factors—demonstrated here to be regionally specific—may be altered by future climatic change, including extensive droughts and increasing average temperatures, and by anthropogenic degradation of ecosystems and mismanagement of water, soil, and plant resources over the whole Middle East region (Amiraslani and Dragovich, 2011; Middleton, 2017; Middleton, 2019; Emamian et al., 2021; Papi et al., 2022). On this basis, continued monitoring of the relative contributions of various controlling factors to dynamic phenomena such as desertification and dust storms in arid environments is recommended.
4.3 Assessment of GCN model performance
The performance of our GCN modeling results was assessed using the area under curve (AUC) approach on the training and test datasets (Figure 7). The calculated AUC values for the training and validation datasets were found to be the same (97.2% and 97.25%, respectively), thus indicating an excellent prediction accuracy (Yesilnacar, 2005). The results show that GCNs significantly improve the performance of the predictions for land susceptibility to wind erosion and support the findings of previous studies, which suggested that GCNs are an efficient graph model for semi-supervised learning (Chen et al., 2018) and constitute a useful tool for completing missing data (Belghaddar et al., 2021). The DL hybrid models (e.g., convolutional neural network-gated recurrent unit (CNN-GRU) and dense layer deep learning–random forest (DLDL-RF)) were also recently shown to be efficient methods for classifying dust sources in the Middle East (Gholami and Mohammadifar, 2022).
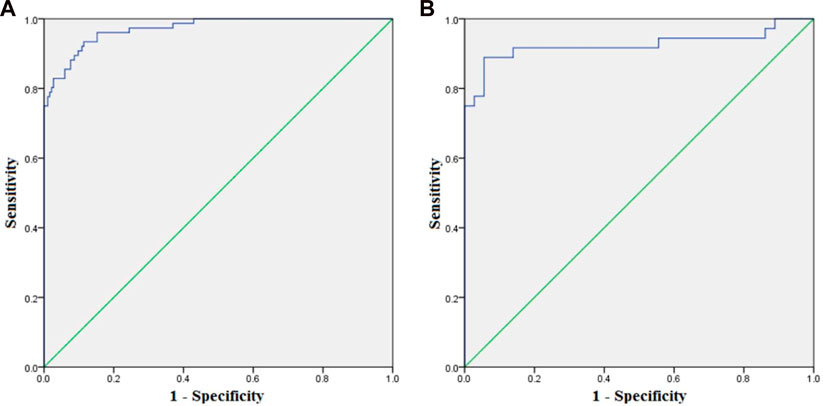
FIGURE 7. Validation of the wind erosion hazard map generated by the graph convolutional network (GCN) model for (A) training and (B) test datasets using the area under curve (AUC).
4.4 Relative contributions of the most important factors for wind erosion hazards
The SHAP values of the game theory were used to determine the contribution of each feature to our GCN model output for land susceptibility to wind erosion. We found that the contributions of the variables followed the order: coarse fragments > NDVI > land use > SOM > wind speed > CEC > bulk density > evaporation. Figure 8 illustrates the relative contributions of these parameters based on SHAP values and combines the feature importance with feature effects. The value, and therefore the relative importance of each parameter, is given by the color scheme. Overlapping points are projected in the y-axis to give a sense of the distribution of the SHAP values per feature, as per the published approach (Gholami et al., 2021c).
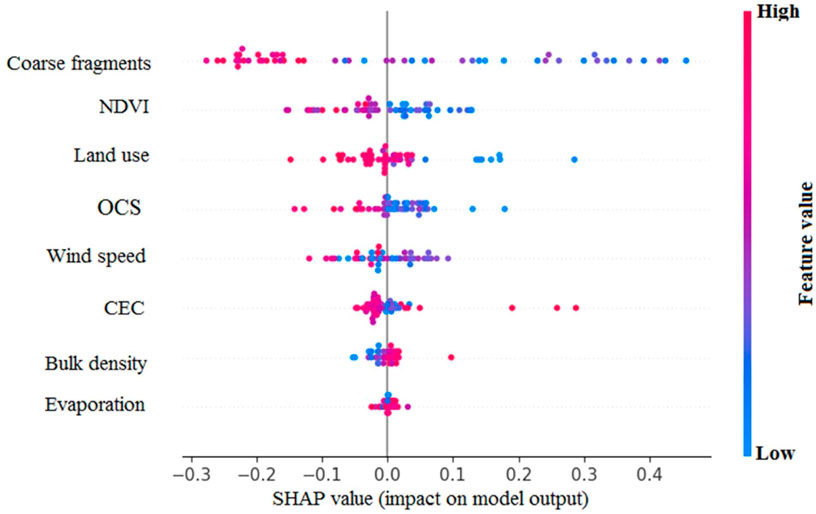
FIGURE 8. SHapley Additive exPlanation (SHAP) values for the eight most important features identified by the least absolute shrinkage and selection operator (LASSO) regression.
Land susceptibility to wind erosion has previously been shown to be driven by a wide range of topographic and bio-climatic variables including surface roughness (which equates to our coarse fragment parameter), mineralogy, vegetation cover (comparable with NDVI), soil characteristics (e.g., soil texture, bulk density, and organic matter), wind speed, precipitation, and evaporation (Goudie and Middleton, 2006; Shao, 2008). Depending on the meteorological, topographical, and soil conditions in the study area, factors controlling the wind erosion may be highly variable from place to place. For example, Gholami et al. (2020c) reported that DEM-extracted variables are the most important factors that control wind erosion in the Jazmurian Basin, while in Central Asia, other parameters like precipitation, bulk density, slope, and lithology (among others) mostly controlled land susceptibility to wind erosion using the LOFO algorithm (Gholami et al., 2021c). Precipitation can act as a roughness factor for controlling wind erosion in arid and semi-arid regions, while lithology can be another effective variable. Geological formations such as Qsd (sand dune unit) or Qal (Quaternary alluvial deposits) are the most susceptible units against wind erosion because they have single-grain structures with loose particles (Li et al., 2022; Li et al., 2023). The current results largely support these arguments while additionally identifying the main contributing factors and their relative contributions using novel techniques. Our novel approach also predicts the spatial variability of wind erosion hazards and enables the assessment of model performance.
Another important finding here is that factor contributions are strongly regionally controlled but are scale-dependent. A previous study focusing on Isfahan Province, immediately southwest of our study area (Gholami et al., 2020c), based on the monotone multi-layer perception neural network (MMLPNN), found that topography (DEM), precipitation, and NDVI were the three most important factors controlling wind erosion and, therefore, contrasts with current results. Therefore, the characteristics and relative importance of potential controlling factors are highly region-specific, even for neighboring provinces on the central Iranian Plateau. Over larger scales, however, we start to see similarities in the major factors controlling wind erosion. Analyses using SHAP values for Central Asia—a similar approach to the methods used in this study—revealed that surface coarse fragment concentration, soil bulk density, and precipitation were the most important factors controlling land susceptibility to wind erosion over a much larger area than that investigated here (Gholami et al., 2021c). Overall, the comparison with previous works that examined land susceptibility to wind erosion over arid areas in Iran and Central Asia revealed significant similarities in the factors that control wind erosion, despite some regional differences, and indicated the importance of defining scale in these sorts of studies.
We found that neural network techniques are a useful and accurate tool for investigating the spatial variability and intensity of land susceptibility to wind erosion (Luo et al., 2020). Our approach may be applied not only to mapping wind erosion hazards but also to a range of other environmental problems requiring spatial characterization, such as soil characteristics and the interaction between atmospheric circulation and the land surface. Our results provide an efficient means to measure soil erosion hazards, which can then be used for assessments of weather systems, ecosystem restoration, human health (Xiao et al., 2017; Wu et al., 2020; Emamian et al., 2021; Tian et al., 2021), land management, and hazard mitigation in arid areas (Sharifikia, 2013; Xu et al., 2019). Policymakers, as end users of results regarding mapping of land susceptibility and wind erosion, can use maps that are produced in this study, to alert residents in high-risk areas for devastating phenomena like severe dust storms and apply appropriate mitigating strategies against natural hazards.
4.5 Advantages and limitations to our DL approach
Data science (DS) is an emerging research field that helps us better understand the complex mechanisms behind environmental phenomena (Gibert et al., 2018). DS has several advantages and can support a) systematic and objective exploration and visualization of data, b) improving data quality, c) discovery of patterns contained in large time series, and d) producing new validated and transferable knowledge (Gibert et al., 2018). DL models—a fully data-driven approach—are especially interesting in environmental issues because they overcome many of the restrictions placed on the modeling process by traditional machine learning models (LeCun et al., 2015; Van Dao et al., 2020).
The accuracy of the input data to the modeling process is specifically important for generating more accurate and reliable predictive maps for environmental applications. Additional accuracy may be achieved with higher spatial resolution of the imagery such as in NDVI, digital elevation, and soil mapping that would lead to improvements in spatial mapping. Due to the desert and remote characteristics of Semnan Province, meteorological stations are rather scarce with unsuitable spatial coverage. Therefore, interpolation of the meteorological data was associated with higher uncertainty. Meteorological variables (wind speed and rainfall) are also sensitive to the length of instrumental data records (Li et al., 2018). Detailed analysis of various natural and anthropogenic factors affecting land susceptibility to wind erosion and dust storms is crucial for efficient management and mitigation strategies of these phenomena in central Iran.
5 Conclusion
This study is the first attempt to apply GCNs to aeolian geomorphology with the aim of predicting land susceptibility to wind erosion. Our novel methodology comprises feature selection using LASSO regression, the prediction of wind erosion hazards by GCNs, and the assessment of the accuracy and elucidation of major contributing parameters identified in our GCN model output using game theory.
The case study region is Semnan Province in the central Iranian plateau. The applied methodology showed that ∼65% of the total area in Semnan Province is prone to high and very high wind erosion hazards, rendering the area as one of the most susceptible to wind erosion parts of the arid central Iranian Plateau. We also found that the main factors contributing to erosion susceptibility are not necessarily the most typical since wind erosion is largely controlled by the proportion of surface coarse fragments, vegetation cover, and land use, as well as by evaporation, wind speed, bulk density, and cation exchange capacity.
The game theory was used for the first time to test the performance and interpretability of the GCN model, using the area under curve (AUC) and SHapley Additive exPlanations (SHAP). The assessment showed that our GCN approach reliably characterized land susceptibility to wind erosion. The SHAP values showed that proportions of coarse fragments, NDVI, land use, and wind speed contributed mostly to land degradation and wind erosion in Semnan Province.
Our methodology can be used to predict the hazards of wind erosion in other arid environments around the globe and may be extended to address several environmental issues from small to large scales.
Data availability statement
The original contributions presented in the study are included in the article/Supplementary Material; further inquiries can be directed to the corresponding author.
Author contributions
HG: formal analysis, investigation, visualization, writing—original draft, supervision, project administration, and writing—review and editing. AM: software and formal analysis. KF: visualization, writing—original draft, and review and editing. YL: formal analysis and investigation. DK: visualization, writing—original draft, and review and editing.
Acknowledgments
The authors would like to thank the Faculty of Agriculture and Natural Resources, University of Hormozgan, Iran for supporting this joint research project.
Conflict of interest
The authors declare that the research was conducted in the absence of any commercial or financial relationships that could be construed as a potential conflict of interest.
Publisher’s note
All claims expressed in this article are solely those of the authors and do not necessarily represent those of their affiliated organizations, or those of the publisher, the editors, and the reviewers. Any product that may be evaluated in this article, or claim that may be made by its manufacturer, is not guaranteed or endorsed by the publisher.
Supplementary material
The Supplementary Material for this article can be found online at: https://www.frontiersin.org/articles/10.3389/fenvs.2023.1187658/full#supplementary-material
References
Akoglu, L., Tong, H., and Koutra, D. (2015). Graph based anomaly detection and description: A survey. Data Min. Knowl. Discov. 29, 626–688. doi:10.1007/s10618-014-0365-y
Amiraslani, F., and Dragovich, D. (2011). Combating desertification in Iran over the last 50 years: An overview of changing approaches. J. Environ. Manag. 92 (1), 1–13. doi:10.1016/j.jenvman.2010.08.012
Arabameri, A., Seyed Danesh, A., Santosh, M., Cerda, A., Chandra Pal, S., Ghorbanzadeh, O., et al. (2022). Flood susceptibility mapping using meta-heuristic algorithms. Geomatics, Nat. Hazards Risk 13 (1), 949–974. doi:10.1080/19475705.2022.2060138
Backstrom, L., and Leskovec, J. (2011). “Supervised random walks: Predicting and recommending links in social networks,” in Proceedings of the fourth ACM international conference on Web search and data mining.
Bagheri-Bodaghabadi, M., and Jafari, M. (2022). The dust deposition model (DDM): An empirical model for monitoring dust deposition using meteorological data over the Isfahan province in central Iran. CATENA 211, 105952. doi:10.1016/j.catena.2021.105952
Belghaddar, Y., Chahinian, N., Seriai, A., Begdouri, A., Abdou, R., and Delenne, C. (2021). Graph convolutional networks: Application to database completion of wastewater networks. Water 13 (12), 1681. doi:10.3390/w13121681
Boroughani, M., Pourhashemi, S., Hashemi, H., Salehi, M., Amirahmadi, A., Asadi, M. A. Z., et al. (2020). Application of remote sensing techniques and machine learning algorithms in dust source detection and dust source susceptibility mapping. Ecol. Inf. 56, 101059. doi:10.1016/j.ecoinf.2020.101059
Boroughani, N., Pourhashemi, S., Gholami, H., and Kaskaoutis, D. G. (2022). Predicting of dust storm source by combining remote sensing, statistic-based predictive models and game theory in the Sistan watershed, southwestern Asia. J. Arid Land 13 (11), 1103–1121. doi:10.1007/s40333-021-0023-3
Borrelli, P., Panagos, P., Ballabio, C., Lugato, E., Weynants, M., and Montanarella, L. (2014). Towards a pan-European assessment of land susceptibility to wind erosion. Land Degrad. Dev. 27, 1093–1105. doi:10.1002/ldr.2318
Chen, J., Ma, T., and Xiao, C. (2018). Fastgcn: Fast learning with graph convolutional networks via importance sampling. arXiv preprint arXiv:1801.10247.
Chen, W., Lei, X., Chakrabortty, R., Pal, S. C., Sahana, M., and Janizadeh, S. (2021). Evaluation of different boosting ensemble machine learning models and novel deep learning and boosting framework for head-cut gully erosion susceptibility. J. Environ. Manag. 284, 112015. doi:10.1016/j.jenvman.2021.112015
Chowdhuri, I., Pal, S. C., Chakrabortty, R., Malik, S., Das, B., Roy, P., et al. (2021a). Spatial prediction of landslide susceptibility using projected storm rainfall and land use in Himalayan region. Bull. Eng. Geol. Environ. 80, 5237–5258. doi:10.1007/s10064-021-02252-z
Chowdhuri, I., Pal, S. C., Saha, A., Chakrabortty, R., and Roy, P. (2021b). Evaluation of different DEMs for gully erosion susceptibility mapping using in-situ field measurement and validation. Ecol. Inf. 65, 101425. doi:10.1016/j.ecoinf.2021.101425
Chowdhuri, I., Pal, S. C., Saha, A., Chakrabortty, R., and Roy, P. (2022). Mapping of earthquake hotspot and coldspot zones for identifying potential landslide hotspot areas in the Himalayan region. Bull. Eng. Geol. Environ. 81 (7), 257. doi:10.1007/s10064-022-02761-5
Defferrard, M., Bresson, X., and Vandergheynst, P. (2016). Convolutional neural networks on graphs with fast localized spectral filtering. Adv. neural Inf. Process. Syst. 29.
Duniway, M. C., Pfennigwerth, A. A., Fick, S. E., Nauman, T. W., Belnap, J., and Barger, N. N. (2019). Wind erosion and dust from US drylands: A review of causes, consequences, and solutions in a changing world. Ecosphere 10 (3), e02650. doi:10.1002/ecs2.2650
Effrosynidis, D., and Arampatzis, A. (2021). An evaluation of feature selection methods for environmental data. Ecol. Inf. 61, 101224. doi:10.1016/j.ecoinf.2021.101224
Emamian, A., Rashki, A., Kaskaoutis, D. G., Gholami, A., Opp, C., and Middleton, N. (2021). Assessing vegetation restoration potential under different land uses and climatic classes in northeast Iran. Ecol. Indic. 122, 107325. doi:10.1016/j.ecolind.2020.107325
Fonti, V., and Belitser, E. (2017). Feature selection using lasso. VU Amsterdam Res. Pap. Bus. Anal. 30, 1–25.
Forootan, E. (2022). Erosion susceptibility assessment using fuzzy logic and multi-influencing factors combination approach. Arabian J. Geosciences 15 (5), 444. doi:10.1007/s12517-022-09598-y
Gal, Y., and Ghahramani, Z. (2016). “Dropout as a bayesian approximation: Representing model uncertainty in deep learning,” in In: International conference on machine learning (PMLR).
Gallicchio, C., and Micheli, A. (2010). “Graph echo state networks,” in The 2010 international joint conference on neural networks (IJCNN) (IEEE).
Gholami, H., Mohamadifar, A., and Collins, A. L. (2020b). Spatial mapping of the provenance of storm dust: Application of data mining and ensemble modelling. Atmos. Res. 223, 104716. doi:10.1016/j.atmosres.2019.104716
Gholami, H., Mohamadifar, A., Golzari, S., Kaskaoutis, D., and Collins, A. L. (2021a). Using the Boruta algorithm and deep learning models for mapping land susceptibility to atmospheric dust emissions in Iran. Aeolian Res. 50, 100682. doi:10.1016/j.aeolia.2021.100682
Gholami, H., Mohamadifar, A., Rahimi, S., Kaskaoutis, D. G., and Collins, A. L. (2021b). Predicting land susceptibility to atmospheric dust emissions in central Iran by combining integrated data mining and a regional climate model. Atmos. Pollut. Res. 12 (4), 172–187. doi:10.1016/j.apr.2021.03.005
Gholami, H., Mohamadifar, A., Sorooshian, A., and Jansen, J. D. (2020c). Machine-learning algorithms for predicting land susceptibility to dust emissions: The case of the Jazmurian Basin, Iran. Atmos. Pollut. Res. 11 (8), 1303–1315. doi:10.1016/j.apr.2020.05.009
Gholami, H., Mohammadifar, A., Bui, D. T., and Collins, A. L. (2020a). Mapping wind erosion hazard with regression-based machine learning algorithms. Sci. Rep. 10 (1), 20494–20516. doi:10.1038/s41598-020-77567-0
Gholami, H., Mohammadifar, A., Malakooti, H., Esmaeilpour, Y., Golzari, S., Mohammadi, F., et al. (2021c). Integrated modelling for mapping spatial sources of dust in central Asia - an important dust source in the global atmospheric system. Atmos. Pollut. Res. 12, 101173. doi:10.1016/j.apr.2021.101173
Gholami, H., and Mohammadifar, A. (2022). Novel deep learning hybrid models (CNN-gru and DLDL-RF) for the susceptibility classification of dust sources in the Middle East: A global source. Sci. Rep. 12 (1), 19342. doi:10.1038/s41598-022-24036-5
Gibert, K., Izquierdo, J., Sànchez-Marrè, M., Hamilton, S. H., Rodríguez-Roda, I., and Holmes, G. (2018). Which method to use? An assessment of data mining methods in environmental data science. Environ. Model. Softw. 110, 3–27. doi:10.1016/j.envsoft.2018.09.021
Gillette, D. A. (1979) Environmental factors affecting dust emissions by wind erosion in saharan dust. New York: John Wiley. Morales, C.
Gori, M., Monfardini, G., and Scarselli, F. (2005). “A new model for learning in graph domains,” in Proceedings. 2005 IEEE international joint conference on neural networks (IEEE). 2005.
Goudie, A. S., and Middleton, N. J. (2006). Desert dust in the global system. Springer Science and Business Media.
Gregory, J. M., Wilson, G. R., Singh, U. B., and Darwish, M. M. (2004). Team: Integrated, process-based wind-erosion model. Environ. Model. Softw. 19 (2), 205–215.
Hamza, K., Sabine, G., and Willie, G. H. (2019). Digital mapping of soil carbon fractions with machine learning. Geoderma 339, 40–58. doi:10.1016/j.geoderma.2018.12.037
Hamzeh, N. H., Kaskaoutis, D. G., Rashki, A., and Mohammadpour, K. (2021). Long-term variability of dust events in southwestern Iran and its relationship with the drought. Atmosphere 12, 1350. doi:10.3390/atmos12101350
Hong, H., Pradhan, B., Bui, D. T., Xu, C., Youssef, A. M., and Chen, W. (2017). Comparison of four kernel functions used in support vector machines for landslide susceptibility mapping: A case study at suichuan area (China). Geomatics, Nat. Hazards Risk 8 (2), 544–569. doi:10.1080/19475705.2016.1250112
Jafari, R., Amiri, M., Asgari, F., and Tarkesh, M. (2022). Dust source susceptibility mapping based on remote sensing and machine learning techniques. Ecol. Inf. 72, 101872. doi:10.1016/j.ecoinf.2022.101872
Jia, L., Yu, K.-x., Li, Z.-b., Li, P., Zhang, J.-z., Wang, A.-n., et al. (2022). Temporal and spatial variation of rainfall erosivity in the Loess Plateau of China and its impact on sediment load. CATENA 210, 105931. doi:10.1016/j.catena.2021.105931
Kannangara, K., Zhou, W., Ding, Z., and Hong, Z. (2022). Investigation of feature contribution to shield tunneling-induced settlement using Shapley additive explanations method. J. Rock Mech. Geotechnical Eng. 14 (4), 1052–1063. doi:10.1016/j.jrmge.2022.01.002
Keramat, A., Marivani, B., and Samsami, M. (2011). Climatic change, drought and dust crisis in Iran. Int. J. Geol. Environ. Eng. 5 (9), 472–475.
Kipf, T. N., and Welling, M. (2016). Semi-supervised classification with graph convolutional networks. arXiv preprint arXiv:1609.02907.
Kursa, M. B., and Rudnicki, W. R. (2010). Feature selection with the Boruta package. J. Stat. Softw. 36 (11), 1–13. doi:10.18637/jss.v036.i11
LeCun, Y., Bengio, Y., and Hinton, G. (2015). Deep learning. nature 521 (7553), 436–444. doi:10.1038/nature14539
Li, Q., Han, Z., and Wu, X.-M. (2018). “Deeper insights into graph convolutional networks for semi-supervised learning,” in Proceedings of the AAAI conference on artificial intelligence.
Li, Y., Song, Y., Chen, X., Shi, Z., Kaskaoutis, D. G., Gholami, H., et al. (2023). Late Pleistocene dynamics of dust emissions related to westerlies revealed by quantifying loess provenance changes in North Tian Shan, Central Asia. Catena 227, 107101. doi:10.1016/j.catena.2023.107101
Li, Y., Song, Y., Kaskaoutis, D. G., Zhang, X., Chen, X., Shukurov, N., et al. (2022). Atmospheric dust dynamics over central Asia: A perspective view from loess deposits. Godwana Res. 109, 150–165. doi:10.1016/j.gr.2022.04.019
Liu, X., Song, H., Lei, T., Liu, P., Xu, C., Wang, D., et al. (2021). Effects of natural and anthropogenic factors and their interactions on dust events in Northern China. CATENA 196, 104919. doi:10.1016/j.catena.2020.104919
Lundberg, S. M., and Lee, S.-I. (2017). “A unified approach to interpreting model predictions,” in Advances in neural information processing systems, 30.
Luo, Q., Zhen, L., Xiao, Y., and Wang, H. (2020). The effects of different types of vegetation restoration on wind erosion prevention: A case study in yanchi. Environ. Res. Lett. 15 (11), 115001. doi:10.1088/1748-9326/abbaff
Marjovvi, A., Soleimani, M., Mirghaffari, N., Karimzadeh, H., Yuan, Y., and Fang, L. (2022). Monitoring, source identification and environmental risk of potentially toxic elements of dust in Isfahan Province, Central Iran. Bull. Environ. Contam. Toxicol. 108 (5), 901–908. doi:10.1007/s00128-021-03446-7
Middleton, N. J. (2017). Desert dust hazards: A global review. Aeolian Res. 24, 53–63. doi:10.1016/j.aeolia.2016.12.001
Middleton, N. (2019). Variability and trends in dust storm frequency on decadal timescales: Climatic drivers and human impacts. Geosci. Switz. 9 (6), 261. doi:10.3390/geosciences9060261
Mohammadifar, A., Gholami, H., Comino, J. R., and Collins, A. L. (2021a). Assessment of the interpretability of data mining for the spatial modelling of water erosion using game theory. Catena 200, 105178. doi:10.1016/j.catena.2021.105178
Mohammadifar, A., Gholami, H., and Golzari, S. (2022). Assessment of the uncertainty and interpretability of deep learning models for mapping soil salinity using DeepQuantreg and game theory. Sci. Rep. 12 (1), 15167. doi:10.1038/s41598-022-19357-4
Mohammadifar, A., Gholami, H., Golzari, S., and Collins, A. L. (2021b). Spatial modelling of soil salinity: Deep or shallow learning models? Environ. Sci. Pollut. Res. 28, 39432–39450. doi:10.1007/s11356-021-13503-7
Monti, F., Bronstein, M., and Bresson, X. (2017). Geometric matrix completion with recurrent multi-graph neural networks. Adv. neural Inf. Process. Syst. 30.
Muthukrishnan, R., and Rohini, R. (2016). “Lasso: A feature selection technique in predictive modeling for machine learning,” in 2016 IEEE international conference on advances in computer applications (ICACA). IEEE.
Oldeman, L. R. (1994). “The global extent of land degradation,” in Land resilience and sustainable land use. Editors D. Greenland, and I. Szabolcs (Wallingford: CAB International).
Padarian, J., McBratney, A. B., and Minasny, B. (2020). Game theory interpretation of digital soil mapping convolutional neural networks. Soil 6 (2), 389–397. doi:10.5194/soil-6-389-2020
Papi, R., Attarchi, S., Attarchi, S., Darvishi Boloorani, A., and Samani, N. N. (2022). Characterization of hydrologic sand and dust storm sources in the Middle East. Sustainability 14, 15352. doi:10.3390/su142215352
Parajuli, S. P., Stenchikov, G. L., Ukhov, A., and Kim, H. (2019). Dust emission modeling using a new high-resolution dust source function in WRF-chem with implications for air quality. J. Geophys. Res. D. Atmos. JGR 124, 10109–10133. doi:10.1029/2019jd030248
Parajuli, S. P., Yang, Z. L., and Kocurek, G. (2014). Mapping erodibility in dust source regions based on geomorphology, meteorology, and remote sensing. J. Geophys. Res. Earth Surf. 119 (9), 1977–1994. doi:10.1002/2014jf003095
Pourhashemi, S., Asadi, M. A. Z., Boroughani, M., and Azadi, H. (2022). Mapping of dust source susceptibility by remote sensing and machine learning techniques (case study: Iran-Iraq border). Environ. Sci. Poll. Res. 30, 27965–27979. doi:10.1007/s11356-022-23982-x
Rashki, A., Arjmand, M., and Kaskaoutis, D. (2017). Assessment of dust activity and dust-plume pathways over Jazmurian Basin, southeast Iran. Aeolian Res. 24, 145–160. doi:10.1016/j.aeolia.2017.01.002
Rashki, A., Middleton, N., and Goudie, A. (2021). Dust storms in Iran – distribution, causes, frequencies and impacts. Aeolian Res. 48, 100655. doi:10.1016/j.aeolia.2020.100655
Reiss, S., and Bogenberger, K. (2016). Validation of a relocation strategy for Munich's bike sharing system. Transp. Res. Procedia 19, 341–349. doi:10.1016/j.trpro.2016.12.093
Saha, A., Pal, S. C., Arabameri, A., Chowdhuri, I., Rezaie, F., Chakrabortty, R., et al. (2021). Optimization modelling to establish false measures implemented with ex-situ plant species to control gully erosion in a monsoon-dominated region with novel in-situ measurements. J. Environ. Manag. 287, 112284. doi:10.1016/j.jenvman.2021.112284
Saha, A., Pal, S. C., Chowdhuri, I., Islam, A. R. M. T., Chakrabortty, R., and Roy, P. (2022). Application of neural network model-based framework approach to identify gully erosion potential hotspot zones in sub-tropical environment. Geocarto Int. 37, 14758–14784. doi:10.1080/10106049.2022.2091042
Scarselli, F., Gori, M., Tsoi, A. C., Hagenbuchner, M., and Monfardini, G. (2009). The graph neural network model. IEEE Trans. neural Netw. 20 (1), 61–80. doi:10.1109/tnn.2008.2005605
Sharifikia, M. (2013). Environmental challenges and drought hazard assessment of Hamoun Desert Lake in Sistan region, Iran, based on the time series of satellite imagery. Nat. hazards 65, 201–217.
Sissakian, V., Al-Ansari, N., and Knutsson, S. (2013). Sand and dust storm events in Iraq. J. Nat. Sci. 5 (10), 1084–1094. doi:10.4236/ns.2013.510133
Soloki, H. R., and Noori Nahad, F. (2019). Effect of soil characteristics and wind erosion on hydraulic structures of Sistan River. J. Nat. Environ. Hazards 8 (19), 229–242.
Sperduti, A., and Starita, A. (1997). Supervised neural networks for the classification of structures. IEEE Trans. Neural Netw. 8 (3), 714–735. doi:10.1109/72.572108
Tian, M., Gao, J., Zhang, L., Zhang, H., Feng, C., and Jia, X. (2021). Effects of dust emissions from wind erosion of soil on ambient air quality. Atmos. Pollut. Res. 12 (7), 101108. doi:10.1016/j.apr.2021.101108
Tibshirani, R. (1996). Regression shrinkage and selection via the lasso. J. R. Stat. Soc. Ser. B Methodol. 58 (1), 267–288. doi:10.1111/j.2517-6161.1996.tb02080.x
Van Dao, D., Jaafari, A., Bayat, M., Mafi-Gholami, D., Qi, C., Moayedi, H., et al. (2020). A spatially explicit deep learning neural network model for the prediction of landslide susceptibility. Catena 188, 104451. doi:10.1016/j.catena.2019.104451
Veličković, P., Cucurull, G., Casanova, A., Romero, A., Lio, P., and Bengio, Y. (2017). Graph attention networks. arXiv preprint arXiv:1710.10903.
Webb, N. P., Herrick, J. E., Van Zee, J. W., Courtright, E. M., Hugenholtz, C. H., Zobeck, T. M., et al. (2016). The National Wind Erosion Research Network: Building a standardized long-term data resource for aeolian research, modeling and land management. Aeolian Res. 22, 23–36. doi:10.1016/j.aeolia.2016.05.005
Webb, N. P., and Strong, C. L. (2011). Soil erodibility dynamics and its representation for wind erosion and dust emission models. Aeol. Res. 3, 165–179. doi:10.1016/j.aeolia.2011.03.002
Wu, Z., Pan, S., Chen, F., Long, G., Zhang, C., and Philip, S. Y. (2020). A comprehensive survey on graph neural networks. IEEE Trans. neural Netw. Learn. Syst. 32 (1), 4–24. doi:10.1109/tnnls.2020.2978386
Xiao, Y., Xie, G., Zhen, L., Lu, C., and Xu, J. (2017). Identifying the areas benefitting from the prevention of wind erosion by the key ecological function area for the protection of desertification in Hunshandake, China. Sustainability 9 (10), 1820. doi:10.3390/su9101820
Xu, J., Xiao, Y., Xie, G., Wang, Y., and Jiang, Y. (2019). Computing payments for wind erosion prevention service incorporating ecosystem services flow and regional disparity in Yanchi County. Sci. Total Environ. 674, 563–579. doi:10.1016/j.scitotenv.2019.03.361
Xu, J., Xiao, Y., Xie, G., Zhen, L., Wang, Y., and Jiang, Y. (2018). The spatio-temporal disparities of areas benefitting from the wind erosion prevention service. Int. J. Environ. Res. Public Health 15 (7), 1510. doi:10.3390/ijerph15071510
Yesilnacar, E. K. (2005). The application of computational intelligence to landslide susceptibility mapping in Turkey. University of Melbourne.
Zhang, Q., Yang, L. T., Chen, Z., and Li, P. (2018). A survey on deep learning for big data. Inf. Fusion 42, 146–157. doi:10.1016/j.inffus.2017.10.006
Zhang, S., Tong, H., Xu, J., and Maciejewski, R. (2019). Graph convolutional networks: A comprehensive review. Comput. Soc. Netw. 6 (1), 11–23. doi:10.1186/s40649-019-0069-y
Zhang, S., Zhou, D., Yildirim, M. Y., Alcorn, S., He, J., Davulcu, H., et al. (2017). “Hidden: Hierarchical dense subgraph detection with application to financial fraud detection,” in Proceedings of the 2017 SIAM international conference on data mining (SIAM).
Keywords: deep learning, erodible susceptibility, feature selection, game theory, potential impact
Citation: Gholami H, Mohammadifar A, Fitzsimmons KE, Li Y and Kaskaoutis DG (2023) Modeling land susceptibility to wind erosion hazards using LASSO regression and graph convolutional networks. Front. Environ. Sci. 11:1187658. doi: 10.3389/fenvs.2023.1187658
Received: 16 March 2023; Accepted: 11 April 2023;
Published: 09 May 2023.
Edited by:
Giulio Castelli, University of Florence, ItalyReviewed by:
Juan Cruz Colazo, Instituto Nacional de Tecnología Agropecuaria, ArgentinaJianhua Xiao, Northwest Institute of Eco-Environment and Resources (CAS), China
Copyright © 2023 Gholami, Mohammadifar, Fitzsimmons, Li and Kaskaoutis. This is an open-access article distributed under the terms of the Creative Commons Attribution License (CC BY). The use, distribution or reproduction in other forums is permitted, provided the original author(s) and the copyright owner(s) are credited and that the original publication in this journal is cited, in accordance with accepted academic practice. No use, distribution or reproduction is permitted which does not comply with these terms.
*Correspondence: Hamid Gholami, aGdob2xhbWlAaG9ybW96Z2FuLmFjLmly
†Present address: Dimitris G. Kaskaoutis, Department of Chemical Engineering, University of Western Macedonia, Kozani, Greece