 Mukesh K. Gautam
 Björn Berg
 Kwang-Sik Lee
 Torbjörn Nilsson4
 Hyung Seon Shin
- 1Biology Department, Medgar Evers College, City University of New York, New York, NY, United States
- 2Research Center for Geochronology and Isotope Analysis, Korea Basic Science Institute, Cheongju-si, Chungbuk, Republic of Korea
- 3Departments of Forest Sciences, University of Helsinki, Helsinki, Finland
- 4Department of Soil and Environment, Swedish University of Agricultural Sciences, Uppsala, Sweden
The temporal dynamics of 33 major, trace, and rare earth elements (REEs) were studied in the litter samples containing Swedish Norway spruce (Picea abies) (NSL) and Scots pine (Pinus sylvestris) (SPL), with the aim to assess their release and accumulation dynamics. Litter bags (8 × 8 cm) were incubated in paired monoculture stands with both the species for up to 5 years from 1979 to 1984 according to a randomized block design comprising 25 blocks (1 × 1 m) within an area of 625 m2. The decomposition rate was slightly higher for Scots pine litter (k = 0.315) than for Norway spruce litter (k = 0.217). During litter decomposition, at ∼70% accumulated mass loss (AML), the concentration of trace elements increased by >50% in both litter types compared to initial concentrations. The concentration change took place in a non-linear pattern, and polynomial quadratic regression between concentration change and accumulated mass loss resulted in significant relationships (adj R2 = 0.20–0.97; p = 0.15–<0.0001). The changes in concentration and amount of trace elements resulted in two main types of dynamics: 1) both concentration and amount increased for Fe, Al, Ti, Cu, Mo, V, Zr, Sb, As, Cs, Pb, Th, and U; 2) concentration increased but amount decreased for Ni, Zn, Li, and Sr. The amount of REEs increased from ∼3-fold to 99-fold from the beginning to the end of incubation, suggesting accumulation during litter decomposition. The dynamics of different REEs were similar in their change patterns in the two litters. Different REEs had generally identical change patterns during incubation, which is reflected in the high correlations among them (r2 = >0.95). A general upward convexity in the dynamics suggests that if further incubated in the field, decomposing litter could have accumulated more REEs in the organic matter. The results of this study can be useful for future studies in other ecosystems including metal-contaminated sites or element-depleted sites. Plant litter accumulation, its decomposition, and build-up of humic substances in the decomposing organic matter can act as a sink for elements and can be used as a management tool for ecological amelioration of metal-contaminated sites as well as natural systems that are impoverished, especially recuperating sites. The study’s findings have implications beyond such sites and can be useful in any research that seeks to understand the patterns of accumulation and release related to decomposition in different ecosystems.
1 Introduction
Release of nutrients from decomposing litter is one of the most important processes in the cycling of elements and biogeochemistry of vegetated ecosystems, including forests (Prescott, 2005; Berg, 2014; Hobbie, 2015; Yue et al., 2019; Montemagno et al., 2021). Knowledge about the decomposition processes has helped us to link primary productivity to soil nutritive capital through litter decomposition (Hobbie, 2015; De Marco et al., 2022) and to recognize its significance to vegetation and soil-inhabiting biota (Hättenschwiler et al., 2005). The knowledge has thus facilitated us to prioritize management strategies for both ecosystems, (semi-) natural and artificial/man-made.
Work on understanding the dynamics of some of the elements in this group, namely, heavy metals, started as early as the 1970s (Rühling and Tyler, 1973) and was later followed by crucial studies giving rare views of their dynamics [Fe, Mn, Zn, Cu, Al, Co, Mo, Ti, V, Zn, Cd, Pb, Ni, Cr, and rare earth elements (REEs)] related to litter decomposition (Laskowski and Berg, 1993; Yue et al., 2019; Kondratova and Bryanin, 2021; Montemagno et al., 2021; De Marco et al., 2022). Still, for most of the ecosystems, for reasons unknown, such studies have not been prioritized for several other trace elements and REEs (Berg and Laskowski, 2005; Brun et al., 2008; Cao et al., 2018; Gautam et al., 2019). In particular, for REEs, despite Tyler’s (2005) study and a few follow-up decomposition studies by Brun et al. (2008), Gautam et al. (2019), and Montemagno et al. (2021), the dynamics of REEs during litter decomposition have not received much attention. In contrast to nutrient elements, the bulk of the trace elements and REEs is not required by litter- and soil-inhabiting macro- and microbiota involved in the decomposition process. Humus, being built up in organic layers in the decomposing environment, has a high capacity to tightly adsorb or chelate trace elements and REEs (Stevenson, 1982; Laskowski et al., 1995; Tyler, 2004; Van Nevel et al., 2014; Li et al., 2020). As a result, an increase in the concentration of heavy metals and REEs takes place in the litter during decomposition (Brun et al., 2008; Gautam et al., 2020). Accumulation of certain trace elements, particularly heavy metals, can impact decomposition, impeding the turn-over rate (Laskowski and Berg, 1993). This is probably due to their direct or indirect effect on the microenvironment of microbiota that is critical for the decomposition process to proceed at optimal rates (Scheid et al., 2009). On polluted sites with concentrations of heavy metals exceeding the critical levels, rates of decomposition were found to be severely affected, leading to litter accretion (Rühling and Tyler, 1973). The same effect of heavy metals was recorded from unpolluted sites as well (Laskowski and Berg, 1993). Compared to polluted ecosystems, the dynamics of trace elements and REEs have not been prioritized in unpolluted ecosystems. In recent years, due to an extensive increase in the global production and widespread usage of REEs in various services and industries, they have attracted attention as emerging pollutants (Brioschi et al., 2013; Tao et al., 2022). Recent studies have shown that loading of huge amounts of REEs in the environment, like heavy metals, can have an adverse effect on ecosystem processes (Carpenter et al., 2015; Kang and Kang, 2020). However, although the effects of rare earth elements on various ecosystem components are gradually increasing (Kang and Kang, 2020), the knowledge about the dynamics of REEs associated with litter decomposition over long-term periods is poorly explored and needs to be prioritized.
A great number of litter decomposition studies, both short-term and long-term, have been conducted globally in various ecosystems to understand the litter decomposition process (e.g., Aerts, 1997; Prescott, 2010; Berg and McClaugherty, 2020; Kondratova and Bryanin, 2021). Traditional decomposition studies have largely focused on understanding the dynamics and effects linked to only a few major elements (Ca, Mg, K, P, S N, and Mn). These studies have provided researchers, managers, and policymakers with insights about elemental dynamics (release and immobilization) associated with litter decomposition and factors affecting the decay rates (Osono and Takeda, 2004; Prescott, 2005; Brun et al., 2008; Brun et al., 2008; Prescott, 2010; Gautam et al., 2016; Cao et al., 2018; Yue et al., 2019). The results from diverse ecosystems have reported diverse dynamics of their release (Berg and McClaugherty, 2020); nevertheless, all have agreed on their nutritive significance to the whole decomposition process; that is, in an impoverished ecosystem with limiting nutrient elements, the whole decomposition process can be constrained and thus delay the release and recycling of essential elements (Hobbie, 1992; Berg and Laskowski, 2005).
Unlike the knowledge of major elements, the knowledge about the dynamics of most trace elements and REEs is still scarcely available. Out of three studies performed to capture the dynamics of REEs, only that by Brun et al. (2008) is a long-term study (≥2 years), whereas two of them are short-term studies (1–2 years) (Gautam et al., 2019; 2020). However, the study by Brun et al. (2008) presented limited information about the dynamics of most of the trace elements with no particular focus on the dynamics of REEs. In his 2005 study, Tyler presented a significant perspective on the continuum of REE concentration change from leaf to the organic soil layer. However, he did not link their dynamics to in situ litter decomposition. In the case of trace elements, few decomposition studies that researched the dynamics of heavy metals are long-term studies, exceeding 2 years (Lomander and Johansson, 2001). Additionally, due to differences in chemical properties, there is incongruence in the dynamics of some major and few trace elements, which have been subject to extensive long-term studies (Hobbie, 2015; Pourhassan et al., 2016; Berg and McClaugherty, 2020). In the short-term REE dynamics reported by Gautam et al. (2020), though, all the studied REEs showed a congruent behavior of change in concentrations. It is, however, important to know what happens in the more lengthy periods. To capture maximum variability in their dynamics, long-term studies are needed. It is imperative to document how the majority of elements behave in the long term, especially when litter decomposition is dominated by a recalcitrant phase (Berg and McClaugherty, 2020). For nutrient elements, a general rule of immobilization and release is seen in both the short- and the long-term studies. However, such understanding of trace elements and REEs is limited. The existing datasets are too small to allow any generalization about the dynamics of trace elements and REEs during litter decomposition. To address this issue, the main objectives of the present study were to understand changes in the concentrations and amounts of 33 elements, including REEs, during litter decomposition and to compare the variability in their dynamics of changes. The present investigation describes the results of a long-term study (up to 5 years) on the dynamics of major elements (Na and S), trace elements (Cu, Mo, Ba, Sr, Co, Cr, Li, Ni, V, Zn, Zr, As, Sb, Cd, Cs, Pb, Th, and U), and REEs (La, Ce, Pr, Nd, Sm, Sc, Eu, Gd, Dy, and Lu) associated with decomposing litter of Scots pine (Pinus sylvestris L.) and Norway spruce (Picea abies L.), two common and representative forest tree species of Sweden, accounting for approximately 80% of the total volume of Swedish forests. During decomposition, humic substances increase in the decomposing environment. We assume that due to organo–mineral complex formation, elements, especially metals (loids), will accumulate in the decomposing litter and increase in their net amount at the end of decomposition. Rare earth elements have shown strong chelation properties with organic matter in the soil (SOM), and thus we hypothesize that their concentration and amount will also increase continuously in the decomposing litter. In addition to this, since different plant species have different patterns in the accumulation of rare earth elements in them, herein, we make an effort to find the differences in their dynamics in these two litter types.
2 Materials and methods
2.1 Study site
The litter samples were collected in the Grensholm Castle, which is located in southeastern Sweden and northeast to Linköping City at 58o 33′ N; 15o 59′ E and at an altitude of 58 m a.s.l. The mean annual precipitation (long-term) is 520 mm, and the mean annual temperature is 6.3°C, with a long-term annual actual evapotranspiration of 484 mm (Johansson et al., 1995; Berg et al., 2000; Berg et al., 1997). The site has paired monocultural stands of Norway spruce (P. abies) and Scots pine (P. sylvestris), aged 54 and 58 years, respectively, at the start of the study. The Norway spruce stand had herbs and moss as ground vegetation and Scots pine had Bilberry (Vaccinium myrtillus) and grasses. Both stands grew on Eutric Cambisol, and the humus was of the mull form. Further site descriptions are provided in Berg et al. (1991a) and Berg et al. (1997).
2.2 Needle litter collection, storage, and mass loss determination
For this study, the litter samples of Scots pine and Norway spruce were obtained from the repositories developed by late Dr. Maj-Britt Johansson along with Dr. Björn Berg. Local needle litter was collected from both Norway spruce and Scots pine stands. The litter was collected in the autumn of 1978 by gently shaking the branches of the trees and collecting the needles on spread-out tarpaulins. Green needles were removed by hand. The litter was air-dried and stored dry at room temperature. Before weighing, the needles were equilibrated to a constant moisture level (5%–8% ± 0.5%) by drying them at room temperature for approximately 1 month. The exact dry mass was determined by drying the samples to a constant mass at 85°C (Berg et al., 1991b; Laskowski and Berg, 1993).
Litter bags, measuring 8 × 8°cm, excluding a 1-cm-wide edge, were made of polyester net with a mesh size of approximately 1.0 × 1.0 mm for pine needles and approximately 1.0 × 0.5 mm for spruce needles (Berg and Ekbohm, 1991). This size enables penetration of fungal hyphae and allows access to soil- and litter-dwelling microfauna and, at the same time, also prevents loss of material generated from decomposition. In a method study incubating Scots pine litter in litter bags of both mesh sizes (1.0 mm × 1.0°mm and 1.0 mm × 0.5 mm), no difference was observed in litter mass loss over a two-year period, justifying a comparison using these two mesh sizes (B. Berg, unpublished). A measure of 1.0 g (3 decimals) of needle litter was placed in each litter bag. The bags were deployed on the top of the litter (L) layer in 25 randomly located 1 × 1 m spots within each plot in early May 1979. In each such spot, 10–14 bags were attached to the ground using pegs through the edge of the bags. The litter bags were incubated in situ for 4 and 5 years in Norway spruce and Scots pine stands, respectively. The litter bags were retrieved from their respective sites after field incubation on 181, 369, 540, 736, 915, 1,085, 1,462, and 1,833 days from the start of the experiment (June 1979 to May 1983). On each sampling date, 25 litter bags per litter type were collected from each site. The litter bags were gently brushed to remove new needles deposited on the bags and cleaned for through-growing plant residues like moss, grass, and plant roots. The bags were individually packed in brown-paper envelopes and transported to the laboratory. The bags were either stored at −20°C (if storage was needed) or cut open immediately to air-dry the litter sample and clean the litter for any ingrown foreign material (moss, grass, and plant roots). The litter samples were then dried at 85°C until the sample achieved constant weight (approximately 2 days). The dried samples were allowed to cool in a desiccator before weighing, and the exact litter weight of each bag was recorded with an accuracy of two decimals. Mean values of mass loss were calculated for each sample set of 25 bags, and the details are provided in Berg et al. (1993). Thoroughly dried, ground litter samples were sealed and stored dry at room temperature until retrieved from the storage on April 2021. Ground samples stored in a dark, dry environment have a long storage life, and samples can be left for a longer time under clean air-tight conditions that maintain sample integrity for follow-up analytical work (Jones et al., 1991; Campbell and Plank, 1998). Litter bag data (data on accumulated mass loss) and data on concentrations of Ca, K, P, N, Mn, and AUR (acid-unhydrolyzable residue or gravimetric lignin) were extracted from Berg et al. (1991b).
2.3 Sample preparation and analyses
To prepare homogenized samples for determining the concentrations of major, trace, and rare earth elements, the ground litter samples collected from Sweden were first freeze-dried at −80°C for 96 h and then ground again into a fine powder using an agate ball mill at Korea Basic Science Institute (KBSI), Republic of Korea (MM400; Retsch, Haan, Germany), and stored in glass vials. Samples were digested using a modification of the method suggested by Hansen et al. (2009). For elemental analyses, approximately 0.40 g of the homogenized sample was weighed, to the nearest 0.1 mg, and then transferred into a Teflon vial (Savillex, Minnetonka, MN, United States). For sample digestion, 9 mL of concentrated nitric acid (HNO3) (70%, Sigma-Aldrich, St Louis, MO, United States) and 1 mL of ultrapure hydrogen peroxide (H2O2) (70%, Sigma-Aldrich, Seoul, Republic of Korea) were added into the Teflon vial. The Teflon vial carrying the sample mixture was then closed and placed in a microwave oven (Milestone ETHOS EASY, Sorisole, Italy). The heating program of the digestion system was performed in two steps. In the first step, the ramp time was 10°min, temperature range was 20°C–180°C, and power was 1,200 W. In the second step, the hold time was 10°min, temperature was 210°C, and power was 1,800 W, followed by a cooling time of approximately 10 min. Afterward, to completely dissolve the sample, it was again digested for 15 min at the same power and temperature in a microwave oven. At the end of the microwave program, the vials were cooled for 30 min. The completely dissolved sample solution after cooling was diluted with 10 mL deionized water (Milli-Q water >18.0 MΩ cm) and transferred into a new Teflon vial (20 mL). The microwave-digested samples were then evaporated to dryness at 150°C on a hotplate overnight. The final and clear residue left after drying was dissolved in 1% nitric acid for complete dissolution of the samples, and the solution was adjusted to a final volume of 20 mL for elemental analyses. Two replicate digestions were performed for each sample, and the same method was applied to the blanks as well.
Concentrations of major elements (S and Na) and a few trace elements (Al, Ti, and Fe) were determined by inductively coupled plasma atomic emission spectroscopy (ICP-AES, 8300DU; PerkinElmer Optima, Waltham, MA, United States). Remaining elements, both trace elements (Cu, Mo, Ba, Sr, Co, Cr, Li, Ni, V, Zn, Zr, As, Sb, Cd, Cs, Pb, Th, and U) and REEs (La, Ce, Pr, Nd, Sm, Sc, Eu, Gd, Dy, and Lu), were determined by inductively coupled plasma mass spectrometry (ICP-MS, iCAP™ TQ; Thermo Fisher Scientific, Germany) (Falciani et al., 2000). Both the analyses were performed at Korea Basic Science Institute (KBSI, Chungbuk, Republic of Korea). Indium was used as an internal standard. The analytical quality of the measurement was checked by simultaneously running blanks every five samples and repeated measurements of standard reference materials. The following standard reference materials were also processed to verify the sample preparation and analytical quality of the instruments: SRMs NIST 1570a and NIST 1573a. The detection limit for S and Na was approximately 0.1–2.0 mg/kg. The detection limits of trace elements were 0.005–1.0 mg/kg, and those of REEs were 0.001–0.01 mg/kg. The recovery rates associated with the whole procedure of all standard reference materials were approximately 82%–127%.
2.4 Data analyses
The decomposition patterns and rates were estimated using the accumulated mass loss or remaining amount of litter using the single exponential model:
where M0 is the initial mass, Mt is the mass at a certain time, t, (normally given in year), and k is the decay rate constant (yr−1) (Olson, 1963; Berg, 2014). The time required for 50% (t50) mass loss was calculated as given in Olson (1963):
The absolute amount of elements remaining is calculated by multiplying the concentration of elements with the amount of dry litter mass remaining in the litter bag after incubation as given in Berg and Laskowski (2005). Differences in the element concentrations and amounts before the start of in situ incubation (initial) and at the end of in situ incubation (final), as percentage change, were calculated as given in Gautam et al. (2020):
where XI is the initial concentration or amount of litter in the bag and XF is the final concentration or amount in the residual litter at the end of the decomposition period.
To compare the dynamics in the litter types and emphasize temporal differences in concentration and amount against time and mass loss, line plots were used. The trends generated in the plot allowed us to perceive the distinctive pattern of change. We used polynomial regression (linear and quadratic models) to test the relationships between element dynamics and amounts of accumulated litter mass loss. Two separate regression analyses were performed: one with change in element concentration and another with percent accumulated mass loss of the decomposing litter, to determine the underlying relationship. If the linear relationship did not fit the data and was unable to capture the patterns, polynomial quadratic regression was used to model the relationship between variables to match the pattern of the data.
where Y determines the element concentrations or amounts, Pr1 is the intercept, and Pr2 and Pr3 are estimates of parameters of quadratic regression for the amount of accumulated mass loss (ML). Additionally, ordinary least square regression was performed between concentrations of trace elements and C, N, AUR, P, and Mn to understand their general relationship. Correlations among elements during decomposition using Spearman’s rank-order correlation were carried out separately for both the litter types. A canonical correlation analysis (CCoA) was performed to study the relationship between REE dynamics and four predictors (AUR, N, Fe, and Al) that probably can define their dynamics. CCoA is a multivariate technique that checks the association between two groups of variables by assessing the correlation between the linear combinations of a first variate group and the linear combinations of a second variate group (Legendre and Legendre, 2012). These four predictor variables were selected from all seven predictor variables based on the condition that the significant coefficient of determination exceeding 0.50 (p < 0.05); C, P, and Mn were excluded from the final analyses because they showed a non-significant relationship with the REEs. In the two sets of variables, with REE concentrations as the dependent variable and predictor concentration as the independent variable, CCoA extracts pairs of canonical functions from each set that are correlated with each other. We determined the existence of overall relationships between two sets of variables (dependent u and predictor v) by examining the standardized squared correlation coefficients (Rc2). Wilk’s lambda test was used to test the significance of the first Rc2. If we observed a p-value < 0.05 (large lambda value), then the two sets of variables were considered related and dependent. Following this, canonical factor loadings or structure correlation coefficients for significant Rc2 were examined to determine the contribution of each element to their respective canonical variates. Canonical cross-loading was also assessed to check how each variable was correlated with the corresponding canonical variate. Finally, the redundancy coefficient (Rd) was calculated to measure for each set of input variables what proportion of the variability of the input variables is predicted by the canonical variables (both u and v). Prior to CCoA, Box–Cox transformation of the data related to independent and predictor variables was performed to achieve normality. XLSTAT was used for the analyses (XLSTAT-pro; Addinsoft, New York).
3 Results
3 1 Decomposition: overview and general trend
Accumulated mass loss for both the litter types, annual decay constants (k), and other general characteristics and initial concentrations of major, trace, and rare earth elements in both the litter types are given in Tables 1, 2, Supplementary Figure S1, respectively. Accumulated mass loss as a percentage of initial dry litter mass declined exponentially and significantly through decomposition years for both Scots pine litter (SPL) (F = 59.2, p < 0.002) and Norway spruce litter (NSL) (F = 577, p < 0.0001). The adjusted coefficients of determination (adj R2) for the regressions (percentage accumulated mass loss vs. time-years) were 0.92 and 0.99 for SPL and NSL, respectively (Table 1). In 4 years, 70.1% of SPL and in 5.2 years, 68.5% of NSL decomposed during the in situ field incubations. In the initial 12 months, accumulated mass loss was 2.2-fold higher in the SPL relative to NSL. The estimated annual organic matter decay constants (single exponential) (k) were −0.323 for SPL and −0.217 for NSL. Overall, the t-test of the regression slopes revealed significant differences (p = 0.04) in the decomposition rates between NSL and SPL. The time required for 50% accumulated mass loss showed that the decomposition was ∼1.5-fold higher in SPL than NSL (Table 1).
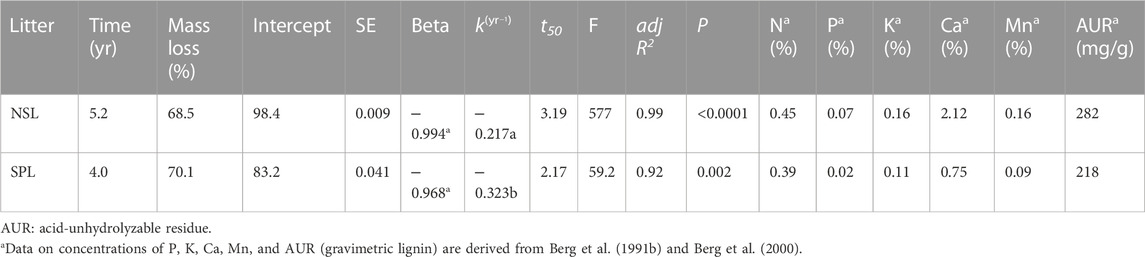
TABLE 1. Summarized results for decomposition of local litter of Norway spruce (NSL) and Scots pine (SPL); final accumulated mass loss (%), decomposition rate constants (k) (year−1) of the negative single exponential model, time to achieve 50% (t50) decomposition for the litter of Scots pine and Norway spruce at site Grensholm Castle, Southern Sweden. The star in the superscript on the standardized coefficient beta shows the significant t-test of the regression coefficient. Different lowercase superscript letters on k show heterogeneity of slopes between the decomposition of the two litter types.
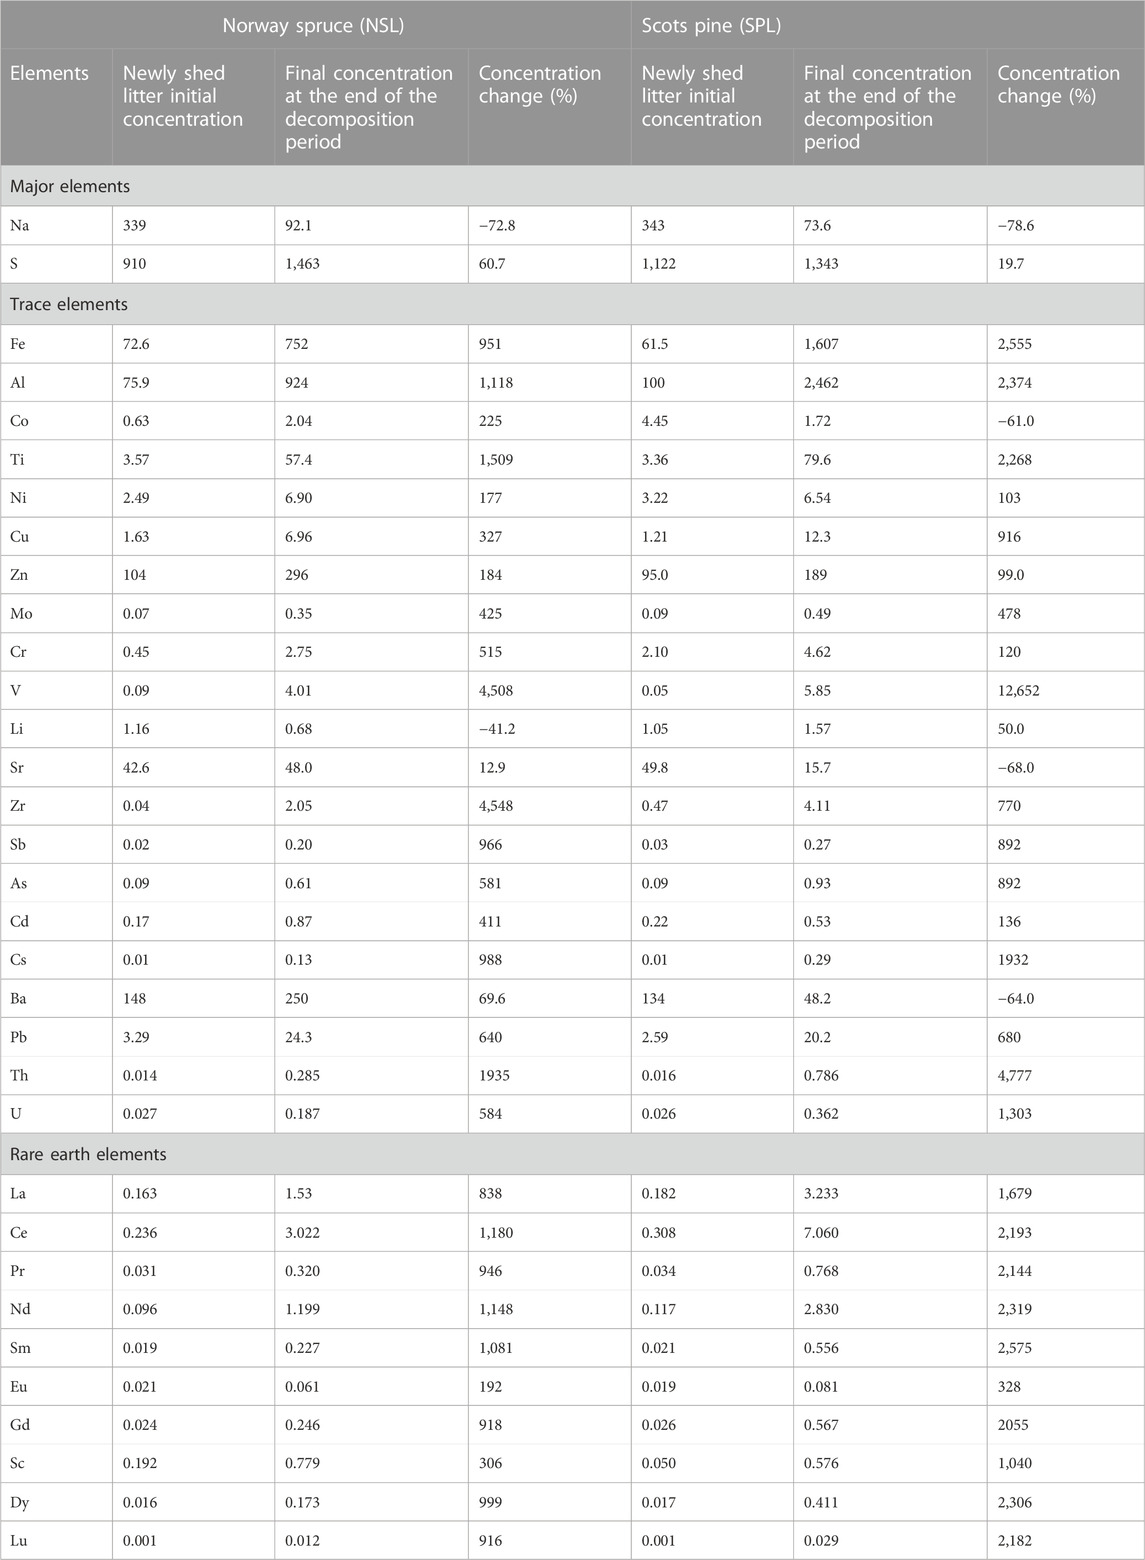
TABLE 2. Changes in concentrations (mg/kg) and percentage change in element concentrations after in situ decomposition of local litter containing Norway spruce (NSL) and Scots pine SPL). Percentage change is calculated as [(CF–CI)/CI] × 100, where CI is the initial concentration of litter in the bag and CF is the final concentration of the residual litter at the end of the decomposition period. The plus sign (+) shows an increase, and the minus sign (−) shows a decrease in element concentrations.
The initial concentrations of Na and S were slightly higher in SPL than in NSL (Supplementary Figure S1; Table 2). The initial concentrations of Sr, Al, Cr, Co, Zr, Mo, Sb, As, Cd, Cs, and Th were higher in SPL than in NSL (1.04–10.68-fold). In contrast, the concentrations of Fe, Zn, Ba, Li, Ti, Cu, V, Pb, and U were higher in NSL than in SPL (1.06–1.90-fold). For most of the elements, the relative differences between the two litter types were small (1.04–1.90-fold). The largest concentration difference between the two litters was observed for Cr, Zr, and Co, the concentrations of which in SPL were 4.7–10.7-fold higher than those in NSL. In the case of REEs, except for Sc and Eu, all concentrations were higher in SPL than in NSL (1.08–1.30-fold), and the largest difference in REEs, viz., 3.8-fold higher concentration, was recorded for Sc in NSL.
3.2 Dynamics of concentration change in decomposing litter for major, trace, and rare earth elements
A general decrease (73%–79%) and an increase (20%–61%) in the concentrations of Na and S, respectively, were noticed in both SPL and NSL with time and accumulated mass loss (Figure 1A; Table 2). Trace elements showed almost identical dynamics of concentration increase through time, except for a few (Li in NSL and Co, Sr, and Ba in SPL) (Figure 1A; Table 2). The percentage concentration increase in SPL was 50%–12652%, which was lowest in Li (from 1.05 to 1.57 mg/kg) and highest in V (from 0.05 to 5.85 mg/kg); in NSL, it was 69.6%–4,548%, which was lowest in Ba (from 148 to 250 mg/kg) and highest in Zr (from 0.04 to 2.05 mg/kg). For NSL, significant positive correlations (r = 0.44–1.0; p = 0.04–<0.0001) were found for the concentration change among most of the elements, whereas for SPL, most of the elements showed insignificant correlations among them (r = 0.001–1.0; p = 1.0–0.003) (Electronic Supplementary Figure S2). Polynomial quadratic regression of trace element concentration against accumulated mass loss resulted in significant relationships for SPL (p = 0.31–0.002; adj R2 = 0.20–0.98) and NSL (p = 0.15– <0.0001; adj R2 = 0.29–0.97) (Figure 1B; Supplementary Table S1). We noticed significant relationships between concentrations of trace elements with N, AUR, Mn, or P (p = 0.45–<0.05; R2 = 0.03–0.99) (Figures 2, 3). However, no significant relationship was observed between carbon and trace elements (results not shown).
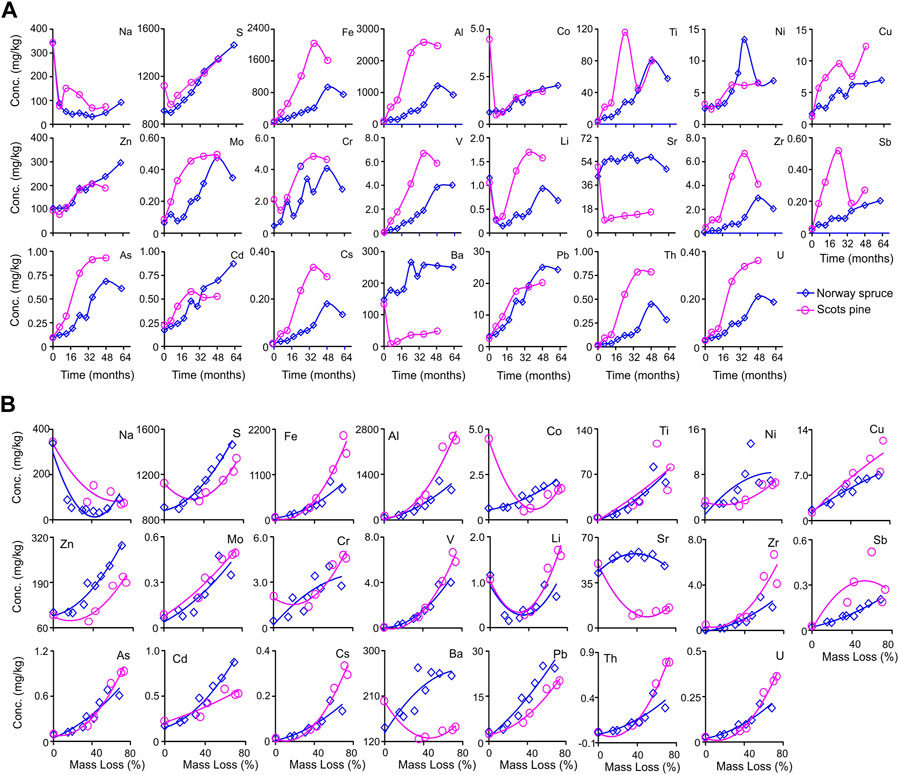
FIGURE 1. (A) Concentration change dynamics through time of major (Na and S) and trace (Fe–U) elements during in situ decomposition of local litter of Norway spruce (NSL) and Scots pine (SPL) in hemi-boreal forest stands, site Grensholm Castle, Southern Sweden. (B) Fitted plots of polynomial quadratic regressions between concentration change and accumulated mass loss for major (Na and S) and trace (Fe–U) elements (mg/kg) for decomposing litter of local Norway spruce (NSL) and Scots pine (SPL) in hemi-boreal forest stands, site Grensholm Castle, Southern Sweden.
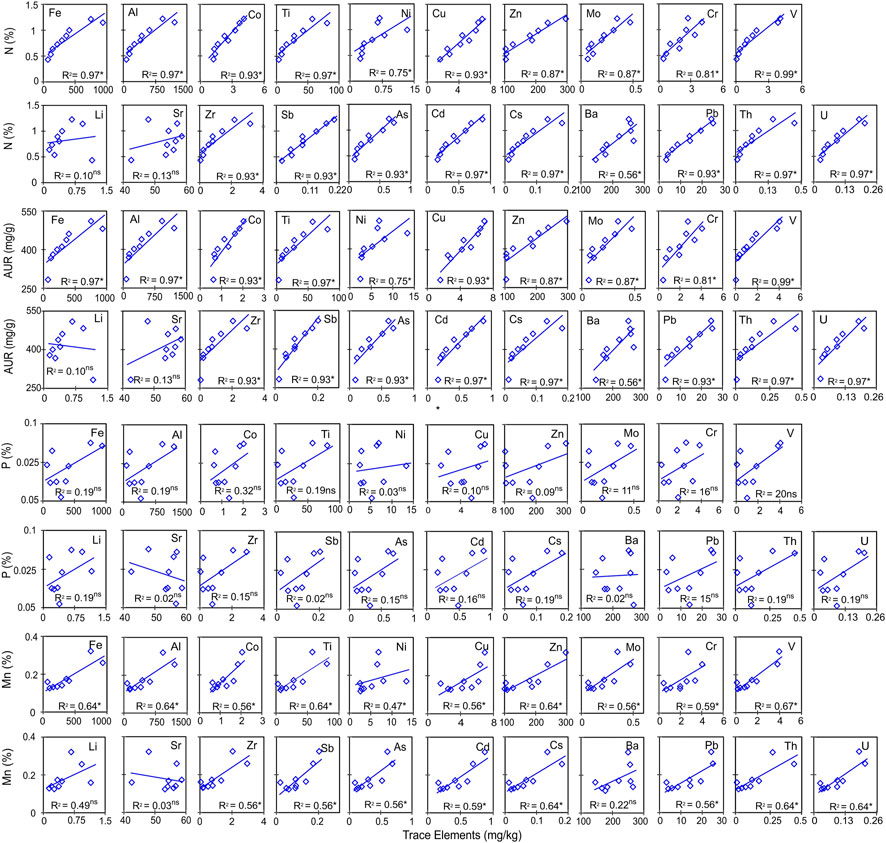
FIGURE 2. Ordinary least-square regressions showing relationships between changes in the concentrations of trace elements with N, AUR, P, and Mn during in situ decomposition of Norway spruce litter. R2 is the coefficient of determination, and the superscript asterisk and ns denote a significant relationship at p < 0.05 and a non-significant relationship, respectively.
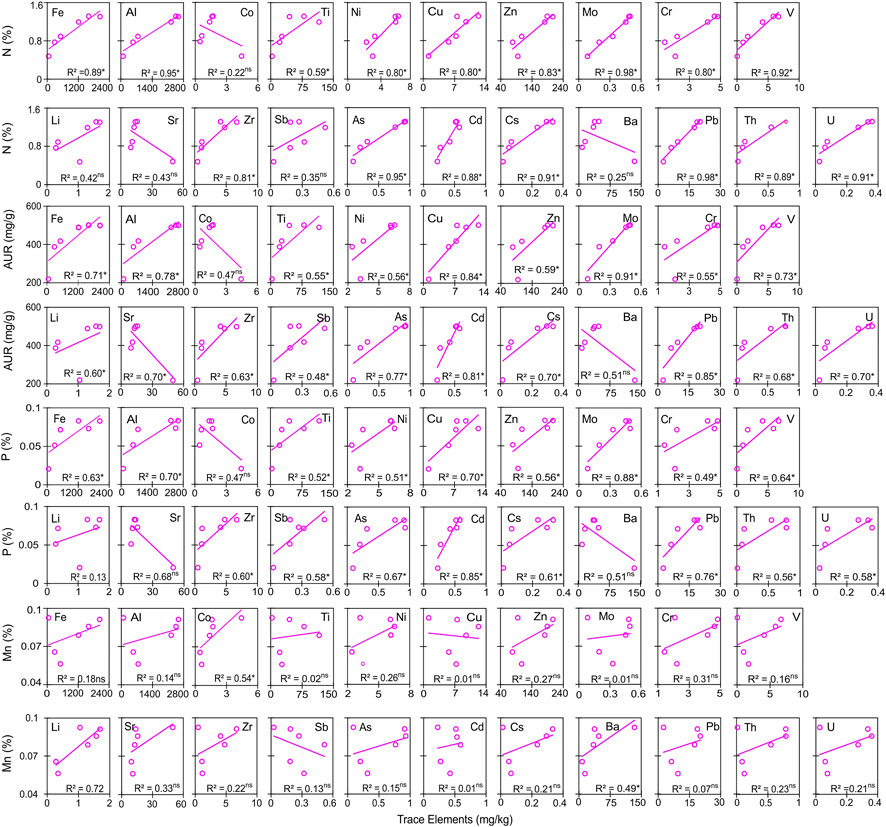
FIGURE 3. Ordinary least-square regressions showing relationships between changes in the concentrations of trace elements with N, AUR, P, and Mn during in situ decomposition of Scots pine litter. R2 is the coefficient of determination, and the superscript asterisk and ns denote a significant relationship at p < 0.05 and a non-significant relationship, respectively.
All the REEs increased in concentration during the in situ decomposition (Figure 4A; Table 2). Generally, REE changes in concentrations in both litter types showed high and significant positive correlations for SPL (p = 0.0001–<0.0001, r = 0.92) and NSL (p = 0.29–<0.0001, r = 0.16–1.0) (Electronic Supplementary Table S2). REEs also showed significant correlations with AUR (acid-unhydrolyzable residue), Fe, Al, N, C, C:N, and P (Table 3). Polynomial quadratic regressions between accumulated litter mass loss and corresponding changes in their REE concentrations showed significant relationships between them in both the litter types (SPL adj R2 > 0.95; p = 0.001–<0.0001; NSL adj R2 > 0.74; p = 2.71–<0.0001) (Figure 4B; Supplementary Table S2).
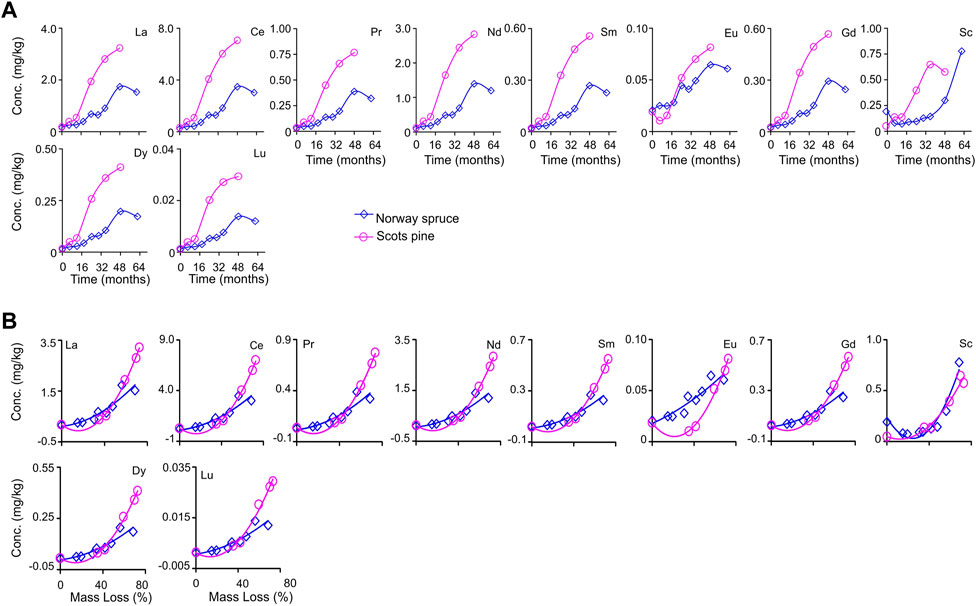
FIGURE 4. (A) Concentration change dynamics through time of rare earth elements (La–Lu) during in situ decomposition of local litter of Norway spruce (NSL) and Scots pine (SPL) in hemi-boreal forest stands, site Grensholm Castle, Southern Sweden. (B) Fitted plots of polynomial quadratic regressions between accumulated mass loss and concentration of rare earth elements (La–Lu) in decomposing local litter of Norway spruce (NSL) and Scots pine (SPL) in hemi-boreal forest stands, site Grensholm Castle, Southern Sweden.
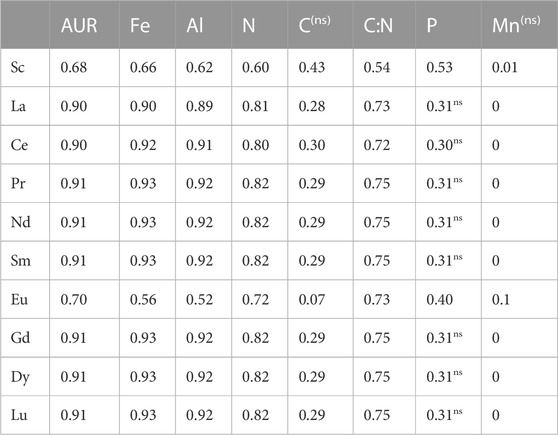
TABLE 3. Coefficient of determination (r2) for Spearman’s rank correlation between concentrations of rare earth elements and a few predictor variables (Fe, Al, N, C, C:N ratio, P, and Mn), including AUR (acid-unhydrolyzable residue). Correlations in the matrix are significant at a p-value < 0.05. ns in the superscript illustrates non-significant correlations.
3.3 Dynamics of amount change in decomposing litter for major, trace, and rare earth elements
The amounts of Na and S decreased in SPL (94.2% and 67.8%, respectively) and NSL (91.5% and 49.4%, respectively). Fe, Al, Co, Ti, Cu, Mo, Cr, V, Zr, Sb, As, Cd, Cs, Pb, Th, and U showed an overall increase (least in Co with 2.4% and most in V with 3,334%). The amounts of Ni, Zn, Li, Sr, and Ba decreased during decomposition (most in Sr with 91.5% and least in Zn with 10.7%) (Figure 5A; Table 4). Polynomial regression of accumulated mass loss against the amount resulted in low adj R2 and low p-values for both litter types where points did not fit closely on the fitted line (Figure 5B; Supplementary Table S3).
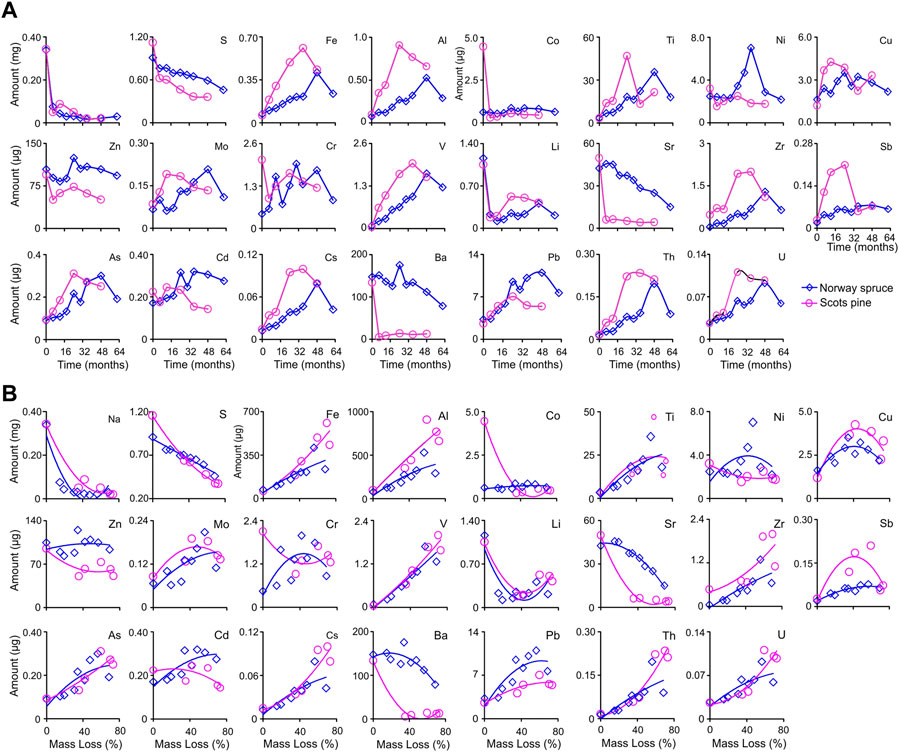
FIGURE 5. (A) Amount change dynamics of major (Na and S) and trace (Fe–U) elements through time during in situ decomposition of local litter of Norway spruce (NSL) and Scots pine (SPL) in hemi-boreal forest stands, site Grensholm Castle, Southern Sweden. (B) Fitted plots of polynomial quadratic regressions between percentage accumulated mass loss and change in amount of major (Na and S) and trace (Fe–U) elements for decomposing litter of Norway spruce (NSL) and Scots pine (SPL) in hemi-boreal forest stands, site Grensholm Castle, Southern Sweden.
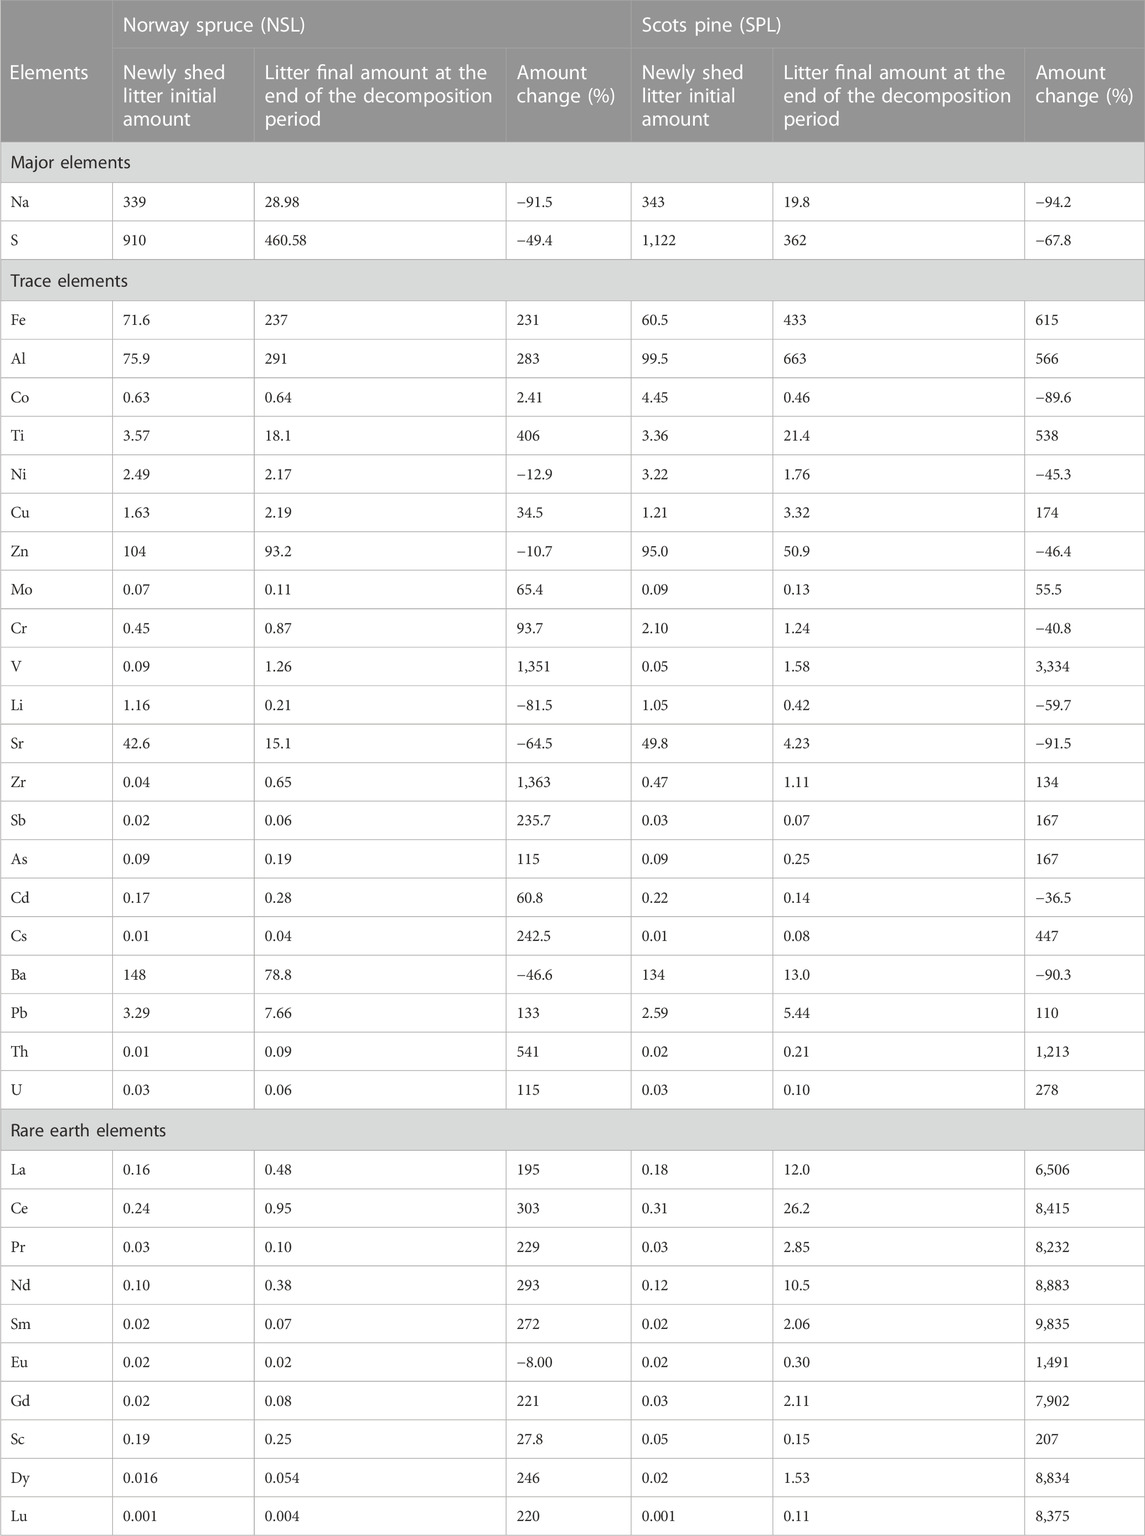
TABLE 4. Absolute (μg) and percentage changes in the amounts of major and trace elements as well as in REEs after in situ decomposition of local litter from Norway spruce (NSL) and Scots pine (SPL). Percentage change is calculated as [(AF−AI)/AI] × 100, where AI is the initial amount of litter in the bag and AF is the final amount of the residual litter at the end of the decomposition period. The plus sign (+) shows net element accumulation, and the minus sign (−) shows net element release.
The amount of all the REEs increased non-linearly with time during in situ decomposition in both the litter types (with 15.4%–621% in SPL and 27.8%–303% in NSL) (Table 4; Figure 6A). Polynomial regression between the amount and accumulated mass loss resulted in adj R2 in the range of 0.21–0.96 and p-values in the range of 0.28–0.0001, with the best-fit line not adequately fitting the data in NSL (Figure 6B; Supplementary Table S4). Canonical correlation analysis (CCoA) resulted in four canonical functions, with the first two of them cumulatively explaining 98% of the variance between predictor and dependent variables (Figure 7A; Table 3). The results indicate that the first canonical correlation was significant (p < 0.05), which implies a strong relationship between the REE and predictor variables. Other canonical functions did not yield a significant correlation. Supplementary Table S5 shows the standardized canonical coefficients and other indices of the canonical correlation analysis. Both the dependent and predictor variables showed high structure correlation coefficients or canonical factor loadings on factor 1. Factor 1 was loaded with Al, Fe, N, and AUR, and factor 2 was moderately loaded with AUR and N. All the REEs also showed high loading on factor 1 (Figure 7A; Supplementary Table S5). It can be seen from the biplot that Al and Fe had the largest effect on the REE dynamics and accumulation richness compared to AUR and N (Figure 7A). The variables within factor 1 yielded a high canonical correlation of 0.99 and a squared canonical coefficient (Rc2) effect of 0.99, and the variables linked to factor 2 also had a high correlation of 0.96 and squared canonical coefficient (Rc2) effect of 0.95. CCoA also resulted in a high redundancy coefficient (Rd > 0.75), suggesting that a significant proportion of the variability of the input variables is predicted by the canonical variables (Figures 7B, C).
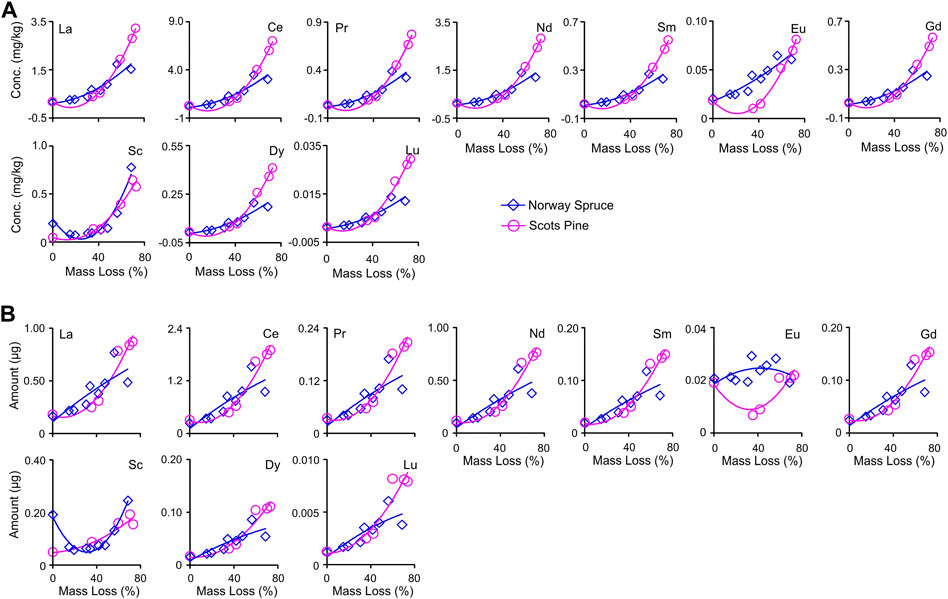
FIGURE 6. (A) Dynamics of REE (La–Lu) amount change through time during in situ decomposition of local litter of Norway spruce (NSL) and Scots pine (SPL) in hemi-boreal forest stands, site Grensholm Castle, Southern Sweden. (B) Fitted plots of polynomial quadratic regressions between accumulated mass loss and amount change of rare earth elements (La–Lu) for decomposing local litter of Norway spruce (NSL) and Scots pine (SPL) in hemi-boreal forest stands, site Grensholm Castle, Southern Sweden, Sweden.
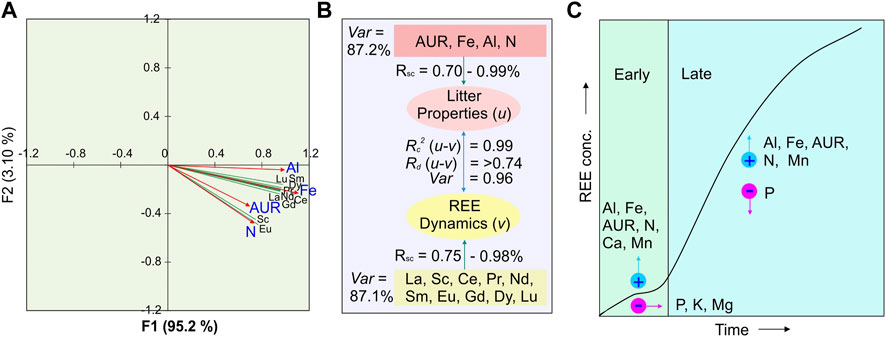
FIGURE 7. (A) Canonical correlation plot between litter properties (u = AUR, Fe, Al, N) and REE dynamics (v) for the litter decomposition. (B) Path diagram showing canonical correlation loadings for independent (u) and dependent variables (v) and interrelationships between the two sets of variables (u–v). AUR is the acid-unhydrolyzable fraction; Var is the variance; Rc2 is the squared canonical correlation coefficient; Rd is the redundancy coefficient; Rsc is the structure correlation coefficient. (C) Two-stage model for concentration change in REEs during decomposition. In the early stage, at an average of 25% accumulated mass loss, the concentration increase was small; however, in later stages, the concentration increase was rapid. REE concentration increase, both in the early and late stages, is influenced by increases in Al, Fe, AUR, and N. Mn also seems to have a small stimulating effect on the increase in REE concentration since it was not significantly correlated with their increase. For both the litter types, on average, the accumulated mass loss reached almost 70% in the humus-near stage (Berg, 2014), and when the decomposition rate was reaching toward zero, REE concentration for decomposing litter was still increasing and not reaching asymptote (i.e., limit value).
4 Discussion
4.1 Na and S dynamics during decomposition
We established a correlation between concentration changes during decomposition and the cumulative mass loss, as well as variations in the elemental content of the remaining litter. At the end of the study period, at approximately 68% and 70% accumulated mass loss and relative to the initial concentration, the Na concentration in NSL and SPL had decreased by 73% and 79%, respectively (Table 2). In addition to this, both the litters had >91% decrease in the Na amount compared to the initial amount (Table 4). In NSL, the lowest point of Na concentration and amount occurred at approximately 48% accumulated mass loss after 3 years into the decomposition (Figure 1A; Figure 5A). After this point, an upward progression was noticed. At the same time, a similar decrease in concentration and amount in SPL was observed but at 70% accumulated mass loss. Na probably is loosely bound to the litter and hence easily released (Brun et al., 2008). However, the change pattern was irregular; after an abrupt decrease in the initial 6 months, both concentration and amount increased, probably linked to litter decomposers who have the capacity to accumulate Na up to approximately 100–1000-fold (Cromack et al., 1977). This increase was followed by a steady decrease until the end of the study period. Similar findings have been made by Brun et al. (2008) and Cao et al. (2018). The decreases in concentration and amount were best described by the negative polynomial model—with the increase in accumulated mass loss, an increased release of Na was noticed. The decrease in Na concentration and/or amount was observed in previous studies as well (Brun et al., 2008; Hristovski et al., 2014; Gautam et al., 2019), meaning that no net accumulation/immobilization took place and that the bulk of the Na was released from the litter, leaving only a small percentage (<9% of the initial amount) in the residual litter at the end of the decomposition period (Figure 5A).
On the other hand, S concentration in both NSL and SPL decreased by only 15% and 35%, respectively, with accumulated mass loss in the initial months (Figure 1A; Table 2). Similar to the observations of Laskowski et al. (1995) and Brun et al. (2008) for S concentration dynamics, we found that after an initial decrease in both the litter types, the concentration of S increased continuously until the end of the decomposition study. The increase in concentration with accumulated mass loss was best represented by a positive and significant quadratic polynomial model (Figure 1B). On the other hand, the net amount in both the litter types decreased (Figure 5A), and with the accumulated mass loss, this resulted in a significant, negative quadratic model (Figure 5B). With the increase in concentration by 61% and 21% in NSL and SPL, respectively, they had lost 50% and 68% of their original amount at approximately 70% accumulated mass loss. A decrease in the amount concomitant with an increase in the concentration implies that when sulfur was released from the litter during decomposition, the remaining elements (∼32%–50%) left behind in the litter were immobilized in the residual litter by humic components (Laskowski et al., 1995; Lomander and Johansson, 2001; Berg, 2014; Van Nevel et al., 2014). The functional groups on humic substances have a tendency to interact with different ions, including S, and form soluble salts (humates) which render the remaining elements immobilized within the residual litter (Berg and Laskowski, 2005).
4.2 Trace element dynamics during decomposition
Despite over 4 years of in situ decomposition of both the litters, when approximately 70% of the initial mass was lost, not all the trace elements were released. Both the decomposing litter types acted as a source for some elements and as sink for the others (Tables 2, 4). In our study, the concentration of five nutrient trace elements—Fe, Ti, Cu, Mo, and V—increased non-linearly during the incubation, similar to the dynamics reported in previous decomposition studies (Lomander and Johansson, 2001; Tyler, 2005; Hristovski et al., 2014; Gautam et al., 2020). In addition to this, non-essential elements like Zr, Th, and U and toxic elements, including the heavy metals Al, Sb, As, Cs, and Pb, also increased in concentrations as decomposition proceeded. The increase in the concentration of these elements agrees with other studies performed in Scandinavian ecosystems (Laskowski and Berg, 1993; Brun et al., 2008) and elsewhere (Yue et al., 2019; Li et al., 2020; Kondratova and Bryanin, 2021; De Marco et al., 2022). Their increase in concentrations is probably related to increased AUR and N since we observed a significant relationship between them (Figures 2, 3). The concentration increase was higher for NSL than for SPL, which may be due to the difference in the decomposition rates and incongruence in the formation of element–organic matter complexes (Laskowski and Berg, 1993; Van Nevel et al., 2014; Berg and McClaugherty, 2020).
With a general pattern of significant polynomial fittings and high adj R2, it seems that accumulated mass loss may explain the increases in the concentrations of trace elements (Figure 1B). Concentration increases happen due to the low mobility of elements when they are retained in residual litter mass. Most of these elements showed significant correlations among them, suggesting that they have increased in concentration through similar processes (Electronic Supplementary Figure S2). In the course of the decomposition processes, a build-up of organic matter takes place, and the amount of humic substances increases (Scheid et al., 2009), which immobilizes elements in the residual litter (Laskowski and Berg, 1993; Van Nevel et al., 2014). In this study, both Al and Fe showed accumulation during litter decomposition. This finding is consistent with the results obtained by Tyler (2005), Brun et al. (2008), and Shen et al. (2020). Their enrichment is probably related to their continuous chelation with the organic substances generated during litter decomposition and accumulation (net increase) by microorganisms. We recorded a significant relationship of Al and Fe with AUR and N in both the litter types. The continuous formation of Al and Fe organo-mineral complexes and their accumulation in litter bags increase their own activity (Shen et al., 2020). Such increased activity probably can immobilize other elements indirectly through Al and Fe (hydro)oxide formation (Miltner and Zech, 1998). A significant correlation observed between trace elements and Al and Fe suggests such a relationship (Electronic Supplementary Figure S2). Both the litters decomposed to approximately 70%, and at the same time, the concentration increase was remarkable, ranging from 1.5-fold to as much as 127-fold higher than the initial concentration. This means that the elements that were present in the initial litter from the beginning stayed in the litter but now became stored in a reduced amount of litter, consequently making the litter more concentrated with elements. Additionally, the dynamics show an increase with the curve rising with percentage accumulated mass loss (Figure 1B), which possibly suggests that if left in the field for a longer time, further increase in the concentration might have occurred.
The amount of these same trace elements increased 1.34–34-fold non-linearly with accumulated mass loss (Figure 5B). Probably, these elements would have accumulated in the litter bags from external sources (Laskowski and Berg, 1993; Laskowski et al., 1995; Tyler, 2005; Van Nevel et al., 2014). Fungal mycelia growing inside the litter bags can accumulate and immobilize elements through intensive mycelial growth, and fungi can also accumulate soil-derived elements (Gadd and Griffiths, 1978; Lomander and Johansson, 2001). When Fe and Al were regressed with Mn and P, significant relationships were observed with either one of them (Figures 2, 3). Generally, an increase in the concentration of Mn is associated with increased fungal activities in the decaying environment where it acts as a co-factor for peroxidases produced by fungi (Berg and McClaugherty, 2020). The elements can also come from atmospheric dust, either directly or via throughfall and bioturbation (Brun et al., 2008; Gautam et al., 2020). Regardless of the pathways, once the elements are in the litter bags and in contact with the litter, secondary compounds generated during decomposition act as chelating agents for accumulating elements. Stabilization of organo-minerals in the organic matter of decomposing litter render these elements immobilized (Stevenson, 1982; Scheid et al., 2009). Two processes, immobilization and accumulation in tandem, thus seem to have resulted in an increase in both the concentration and amount of these elements.
Ni, Zn, Li, and Ba increased in concentration, but there was a net decrease in amounts in both litter types during the progression of decomposition (Tables 2, 4). Such a divergence in the concentration and amount dynamics happens when release of elements takes place from the litter (Lomander and Johansson, 2001). A decrease in amount suggests mineralization and net release of the element from the decomposing litter. Non-significant relationships with accumulated mass loss with low adj R2 (Supplementary Table S3) suggest that apart from mass loss, there are other factors and processes which are responsible for the decrease in the amount of these elements. At high pH (>6.5) and high concentrations, accumulation of Ni takes place (Shi et al., 2012) through the formation of chelates with organic matter (Misra and Pande, 1974). Generally, Scandinavian forests have thick organic layers with low pH (<6.0) (Laskowski and Berg, 1993). Although Ni in both litters had a net decrease in amounts, in NSL, this element showed a two-phase dynamics process; the amount increased ∼3-fold relative to the initial amount (up to 38 months at 47.7% accumulated mass loss), followed by an abrupt decrease below the initial amount (38–62 months at >50% accumulated mass loss) (Figure 5B). Accumulation (due to microbial colonization) and release taking place in phases in NSL are probably related to the lag in the accretion of new organic matter in the bags. After a lag, decomposition led to the accumulation of organic acids, which resulted in a pH decrease in the litter bags (Adeleke et al., 2017). In the case of Ba, we noted a difference in its release pattern between NSL and SPL. The release from SPL was fast; at approximately 40% accumulated mass loss, the amount had decreased 25-fold in the first year. In contrast, in NSL, the dynamics were different; both the elements (Ni and Ba) initially showed an infinitesimal increase, and after 20% accumulated mass loss, there were sharp decreases in the amount. In the case of SPL, the bulk of the Ba was released during four and a half years of decomposition, leaving only 9% of the initial amount. However, from NSL, only half of the initial amount was released after almost five and a half years of incubation. Solubilization and release of the Ba under acidic conditions occur in tandem with microbial action. Lu et al. (2019) observed that low pH promotes its release from organic matter and soil, which is due to the limited ability of organic ligands to form complexes with barium. The release from SPL (10-fold) was higher than that from NSL (1.8-fold), which probably is again related to the faster decomposition of the former compared to the latter litter type. The amount of Li too decreased rapidly in both the litter types. In NSL, its decrease was fast; it decreased 5-fold in the first year until an accumulated mass loss of 20% was reached. SPL achieved the same level of decrease at approximately 35% accumulated mass loss. However, unlike the other three elements, at 40% accumulated mass loss, for both litter types, a slight net accumulation of Li was noticed in the decomposing litter (Figure 5B).
Release of Zn from the litter noticed in this study was different from other studies performed in the Scandinavian ecosystems (Laskowski and Berg, 1993; Lomander and Johansson, 2001) and elsewhere (Van Nevel et al., 2014). In the initial years, for SPL, a high decrease in the amount of Zn was observed, gradually reaching an asymptote after 40% accumulated mass loss (Figure 5B). For NSL, there was mainly no change. Zn generally is not tightly bound to the organic matter and hence is prone to leaching losses from decomposing litter, especially in initial years when the amount of new organic matter generally is less in the bags (Brun et al., 2008). The release of Zn generally is intensified under acidic conditions prevalent in the microenvironment because Zn is most readily mobile at lower pH. According to Kabata-Pendias (2010), the adsorption of Zn can be reduced at lower pH (<7) by competing cations, and this results in easy mobilization and leaching of Zn, which is an essential micronutrient element needed in trace amounts by the decomposer population. Rapid release of Zn is also probably due to its significance for the microbial population since it is an important co-factor in microbial enzymes, including those of fungi (Glass and Orphan, 2012). Sr decreased in both concentration and amount (Figure 1A, B, Figure 5A, B). In SPL, only ∼12% (at 35% accumulated mass loss) of the original Sr was left in the litter bag after 6 months of decomposition. Within the same period, the change in the amount in NSL was infinitesimal (Figure 5B). After the initial abrupt release, the amount of Sr in SPL decreased only marginally and reached an asymptote with only 8% of the original amount left at the end of the study. Contrary to this, the decline in the amount of Sr in NSL was gradual, and 35.5% of the original amount was still left in the bags at the end of the study. If left in the field, the litter would have further released its Sr. Release of Sr during decomposition is probably related to its diminishing adsorption with decreasing pH. At low pH (<5), due to competing acidic cations, Sr fails to chelate with organic matter and exist in free ionic conditions (Juo and Barber, 1970) and is susceptible to leaching losses. In this study, in both the litter types, Sr did not yield significant relationships with AUR and N (and not with other variables—C, P, and Mn) (Figures 3, 4). Gradual build-up of lignin and AUR further impacts Sr retention in the litter. Lignin does not provide any adsorption sites for Sr detached from litter during decomposition (Boyer et al., 2018), the reason for free Sr being susceptible to leaching losses.
4.3 Rare earth element (REE) dynamics during decomposition
All the REEs showed strong and significant positive increases both in concentration and amount with accumulated mass loss (Figures 4, 6). Few other short-term (Tyler, 2005; Gautam et al., 2020; Montemagno et al., 2021) as well as long-term (Brun et al., 2008) studies have reported an increase in REEs with the progression of decomposition. The increase probably is related to their immobilization and accumulation in the decomposing litter (Laskowski et al., 1995; Lomander and Johansson, 2001).
A limited increase (concentrations and amount) in the REEs was noticed in the initial years. This implies that they are not mobile during the initial decomposition phase when generally the mass loss rate was the highest and water-soluble elements disappeared fast from litter (Lomander and Johansson, 2001). The amount of REEs increased significantly in the litter only after reaching >35% accumulated mass loss. Their encumbered behavior followed by enrichment can be related to the build-up of organic matter in the litter bags. A number of studies have linked the REE enrichment of litter to biological, chemical, and/or physical processes (Brun et al., 2008; Gautam et al., 2020; Montemagno et al., 2021). Microbes that contribute to litter decomposition have the capacity to render REEs immobilized in their biomass. Fungal mycelia can transport REEs into the decomposition litter (organic matter) from the microenvironment in which litter bags are placed and incubated, thus enriching it with REEs (Tsuruta, 2007).
Organic matter plays an important role in the transfer, immobilization, and accumulation of REEs, controlling REEs dynamics in decomposing litter. As litter decomposes, its exchange capacity increases significantly due to humus formation (Prescott, 2005; Berg and McClaugherty, 2020). Due to their strong complexing capacity, humic substances in the organic matter, generated during decomposition, likely play an important role in the complexation of rare earth elements (REEs) and concentrating them in the decomposing litter (Davranche et al., 2011; Vermeire et al., 2016; Montemagno et al., 2021). Organic matter has many negatively charged sites per unit area, which offer REEs to chelate with it or be adsorbed (Berg and Laskowski, 2005). A number of studies linked the accumulation of REEs with the formation of Fe-, Al-, and Mn-oxides (Aubert et al., 2004; Davranche et al., 2011). Canonical correlation analysis that was used to test the relationship of REE dynamics with selected predictors (AUR, Fe, Al, and N) resulted in a high structure canonical correlation coefficient (Figure 7). The strong canonical correlation may indicate that there is a strong influence on the behavior of the REE dynamics from these studied predictors. These predictor variables (AUR, Fe, Al, and N) had positive relationships with the dynamics of REEs, further suggesting that the increase in their concentrations during litter decomposition was coincidental with the increase in the concentrations of REEs during decomposition (Figure 7C). Of the four predictors, Fe and Al had the highest loading and cross-loading, indicating that these two elements, as predictor variables with a relatively higher structure of canonical correlation, have a greater influence on the concentration change dynamics of REEs relative to AUR and N. Redundancy analysis, which is generally used in canonical correlation analysis to determine if one dataset explains the variation in the second dataset, resulted in a high redundancy coefficient, suggesting that the majority of the variability in REE concentration changes during litter decomposition can be related to Fe, Al, AUR, and N build-up in the decomposing environment (Figure 7B). According to Vermeire et al. (2016), Fe-, Al-, and Mn-oxides are known to scavenge REEs through either one process or a combination of processes such as co-precipitation, adsorption, surface complex formation, ion exchange, and penetration of the lattice. In our study, we have recorded an increase in the concentrations of Fe and Al during the progression of decomposition (Table 2). It thus seems that humification processes that increased the concentrations and amounts of Fe and Al in the litter can also immobilize a large amount of REEs. Irrespective of the type of REEs, a general pattern of high and significant correlations was recorded among REEs (Electronic Supplementary Figure S2). Phosphates can also a play role in the chemical speciation of REEs (Hu et al., 2006). The canonical correlation was insignificant when P was used as a predictor variable in the model, but it has moderate (but non-significant) correlations with REEs. Diatloff et al. (1993), in a simulation study, found that REEs have the ability to precipitate as phosphates, and in a separate study, Liu et al. (2022) found immobilization of REEs with the addition of P. Berg and Laskowski (2005) and Brun et al. (2008) used the same litter samples for the same region and noticed the accumulation of P during decomposition. It is possible that in leaf–litter decomposition, P plays some role in the adsorption or precipitation of REEs. Since REEs behave geochemically coherently owing to the small but steady decrease in ionic radius with increasing atomic number (Vermeire et al., 2016), a high correlation may indicate a common mechanism adopted by the litter’s organic phase to immobilize and accumulate REEs. Such high correlations most likely imply their common source as well.
Changes in the concentration and amount were higher in SPL than NSL; in particular, the amounts of La, Ce, Pr, Nd, Sm, Gd, Dy, and Lu were higher (>25-fold) in SPL (Tables 2, 4). This is probably due to the difference in the rate of decomposition and concomitant rate of humic substance formation in the decomposing litter. A general trend of upward convexity was noticed in the REE dynamics of concentration and amount for both the litter types (Figures 4, 6). Even after >4 years and at >68% of the accumulated mass loss, such an increasing trend suggests that further in situ decomposition of litter would have probably resulted in further accumulation of REEs in/onto the organic substances, including recalcitrant fractions like lignin.
5 Conclusion
The leaf–litter decomposition of Norway spruce (P. abies L.) and Scots pine (Pinus sylvestris L.) was investigated for over 4 years to improve our understanding of long-term temporal dynamics of understudied trace elements and overlooked rare earth elements in the hemi-boreal forest of Southern Sweden. Our results indicated that trace elements can be divided into two main groups based on the difference between the beginning and the end of the in situ incubations: 1) Fe, Al, Ti, Cu, Mo, V, Zr, Sb, As, Cs, Pb, Th, and U increased in amount, suggesting their immobilization and accumulation, and 2) Ni, Zn, Li, Cd, and Sr decreased in amount, implying their utilization and/or release during the decomposition processes. Of all the trace elements that showed enrichment with the progression of decomposition, only Ti, Cu, Mo, and Pb reached limit values, whereas the other elements showed an upward trend, which implies that they would have probably accumulated more in the new organic matter of the litter if incubation had been extended further.
The accumulation of REEs in the organic phase of the decaying litter suggests a shared mechanism, with levels increasing by as much as approximately 99 times by the end of the incubation period. The illustration that the bulk of the REEs initially present in the litter can be retained and, with the development of organic substances, can also be immobilized and accumulated in the short-term (≤1 year) to long-term (≥4 years) litter incubation has significance for the biogeochemical behavior of REEs at the ecosystem scale, especially for those ecosystems that are experiencing metal contamination. Litter decomposition drives a build-up and dynamics of stable organic matter and microbial communities in an ecosystem. The organic matter and microbial biomass act as sinks for elements and aid in their immobilization.
Data availability statement
The raw data supporting the conclusion of this article will be made available by the authors, without undue reservation.
Author contributions
BB and TN collected the data from field explorations. MG, KL, and HS analyzed the samples. MG, BB, KL, and TN processed and analyzed the data. MG, BB, and KL wrote the paper. KL and HS provided the analytical and other logistic support for the study. KL provided the funding for the study. All authors contributed to the article and approved the submitted version.
Funding
This study was supported by the KBSI grant (C360000).
Acknowledgments
The authors are thankful to late Prof. Maj-Britt Johansson who designed the experiment and executed the main part of the experiments. Furthermore, she provided litter samples from her repository for this study.
Conflict of interest
The authors declare that the research was conducted in the absence of any commercial or financial relationships that could be construed as a potential conflict of interest.
Publisher’s note
All claims expressed in this article are solely those of the authors and do not necessarily represent those of their affiliated organizations, or those of the publisher, the editors, and the reviewers. Any product that may be evaluated in this article, or claim that may be made by its manufacturer, is not guaranteed or endorsed by the publisher.
Supplementary material
The Supplementary Material for this article can be found online at: https://www.frontiersin.org/articles/10.3389/fenvs.2023.1190370/full#supplementary-material
References
Adeleke, R., Nwangburuka, C., and Oboirien, B. (2017). Origins, roles and fate of organic acids in soils: A review. S. Afr. J. Bot. 108, 393–406. doi:10.1016/j.sajb.2016.09.002
Aerts, R. (1997). Climate, leaf litter chemistry and leaf litter decomposition in terrestrial ecosystems: A triangular relationship. Oikos 79, 439–449. doi:10.2307/3546886
Aubert, D., Probst, A., and Stille, P. (2004). Distribution and origin of major and trace elements (particularly REE, U and Th) into labile and residual phases in an acid soil profile (Vosges Mountains, France). Appl. Geochem. 19, 899–916. doi:10.1016/j.apgeochem.2003.11.005
Berg, B., Berg, M. P., Bottner, P., Box, E., Breymeyer, A., Calvo de Anta, R., et al. (1993). Litter mass loss rates in pine forests of europe and eastern United States: Some relationships with climate and litter quality. Biogeochemistry 20, 127–159. doi:10.1007/BF00000785
Berg, B., Booltink, H. G. W., Breymeyer, A., Ewertsson, A., Gallardo, A., Holm, B., et al. (1991a). Data on needle litter decomposition and soil climate as well as site characteristics for some coniferous forest sites. 2nd ed. Uppsala: Swedish University of Agricultural Sciences. Department of Ecology and Environmental Research. Section 1 Data on site characteristics. Report No 41.
Berg, B., Booltink, H. G. W., Breymeyer, A., Ewertsson, A., Gallardo, A., Holm, B., et al. (1991b). Data on needle litter decomposition and soil climate as well as site characteristics for some coniferous forest sites. 2nd ed. Uppsala: Swedish University of Agricultural Sciences. Section 2. Data on needle litter decompositionDepartment of Ecology and Environmental Research. Report No 42. REP 43.
Berg, B. (2014). Decomposition patterns for foliar litter–a theory for influencing factors. Soil Biol. Biochem. 78, 222–232. doi:10.1016/j.soilbio.2014.08.005
Berg, B., and Ekbohm, G. (1991). Litter mass-loss rates and decomposition patterns in some needle and leaf litter types. Long-term decomposition in a Scots pine forest. VII. Can. J. Bot. 69, 1449–1456. doi:10.1139/b91-187
Berg, B., Johansson, M.-B., and Meentemeyer, V. (2000). Litter decomposition in a transect of Norway spruce forests: Substrate quality and climate control. Can. J. For. Res. 30, 1136–1147. doi:10.1139/x00-044
Berg, B., and Laskowski, R. (2005). Litter decomposition, a guide to carbon and nutrient turnover. New York: Elsevier.
Berg, B., McClaugherty, C., and Johansson, M.-B. (1997). Chemical changes in decomposing plant litter can be systemized with respect to the litter's initial chemical composition. Reports from the departments in Forest Ecology and Forest Soils. Uppsala: Swedish University of Agricultural Sciences, 85. Report 74.
Berg, B., and McClaugherty, C. (2020). Plant litter: Decomposition, humus formation, carbon sequestration. 4th ed. New York: Springer Press.
Boyer, A., Ning, P., Killey, D., Klukas, M., Rowan, D., Simpson, A. J., et al. (2018). Strontium adsorption and desorption in wetlands: Role of organic matter functional groups and environmental implications. Water Res. 133, 27–36. doi:10.1016/j.watres.2018.01.026
Brioschi, L., Steinmann, M., Lucot, E., Pierret, M. C., Stille, P., Prunier, J., et al. (2013). Transfer of rare Earth elements (REE) from natural soil to plant systems: Implications for the environmental availability of anthropogenic REE. Plant soil 366, 143–163.
Brun, C. B., Åström, M. E., Peltola, P., and Johansson, M-B. (2008). Trends in major and trace elements in decomposing needle litters during a long–term experiment in Swedish forests. Plant Soil 306, 199–210. doi:10.1007/s11104-008-9572-x
Campbell, C. R., and Plank, C. O. (1998). “Preparation of plant tissue for laboratory analysis,” in Handbook of reference methods for plant analysis. Editor Y. Kalra (Boca Raton, Florida, United States: CRC Press), 37–49.
Cao, C., Liu, S. Q., Ma, Z. B., Lin, Y., Su, Q., Chen, H., et al. (2018). Dynamics of multiple elements in fast decomposing vegetable residues. Sci. Tot. Envir. 616, 614–621. doi:10.1016/j.scitotenv.2017.10.287
Carpenter, D., Boutin, C., Allison, J. E., Parsons, J. L., and Ellis, D. M. (2015). Uptake and effects of six rare Earth elements (REEs) on selected native and crop species growing in contaminated soils. PLoS One 10, e0129936.
Cromack, K., Sollins, P., Todd, R. L., Crossley, D. A., Fender, W. M., Fogel, R., et al. (1977). “Soil microorganism—arthropod interactions: Fungi as major calcium and sodium sources,” in The role of arthropods in forest ecosystems (Berlin, Heidelberg: Springer), 78–84.
Davranche, M., Grybos, M., Gruau, G., Pédrot, M., Dia, A., and Marsac, R. (2011). Rare Earth element patterns: A tool for identifying trace metal sources during wetland soil reduction. Chem. Geol. 284, 127–137. doi:10.1016/j.chemgeo.2011.02.014
De Marco, A., Vittozzi, P., and Virzo De Santo, A. (2022). Elements dynamics, from leaf to stable leaf litter residue and soil, for two functional types of tree planted on volcanic deposits. Plant Soil 482, 127–140. doi:10.1007/s11104-022-05676-y
Diatloff, E., Asher, C., and Smith, F. (1993). Use of GEOCHEM-PC to predict rare Earth element (REE) species in nutrient solutions. Plant Soil 155/156, 251–254.
Falciani, R., Novaro, E., Marchesini, M., and Gucciardi, M. (2000). Multi-element analysis of soil and sediment by ICP-MS after a microwave assisted digestion method. J. Anal. At. Spectrom. 15, 561–565. doi:10.1039/B000742K
Gadd, G. M., and Griffiths, A. J. (1978). Microorganisms and heavy metal toxicity. Microb. Ecol. 4, 303–317. doi:10.1007/BF02013274
Gautam, M. K., Lee, K. S., Berg, B., and Song, B. Y. (2020). Major, trace and rare Earth elements dynamics in decomposing litters on successional sites in a cool temperate region of South Korea. Sci. Tot. Environ. 749, 142352. doi:10.1016/j.scitotenv.2020.142352
Gautam, M. K., Lee, K. S., Berg, B., Song, B. Y., and Yeon, J. Y. (2019). Trends of major, minor and rare Earth elements in decomposing litter in a cool temperate ecosystem, South Korea. Chemosphere 222, 214–226. doi:10.1016/j.chemosphere.2019.01.114
Gautam, M. K., Lee, K. S., Song, B. Y., Lee, D., and Bong, Y. S. (2016). Early–stage changes in natural 13C and 15N abundance and nutrient dynamics during different litter decomposition. J. Plant Res. 129, 463–476. doi:10.1007/s10265-016-0798-z
Glass, J. B., and Orphan, V. J. (2012). Trace metal requirements for microbial enzymes involved in the production and consumption of methane and nitrous oxide. Front. Microbiol. 3, 61. doi:10.3389/fmicb.2012.00061
Hansen, T. H., Laursen, K. H., Persson, D. P., Pedas, P., Husted, S., and Schjoerring, J. K. (2009). Micro-scaled high-throughput digestion of plant tissue samples for multi-elemental analysis. Plant Methods 5 (12), 12–11. doi:10.1186/1746-4811-5-12
Hättenschwiler, S., Tiunov, A. V., and Scheu, S. (2005). Biodiversity and litter decomposition in terrestrial ecosystems. Annu. Rev. Ecol. Evol. Syst. 36, 191–218. doi:10.1146/annurev.ecolsys.36.112904.151932
Hobbie, S. E. (1992). Effects of plant species on nutrient cycling. Trends Ecol. Evol. 7, 336–339. doi:10.1016/0169-5347(92)90126-V
Hobbie, S. E. (2015). Plant species effects on nutrient cycling, revisiting litter feedbacks. Trends Ecol. Evol. 30, 357–363. doi:10.1016/j.tree.2015.03.015
Hristovski, S., Berg, B., and Melovski, L. (2014). Limitless decomposition in leaf litter of common beech, patterns, nutrients and heavy metals dynamics. Pedobiologia 57, 131–138. doi:10.1016/j.pedobi.2014.01.005
Hu, Z., Haneklaus, S., Sparovek, G., and Schnug, E. (2006). Rare Earth elements in soils. Commun. soil Sci. plant analysis 37, 1381–1420.
Liu, C., Ding, T. X., Liu, W. S., Tang, Y. T., and Qiu, R. L. (2023). Phosphorus mediated rhizosphere mobilization and apoplast precipitation regulate rare Earth element accumulation in Phytolacca americana. Plant Soil 483, 697–709.
Johansson, M.-B., Berg, B., and Meentemeyer, V. (1995). Litter mass-loss rates in late stages of decomposition in a climatic transect of pine forests. Long-term decomposition in a Scots pine forest. IX. Can. J. Bot. 73, 1509–1521. doi:10.1139/b95-163
Jones, J. B., Wolf, B., and Mills, H. A. (1991). Plant analysis handbook. A practical sampling, preparation, analysis, and interpretation guide. Micro-Macro Publishing, Inc.
Juo, A. S., and Barber, S. A. (1970). The retention of strontium by soils as influenced by pH, organic matter and saturation cations. Soil Sci. 109, 143–148. doi:10.1097/00010694-197003000-00001
Kang, J., and Kang, A. M. (2020). Trend of the research on rare Earth elements in environmental science. Environ. Sci. Pollut. Res. 27, 14318–14321.
Kondratova, A. V., and Bryanin, S. V. (2021). Dynamics of heavy metals during litter decomposition in fire-affected boreal forests. J. Soils Sediments 21 (11), 3682–3691. doi:10.1007/s11368-021-03027-5
Laskowski, R., and Berg, B. (1993). Dynamics of some mineral nutrients and heavy metals in decomposing forest litter. Scand. J. Res. 8, 446–456. doi:10.1080/02827589309382791
Laskowski, R., Niklinska, M., and Maryanski, M. (1995). The dynamics of chemical elements in forest litter. Ecology 76, 1393–1406. doi:10.2307/1938143
Legendre, P., and Legendre, L. (2012). Canonical analysis. Dev. Environ. Model. 24, 625–710. doi:10.1016/B978-0-444-53868-0.50011-3
Li, X., Sun, Z., Tian, L., He, T., Li, J., Wang, J., et al. (2020). Effects of spatial expansion between Phragmites australis and Cyperus malaccensis on variations of arsenic and heavy metals in decomposing litters in a typical subtropical estuary (Min River), China. Chemosphere 240, 124965. doi:10.1016/j.chemosphere.2019.124965
Lomander, A., and Johansson, M-B. (2001). Changes in concentrations of Cd, Zn, Mn, Cu and Pb in spruce Picea abies needle litter during decomposition. Water Air Soil Poll. 132, 165–184. doi:10.1023/A:1012035620480
Lu, Q., Xu, X., Liang, L., Xu, Z., Shang, L., Guo, J., et al. (2019). Barium concentration, phytoavailability, and risk assessment in soil–rice systems from an active barium mining region. Appl. Geochem 106, 142–148. doi:10.1016/j.apgeochem.2019.05.010
Miltner, A., and Zech, W. (1998). Carbohydrate decomposition in beech litter as influenced by aluminium, iron and manganese oxides. Soil Biol. biochem. 30, 1–7. doi:10.1016/S0038-0717(97)00092-8
Misra, S. G., and Pande, P. (1974). Effect of organic matter on availability of nickel. Plant Soil 40, 679–684. doi:10.1007/BF00010523
Montemagno, A., Hissler, C., Bense, V., Teuling, A. J., Ziebel, J., and Pfister, L. (2021). Dynamics of Rare Earths and associated major and trace elements during Douglas-fir (Pseudotsuga menziesii) and European beech (Fagus sylvatica L) litter degradation. Biogeosciences Discuss. 19, 1–29. doi:10.5194/bg-2021-268
Olson, J. S. (1963). Energy storage and the balance of producers and decomposers in ecological systems. Ecology 44, 322–331. doi:10.2307/1932179
Osono, T., and Takeda, H. (2004). Potassium, calcium, and magnesium dynamics during litter decomposition in a cool temperate forest. J. For. Res. 9, 23–31. doi:10.1007/s10310-003-0047-x
Pourhassan, N., Bruno, S., Jewell, M. D., Shipley, B., Roy, S., and Bellenger, J. P. (2016). Phosphorus and micronutrient dynamics during gymnosperm and angiosperm litters decomposition in temperate cold forest from eastern Canada. Geoderma 273, 25–31. doi:10.1016/j.geoderma.2016.03.018
Prescott, C. E. (2005). “Decomposition and mineralization of nutrients from litter and humus,” in Nutrient acquisition by plants. Editor H. BassiriRad (Berlin: Springer-Verlag), 15–41.
Prescott, C. E. (2010). Litter decomposition: What controls it and how can we alter it to sequester more carbon in forest soils? Biogeochemistry 101, 133–149. doi:10.1007/s10533-010-9439-0
Rühling, Å., Tyler, G., and Ruhling, A. (1973). Heavy metal pollution and decomposition of spruce needle litter. Oikos 24, 402–416. doi:10.2307/3543816
Scheid, S., Günthardt-Goerg, M. S., Schulin, R., and Nowack, B. (2009). Accumulation and solubility of metals during leaf litter decomposition in non-polluted and polluted soil. Eur. J. Soil Sci. 60, 613–621. doi:10.1111/j.1365-2389.2009.01153.x
Shen, X., Chen, Y., Wang, L., Guo, L., Zheng, H., Zhang, J., et al. (2020). Mixture of plant functional groups inhibits the release of multiple metallic elements during litter decomposition in alpine timberline ecotone. Sci. Total Environ. 747, 141298.
Shi, Z., Peltier, E., and Sparks, D. L. (2012). Kinetics of Ni sorption in soils: Roles of soil organic matter and Ni precipitation. Environ. Sci. Techno. 46, 2212–2219. doi:10.1021/es202376c
Stevenson, F. J. (1982). Humus chemistry, genesis, composition, reactions. New York: John Wiley & Sons.
Tao, Y., Shen, L., Feng, C., Yang, R., Qu, J., Ju, H., et al. (2022). Distribution of rare Earth elements (REEs) and their roles in plant growth: A review. Environ. Pollut. 298, 118540.
Tsuruta, T. (2007). Accumulation of rare Earth elements in various microorganisms. J. Rare Earths 25, 526–532. doi:10.1016/S1002-0721(07)60556-0
Tyler, G. (2005). Changes in the concentrations of major, minor and rare–Earth elements during leaf senescence and decomposition in a Fagus sylvatica forest. For. Ecol. Manage. 206, 167–177. doi:10.1016/j.foreco.2004.10.065
Tyler, G. (2004). Rare Earth elements in soil and plant systems–A review. Plant Soil 267, 191–206. doi:10.1007/s11104-005-4888-2
Van Nevel, L., Mertens, J., Demey, A., De Schrijver, A., De Neve, S., Tack, F. M., et al. (2014). Metal and nutrient dynamics in decomposing tree litter on a metal contaminated site. Environ. Poll. 189, 54–62. doi:10.1016/j.envpol.2014.02.009
Vermeire, M. L., Cornu, S., Fekiacova, Z., Detienne, M., Delvaux, B., and Cornélis, J. T. (2016). Rare Earth elements dynamics along pedogenesis in a chronosequence of podzolic soils. Chem. Geol. 446, 163–174. doi:10.1016/j.chemgeo.2016.06.008
Keywords: litter decomposition, trace elements, rare earth elements, Scots pine, Norway spruce, coniferous forest, element dynamics
Citation: Gautam MK, Berg B, Lee K-S, Nilsson T and Shin HS (2023) Dynamics of trace and rare earth elements during long-term (over 4 years) decomposition in Scots pine and Norway spruce forest stands, Southern Sweden. Front. Environ. Sci. 11:1190370. doi: 10.3389/fenvs.2023.1190370
Received: 20 March 2023; Accepted: 29 June 2023;
Published: 17 July 2023.
Edited by:
Moritz Bigalke, Darmstadt University of Technology, GermanyReviewed by:
Anna De Marco, University of Naples Federico II, ItalyFuzhong Wu, Sichuan Agricultural University, China
Alexis De Junet, Université de Lorraine, France
Copyright © 2023 Gautam, Berg, Lee, Nilsson and Shin. This is an open-access article distributed under the terms of the Creative Commons Attribution License (CC BY). The use, distribution or reproduction in other forums is permitted, provided the original author(s) and the copyright owner(s) are credited and that the original publication in this journal is cited, in accordance with accepted academic practice. No use, distribution or reproduction is permitted which does not comply with these terms.
*Correspondence: Mukesh K. Gautam, bXVrZXNoY3JpY0BnbWFpbC5jb20=; Björn Berg, YmIwNzA4MjEyNDI0QGdtYWlsLmNvbQ==
†These authors have contributed equally to this work and share first authorship