 Huan Wang
 Yilong Feng1,3
- 1Chongqing Landscape and Gardening Research Institute, Chongqing, China
- 2College of Horticulture and Landscape Architecture, Southwest University, Chongqing, China
- 3Chongqing Key Laboratory of Germplasm Innovation and Utilization of Native Plants, Chongqing, China
To understand the development progress and relevant Frontier research of urban green space carbon sequestration, based on the core databases such as Web of Science, CiteSpace software, and bibliometric analysis methods were used to analyze the research status. The results showed that the number of papers on urban green space carbon sequestration research was on the rise. China and the United States had closer cooperation from the perspective of international cooperation institutions. Peking University, the Chinese Academy of Sciences, and the US Forest Service made the greatest contributions to this research field. Analyzing the keywords and the literature co-citation map, it was inferred that the hot keywords of future urban green space carbon sequestration research include carbon sequestration, ecosystem services, and climate change. It was found that carbon sequestration of urban green space ecosystems research primarily focuses on the correlation between urban green space and ecosystem services, and UGS carbon sequestration accounting and urban green space management. Finally, two perspectives were proposed: 1) Urban green spaces diversified ecological benefits are achieved through the function of carbon sequestration, and 2) Urban green space carbon sequestration accounting and urban green space management promote the development of urban green space. An overview of the international progress and basic state of urban green spaces and carbon sequestration theme research is presented in this paper, Additionally, it provides valuable references for future research and helps gain a comprehensive understanding of this field of research.
1 Introduction
Urbanization was a necessary process of societal civilization and development. It was estimated that the global urbanization level will exceed 60% by 2030 (United Nations, 2018). With the continuous progress of urbanization worldwide, how to effectively reduce urban carbon emissions and increase carbon sequestration has become a key issue related to the effectiveness of the Carbon Peak and Carbon Neutrality strategy. The carbon storage and sequestration of urban vegetation (including urban forests and green space) has received significant attention in recent years (Adetoye et al., 2018; Yao et al., 2018). Photosynthesis fixes carbon dioxide (CO2) and stores it in biomass, making vegetation (trees, shrubs, and grasses) a carbon dioxide sink (CO2). A large amount of carbon has been sequestered and stored by vegetation in urban areas (Hutyra et al., 2011; Lal and Augustine, 2012). The urban green space ecosystem plays an important role in carbon sequestration and carbon sinks. In terms of carbon sequestration, although the urban green space area only accounts for a part of the urban ecosystem, it plays a positive role in the carbon balance of urban and global ecosystems (Zhu et al., 2019). Currently, the research on carbon sequestration was mainly concentrated in the fields of forests, grasslands, and wetlands within large regions (Miyauchi et al., 2019); however, the research on carbon sequestration of urban green spaces has also made great progress in recent years (Zhu et al., 2018; Delgado-Baquerizo et al., 2021). The macro and micro scale changes of urban green spaces are complex due to the increasing importance of the carbon sequestration function of urban green spaces and the increasing breadth and depth of research. Currently, there are few reports on the development, transformation, evolution, and other comprehensive analysis of urban green space ecosystem research hotspots in the world.
The bibliometric method was used to analyze the development process of the discipline, the evolution of research hotspots, the distribution of research forces, and the proposed direction of the discipline’s development (Guo et al., 2019). With the explosion of several of documents in various disciplines, bibliometrics has become an important method for studying the development of various disciplines (Rodrigues Sousa et al., 2020; Yang et al., 2020). CiteSpace software, developed by Dr. Chen Chaomei, can be used for analysis, mining, and visual analysis of scientific and technological papers (Chen, 2004; Chen and Song, 2019). It has a strong function in document metrology statistics as well as knowledge map visualization and has become the most popular document metrology tool. The research on carbon sequestration of urban green space ecosystems has developed into a multi-disciplinary and multi-directional background. Using this software to carry out international (based on Web of Science) literature metrology and visual analysis of the research direction of the carbon sequestration function of urban green spaces researchers can better explore the hot spots of the research on carbon sequestration function ecology of urban green space ecosystems.
2 Materials and methods
2.1 Collection data
To comprehensively and chronologically reflect the research progress of the carbon sequestration function of urban green space ecosystems in the world, the internationally recognized authoritative database was used as the data source, namely, SCI-E (science citation index expanded) of the core collection TM of Web of Science. The retrieval method is as follows: TS=(“urban green space *” or “urban green land *” or “urban green infrastructure *” or “urban park *”) and “carbon sequestration” or “carbon dioxide sequestration *”); Document type: “article” or “review”; Period: 1900-2022 (retrieval time: 10 May 2023). Finally, after screening and analyzing the articles according to the title, abstract, and keywords, 723 valid papers were obtained.
2.2 Analysis methods
This paper analyzed and visualized the number of papers published, keywords, author groups, publishing institutions, publishing journals, highly cited authors, and papers on the carbon sequestration research of urban green space ecosystems, and analyzed them with the help of CiteSpace 6.1 R6.
3 Results
3.1 Number of published papers
Compared with the carbon sequestration of forest ecosystems, the international research on carbon sequestration of urban green space ecosystems started late. In 2001 this field of research began to have relevant literature reports, while the study of forest carbon reserves appeared in the 1990s. The first international published literature was a research paper entitled “Carbon sinks and human freshwater dependence in Stockholm County” published in the Ecological Economics journal. Jansson et al. estimated the ecosystem areas required for accumulating the total emissions of CO2 by the Stockholmer population. The paper accumulated the CO2 emissions of the population in the County. The authors discussed the usefulness and limitations of their approach in relation to focusing on people’s dependence on functioning ecosystems for ecosystem service generation and in structuring guidelines for the management of these ecosystems (Jansson and Nohrstedt, 2001). From the time change in the number of papers issued, the international research on the carbon sequestration of urban green space ecosystems can be roughly divided into three stages: 1) Stage I the initial stage (2001-2010) where the research on the carbon sequestration of urban green space ecosystems was scarce. This was the result of the human understanding of carbon sequestration function of urban green space ecosystems being in its infancy. The research on carbon sequestration was mainly focused on forest, grassland, and wetlands within large regions. 2) Stage II (2011-2020). The research showed a slow upward trend. After the 20th century, the ecological function of the urban green space ecosystem had been recognized, and the research on the carbon sequestration function of the urban green space ecosystems was rapidly developed. 3) Stage III (2021-2022) was a period of rapid growth, where the growth rate of the literature was more than three times higher than the previous stage. After 20 years of development, the research on the carbon sequestration function of international urban green space ecosystems was still in the developmental stage. The total number of research papers published on urban green space carbon sequestration in various countries from high to low are as follows: China (226), United States (196), United Kingdom (55), Germany (41), Australia (41), Italy (39), Canada (38), South Korea (33), Finland (27) and France (26) (Figure 1). China and the United States accounted for 31.25% and 27.11% of the global total of publications, respectively, with both countries having significantly more publication than other countries. China’s first SCI paper on urban green space carbon sink research was a publication titled “Using a set of strategic indicator systems as a decision-making support implementation for establishing a recycling-oriented society—a Taiwan case study” published by Chang I C in the journal of Environmental Science and Pollution Research in 2005 (Chang et al., 2005). Since 2011, the number of published papers in China has fluctuated; however, is on the rise. In 2022, the maximum number of annual papers in the SCI database reached 44. A comprehensive understanding of the relationship between urbanization and induced carbon emissions is essential (Shi et al., 2019). Over the past few decades, China’s rapid economic development has led to soaring energy consumption and intensive CO2 (Wang et al., 2014). As a result, studies related to carbon sequestration in urban green spaces are rapidly and continuously increasing in China.
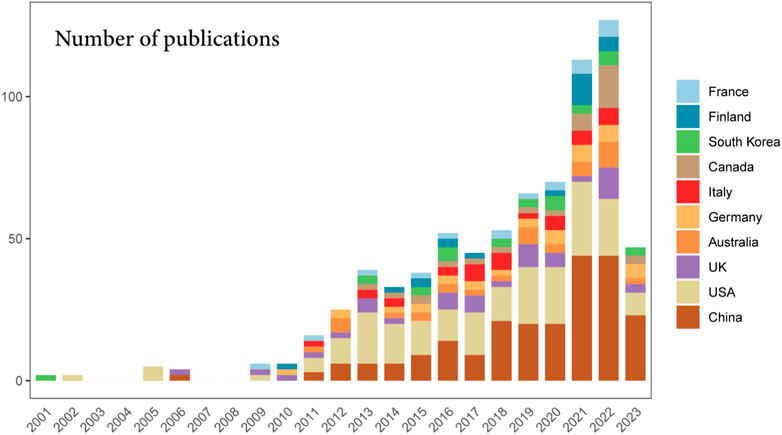
FIGURE 1. Dynamics in the number of publications of the top 10 countries.
3.2 Country collaboration network
The number of international papers on cooperation reflects the status and effectiveness of scientific and technological cooperation between different countries/regions (Edwards-Schachter et al., 2011). In this paper, the data files retrieved from the core collection database of Web of Science are imported into the bibliometric analysis platform (https://bibliometric.com/results.html, accessed time: 10 May 2023) to generate the scientific and technological cooperation between countries network map (Figure 2). A total of 73 countries in the world have participated in research surrounding the carbon sequestration of urban green space ecosystems. In terms of international cooperation, the cooperation between the United States and China was closer than that between other countries, followed by the United Kingdom and China. The data demonstrates that China and the United States attach great importance and heavily invest in carbon sequestration of urban green space research. From the number of SCI papers and the cooperation between countries, we can see that China, the United States, and the developed countries in Europe occupy important positions, thus, having a significant influence on urban green space carbon sequestration research. In general, African and developing countries account for relatively few. The study found that countries with stronger collaborative relationships have a higher number of publications. The United States, for example, has an extensive network of international collaborations and a high publication record. International cooperation has a certain regionalism (Zhu et al., 2021), and in this study it is clear that European countries tend to cooperate with the United States and Asian countries tend to cooperate within Asia.
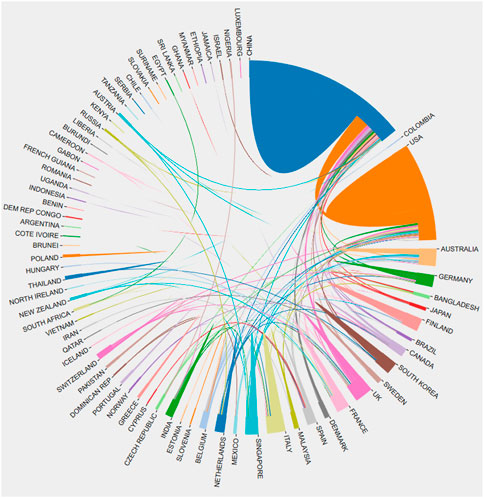
FIGURE 2. National cooperation network.
3.3 Analysis of research institution
CiteSpace software was used to generate statistics on the top 10 scientific research institutions according to their number of documents and centrality (Table 1). Among the top 10 institutions with the largest share of international publications, China 5), followed by the United States 2), Sigapore 1), Finland 1), and Denmark 1). Among the top three research institutions, the Chinese Academy of Sciences ranks first with 132 papers, Peking University ranks second with 39 papers, and United States Forest Service ranks third with 23 papers. From the number of papers published, Chinese research institutions have made great contributions to the field of urban green space ecosystem carbon sequestration research. In terms of the centrality (Means intermediary centrality, a measure of the importance of a node in the network) of the issuing institutions, the top three are Peking University (0.25), Chinese Academy of Sciences (0.11), and Beijing University of Civil Engineering and Architecture (0.11). Among the top 10 centers, China has 6 institutions, the United States has 2 institutions, and Denmark has 2 institutions. In terms of the number and centrality of papers, Chinese research institutions have made significant contributions. The study areas of these studies are all located in Beijing, the capital of China. As the economic and cultural center of the country, the balance between socio-economic development and environmental issues in Beijing has been a hot issue of concern (Fujii et al., 2016; Xu S. et al., 2017).
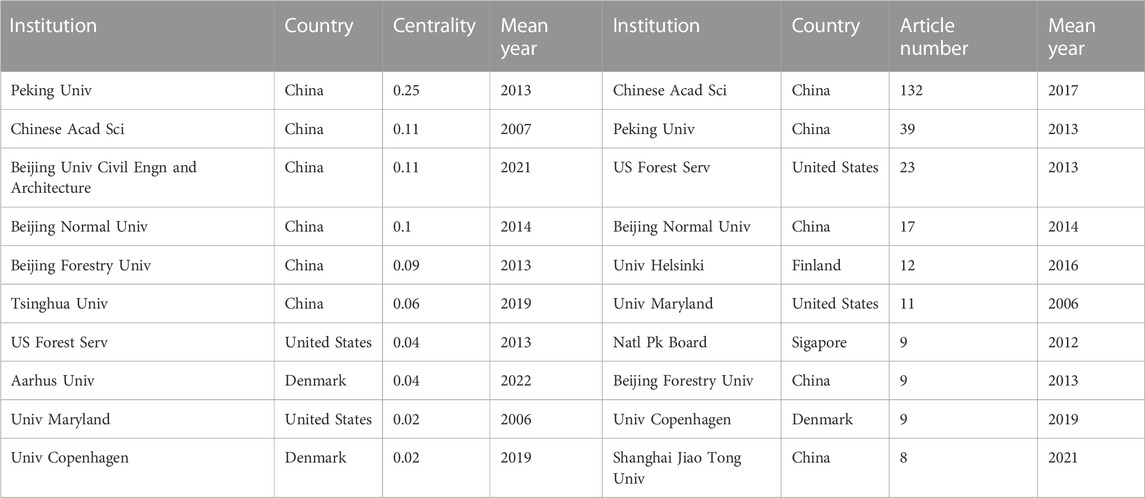
TABLE 1. Top 10 research institutions in article number and centrality published.
3.4 Analysis of journal influence
The cited frequency of a journal represents its academic influence (Zhang et al., 2022). This paper comprehensively evaluated the influence of publishing journals by combining the three indicators that include: the number of published papers, the total number of citations, and the average number of citations (Table 2). In terms of article number, the top three journals in the world are Urban Forest and Urban Greening, Sustainability, and Science of the Total Environment. In terms of the total number of citations, the top three journals in the world are Landscape and Urban Planning, Urban Forestry and Urban Greening, and Journal of Environmental Quality. In terms of the average number of citations, the top three journals in the world are Ambio, Journal of Environmental quality, and Ecological Applications. From the ranking of the three indicators of the number of publications, the total number of citations, and the average number of citations, the journals sponsored by China have not been listed, and this indicates that the international influence and recognition of Chinese journals need to be improved. The reason may be related to the Chinese scientific research evaluation system and the incentive mechanism. At present, Chinese science and technology journals are mainly evaluated by foreign SCI and other evaluation systems (Zhao and Hu, 2020). Compared to other developed countries, China’s international scientific journals were founded later and have lower international influence. China’s research evaluation system encourages scientists to submit to international high-level SCI journals, and the development of journals founded in China has been somewhat affected (Lu and Xue, 2019).
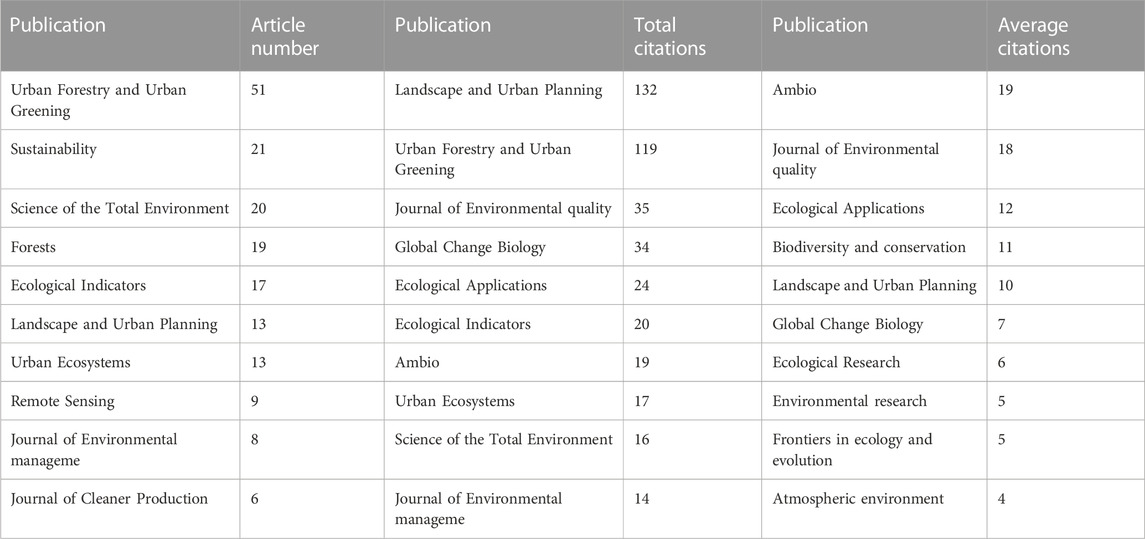
TABLE 2. Top 10 publications by article number, total citation, and average citations.
3.5 Research hotspot analysis
3.5.1 Core keywords and analysis
During the keyword co-occurrence analysis, two terms appeared in the same paper and are further analyzed for their co-occurrence relationship. Keyword analysis reflects the Frontier hotspots and main research contents of research topics within the research field (Zhao et al., 2016). Using the co-occurrence analysis of keywords hot topics can be identified in a given field. The higher the frequency, the stronger the relationship between the keywords (Ren et al., 2021). The co-occurrence map of keywords is shown in Figure 3. There were 102 nodes (i.e., 102 critical keywords) and 163 links (density = 0.0315).
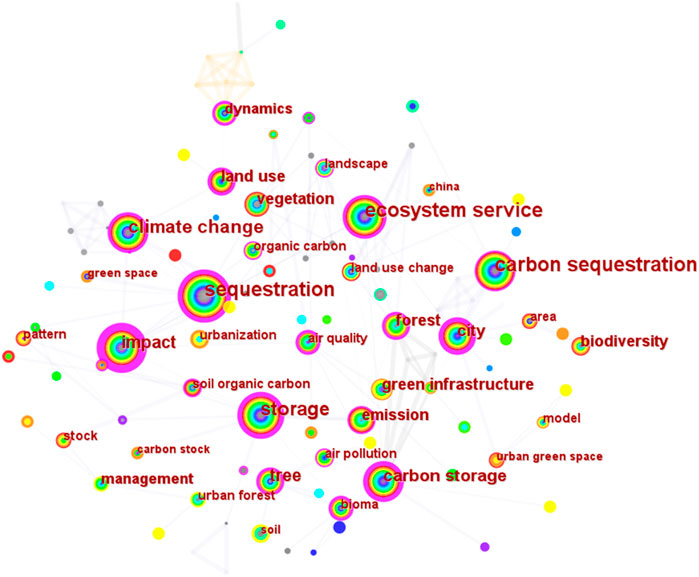
FIGURE 3. Keywords co-occurrence network.
Figure 3 shows the frequency node as a circle, and as the frequency increases, the circle becomes larger. Purple nodes indicate the highest betweenness centrality. In terms of betweenness centrality, “impact” had the highest value of 0.96. In terms of keyword frequency, “sequestration” had the highest number of 127. Moreover, in Table 3, the top 20 keywords were extracted and ranked by betweenness centrality and count number, indicating that research has focused on these fields. According to Table 3 and Figure 3, we can see that the keywords primarily encompassed 3 research objects: 1) ecosystem services of UGS, such as green space, ecosystem service, temperature, area, and natural environment; 2) Different health behaviors and outcomes of humans, such as physical activity, walking, and human and mental health; 3) The UGS and ecology restoration, e.g., vegetation, biodiversity, restoration, and built environment.
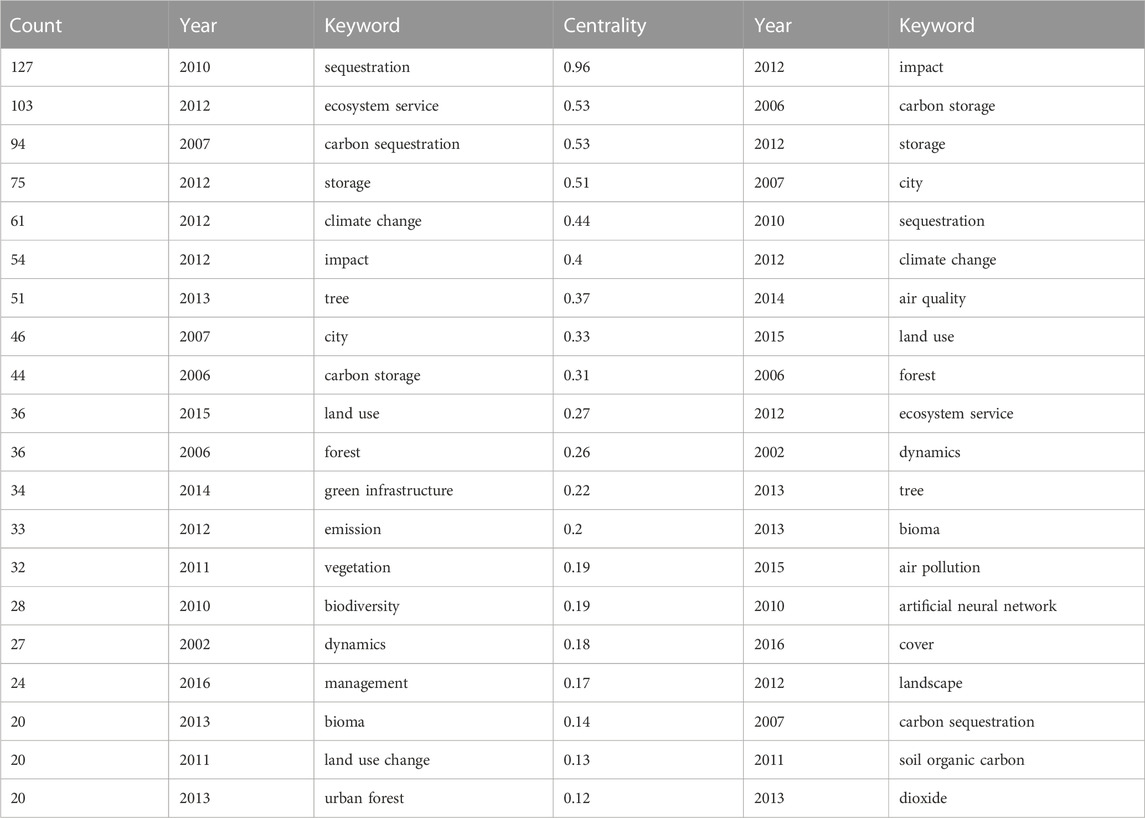
TABLE 3. Top 20 keywords ranked by the frequency and the betweenness centrality value.
3.5.2 Literature co-citation analysis
The development process of basic research can be better reflected by the topic clustering of the cited documents. Through the cited documents analysis, a map with 236 nodes, 616 connections, and a network density of 0.0222 was obtained (Figure 4). The LLR algorithm (log-likelihood rate, (one of the clustering label word extraction algorithms, the larger the LLR the more representative the word is for this cluster) was selected to cluster the literature. There are 10 co-clusters, including “# 0 soil organic carbon,” “ # 1 ecosystem service” “# 2 urban forest,” and so on.
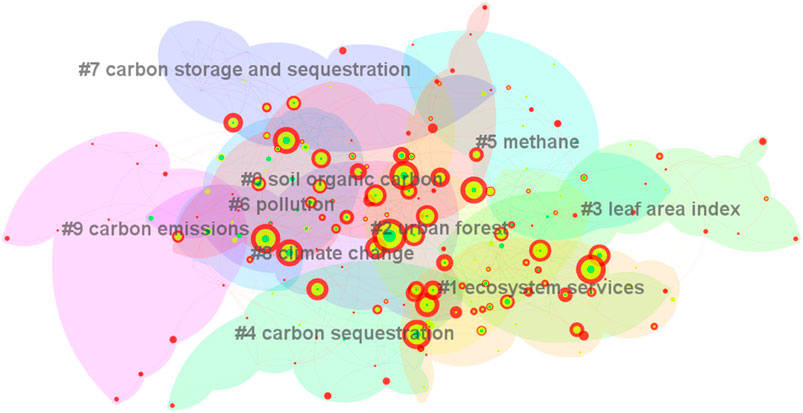
FIGURE 4. Co-citation map of the international literature from 2001 to 2022.
The detailed cluster analysis results are shown in Table 4, which lists the detailed information of the co-cited clusters: for example, the first cluster “# 0 soil organic carbon” primarily includes the keywords such as “loess plateau, vegetation restoration, ecological restoration” in the co-cited articles. The results of the cluster analysis show that the current research field of urban green space carbon sequestration of the world mainly focuses on urban ecosystem services, urban planning, temperature regulation, urban carbon emissions, and other ecological aspects.
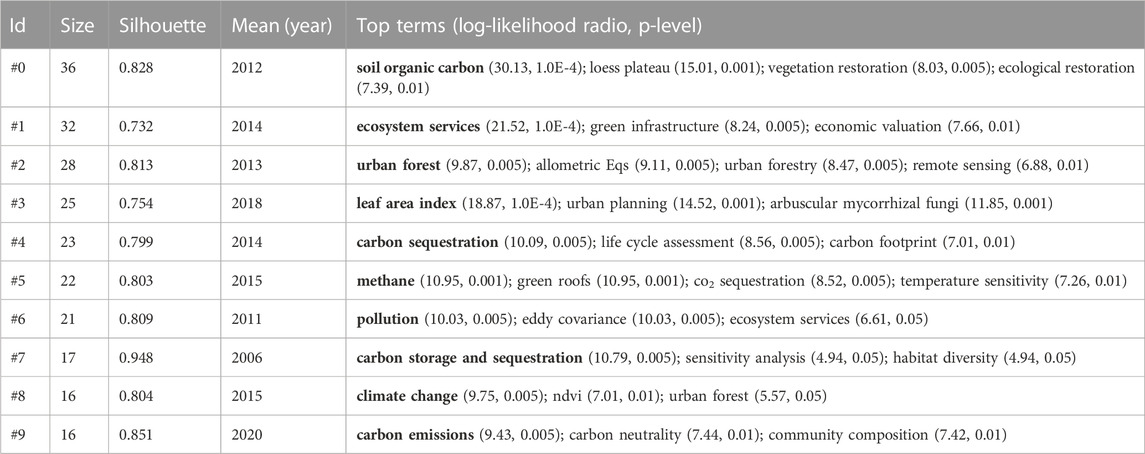
TABLE 4. Summary of 10 clusters.
3.5.3 Research frontiers analysis
With burst detection, nodes with large frequency changes can be captured. Using mutation information for cutting-edge analysis reflects the rise of a research theme. A burst detection of keywords map was achieved and the top 10 keywords were extracted (Figure 5). As mentioned above, “carbon dioxide” is the first key term that is confirmed again here. With “ecosystem” having the strongest strength of citation bursts (5.67), and its influence lasted from 2011 to 2013. However, no important keywords with strong citation bursts were added after 2019. Furthermore, the top 10 keywords with the strongest citation burst also reflect the research frontiers related to carbon sequestration of UGS including the scopes and objects (e.g., carbon dioxide, ecosystem, urban forestry, soil carbon, and system), and the routes (e.g., carbon footprint, co2 sequestration, green roof and street tree).
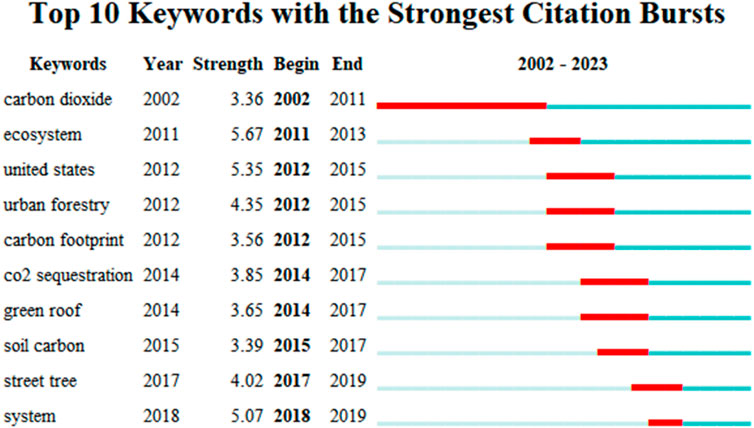
FIGURE 5. Top 20 keywords with strongest citation bursts.
4 Discussion
Reviewing previous studies and forecasting future development directions was made easier by knowing the knowledge maps. Many researchers around the world currently use CiteSpace, a tool that helps create knowledge maps in many fields such as agriculture (Ouyang et al., 2018), food science (Sun et al., 2019; Ren et al., 2021), technology (Gandia et al., 2019; Zhong et al., 2019), planning (Sheikhnejad and Yigitcanlar, 2020; Zhang et al., 2020), tourism (Li et al., 2021), energies (Vardiambasis et al., 2020; Li et al., 2022), medicine (Alvarez-Peregrina et al., 2021; Sánchez-Tena et al., 2021), health (Xu X. et al., 2017; Nascimento et al., 2020), and ecology (Bilias et al., 2021). The carbon sequestration function of UGS has a different emphasis because of the different development stages in each country. A visual analysis of the literature can help us see the differences more clearly.
4.1 Urban green space imparts its diversified ecological benefits through the function of carbon sequestration
“Ecological benefit” refers to the beneficial influence and effect of nature on human production, living conditions, and environmental conditions (Pérez-González et al., 2021). The concept of ecosystem services is the interaction between human beings and the environment through a series of combinations of biological diversity and non-biological elements, thus, linking biological processes and functions (Semeraro et al., 2021). The relationship between urban form and measures of environmental quality and biodiversity potential can affect the ecological performance of the urban environment (Jamie et al., 2007). With the acceleration of urbanization and the change in urban climate and environment, the focus of urban green space research has shifted to an in-depth discussion of the solutions to urban ecological environment problems, and has made major breakthroughs in alleviating the urban heat island effect, protecting biodiversity, and mitigating rain and flood disasters (Bowler et al., 2010). Human wellbeing has been studied extensively concerning ecological benefits of urban green land. The benefits of green space for people’s health and wellbeing can be viewed as a positive correlation (Cohen et al., 2007; Tzoulas et al., 2007), in physical and mental health (Maas et al., 2006; Sugiyama et al., 2008). Pollution will change the phosphorus, carbon, and nitrogen in the ecological stoichiometry of terrestrial plants, affecting vegetation productivity, nutrient utilization rates, and carbon sequestration capacity (Hou et al., 2022). In recent years, relevant research tends to comprehensively explore the relationship between urban green space, the ecological environment, and the overall health benefits of resident use (Wolch et al., 2014). Studying urban green space, even small urban green space promotes ecosystem services in the urban landscape. For example, the increase in local vegetation density and leaf area was related to higher levels of ecosystem service provision in urban areas, such as air pollutant capture, carbon storage, and heat mitigation. Urban habitats with higher vegetation coverage and density provide more carbon storage and bring greater heat island mitigation benefits to residents (Davwas et al., 2016).
The focus of carbon sequestration in urban green spaces is to strengthen the construction and protection of urban ecology and green space, such as the construction of carbon sequestration in urban green spaces that include planting trees and grass (Yang et al., 2022). To maximize the carbon sequestration of urban green space, it is necessary to optimize the urban green space’s ecosystem layout, species allocation, and ecosystem management (Fang, 2021). In the study of carbon sequestration of urban green space, screening of high-capacity carbon sequestration vegetation was helpful for the construction of carbon sequestration. Some studies have screened out pioneer plants such as mold morifolium, cane grass, and wild grass, which have high carbon sequestration capacity under a low nitrogen demand and can gradually increase vegetation coverage in exposed areas (He, 2015). However, a problem that was easily ignored was the role of vegetation with high carbon fixation capacities. Hua et al., 2022 study shows, the carbon sequestration production efficiency of artificial forests was higher than that of natural forests; however, was not as effective as natural forests in carbon sequestration, soil conservation, water storage, and biodiversity protection (Hua et al., 2022). Biodiversity was closely related to community stability. Greenbelt communities with high carbon sequestration and low biodiversity may have worse carbon sequestration performance under extreme climate conditions, or even a reverse effect (Gatti et al., 2021). Some studies have also confirmed that carbon sequestration was positively correlated with tree species richness. The proportion of native trees in green spaces indicates that the biodiversity goal of increasing tree diversity provides carbon sequestration benefits (Belaire et al., 2022). Therefore, attention should be paid to biodiversity when constructing or researching the carbon sequestration of urban green space.
4.2 Urban green space carbon sequestration accounting and management
With the evolution of urban green space development stages and the emergence of new technologies, research on green space management and maintenance modes and methods as well as the evolution of green space spatial patterns has increased rapidly (Jansson and Lindgren, 2012; Nurbaya et al., 2016). The relationship between urbanization, urban green space, and the carbon cycle has attracted significant attention in recent years. Environmental managers need to design and manage urban ecosystems in a way that enhances the stability of green space and the harmony between humans and nature (McPhearson et al., 2016). Urbanization constitutes an important process of land use and land cover change, which has an impact on both land and wetland carbon pools. Large and concentrated carbon fluxes as well as rapid changes in carbon pools make cities a large and dynamic element of the global carbon cycle (Hutyra et al., 2014). Previous studies have focused on determining the characteristics of carbon sources or sink at the regional and global scales, while there are few studies at the local and urban scales, due to the mixing of anthropogenic and natural fluxes being more complex and difficult to observe independently (Hutyra et al., 2014). In the past two decades, the research and assessment of ecosystem services through remote sensing has increased significantly. The development of satellite image technology has improved its space, spectrum, radiation, and time resolution, enabling spatial-temporal observations as well as the classification and monitoring of the vegetation on the land surface (Angélica et al., 2022). Urban green space vegetation was more heterogeneous than natural forests. The growth environment also showed significant differences. Therefore, it was necessary to optimize the investigation methods applicable to the characteristics of urban green space carbon sequestration research.
There are few studies on carbon sequestration accounting methods specifically for urban green space, with most of the research methods being optimized by the forest, grassland, and wetland carbon sequestration accounting methods. The biomass method was mainly used to indirectly calculate carbon sequestration based on the change in plant biomass, which is currently the most commonly used method to calculate carbon storage (Xiao et al., 2022). The development of the model accounting method of urban green space carbon sequestration capacity was based on the leaf area index equation (Ren et al., 2018). The carbon footprint method can also be used for statistical analysis of the carbon sequestration capacity of urban green space (Xiao et al., 2022). The vorticity correlation method uses the principle of micrometeorology to monitor CO2 concentrations, wind speed, and direction at a certain height above the forest land to obtain the amount of CO2 fixed or released by the ecosystem (Valentini et al., 2000). The combination of geographic information systems (GIS) and remote sensing (RS) allowed for information spatial analysis integration. The remote sensing model simulation method was mainly used to obtain vegetation growth state parameters using remote sensing technology and information systems. The combination of the two combined with ground survey analysis was used to obtain the forest biomass. For example, the three-dimensional green volume of the city can be obtained by using satellite aerial photographs and computer simulation (Kong et al., 2007). The calculation of carbon sequestration capacity based on professional software has also been widely used, such as i-Tree, CITY-green, and other software (Yao et al., 2022).
5 Conclusion
(1) The number of papers published on urban green space carbon sequestration research is on the rise, with a total of 723 papers (including 226 in China) from 2001 to 2023, and has increased significantly in recent years. The number of papers published in China and the influence of published journals was high. From the perspective of international cooperation institutions, the cooperation between China and the United States is similar. Peking University, the Chinese Academy of Sciences, and United States Forest Service have contributed the most to this research field. Major international journals include Urban Forest and Urban Greening, Landscape and Urban Planning, and Ambio.
(2) Through the analysis of keywords and the literature co-cited atlas, it was inferred that the hot keywords include carbon sequestration, ecosystem services, and climate change. The research hotspots of urban green space ecosystem carbon sequestration primarily focus on the urban green space ecological benefit evaluations, urban green space climate regulation, biodiversity protection functions, and the biogeochemical cycle of urban green space ecosystems.
(3) Urban green space imparts its diversified ecological benefits through the function of carbon sequestration. The utilization of new technologies has optimized the carbon sequestration accounting methods of urban green spaces, such as remote sensing, The vorticity correlation method, and satellite image technology, which also further promote the research of urban green space carbon sequestration. Urban management and maintenance models based on the perspective of carbon sequestration in urban green areas have been emphasized and developed.
Author contributions
Conceptualization, LA and YF; methodology, HW; software, HW, validation, HW, YF and LA, formal analysis, HW, investigation, HW, resources, HW, data curation, LA, writing—original draft preparation, HW, writing—review and editing, YF, visualization, HW, supervision, HW, project administration, LA, funding acquisition, LA. All authors have read and agreed to the published version of the manuscript.
Funding
This research was funded by the Performance Incentive and Guidance Special Project for Chongqing Scientific Research Institutes (No.cstc2022jxjl20010, No.cstc2022jxjl80005), the Postdoctoral Science Foundation of Chongqing Natural Science Foundation (No. CSTB2022NSCQ-BHX0740), the Scientific research project of Chongqing City Administration Bureau ( No. CGK 2022-19), and The APC was funded by Performance Incentive and Guidance Special Project for Chongqing Scientific Research Institutes.
Acknowledgments
The authors would like to thank the reviewers and the editor whose suggestions greatly improved the manuscript. The authors thank AiMi Academic Services (www.aimieditor.com) for English language editing and review services. Thanks to Qiaoyong Zhang, Min Zou, and Ting Li for their help in revising the thesis.
Conflict of interest
The authors declare that the research was conducted in the absence of any commercial or financial relationships that could be construed as a potential conflict of interest.
Publisher’s note
All claims expressed in this article are solely those of the authors and do not necessarily represent those of their affiliated organizations, or those of the publisher, the editors and the reviewers. Any product that may be evaluated in this article, or claim that may be made by its manufacturer, is not guaranteed or endorsed by the publisher.
References
Adetoye, A. M., Okojie, L. O., and Akerele, D. (2018). Forest carbon sequestration supply function for African countries: An econometric modelling approach. For. Policy Econ. 90, 59–66. doi:10.1016/j.forpol.2018.01.007
Alvarez-Peregrina, C., Martinez-Perez, C., Villa-Collar, C., and Sánchez-Tena, M. Á. (2021). A bibliometric and citation network analysis of myopia genetics. Genes 12, 447. doi:10.3390/genes12030447
Angélica, G. P. K., David, M. R., Dominguez-Amarillo, S., and Roberto, G. C. J. (2022). Remote sensing for the assessment of ecosystem services provided by urban vegetation. A review of the methods applied. Urban For Urban Green, 127636.
Belaire, J. A., Higgins, C., Zoll, D., Lieberknecht, K., Bixler, R. P., Neff, J. L., et al. (2022). Fine-scale monitoring and mapping of biodiversity and ecosystem services reveals multiple synergies and few tradeoffs in urban green space management. Sci. Total Environ. 849, 157801. doi:10.1016/j.scitotenv.2022.157801
Bilias, F., Nikoli, T., Kalderis, D., and Gasparatos, D. (2021). Towards a soil remediation strategy using biochar: Effects on soil chemical properties and bioavailability of potentially toxic elements. Toxics 9, 184. doi:10.3390/toxics9080184
Bowler, D. E., Buyung-Ali, L., Knight, T. M., and Pullin, A. S. (2010). Urban greening to cool towns and cities: A systematic review of the empirical evidence. Landsc. Urban Plan. 97, 147–155. doi:10.1016/j.landurbplan.2010.05.006
Chang, I. C., Lu, L. T., and Lin, S. S. (2005). Using a set of strategic indicator systems as a decision-making support implement for establishing a recycling-oriented society - a Taiwanese case study (16 pp). Environ. Sci. Pollut. Res. 12, 96–108. doi:10.1065/espr2004.12.226
Chen, C. (2004). Searching for intellectual turning points: Progressive knowledge domain visualization. Proc. Natl. Acad. Sci. 101, 5303–5310.
Chen, C., and Song, M. (2019). Visualizing a field of research: A methodology of systematic scientometric reviews. PLoS One 14, e0223994. doi:10.1371/journal.pone.0223994
Cohen, D. A., McKenzie, T. L., Sehgal, A., Williamson, S., Golinelli, D., and Lurie, N. (2007). Contribution of public parks to physical activity. Am. J. Public Health. 97, 509–514. doi:10.2105/ajph.2005.072447
Davwas, A. Y., Jung, J., Pijanowski, B. C., and Minor, E. S. (2016). Combined vegetation volume and “greenness” affect urban air temperature. Appl. Geogr. 71, 106–114. doi:10.1016/j.apgeog.2016.04.010
Delgado-Baquerizo, M., Eldridge, D. J., Liu, Y. R., Sokoya, B., Wang, J. T., Hu, H. W., et al. (2021). Global homogenization of the structure and function in the soil microbiome of urban greenspaces. Sci. Adv. 7, eabg5809. doi:10.1126/sciadv.abg5809
Edwards-Schachter, M., Castro-Martínez, E., and Fernández-de-Lucio, I. (2011). International co-operation between firms on innovation and R&D: Empirical evidence from Argentina and Spain. J. Technol. Manag. innovation 6, 126–147. doi:10.4067/s0718-27242011000300010
Fang, J. Y. (2021). Ecological perspectives of carbon neutrality. Chin. J. Plant Ecol. 45, 1173–1176. doi:10.17521/cjpe.2021.0394
Fujii, M., Fujita, T., Dong, L., Lu, C., Geng, Y., Behera, S. K., et al. (2016). Possibility of developing low-carbon industries through urban symbiosis in Asian cities. J. Clean. Prod. 114, 376–386. doi:10.1016/j.jclepro.2015.04.027
Gandia, R. M., Antonialli, F., Cavazza, B. H., Neto, A. M., Lima, D. A., Sugano, J. Y., et al. (2019). Autonomous vehicles: Scientometric and bibliometric review. Transp. Rev. 39, 9–28. doi:10.1080/01441647.2018.1518937
Gatti, L. V., Basso, L. S., Miller, J. B., Gloor, M., Gatti Domingues, L., Cassol, H. L., et al. (2021). Amazonia as a carbon source linked to deforestation and climate change. Nature 595, 388–393. doi:10.1038/s41586-021-03629-6
Guo, R., Wu, T., Liu, M., Huang, M., Stendardo, L., and Zhang, Y. (2019). The construction and optimization of ecological security pattern in the Harbin-Changchun urban agglomeration, China. Int. J. Environ. Res. Public Health. 16, 1190. doi:10.3390/ijerph16071190
He, F. (2015). Characteristics of phosphorus loss and the controlling strategy for vegetation restoration in phosphorus enriched area in Lake Dianchi watershed. China [D]: Yunnan University of China.
Hou, X., Wu, X., Ma, C., Tian, D., Yan, Z., and Li, P. (2022). Effect of the elevated ozone on greening tree species of urban: Alterations in CNP stoichiometry and nutrient stock allocation to leaves and fine roots. Urban For Urban Green 76, 127735. doi:10.1016/j.ufug.2022.127735
Hua, F., Bruijnzeel, L. A., Meli, P., Martin, P. A., Zhang, J., Nakagawa, S., et al. (2022). The biodiversity and ecosystem service contributions and trade-offs of forest restoration approaches. Science 376, 839–844. doi:10.1126/science.abl4649
Hutyra, L. R., Duren, R., Gurney, K. R., Grimm, N., Kort, E. A., Larson, E., et al. (2014). Urbanization and the carbon cycle: Current capabilities and research outlook from the natural sciences perspective. Earth's Future. 2, 473–495. doi:10.1002/2014ef000255
Hutyra, L. R., Yoon, B., and Alberti, M. (2011). Terrestrial carbon stocks across a gradient of urbanization: A study of the seattle, WA region. Glob. Change Biol. 17, 783–797. doi:10.1111/j.1365-2486.2010.02238.x
Jamie, T., Richard, A. F., PhilipWarrenDavies, H. R. G. K. J. G., and Gaston, K. J. (2007). Urban form, biodiversity potential and ecosystem services. Landsc. Urban Plan. 83 (4), 308–317. doi:10.1016/j.landurbplan.2007.05.003
Jansson, A., and Nohrstedt, P. (2001). Carbon sinks and human freshwater dependence in Stockholm County. Ecol. Econ. 39 (3), 361–370. doi:10.1016/s0921-8009(01)00224-5
Jansson, M., and Lindgren, T. (2012). A review of the concept ‘management’ in relation to urban landscapes and green spaces: Toward a holistic understanding. Urban For Urban Green 11, 139–145. doi:10.1016/j.ufug.2012.01.004
Kong, F., Yin, H., and Nakagoshi, N. (2007). Using GIS and landscape metrics in the hedonic price modeling of the amenity value of urban green space: A case study in jinan city, China. Landsc. Urban Plan. 79, 240–252. doi:10.1016/j.landurbplan.2006.02.013
Lal, R., and Augustine, B. (2012). Carbon sequestration in urban ecosystems. New York: Springer, 385.
Li, B., Xu, D., Feng, L., Liu, Y., and Zhang, L. (2022). Advances and prospects on the aquatic plant coupled with sediment microbial fuel cell system. Environ. Pollut. 297, 118771. doi:10.1016/j.envpol.2021.118771
Li, J., Weng, G., Pan, Y., Li, C., and Wang, N. (2021). A scientometric review of tourism carrying capacity research: Cooperation, hotspots, and prospect. J. Clean. Prod. 325, 129278. doi:10.1016/j.jclepro.2021.129278
Lu, L. Y., and Xue, W. (2019). Scientific research in local universities:reconstruction of external evaluation system and reform of internal incentive mechanism. China University Science and Technology (Chinese, 46–50.04
Maas, J., Verheij, R. A., Groenewegen, P. P., De Vries, S., and Spreeuwenberg, P. (2006). Green space, urbanity, and health: How strong was the relation? J. Epidemiol. Community Health. 60, 587–592. doi:10.1136/jech.2005.043125
McPhearson, T., Pickett, S. T., Grimm, N. B., Niemelä, J., Alberti, M., Elmqvist, T., et al. (2016). Advancing urban ecology toward a science of cities. BioScience 66, 198–212. doi:10.1093/biosci/biw002
Miyauchi, T., Machimura, T., and Saito, M. (2019). Estimating carbon fixation of plant organs for afforestation monitoring using a process-based ecosystem model and ecophysiological parameter optimization. Ecol. Evol. 9, 8025–8041. doi:10.1002/ece3.5328
Nascimento, H., Martinez-Perez, C., Alvarez-Peregrina, C., and Sánchez-Tena, M. Á. (2020). Citations network analysis of vision and sport. Int. J. Environ. Res. Public Health. 17, 7574. doi:10.3390/ijerph17207574
Nurbaya, A., Zain, A. F., and Djakapermana, R. D. (2016). Study of distribution and slope aspect approach to increase public green open space on special capital region of jakarta using high resolution imagery. Procedia-Social Behav. Sci. 227, 574–582. doi:10.1016/j.sbspro.2016.06.117
Ouyang, W., Wang, Y., Lin, C., He, M., Hao, F., Liu, H., et al. (2018). Heavy metal loss from agricultural watershed to aquatic system: A scientometrics review. Sci. Total Environ. 637, 208–220. doi:10.1016/j.scitotenv.2018.04.434
Pérez-González, A., Jimenez-Vicente, E., Gies-Elterlein, J., Salinero-Lanzarote, A., Yang, Z. Y., Einsle, O., et al. (2021). Specificity of NifEN and VnfEN for the assembly of nitrogenase active site cofactors in Azotobacter vinelandii. Mbio 12, 01568211–e201521. doi:10.1128/mbio.01568-21
Ren, M., Yu, X., Mujumdar, A. S., Yagoub, A. E., Chen, L., and Zhou, C. (2021). Visualizing the knowledge domain of pulsed light technology in the food field: A scientometrics review. Innov. Food Sci. Emerg. Technol. 74, 102823. doi:10.1016/j.ifset.2021.102823
Ren, Z., Du, Y., He, X., Pu, R., Zheng, H., and Hu, H. (2018). Spatiotemporal pattern of urban forest leaf area index in response to rapid urbanization and urban greening. J. For. Res. 29, 785–796. doi:10.1007/s11676-017-0480-x
Rodrigues Sousa, E., Zoni, E., Karkampouna, S., La Manna, F., Gray, P. C., De Menn, M., et al. (2020). A multidisciplinary review of the roles of cripto in the scientific literature through a bibliometric analysis of its biological roles. Cancers 12, 1480. doi:10.3390/cancers12061480
Sánchez-Tena, M. Á., Martinez-Perez, C., Villa-Collar, C., and Alvarez-Peregrina, C. (2021). Impact of COVID-19 at the ocular level: A citation network study. J. Clin. Med. 10, 1340. doi:10.3390/jcm10071340
Semeraro, T., Scarano, A., Buccolieri, R., Santino, A., and Aarrevaara, E. (2021). Planning of urban green spaces: An ecological perspective on human benefits. Land 10, 105. doi:10.3390/land10020105
Sheikhnejad, Y., and Yigitcanlar, T. (2020). Scientific landscape of sustainable urban and rural areas research: A systematic scientometric analysis. Sustainability 12, 1293. doi:10.3390/su12041293
Shi, K., Yu, B., Zhou, Y., Chen, Y., Yang, C., Chen, Z., et al. (2019). Spatiotemporal variations of CO2 emissions and their impact factors in China: A comparative analysis between the provincial and prefectural levels. Appl. Energ 233, 170–181. doi:10.1016/j.apenergy.2018.10.050
Sugiyama, T., Leslie, E., Giles-Corti, B., and Owen, N. (2008). Associations of neighborhood greenness with physical and mental health: Do walking, social coherence and local social interaction explain the relationships? J. Epidemiol. Community Health. 62, e9. doi:10.1136/jech.2007.064287
Sun, Y., Wu, S., and Gong, G. (2019). Trends of research on polycyclic aromatic hydrocarbons in food: A 20-year perspective from 1997 to 2017. Trends Food Sci. Technol. 83, 86–98. doi:10.1016/j.tifs.2018.11.015
Tzoulas, K., Korpela, K., Venn, S., Yli-Pelkonen, V., Kaźmierczak, A., Niemela, J., et al. (2007). Promoting ecosystem and human health in urban areas using green infrastructure: A literature review. Landsc. Urban Plan. 81, 167–178. doi:10.1016/j.landurbplan.2007.02.001
United Nations (2018). File 6: Average annual rate of change of the urban population by region subregion, country and area, 1950–2050 (percent). United Nations: Department of Economic and Social Affairs, Population Division.
Valentini, R., Matteucci, G., Dolman, A., Schulze, E. D., Rebmann, C., Moors, E., et al. (2000). Respiration as the main determinant of carbon balance in European forests. Nature 404, 861–865. doi:10.1038/35009084
Vardiambasis, I. O., Kapetanakis, T. N., Nikolopoulos, C. D., Trang, T. K., Tsubota, T., Keyikoglu, R., et al. (2020). Hydrochars as emerging biofuels: Recent advances and application of artificial neural networks for the prediction of heating values. Energies 13, 4572. doi:10.3390/en13174572
Wang, S. J., Fang, C. L., Ma, H. T., Wang, Y., and Qin, J. (2014). Spatial differences and multi-mechanism of carbon footprint based on GWR model in provincial China. J. Geogr. Sci. 24 (04), 612–630. doi:10.1007/s11442-014-1109-z
Wolch, J. R., Byrne, J., and Newell, J. P. (2014). Urban green space, public health, and environmental justice: The challenge of making cities ‘just green enough. Landsc. Urban Plan. 125, 234–244. doi:10.1016/j.landurbplan.2014.01.017
Xiao, J., Chen, L., Zhang, T., Li, L., Yu, Z., W, R., et al. (2022). Identification of urban green space types and estimation of above-ground biomass using sentinel-1 and sentinel-2 data. Forests 13, 1077. doi:10.3390/f13071077
Xu, S., Shen, W., Long, R., Hong, C., and Chen, H. (2017a). Impact of urbanization on energy related CO2 emission at different development levels: Regional difference in China based on panel estimation. J. Clean. Prod. 14, 1719–1730. doi:10.1016/j.jclepro.2016.08.155
Xu, X., Mwashra, G. D., and Jones, M. (2017b). Mapping the global research landscape and knowledge gaps on multimorbidity: A bibliometric study. J. Glob. Health. 7, 010414. doi:10.7189/jogh.07.010414
Yang, Y., Ma, Y., Chen, L., Liu, Y., and Zhang, Y. (2020). The 100 top-cited systematic Reviews/Meta-analyses on diabetic research. J. Diabetes Res. 2020, 1–7. doi:10.1155/2020/5767582
Yang, Y., Shi, Y., Sun, W., Chang, J., Zhu, J., Chen, L., et al. (2022). Terrestrial carbon sinks in China and around the world and their contribution to carbon neutrality. Sci. China Life Sci. 65, 861–895. doi:10.1007/s11427-021-2045-5
Yao, Y., Piao, S., and Wang, T. (2018). Future biomass carbon sequestration capacity of Chinese forests. Sci. Bull. 63, 1108–1117. doi:10.1016/j.scib.2018.07.015
Yao, Y., Wang, Y., Ni, Z., Chen, S., and Xia, B. (2022). Improving air quality in Guangzhou with urban green infrastructure planning: An i-Tree Eco model study. J. Clean. Prod. 369, 133372. doi:10.1016/j.jclepro.2022.133372
Zhang, D., Xu, J., Zhang, Y., Wang, J., He, S., and Zhou, X. (2020). Study on sustainable urbanization literature based on Web of science, scopus, and China national knowledge infrastructure: A scientometric analysis in CiteSpace. J. Clean. Prod. 264, 121537. doi:10.1016/j.jclepro.2020.121537
Zhang, J., Wang, Q., Xia, Y., and Furuya, K. (2022). Knowledge map of spatial planning and sustainable development: A visual analysis using CiteSpace. Land 11, 331. doi:10.3390/land11030331
Zhao, H., Li, X., and Wang, J. (2016). The Mapping knowledge domains about development of domestic regional tourism research during 1998- 2014: Bibliometric analysis based on Cite Space. J. Arid. Environ. 30, 203–208.
Zhao, J., and Hu, Y. K. (2020). A few thoughts on the reform of China's science and technology evaluation system. Sci. Res. Manag. Chin. 41 (10), 278–283.
Zhong, B., Wu, H., Li, H., Sepasgozar, S., Luo, H., and He, L. (2019). A scientometric analysis and critical review of construction-related ontology research. Autom. Constr. 101, 17–31. doi:10.1016/j.autcon.2018.12.013
Zhu, E., Qi, Q., and Sha, M. (2021). Identify the effects of urbanization on carbon emissions (EUCE): A global scientometric visualization analysis from 1992 to 2018. Environ. Sci. Pollut. 28 (24), 31358–31369. doi:10.1007/s11356-021-12858-1
Zhu, K., Song, Y., and Qin, C. (2019). Forest age improves understanding of the global carbon sink. Proc. Natl. Acad. Sci. 116, 3962–3964. doi:10.1073/pnas.1900797116
Keywords: urban green space, Citespace, carbon sequestration, bibliometrics, research progress
Citation: Wang H, Feng Y and Ai L (2023) Progress of carbon sequestration in urban green space based on bibliometric analysis. Front. Environ. Sci. 11:1196803. doi: 10.3389/fenvs.2023.1196803
Received: 31 March 2023; Accepted: 06 June 2023;
Published: 27 June 2023.
Edited by:
Hameed Sulaiman, Sultan Qaboos University, OmanReviewed by:
Muhammad Shafiq Shahid, Sultan Qaboos University, OmanAmir Raza, University of Arizona, United States
Copyright © 2023 Wang, Feng and Ai. This is an open-access article distributed under the terms of the Creative Commons Attribution License (CC BY). The use, distribution or reproduction in other forums is permitted, provided the original author(s) and the copyright owner(s) are credited and that the original publication in this journal is cited, in accordance with accepted academic practice. No use, distribution or reproduction is permitted which does not comply with these terms.
*Correspondence: Huan Wang, d2FuZ2h1YW4xNEBtYWlscy51Y2FzLmFjLmNu; Lijiao Ai, NTI5ODAwNjMzQHFxLmNvbQ==