 Guanxing Wang
 Fan Zhang3,4
 Chen Zeng
 Xiong Xiao
- 1Key Laboratory of Tibetan Plateau Land Surface Processes and Ecological Conservation, College of Geographical Science, Qinghai Normal University, Xining, China
- 2Qinghai Province Key Laboratory of Physical Geography and Environmental Process, College of Geographical Science, Qinghai Normal University, Xining, China
- 3State Key Laboratory of Tibetan Plateau Earth System, Environment and Resources (TPESER), Institute of Tibetan Plateau Research, Chinese Academy of Sciences, Beijing, China
- 4University of Chinese Academy of Sciences, Beijing, China
- 5College of Geographic Science, Hunan Normal University, Changsha, China
Introduction: Precipitation in the upstream region of the Heihe River basin (UHRB) in the northeastern of the Tibetan Plateau, which is the main water source of the basin, has undergone drastic changes in extreme climate events in recent decades. In addition to the amount of precipitation, the type of precipitation has a substantial impact on hydrological processes.
Methods: In this study, we compared the results from three methods aimed at improving precipitation type estimation based on daily precipitation type records for 24 discontinuous years. Based on the precipitation type distinction, we examined the spatial and temporal changes in the total precipitation, rainfall, snowfall and air temperature at the six stations as well as the spatial average of the UHRB during the past 62 years. We also analyzed changes in the quantity, duration magnitude, and frequency of extreme precipitation using the RClimDex model and statistical analysis.
Results: The probability of detection value of the T3.6_4.5 method was 1.9%, indicating the estimation was closest to actual records. The analyses based on precipitation type diving showed that rainfall accounts for an average of 81.9% of the total precipitation received in a year. In the context of large scale climate warming, temperatures at all six stations increased significantly, but precipitation changes were only apparent at about half of the stations which were located in regions of higher elevation and influenced by both ENSO and the East Asian monsoon. Analysis of the spatial averages in the UHRB revealed that the annual drought events (CDD) were significantly alleviated, and that the growing season length (GSL) was significantly extended. The annual total precipitation, rainfall, and extreme precipitation indices (P99P, P95P, R95P, and SDII) increased in magnitude, and the frequency of extreme precipitation events (P10mm) also significantly increased.
Discussion: The findings of this study indicate that under the background of climate warming, the changes of precipitation patterns in the UHRB which may have resulted in bringing better vegetation growth, but also the increasingly frequent extreme rainfall events may pose challenges to growing extreme rainfall events to agriculture and other human activities in local and downstream areas.
1 Introduction
The Tibetan Plateau (TP), also known as the “Third Pole” and the “Asian Water Tower”, plays a crucial role in water resource management and disaster mitigation. The acceleration of the hydrological cycle caused by global warming has led to an increase in extreme weather events including floods, droughts, and icefalls (Piao et al., 2010; Yao et al., 2019; Bai et al., 2023). Recent studies have reported an increase in the frequency and magnitude of extreme weather events on the TP and in other parts of the world in recent decades (Zhai et al., 2005; Wang et al., 2008; Tabari, 2020). Climate warming on the TP is occurring at a rate almost triple the global average (Qiu, 2008), making extreme weather events a topic of great concern (You et al., 2008; Xiong et al., 2019; He et al., 2021). Not only rainfall amount, but also rainfall intensity, including rainfall magnitude, frequency, and rainfall erosivity, are correlated with hazards such as soil erosion, landslides, and floods (Panagos et al., 2015). Extreme rainfall events are of particular concern because of their significant economic and societal impacts.
The RClimDex model is increasingly used to analyze extreme weather events worldwide (Xiong et al., 2019; Fathian et al., 2020; Cheng et al., 2022; Wubaye et al., 2023; Yang et al., 2023). This model calculates climate indices defined by the Expert Team on Climate Change Detection and Indices (ETCCDI) (Karl and Easterling, 1999) based on daily precipitation, daily maximum, minimum, and mean temperatures.
However, the RClimDex model does not distinguish between different types of precipitation. Rainfall and snowfall are different hydrological processes that may lead to different runoff processes (Zhang et al., 2020), soil erosion processes (Zhang et al., 2022), and different types of disasters. Luo et al. (2020) compared five kinds of methods used to differentiate precipitation types, namely, the daily average surface air temperature, wet-bulb temperature, dynamic threshold temperature, surface ground temperature, and 700–850 hPa thickness at 836 stations in China and found that the threshold temperature method demonstrated the best performance. Chen et al. (2014) also concluded that the threshold air temperature method demonstrated better performance than the threshold wet bulb temperature method based on data from 643 stations in China. Therefore, most conceptual and distribution hydrological models employ threshold temperature methods to distinguish between rainfall and snowfall. For example, models such as VIC (Liang et al., 1996), SWAT (Arnold et al., 1998), and Mike SHE (Refsgaard et al., 1992), employ the one-threshold temperature method, whereas models such as DHSVM (Wigmosta et al., 1994) employ a two-threshold temperature method in which linear regression is applied between two threshold temperatures to distinguish between rainfall and snowfall. Ding et al. (2014) proposed a new statistical model to calculate the wet-bulb temperature based on air temperature, relative wind speed, relative humidity, air pressure, and weather station elevation. This model achieved better precipitation-type classification results and was successfully validated using data from 609 stations in China.
The present study was conducted in the upper Heihe River Basin (UHRB), a typical mountainous region situated at the zone of intersection of the Westerlies and the East Asian summer monsoon in the northeastern part of the TP (Wang et al., 2004; Qin et al., 2010). This study aimed to investigate the spatiotemporal patterns and changes in rainfall, snowfall, and extreme climate events in the area over the past six decades. Specifically, this study had three objectives: 1) to compare three methods of precipitation-type discrimination and identify the most effective approach for distinguishing between rainfall and snowfall; 2) to describe the spatiotemporal distribution and changes in total precipitation, rainfall, and snowfall; and 3) to evaluate the magnitude, frequency, rainfall erosivity, and change trends of extreme climate events in the UHRB. The results of this study will contribute to a better understanding of the distribution of water resources and extreme climate events in the context of global warming and provide essential information for the estimation and prediction of extreme precipitation on the TP.
2 Materials and methods
2.1 Study area
The Heihe River is an inland river that originates at the northeastern margin of the TP and disappears in the deserts of the downstream region (Figures 1A, B). It is formed by the confluence of the west tributary (YNG) and the east tributary (BBH) in the upper stream region (Gao et al., 2015). The part of the main river located on the TP and monitored by the Yingluoxia (YLX) hydrological station (Figure 1C) is defined as the upstream part (i.e., the UHRB) and has an annual mean precipitation of 200–700 mm and potential evapotranspiration of approximately 700 mm (Ma and Frank, 2006). The UHRB (37.72° N—39.09° N, 98.57° E—101.16° E) has a drainage area of 10,005 km2, with elevations ranging from 1,681 m to 5,015 m.
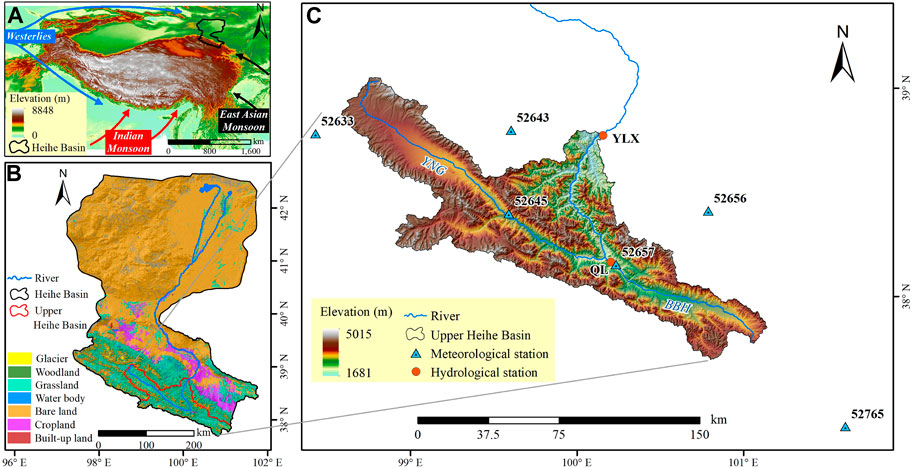
FIGURE 1. (A) Location of the Heihe River Basin (HRB). (B) Land use and land cover of the HRB. (C) Station locations of the data used in and around the upper Heihe River Basin (UHRB). The digital elevation model (DEM) data were obtained from https://www.gscloud.cn/sources/accessdata/305?pid=302, while the land use and land cover data source (Wang, 2015) can be accessed at https://data.tpdc.ac.cn/zh-hans/data/320690e1-f8aa-4c51-a189-4c82f7e64b39.
The middle stream of the Heihe River, which encompasses the piedmont lower alluvial fan and fluvial plain, is the primary irrigated region (Song et al., 2020). This region accounts for 97.3% of the total population and generates 96.5% of the GDP of the entire Heihe River Basin (Cheng et al., 2015). However, precipitation in this part is relatively low (100–200 mm) and the potential evapotranspiration is higher (2000–2,500 mm) than that in the upstream part (Cheng et al., 2015). Moreover, the UHRB provides almost 70% of the total river runoff to support the middle and downstream regions (Gao et al., 2015), making it the most crucial water source region for the entire basin. Wu et al. (2015) simulated runoff components in the UHRB and found that glacier melting contributed 8.9% to the streamflow, highlighting the importance of precipitation runoff (including rainfall and snowfall runoff) for the entire basin.
2.2 Data sources
Daily meteorological data covering 62 years, including precipitation amount, maximum air temperature, minimum air temperature, and average air temperature, were collected from six meteorological stations located in and around the UHRB (Figure 1C). These data were obtained from the Resource and Environment Science and Data Center (Table 1). Additionally, to validate the methods to discriminate precipitation type, precipitation-type data covering 24 discontinuous years were sourced from unpublished hydrologic yearbooks of China (Table 1). The observation and recording of the precipitation amount and types by hydrological stations followed the standard procedure published by the Ministry of Water Resources of the People’s Republic of China (MOWR, 1975). The recorded precipitation types included rain, snow, sleet, hail mixed with snow, and hail mixed with rain.
TABLE 1. Data sources.
2.3 Methods for precipitation-type discrimination and quality control
To differentiate between types of precipitation, this study applied three distinct methods, namely, the one-threshold air temperature method (Chen et al., 2014), the two-threshold air temperature method (Zhang et al., 2015), and Ding’s comprehensive model (Ding et al., 2014). The one-threshold air temperature method uses one air temperature to distinguish between rainfall and snowfall. The two-threshold air temperature method uses two different air temperatures in different situations, typically in different seasons. Ding’s comprehensive model considers air temperature, relative wind speed, relative humidity, air pressure, weather station elevation, and wet-bulb temperature. Ding’s method is detailed elsewhere (Ding et al., 2014).
The probability of detection (POD) (Chen et al., 2014; Pan et al., 2015) was calculated to verify the accuracy of the aforementioned precipitation-type estimation methods. The POD was calculated using the following formula:
where A represents the number of snowfalls correctly estimated and C denotes the number of snowfalls missed. Thus, A + C is the recorded number of snowfalls.
2.4 Precipitation and temperature indices
2.4.1 Rainfall erosivity (REro)
Rainfall erosivity is one index used to represent the potential for rainfall to cause erosion (Mello et al., 2020). After distinguishing between precipitation types, daily rainfall data were used to calculate rainfall erosivity using the daily rainfall erosivity model proposed by Zhang et al. (2002). This model has been successfully applied in many studies, including the First National Water Census for Soil and Water Conservation of China (Liu et al., 2013). In this model, 24 h rainfall amounts >12 mm are regarded as erosive events (Zhang et al., 2002). The calculation formula for the model is as follows:
where Ri is the rainfall erosivity for the ith half-month, measured in MJ·mm/(hm2·h); k is the number of erosive rainfall days within the half-month; Pj is the amount of erosive rainfall on the jth erosive rainfall day, measured in mm; Pd12 represents the average rainfall of erosive rainfall days, measured in mm; Py12 is the average annual erosive rainfall, measured in mm; and a and ß are the parameters of the model according to the parameterization scheme calibrated by Zhang et al. (2002).
2.4.2 Climate indices computed using RClimDex software
The Expert Team on Climate Change Detection and Indices (ETCCDI) (Karl and Easterling, 1999) has defined climate indices based on daily precipitation, daily maximum temperature, daily minimum temperature, and daily mean temperature. RClimDex software (http://etccdi.pacificclimate.org/software.shtml), which operates in the R programming environment (https://cran.r-project.org/mirrors.html), can be used to compute these indices and is considered a standard tool in the field (Cheng et al., 2015; Fathian et al., 2020; Cheng et al., 2022). The indices used in this study are listed in Table 2.
TABLE 2. Climate indices employed in this study.
2.5 Spatial interpolation
To investigate the spatial variability in precipitation and air temperature within the UHRB, the contribution of each weather station in the target area was determined using the Thiessen polygon method in ArcGIS 10.5 and the locations of the six weather stations (Supplementary Figure S1). The Thiessen polygon method was proposed for spatial interpolation (Thiessen, 1911), which is based on proximal mapping; i.e., the nearest-distance neighbor. Compared to other interpolation methods, such as inverse distance weighting (IDW), Kriging, and spline interpolation, the Thiessen polygon method is more convenient for interpolating masses of daily data. This method has been successfully applied in many studies applying precipitation interpolations (Li et al., 2018; Malik and Kumar, 2020; Yanos, 2022).
The weighted average precipitation for the whole basin was computed by multiplying the precipitation at each station by its assigned percentage of area (Yanos, 2022). The formula is as follows:
where Pave is the weighted average rainfall for the whole basin; PA, PB, … , PN are the observed precipitation values for stations A, B, … , N, respectively; and CA, CB, … , CN are weighted factors calculated using the Thiessen polygon method for stations A, B, … , N, respectively.
Note that the simple spatial interpolation based on the station data was applied in this study, even though it would potentially not fully capture precipitation gradients in mountainous areas (Zhang et al., 2015).
2.6 Trend analysis and detection of abrupt years
The Kendall rank correlation test (Kendall, 1934; Mann, 1945) was employed to detect trends in the time series to identify general change trends for all indices. For indices that exhibited significant change trends, the Pettitt non-parametric approach was applied to identify the abrupt change points (Pettitt, 1979).
3 Results
3.1 Precipitation-type discrimination
The classification of precipitation into rainfall and snowfall is important as these types of precipitation have significantly different effects on runoff processes, soil erosion, and disaster response. However, it is often difficult to obtain records on precipitation types from public historical records.
Ding’s method was developed to distinguish precipitation types including rain, snow, and sleet based on wet-bulb temperature (Ding et al., 2014). Deng et al. (2017) applied this method to distinguish snowfall in the Tibetan Plateau and analyze snowfall changes. Han et al. (2019) applied the CREST-snow hydrologic model coupled with Ding’s method to simulate the flow regime in the Lancang River Basin. Su et al. (2022) employed Ding’s method to calculate rainfall and snowfall to evaluate the glacier changes.
The snowfall threshold-temperature method is typically used in most hydrological models, and the parameters of this method can be adjusted within a reasonable range. Han et al. (2010) analyzed precipitation-type records from 643 weather stations in China from 1961 to 1979 and found that the one-threshold temperature method showed the most appropriate performance. Additionally, a spatial distribution pattern has been identified in China, wherein the threshold temperatures are higher in plateau areas (Han et al., 2010; Chen et al., 2014). Chen et al. (2014) indicated that the one-threshold temperature for daily rainfall and snowfall in the UHRB area was in the range of 3.5°C–5.5°C. Han et al. (2010) also suggested that the two-threshold temperature method may be suitable in some arid areas. Zhang et al. (2015) found that the snowfall temperature was negatively correlated with relative humidity in the northern region of the Himalayas, indicating that the threshold temperature might be higher in dry seasons than in wet seasons.
In this study, we first determined the best thresholds for the one-threshold and the two-threshold temperature methods by traversing the threshold temperature between 3.0°C and 5.5°C (Supplementary Figure S2). Except for instances in which there were no differences in extremely cold months (i.e., January, February, November, and December), the best threshold temperature for March and April with the most snowfalls was 4.5°C (i.e., the one-threshold temperature method T4.5); meanwhile, for May to October, the best snowfall threshold temperature was 3.6°C. Thus, the best solutions for the two-threshold-temperature method were 3.6°C for May to October and 4.5°C for November to April of the next year (T3.6_4.5). We also classified precipitation type based on Ding’s method using data covering 24 years. As most hydrological models require only rainfall and snowfall as inputs, this study focused on classifying these two precipitation types. Moreover, since the number of sleet events in the study area was relatively small, the sleet events were considered rainfall as in other studies (Chen et al., 2014; Deng et al., 2017; Su et al., 2022). The total number of snow days per month and over the 24-year period for the three methods (T3.6_4.5, T4.5, and Ding’s method) and their probability of detection (POD) values are shown in Figures 2A, B.
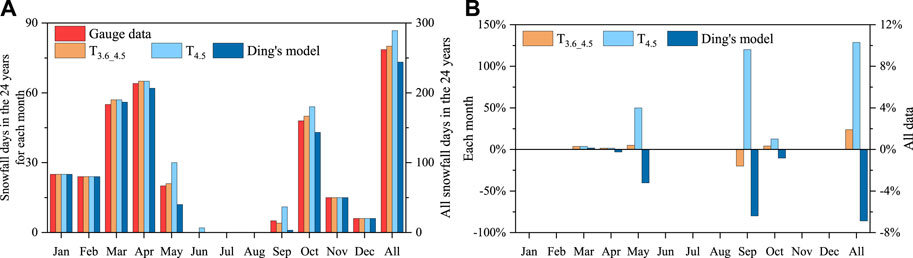
FIGURE 2. (A) Results of the three methods for precipitation-type discrimination based on records from the QL and No. 52657 stations. (B) Probability of detection (POD) values for the three precipitation-type discrimination methods.
Overall, the T3.6_4.5 method performed better than the T4.5 method and Ding’s method, with a POD value as low as 1.9%. Considerable over- and underestimations were noted when employing the T4.5 (+10.3%) and Ding’s method (−6.9%) for the 24 years of data. Snowfall events constituted the absolute majority during January, February, March, April, November, and December, whereas rainfall events were dominant in June, July, and August. Thus, all three methods performed evenly in these 9 months. However, the accuracies of the three methods differed during the transitional months of May, September, and October. Although the POD values for the T3.6_4.5 method for these months were 5.0%, −20.0%, and 4.2%, respectively, those for the T4.5 method (50.0%, 120.0%, and 12.5%) and Ding’s method (−40.0%, −80.0%, and −10.4%) were not acceptable. In a precipitation-type estimation study based on data from 643 stations across China, Chen et al. (2014) also found that 51% of the stations had POD values <2% when applying the air temperature threshold method. Based on these findings, the T3.6_4.5 method was considered the most suitable for precipitation-type differentiation in the UHRB.
3.2 Spatial distributions of rainfall and snowfall
Using the T3.6_4.5 method for discrimination of precipitation type, the daily rainfall and snowfall events during 1960–2021 were distinguished at the six weather stations located in and around the UHRB. Figure 3 reveals distinct spatial patterns in the average annual precipitation, rainfall, and snowfall in the UHRB. The UHRB has an average annual precipitation of 381.6 mm, with 81.9% rainfall (312.6 mm) and 18.1% snowfall (69.0 mm). Both precipitation and rainfall amounts exhibited a decrease from east to west across the UHRB, which is consistent with the spatial distribution patterns of the WRF model outputs based on station data (Pan et al., 2015) and some precipitation products (e.g., DCMAP, ITP-F, and DCMAP-MicroMet) (Pan et al., 2014). However, the snowfall amount was relatively higher in the west tributary. Owing to the influences of the East Asian monsoon in summer and the Westerlies in winter (Yao et al., 2022), which carry different amounts of moisture, differences were observed in the distributions of total precipitation, rainfall, and snowfall distribution from east to west in the UHRB (Cheng et al., 2015). Consequently, while the climates in the west and east tributary regions of the UHRB are similar, the precipitation amounts and types in these regions exhibit differences due to variations in the locations and underlying surfaces.
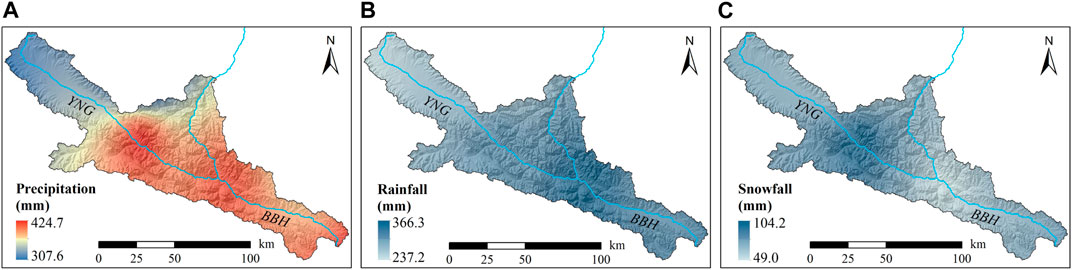
FIGURE 3. Spatial distribution of the average annual (A) precipitation, (B) rainfall, and (C) snowfall in the UHRB.
3.3 Intra-year trends in rainfall and snowfall
As the UHRB is influenced by the East Asian monsoon during summer and the Westerlies during winter, notable seasonal variations were observed in total precipitation, rainfall, snowfall, and temperature (Figure 4). Snowfall accounted for an average of 18.1% of the precipitation amount, with significant variations observed across different months. Snowfall constituted 100% of the precipitation events from November to March. As the Westerlies and the East Asian monsoon shift, both temperature and precipitation rose from May, reaching their peaks in July (94.2 mm of precipitation and a mean temperature of 12.4°C), and then decreasing until the next cycle. Moreover, as the average and minimum air temperatures exceed 0°C during May–September, rainfall events dominate during these months, accounting for 60.0%, 93.8%, 99.4%, 99.0%, and 84.9% of the precipitation amounts in May, June, July, August, and September, respectively. The annual snowfall occurred during April and May (13.6 mm and 16.6 mm). Owing to the accumulation of snowfall in the basin from October to March (25.4 mm in total), spring floods typically occur in April and May (Zhu et al., 2020). Summer floods typically occur in July and August (Luo et al., 2017) because the highest rainfall is received during the East Asian summer monsoon.
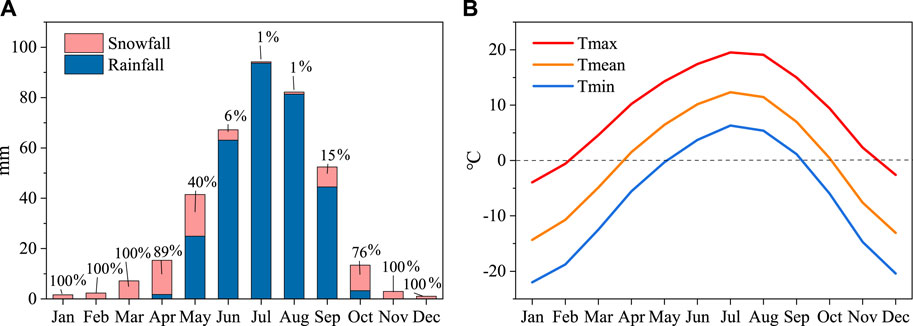
FIGURE 4. Spatially averaged intra-year (A) rainfall and snowfall, and (B) Tmax, Tmean, and Tmin.
3.4 Long-term changes in rainfall and snowfall
The annual total precipitation, rainfall, snowfall, mean temperature (Tmean), maximum temperature (Tmax), and minimum temperature (Tmin) were calculated from daily measurements of these parameters. The change trends of these annual values were assessed using Kendall’s rank correlation tests with the year, and the change rates were estimated using linear regression. The spatial distributions of these parameters are shown in Figure 5. Over the past 62 years, except for station 52,765, which is located in the southeasternmost station and exhibited a non-significant increasing trend, all other stations exhibited significant increases in precipitation and rainfall, with rates ranging from 7.35 to 14.68 mm/10y and 6.42–15.46 mm/10y, respectively. The spatially averaged precipitation and rainfall amounts also showed significant increasing trends, with rates of 13.45 mm/10y (p < 0.001) and 13.02 mm/10y (p < 0.001), respectively. However, we observed no significant change in annual snowfall across all stations, with a slightly increasing trend of 0.43 mm/10y (p = 0.697) for the spatial average. It should be noted the area influenced by both the East Asian monsoon and the Westerlies may experience more severe changes in total precipitation, rainfall, and snowfall. Additionally, in the context of global climate warming, the average, maximum, and minimum temperatures showed notable increases, with spatially averaged increase rates of 0.32°C/10y, 0.26°C/10y, and 0.39°C/10y, respectively, which were three times (Qiu, 2008) the global average warming rate (0.12°C/10y during 1951–2012) (IPCC, 2014) and slightly lower than the average for the TP (0.35°C/10y during 1970–2014) (Yao et al., 2019).
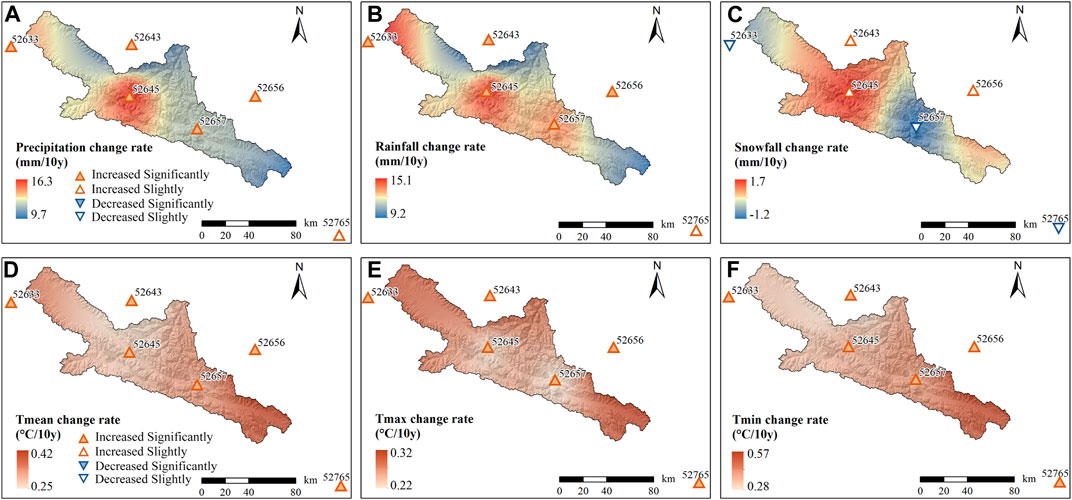
FIGURE 5. (A) Total precipitation, (B) rainfall, (C) snowfall, (D) mean temperature, (E) maximum temperature, and (F) minimum temperature changes in the UHRB during 1960–2021.
The changes in total precipitation and rainfall in the UHRB during 1960–2021 displayed an abrupt and significant shift in 2002 (p < 0.05) according to the Pettitt (1979) test (Figure 6, the year with the highest Sk value). This abrupt year was in good agreement with the average situation across the entire TP (Wang et al., 2016). No abrupt year was found for snowfall as it did not exhibit any significant change trend (p > 0.05). In addition, the average, maximum, and minimum air temperatures all exhibited stepwise increases around 1996 and 1997, which was consistent with the average for the entire TP (Zhang et al., 2022). Furthermore, the periods of 1960–2001 and 2002–2021 were selected as consolidated periods for comparison before and after the abrupt year (Table 3). The difference in total precipitation in the UHRB was greater, and the decrease in the snow/rainfall ratio (S/R) was negligible compared to those in the entire TP (Wang et al., 2016). Furthermore, snowfall showed a slight increase in the UHRB, whereas it exhibited a significant decrease in the TP (Wang et al., 2016). However, the changes in temperature were comparable with those in the entire TP (Zhang et al., 2022).
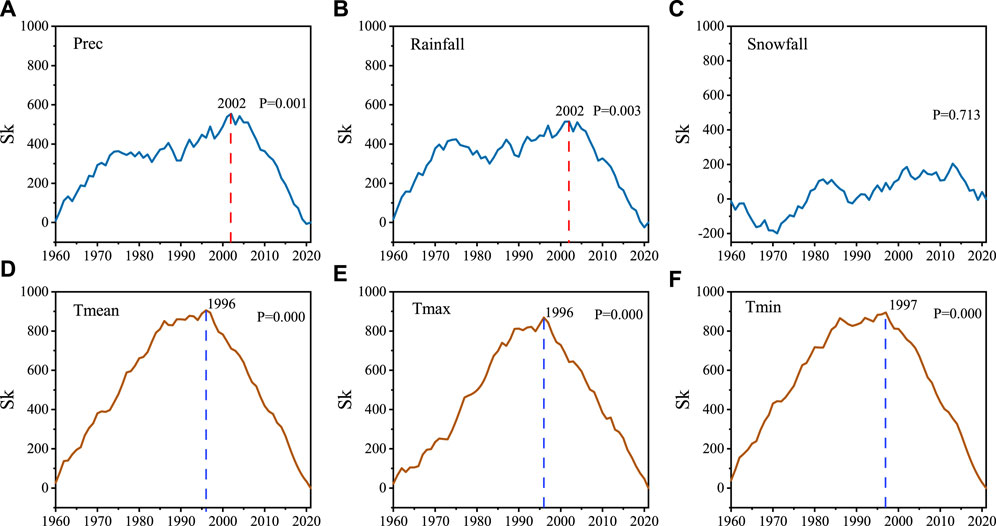
FIGURE 6. Abrupt change tests for (A) total precipitation, (B) rainfall, (C) snowfall, (D) mean temperature, (E) maximum temperature, and (F) minimum temperature in the UHRB during 1960-2021.
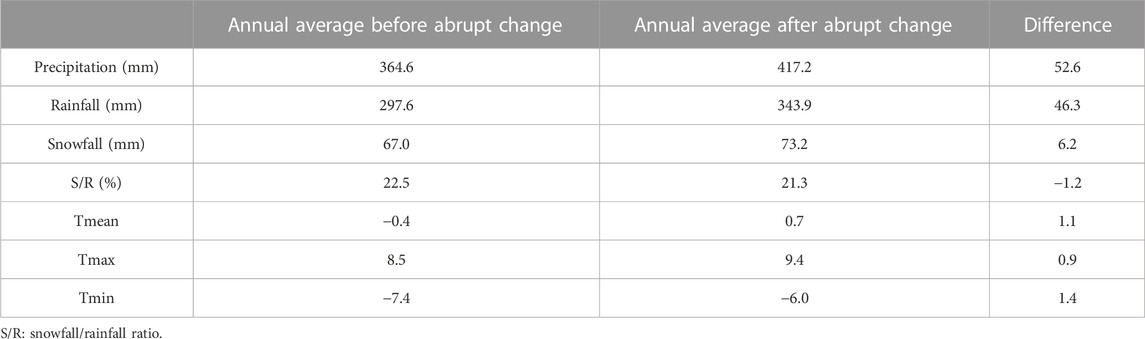
TABLE 3. Changes in total precipitation, rainfall, snowfall, snowfall/rainfall ratio, and temperatures in the UHRB before and after the year 2002.
The total precipitation, rainfall, snowfall, and temperatures exhibited varying monthly change trends (Figure 7). The Tmax for all months, except for April and May, as well as the Tmean and Tmin, demonstrated significant increases (p < 0.01). While all months exhibited an increase in precipitation, the increases were only significant in January, June, and December, owing to the significant increases in rainfall in June and December, and snowfall in January and December. In contrast, significant decreases in snowfall were observed in June and September, possibly due to the warmer climate and the shift of snowfall to rainfall.
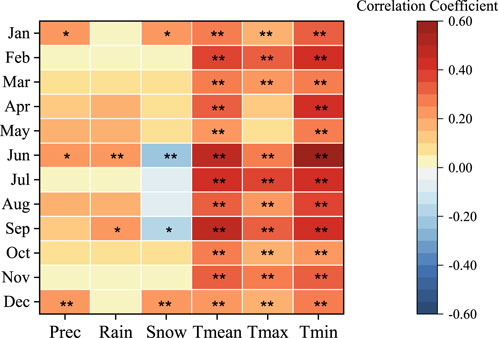
FIGURE 7. Total precipitation-, rainfall-, snowfall-, and temperature-changing trends for each month. * Significance at the p < 0.05 level; **significance at the p < 0.01 level.
Overall, the changes in precipitation and temperature suggested that despite similar climate warming backgrounds, the changes in precipitation can be more complex due to the influence of general atmospheric circulation, topography, and other factors.
4 Discussion
4.1 Precipitation-related indices
Consecutive dry days (CDD), annual maximum consecutive 5-day precipitation (RX5DAY), annual count of days with precipitation >10 mm (P10 mm), annual total precipitation above the 99th percentile (P99P), annual total precipitation above the 95th percentile (P95P), and simple daily intensity index (SDII) of the precipitation indices computed by ClimDex software were selected for analysis in the present study. However, ClimDex software does not distinguish the precipitation types. Considering that the P99P values in some years were zero, we manually calculated the annual total rainfall above the 95th percentile (R95P) and the annual total snowfall above the 95th percentile (S95P) for analysis of extreme precipitation in the UHRB. The threshold values of P99P, P95P, R95P, and S95P at the six stations are listed in Table 4. Some studies analyzed extreme or erosive precipitation without distinguishing between rainfall and snowfall, which may lead to uncertainties. Therefore, based on the rainfall distinguished, rainfall erosivity (REro) values were also calculated as one of the indices affected by extreme rainfall. The ranges and changes of the indices for each station and spatially averaged values are shown in Figure 8 and Table 5.
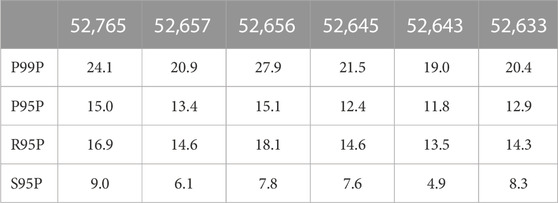
TABLE 4. the 99th percentile values of the total precipitation (P99P) and the 95th percentile values of the total precipitation (P95P), rainfall (R95P), and snowfall (S95P) at the six stations (mm).
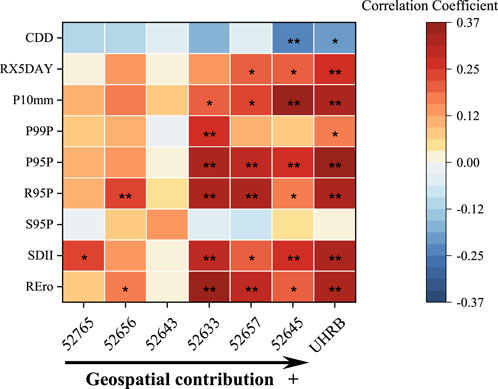
FIGURE 8. Precipitation indices change trends at the six stations and the UHRB. *Significance at the p < 0.05 level; **significance at the p < 0.01 level. The correlation coefficient is that between each annual index and the year.
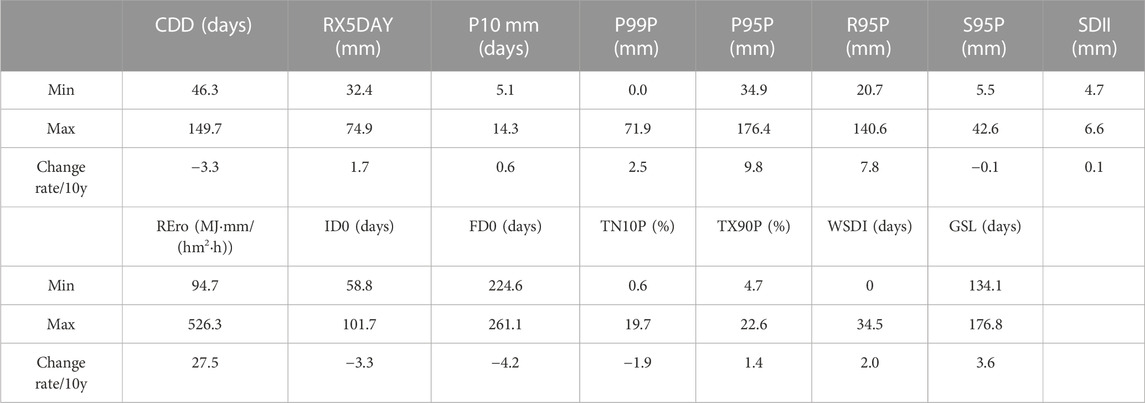
TABLE 5. Climate index ranges and change rates in the UHRB.
4.1.1 Consecutive dry days
During 1960–2021, the CDD values, defined as the maximum number of consecutive days with precipitation <1 mm, exhibited decreasing trends at all six stations. This trend was significant at the west tributary station 52,645 and for the UHRB average (Figure 8). Over the 62-year period, the average CDD value for the UHRB ranged from 46.3 to 149.7 days, with a significant decreasing trend of 3.3 days/10y (Table 5). These results suggested that drought events decreased notably in the context of climate change. Cheng et al. (2015) found no statistically significant change trend in CDD values in the UHRB for the period 1960–2011. Moreover, the present study found that the decrease in CDD values became statistically significant when the time series was extended to 2021, indicating a continued easing of drought conditions in the last 10 years.
4.1.2 Extreme precipitation, rainfall, and snowfall events
The consecutive effects of extreme precipitation, represented by RX5DAY values, exhibited significant intensified trends at stations 52,657 and 52,645 (p < 0.05), which are located in the UHRB (Figure 8). The spatially averaged RX5DAY values for the UHRB ranged from 32.4 to 74.9 mm, with a significant increasing trend (p < 0.01) of 1.7 mm/10y (Table 5).
P10 mm is a signal of heavy rain frequency and varied from 5.1 to 14.3 days/y in the UHRB, with an increasing trend of 0.6 days/10y (Table 5). P10 mm showed an overall increasing trend; this trend was significant at the three stations that spatially contributed most to the UHRB (Figure 8). The threshold values for P95P at the six stations ranged from 11.8 to 15.1 mm, while those for P99P were 19.0–27.9 mm (Table 4). Owing to the limited number of days with precipitation above the 99th percentile, other than R95P, the R99P values only exhibited a significant increasing trend at station 52,633 (p < 0.01) and the spatial average of the UHRB (p < 0.05) (Figure 8).
However, P95P and R95P values showed increasing trends at all six stations, with significant intensification at stations 52,657, 52,645, and 52,633 for both P95P and R95P, as well as at station 52,656 for R95P (Supplementary Figure S3). Because of the intensification of extreme precipitation and rainfall events at all six stations, the UHRB experienced an intensification of extreme precipitation and rainfall (p < 0.01), with change rates of 9.8 mm/10y and 7.8 mm/10y, respectively (Table 5). Meanwhile, extreme snowfall showed non-significant changes, with change rates ranging from −1.03 mm/10y to 0.85 mm/10y (p > 0.05). The spatially averaged change rate was −0.1 mm/10y (p > 0.05).
Cheng et al. (2015) evaluated several precipitation- and temperature-related indices, including RX5DAY, P10mm, SDII, and R95P, in the upper, middle, and downstream areas of the Heihe River Basin, using daily precipitation data for the period 1960–2011. They observed significant changing trends in RX5DAY, P10mm, SDII, and R95P in the upstream region of the Heihe River Basin, consistent with the findings of the present study.
4.1.3 Precipitation intensity indices
SDII, defined as the annual total precipitation divided by the number of wet days in the year, signifies the simple daily intensity of the precipitation. The SDII values of the UHRB, ranging from 4.7 to 6.6 mm, exhibited a significant (p < 0.01) increasing trend of 0.1 mm/10y (Figure 8; Table 5). The significant change trends of this index were also shown at stations 52765, 52,633, 52,657, and 52,645.
To evaluate the intensity of erosive rainfall events (≥12 mm/day), based on daily rainfall data obtained from precipitation type discrimination, the rainfall erosivity values and change trends for the six stations were analyzed according to the rainfall erosivity estimation of Zhang et al. (2002). The spatial averages are shown in Figure 9. In general, the annual average rainfall erosivity decreased from south to north, with the highest value of 565.0 MJ·mm/(hm2·h) at station 52,765, the lowest value of 167.5 MJ·mm/(hm2·h) at station 52,643, and a spatial average of 283 MJ·mm/(hm2·h), consistent with the findings of Liu et al. (2013). The annual average rainfall erosivity for all six stations increased with rates ranging from 6.2 MJ·mm/(hm2·h)/10y (station 52,643) to 36.6 MJ·mm/(hm2·h)/10y (station 52,657). Except for stations 52,643 and 52,765, the annual average rainfall erosivity at all stations increased significantly (Figure 8), contributing to the severe intensification of annual average rainfall erosivity in the UHRB (+27.5 MJ·mm/(hm2·h)/10y; p < 0.001). It is noteworthy that the population of the UHRB is concentrated around station 52,657, which recorded the highest annual average rainfall erosivity of 318.0 MJ·mm/(hm2·h) and the greatest rainfall erosivity intensification rate of 36.6 MJ·mm/(hm2·h)/10y.
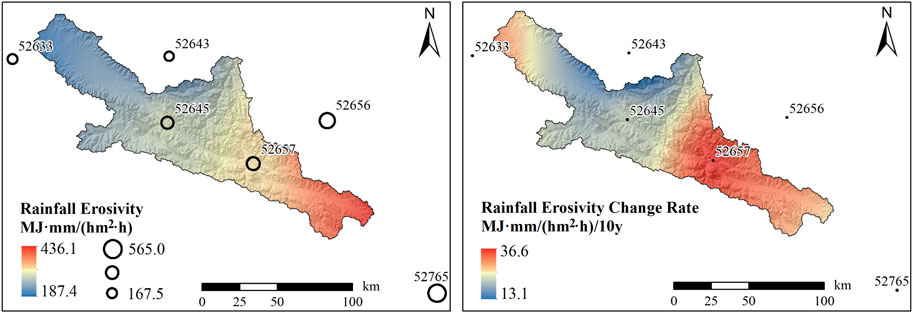
FIGURE 9. Spatial distribution and change trends of rainfall erosivity in the UHRB.
The spatial distribution pattern of REro was similar to that of P95P and R95R, with the events concentrated around the residential area near station 52,657 (Figure 9). The intensification of rainfall events in this region may lead to flood risks for the local community. Hydrological records show that several severe flood events occurred in 1959, 1989, 1996, 1998, 2014, 2016, and 2021, causing debris flows that resulted in significant economic losses, as well as losses to property and life (Dai, 2010; Cui et al., 2022). These events also reveal that rainfall erosivity and extreme rainfall events became increasingly more severe over time.
4.2 Temperature-related indices
Six of the temperature-related indices were also generated by the ClimDex model. The annual change trends of the six stations and the UHRB average are shown in Figure 10. Unlike the precipitation-related indices, the temperature-related indices changed significantly in almost all six stations. The cold day-related indices, namely, the annual count of days with Tmax <0°C (ID0), the annual count of days with Tmin <0°C” (FD0), and the percentage of days when Tmin was below the 10th percentile (TN10P), showed compelling decreasing trends at all sites, indicating significant changes in minimum air temperatures. In contrast, the high-temperature-related indices, namely, the percentage of days with Tmax above the 90th percentile (TX90P) and the annual count of days with at least six consecutive days with TX above the 90th percentile (WSDI), all indicated intensive increasing warmth in the UHRB. The growing season length (GSL) in the UHRB was much shorter than that in other areas outside the TP, ranging from 134.1 to 176.8 days/y, but increased noticeably at 3.6 days/10y, which was almost three times the average rate of change in the Yangtze River basin (1.3 days/10y) (Cheng et al., 2022).
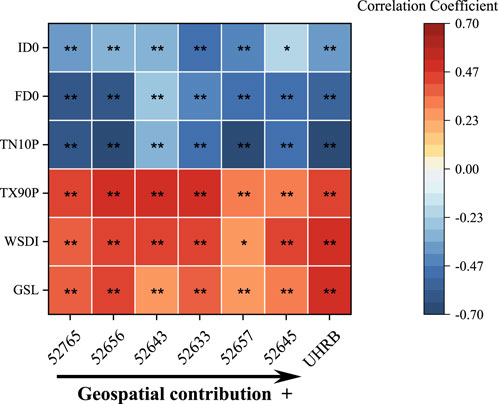
FIGURE 10. Temperature index-changing trends for the six stations and the UHRB * Significance at the p < 0.05 level; **significance at the p < 0.01 level. The correlation coefficient is that between each annual index and the year.
4.3 Factors influencing the climate extreme indices
The elevation, latitude, and longitude correlations with precipitation-related indices changes used for the spatial pattern and geographical factor analysis are listed in Supplementary Table S1. Due to the limited number of stations, most of the correlations were not significant. However, P, Rain, Snow, RX5DAY, P10mm, P99P, P95P, R95P, SDII, and REro changes were more pronounced in stations in the UHRB at higher altitudes, indicating that higher elevations were more strongly affected by climate change than lower elevations. Furthermore, all the precipitation-related indices were negatively correlated with latitude and were significantly correlated with total precipitation and rainfall values, which indicated more severe changes in the southern part of the UHRB.
El Niño-Southern Oscillation (ENSO), as an indicator of global climate change, has been shown to modulate the precipitation in the TP (Yao et al., 2022) and to remotely drive extreme precipitation across the TP (Bothe et al., 2010). Xiong et al. (2019) found that the ENSO had a significant positive correlation with P20 mm (annual count of days with precipitation >20 mm) and SDII during 1995–2001 in the TP. A significant positive correlation between the ENSO and P10 mm was also confirmed in the Qilian Mountains (2015). Qin et al. (2010) found that the intensification of the hydrological cycle in the 20th century could be attributable to regional to largescale temperature increases.
The correlation analysis results between Niño 4 SST index and climate indices of this study are listed in Supplementary Table S2. The air temperature-related indices, including Tmean, Tmax, Tmin, ID0, TX90P, WSDI, and GSL, were significantly correlated with the ENSO, indicating that temperature increases and extreme temperatures were largely influenced by the ENSO. Regarding the precipitation-related indices, P, Rain, RX5DAY, P10 mm, R99P, P95P, R95P, SDII, and REro were positively correlated with the ENSO, but the difference was only significant for P10 mm (p = 0.015), which is consistent with the results reported by Cheng et al. (2015).
In addition to global warming, large-scale atmospheric circulation, including the Indian monsoon, westerlies, and the East Asian monsoon, is a main driver of precipitation changes in the TP (Yao et al., 2022). Cheng et al. (2015) proved that rainfall extremes (P10 mm and total precipitation) in the UHRB had a strong negative correlation with the East Asian summer monsoon index and a significant positive correlation with the western Pacific subtropical high-intensity index.
This result indicated that the extreme rainfall events in the UHRB were influenced by both global climate warming and large-scale atmospheric circulation.
5 Conclusion
To investigate the impact of climate change on the most important water source region of the second-largest inland river in China, data on daily precipitation, daily mean temperature, daily maximum temperature, and daily minimum temperature were obtained from six meteorological stations located in and around the UHRB in the northeastern part of the TP. This study aimed to examine changes in precipitation type and related climate indices changes over a 62-year period. To this end, various methods for distinguishing daily precipitation type were first evaluated, and an optimal method (T3.6_4.5) was chosen based on a two-threshold temperature for different months (3.6°C for May to October and 4.5°C for November to the following April). This method exhibited the best performance for the UHRB and was also consistent with the theory that snowfall temperature is negatively correlated with relative humidity in the northern Himalayan region (Zhang et al., 2015).
After determining the precipitation types, this study examined the spatial and temporal changes in total precipitation, rainfall, snowfall, and related climate indices from 1960 to 2021 using the RClimDex model and statistical analysis.
The spatial average of the UHRB indicated that rainfall occurred mainly between June and September, while snowfall was predominant from November to the following March. The annual rainfall amount accounted for 81.9% of the total precipitation. On average, the Tmin values were >0°C from June to September, while the Tmean values were >0°C from April to October.
All six stations experienced distinct temperature increases, with the spatially averaged temperature increase trend almost three times the global average. However, unlike the significant large-scale changes in climate warming, changes in precipitation were observed primarily in about half of the six stations, particularly in regions of higher elevation and under the influence of both the East Asian monsoon and the Westerlies. In addition, the changes in extreme precipitation are highly affected by the ENSO and the East Asian monsoon.
In the UHRB, the occurrence of annual drought events, measured by consecutive dry days (CDD), decreased markedly, while the growing season length (GSL) was significantly extended by 3.6 days/10y. These changes are beneficial for local vegetation growth, agriculture, and animal husbandry. However, the magnitude of the intensity of extreme rainfall events (P99P, P95P, and R95P) and rainfall erosivity have increased, which would result in increased risks of soil erosion, floods, and landslides. Additionally, the frequency of spatially averaged extreme precipitation events (P10mm) also has significantly increased for the spatial average of the UHRB. These changes in extreme rainfall patterns could pose a considerable risk to local life and property security, as evidenced by recent flood events. The flood risks could also pose a challenge to the water diversion scheme of the Heihe River Basin, which has been implemented since 2000 (Song et al., 2020; Gou et al., 2022).
This study has positive implications for our understanding of the spatiotemporal variations in rainfall, snowfall, and extreme events in the UHRB in the context of climate change. The findings provide scientific evidence to strengthen water resource management at the basin scale; help prevent and mitigate the impacts on regional life, property security, and the environment; and facilitate sustainable social development.
Data availability statement
Publicly available datasets were analyzed in this study. These data can be found at: https://www.resdc.cn/data.aspx?DATAID = 230 https://data.tpdc.ac.cn/zh-hans/data/320690e1-f8aa-4c51-a189-4c82f7e64b39.
Author contributions
GW, FZ, and LW contributed to the study conception and manuscript writing. GW wrote the first draft of the manuscript. FZ, CZ, XS, and XX helped polish the manuscript. GW and XX received funding for the project detailed in the Funding section. All authors contributed to the article and approved the submitted version.
Funding
This research was financially supported by the National Natural Science Foundation of China (Grant Nos 42001062 and 42101130).
Conflict of interest
The authors declare that the research was conducted in the absence of any commercial or financial relationships that could be construed as a potential conflict of interest.
Publisher’s note
All claims expressed in this article are solely those of the authors and do not necessarily represent those of their affiliated organizations, or those of the publisher, the editors, and the reviewers. Any product that may be evaluated in this article, or claim that may be made by its manufacturer, is not guaranteed or endorsed by the publisher.
Supplementary material
The Supplementary Material for this article can be found online at: https://www.frontiersin.org/articles/10.3389/fenvs.2023.1202895/full#supplementary-material
References
Arnold, J. G., Srinivasan, R., Muttiah, R. S., and Williams, J. R. (1998). Large area hydrologic modeling and assessment part I: Model development 1. JAWRA J. Am. Water Resour. Assoc. 34 (1), 73–89. doi:10.1111/j.1752-1688.1998.tb05961.x
Bai, X., Zhao, W., Liu, H., Zhang, Y., Yang, Q., Liu, J., et al. (2023). Effects of precipitation changes and land-use alteration on streamflow: A comparative analysis from two adjacent catchments in the qilian Mountains, arid northwestern China. Front. Environ. Sci. 11, 7049. doi:10.3389/fenvs.2023.1097049
Bothe, O., Fraedrich, K., and Zhu, X. (2010). The large-scale circulations and summer drought and wetness on the Tibetan plateau. Int. J. Climatol. 30 (6), 844–855. doi:10.1002/joc.1946
Chen, R., Kang, E., and Ding, Y. (2014b). Some knowledge on and parameters of China's alpine hydrology. Adv. Water Sci. 25 (3), 307–317. (In Chinese with English abstract).
Chen, R., Liu, J., and Song, Y. (2014a). Precipitation type estimation and validation in China. J. Mt. Sci. 11 (4), 917–925. doi:10.1007/s11629-012-2625-x
Cheng, A., Feng, Q., Fu, G., Zhang, J., Li, Z., Hu, M., et al. (2015). Recent changes in precipitation extremes in the Heihe River basin, Northwest China. Adv. Atmos. Sci. 32 (10), 1391–1406. doi:10.1007/s00376-015-4199-3
Cheng, G., Liu, Y., Chen, Y., and Gao, W. (2022). Spatiotemporal variation and hotspots of climate change in the Yangtze River Watershed during 1958–2017. J. Geogr. Sci. 32 (1), 141–155. doi:10.1007/s11442-022-1940-6
Cui, L., Li, Y., and Shen, J. (2022). Factor analysis of "7·22" debris flow disaster in a deep water trough of the Niuxin Mountain in the central segment of the Qilian Mountains. Gansu Water Resour. Hydropower Technol. 58 (05), 44–48. (In Chinese). doi:10.19645/j.issn2095-0144.2022.05.009
Dai, C. X. (2010). The distribution and change of sediment from the upper part of the Heihe River. Gansu Water Conservancy Hydropower Technol. 46 (6), 3–4. (In Chinese).
Deng, H., Pepin, N. C., and Chen, Y. (2017). Changes of snowfall under warming in the Tibetan Plateau. J. Geophys. Res. Atmos. 122 (14), 7323–7341. doi:10.1002/2017JD026524
Ding, B., Yang, K., Qin, J., Wang, L., Chen, Y., and He, X. (2014). The dependence of precipitation types on surface elevation and meteorological conditions and its parameterization. J. Hydrol. 513, 154–163. doi:10.1016/j.jhydrol.2014.03.038
Fathian, F., Ghadami, M., Haghighi, P., Amini, M., Naderi, S., and Ghaedi, Z. (2020). Assessment of changes in climate extremes of temperature and precipitation over Iran. Theor. Appl. Climatol. 141 (3-4), 1119–1133. doi:10.1007/s00704-020-03269-2
Gao, B., Qin, Y., Wang, Y., Yang, D., and Zheng, Y. (2015). Modeling ecohydrological processes and spatial patterns in the upper Heihe Basin in China. Forests 7 (1), 10. doi:10.3390/f7010010
Gou, Q., Guo, W., Li, Y., Liu, J., and Wang, G. (2022). Dynamic changes in soil moisture in three typical landscapes of the Heihe River Basin. Front. Environ. Sci. 10, 1049883. doi:10.3389/fenvs.2022.1049883
Han, C., Chen, R., Liu, J., Yang, Y., and Qin, W. (2010). A discuss of the separating solid and liquid precipitations. J. Glaciol. Geocryol. 32 (2), 249–256. (In Chinese with English abstract).
Han, Z., Long, D., Fang, Y., Hou, A., and Hong, Y. (2019). Impacts of climate change and human activities on the flow regime of the dammed Lancang River in Southwest China. J. Hydrol. 570, 96–105. doi:10.1016/j.jhydrol.2018.12.048
He, Q., Yang, J., Chen, H., Liu, J., Ji, Q., Wang, Y., et al. (2021). Evaluation of extreme precipitation based on three long-term gridded products over the Qinghai-Tibet Plateau. Remote Sens. 13 (15), 3010. doi:10.3390/rs13153010
Karl, T. R., and Easterling, D. R. (1999). Climate extremes: Selected review and future research directions. Clim. Change. 42 (1), 309–325. doi:10.1023/A:1005436904097
Kendall, M. G. (1934). Rank correlation methods. Br. J. Psychol. 25 (1), 86–91. doi:10.1111/j.2044-8295.1934.tb00727.x
Li, D., Lu, X. X., Yang, X., Chen, L., and Lin, L. (2018). Sediment load responses to climate variation and cascade reservoirs in the Yangtze River: A case study of the jinsha river. Geomorphology 322, 41–52. doi:10.1016/j.geomorph.2018.08.038
Liang, X., Wood, E. F., and Lettenmaier, D. P. (1996). Surface soil moisture parameterization of the VIC-2L model: Evaluation and modification. Glob. Planet. Change. 13 (1-4), 195–206. doi:10.1016/0921-8181(95)00046-1
Liu, B., Tao, H., Song, C., Guo, B., Shi, Z., Zhang, C., et al. (2013). Temporal and spatial variations of rainfall erosivity in China during 1960 to 2009. Geogr. Res. 32 (002), 245–256. (In Chinese with English abstract). doi:10.11821/yj2013020005
Luo, J., Chen, H., and Zhou, B. (2020). Comparison of snowfall variations over China identified from different snowfall/rainfall discrimination methods. J. Meteorol. Res. 34 (5), 1114–1128. doi:10.1007/s13351-020-0004-z
Luo, K., Tao, F., Deng, X., and Moiwo, J. P. (2017). Changes in potential evapotranspiration and surface runoff in 1981-2010 and the driving factors in Upper Heihe River Basin in Northwest China. Hydrol. Process 31 (1), 90–103. doi:10.1002/hyp.10974
Ma, M., and Frank, V. (2006). Interannual variability of vegetation cover in the Chinese Heihe River Basin and its relation to meteorological parameters. Int. J. Remote Sens. 27 (16), 3473–3486. doi:10.1080/01431160600593031
Malik, A., and Kumar, A. (2020). Spatio-temporal trend analysis of rainfall using parametric and non-parametric tests: Case study in uttarakhand, India. Theor. Appl. Climatol. 140 (1-2), 183–207. doi:10.1007/s00704-019-03080-8
Mann, H. B. (1945). Nonparametric tests against trend. Econometrica 13 (3), 245–259. doi:10.2307/1907187
Mello, C. R. D., Alves, G. J., Beskow, S., and Norton, L. D. (2020). Daily rainfall erosivity as an indicator for natural disasters: Assessment in mountainous regions of southeastern Brazil. Nat. Hazards. 103 (1), 947–966. doi:10.1007/s11069-020-04020-w
MOWR (Ministry of Water Resources of the People's Republic of China) (1975). Chapter 2: Observing of precipitation. Handbook for hydrologic investigation. Beijing: Water Resources and Electric Power Press.
IPCC (2014). “Climate change 2014: Synthesis report,” in Contribution of working groups I, II and III to the fifth assessment report of the intergovernmental panel on climate change core writing Team. Editors R. K. Pachauri, and L. A. Meyer (Geneva, Switzerland: J. Roman. Stud.), 151.
Pan, X., Li, X., Cheng, G., Li, H., and He, X. (2015). Development and evaluation of a river-basin-scale high spatio-temporal precipitation data set using the WRF model: A case study of the Heihe River Basin. Remote Sens. 7 (7), 9230–9252. doi:10.3390/rs70709230
Pan, X., Li, X., Yang, K., He, J., Zhang, Y., and Han, X. (2014). Comparison of downscaled precipitation data over a mountainous watershed: A case study in the Heihe River Basin. J. Hydrometeorol. 15 (4), 1560–1574. doi:10.1175/JHM-D-13-0202.1
Panagos, P., Ballabio, C., Borrelli, P., Meusburger, K., Klik, A., Rousseva, S., et al. (2015). Rainfall erosivity in europe. Sci. Total Environ. 511, 801–814. doi:10.1016/j.scitotenv.2015.01.008
Pettitt, A. N. (1979). A non-parametric approach to the change-point problem. J. R. Stat. Soc. 28 (2), 126–135. doi:10.2307/2346729
Piao, S., Ciais, P., Huang, Y., Shen, Z., Peng, S., Li, J., et al. (2010). The impacts of climate change on water resources and agriculture in China. Nature 467 (7311), 43–51. doi:10.1038/nature09364
Qin, C., Yang, B., Burchardt, I., Hu, X., and Kang, X. (2010). Intensified pluvial conditions during the twentieth century in the inland Heihe River Basin in arid northwestern China over the past millennium. Glob. Planet. Change. 72 (3), 192–200. doi:10.1016/j.gloplacha.2010.04.005
Refsgaard, J. C., Seth, S. M., Bathurst, J. C., Erlich, M., Storm, B., Chandra, S., et al. (1992). Application of the SHE to catchments in India Part 1. General results. J. Hydrol. 140, 1–23. doi:10.1016/0022-1694(92)90232-K
Song, X., Liao, J., Xue, X., and Ran, Y. (2020). Multi-sensor evaluating effects of an ecological water diversion project on land degradation in the Heihe River Basin, China. Front. Environ. Sci. 8, 152. doi:10.3389/fenvs.2020.00152
Su, B., Xiao, C., Chen, D., Huang, Y., Che, Y., Zhao, H., et al. (2022). Glacier change in China over past decades: Spatiotemporal patterns and influencing factors. Earth-Sci. Rev. 226, 103926. doi:10.1016/j.earscirev.2022.103926
Tabari, H. (2020). Climate change impact on flood and extreme precipitation increases with water availability. Sci. Rep. 10 (1), 13768. doi:10.1038/s41598-020-70816-2
Thiessen, A. H. (1911). Precipitation averages for large areas. Mon. Weather Rev. 39 (7), 1082–1089. doi:10.1175/1520-0493(1911)39<1082b:PAFLA>2.0.CO;2
Wang, B., Bao, Q., Hoskins, B., Wu, G., and Liu, Y. (2008). Tibetan Plateau warming and precipitation changes in East Asia. Geophys. Res. Lett. 35, L14702. doi:10.1029/2008GL034330
Wang, J. (2015). Landuse/landcover data of the Heihe River Basin in 2000. National Tibetan Plateau Data Center. doi:10.3972/heihe.039.2014.db
Wang, J., Zhang, M., Wang, S., Ren, Z., Che, Y., Qiang, F., et al. (2016). Decrease in snowfall/rainfall ratio in the Tibetan Plateau from 1961 to 2013. J. Geogr. Sci. 26, 1277–1288. doi:10.1007/s11442-016-1326-8
Wang, K., Cheng, G., Xiao, H., and Jiang, H. (2004). The westerly fluctuation and water vapor transport over the Qilian-Heihe valley. Sci. China. Ser. D, Earth Sci. 47 (S1), 32–38. doi:10.1360/04yd0004
Wigmosta, M. S., Vail, L. W., and Lettenmaier, D. P. (1994). A distributed hydrology-vegetation model for complex terrain. Water Resour. Res. 30 (6), 1665–1679. doi:10.1029/94WR00436
Wu, F., Zhan, J., Wang, Z., and Zhang, Q. (2015). Streamflow variation due to glacier melting and climate change in upstream Heihe River Basin, Northwest China. Phys. Chem. Earth 79-82, 11–19. doi:10.1016/j.pce.2014.08.002
Wubaye, G. B., Gashaw, T., Worqlul, A. W., Dile, Y. T., Taye, M. T., Haileslassie, A., et al. (2023). Trends in rainfall and temperature extremes in Ethiopia: Station and agro-ecological zone levels of analysis. Atmosphere 14 (3), 483. doi:10.3390/atmos14030483
Xiong, J., Yong, Z., Wang, Z., Cheng, W., Li, Y., Zhang, H., et al. (2019). Spatial and temporal patterns of the extreme precipitation across the Tibetan Plateau (1986–2015). Water 11, 1453. doi:10.3390/w11071453
Yang, J., Huang, Y., Li, G., and Li, Y. (2023). Changes of extreme precipitation in the middle and lower reaches of the Yangtze River and their correlation with atmospheric circulation. Front. Earth Sci. 11, 220. doi:10.3389/feart.2023.1162220
Yanos, M. H. A. (2022). Analysis of rainfall variability in the province of quirino. J. Environ. Sci. Econ. 1 (2), 44–50. doi:10.56556/jescae.v1i2.20
Yao, T., Bolch, T., Chen, D., Gao, J., Immerzeel, W., Piao, S., et al. (2022). The imbalance of the Asian water tower. Nat. Rev. Earth Environ. 3 (10), 618–632. doi:10.1038/s43017-022-00299-4
Yao, T., Xue, Y., Chen, D., Chen, F., Thompson, L., Cui, P., et al. (2019). Recent third pole's rapid warming accompanies cryospheric melt and water cycle intensification and interactions between monsoon and environment: Multidisciplinary approach with observations, modeling, and analysis. Bull. Amer. Meteorol. Soc. 100 (3), 423–444. doi:10.1175/BAMS-D-17-0057.1
You, Q., Kang, S., Aguilar, E., and Yan, Y. (2008). Changes in daily climate extremes in the eastern and central Tibetan Plateau during 1961–2005. J. Geophys. Res. Atmos. 113, D07101. doi:10.1029/2007JD009389
Zhai, P., Zhang, X., Wan, H., and Pan, X. (2005). Trends in total precipitation and frequency of daily precipitation extremes over China. J. Clim. 18 (7), 1096–1108. doi:10.1175/JCLI-3318.1
Zhang, F., Zeng, C., Wang, G., Wang, L., and Shi, X. (2022a). Runoff and sediment yield in relation to precipitation, temperature and glaciers on the Tibetan Plateau. Int. Soil Water Conserv. Res. 10 (2), 197–207. doi:10.1016/j.iswcr.2021.09.004
Zhang, F., Zhang, H., Hagen, S. C., Ye, M., Wang, D., Gui, D., et al. (2015). Snow cover and runoff modelling in a high mountain catchment with scarce data: Effects of temperature and precipitation parameters. Hydrol. Process. 29 (1), 52–65. doi:10.1002/hyp.10125
Zhang, H., Immerzeel, W. W., Zhang, F., de Kok, R. J., Chen, D., and Yan, W. (2022b). Snow cover persistence reverses the altitudinal patterns of warming above and below 5000 m on the Tibetan Plateau. Sci. Total Environ. 803, 149889. doi:10.1016/j.scitotenv.2021.149889
Zhang, W., Xie, Y., and Liu, B. (2002). Rainfall erosivity estimation using daily rainfall amounts. Sci. Geogr. Sin. 22 (6), 705–711. (In Chinese with English abstract). doi:10.3969/j.issn.1000-0690.2002.06.012
Zhang, Y., Xu, C., Hao, Z., Zhang, L., Ju, Q., and Lai, X. (2020). Variation of melt water and rainfall runoff and their impacts on streamflow changes during recent decades in two Tibetan Plateau basins. Water 12 (11), 3112. doi:10.3390/w12113112
Keywords: precipitation-type discrimination, threshold temperature, climate change, extreme rainfall, the upper Heihe River Basin, the Tibetan Plateau
Citation: Wang G, Zhang F, Wang L, Zeng C, Shi X and Xiao X (2023) Precipitation-type discrimination and changes in related climate indices in the upper Heihe River Basin during 1960–2021. Front. Environ. Sci. 11:1202895. doi: 10.3389/fenvs.2023.1202895
Received: 09 April 2023; Accepted: 24 May 2023;
Published: 08 June 2023.
Edited by:
Sifan A. Koriche, Baylor University, United StatesReviewed by:
Haijun Deng, Fujian Normal University, ChinaCheng Sun, Beijing Normal University, China
Copyright © 2023 Wang, Zhang, Wang, Zeng, Shi and Xiao. This is an open-access article distributed under the terms of the Creative Commons Attribution License (CC BY). The use, distribution or reproduction in other forums is permitted, provided the original author(s) and the copyright owner(s) are credited and that the original publication in this journal is cited, in accordance with accepted academic practice. No use, distribution or reproduction is permitted which does not comply with these terms.
*Correspondence: Xiong Xiao, eGlhb3hpb25nQGh1bm51LmVkdS5jbg==