 Md. Mishail Rana1†
 Md. Rashedul Haque
 Md. Mostafizur Rahman
- 1Laboratory of Environmental Health and Ecotoxicology, Department of Environmental Sciences, Jahangirnagar University, Dhaka, Bangladesh
- 2Department of Environmental Sciences, Jahangirnagar University, Dhaka, Bangladesh
Although plastics are being recycled worldwide, a significant amount of plastic is still directly exposed to the environment and, in the end, forms microplastic (MP) particles (<5 mm). Soil is a significant sink for plastic waste. Thus, MP is considered an emerging threat to terrestrial ecosystems. Among several sources, organic fertilizer can be a potential source of MP to contaminate agricultural soils. Therefore, it is hypothesized that commercial organic fertilizer acts as a carrier of MP to agricultural soils in Bangladesh. Hence, 18 organic fertilizers were collected from different local markets in Bangladesh and subjected to the following available MP separation/extraction techniques. Then, a series of experimental steps were conducted, such as microscopic inspection, identification through Fourier-transform infrared spectroscopy (FTIR), scanning electron microscope (SEM), and energy-dispersive X-ray analysis (EDAX), to identify and characterize MP. The data were analyzed statistically using both qualitative and quantitative approaches. On average, 1,529.62 ± 420.2 MP items/kg of organic fertilizer were detected in the study, ranging from 433.33 ± 152.75 items/kg to 3,466.67 ± 1,357.69 items/kg in different organic fertilizers. The size range of 0.5 mm–1.00 mm (30%) was predominant among five different size ranges. The fiber was dominant over various shapes, and seven colors were observed, with black being the most prevalent. Overall, in a year, 971.31–1,387.37 items/m3 area was introduced through organic fertilizer to land. These MPs further contaminate soil biota and groundwater by their distribution pattern. According to the polymer hazard index (PHI), pollution load index (PLI), and potential ecological risk index (PERI), this organic fertilizer belongs to hazard categories III, V, and extreme danger, respectively. This study clearly explains the presence of MP in commercially available organic fertilizers and their probable effects. This could be applicable in further policy planning to reduce contaminants in formulating organic fertilizers.
1 Introduction
Plastic is increasingly used daily for its remarkable properties (strong, durable, lightweight, and versatile) and affordability (van Cauwenberghe et al., 2015; Haque et al., 2023). Each year, at least 14 million tons of plastic end up in the oceans, and nearly 10 million tons are terrestrial plastic debris (Löhr et al., 2017). Plastic recycling has increased significantly, yet most plastics are still exposed to the environment (He et al., 2018). Due to inadequate end-of-life treatment, plastics are increasingly found as environmental pollutants. Plastics released into the environment degrade gradually and form microplastics (MP) (Chico-Ortiz et al., 2020; Bajt, 2021). The most accepted size range for MP is 1 µm−5 mm (Hartmann et al., 2019). MP contamination is a global issue as they get released everywhere (Alimba and Faggio, 2019).
Water and soil act as major pollutant reservoirs. In the case of MP, soil can store more plastic than oceans. For this reason, MP is considered an emerging threat to terrestrial ecosystems (Hurley and Nizzetto, 2018). In our planet’s topsoil, the main origin of MP is littering (Chia et al., 2021). MP can enter lands via wastewater-filtered solids, sewage sludge, runoff, etc. Different types of plastic products, including packaging products and containers, are used in agricultural activity. Degradation of plastic products may also contribute to the intrusion of MP in farmlands.
Organic fertilizer is also responsible for soil contamination (Nasir Khan, 2018). The use of organic fertilizers has dramatically increased in Bangladesh. Many companies are manufacturing organic fertilizers commercially in Bangladesh. Organic fertilizers are made of animal manure, plant manure, agricultural residues, etc. These raw materials get contaminated with plastic materials and contribute to plastic pollutants in organic fertilizer manufacturing. While manufacturing, the type of plants and operating conditions significantly influence the residual contamination of organic manure and compost with plastic particles (Steiner et al., 2022). In farmlands, organic manures are considered an emerging contributor to MP (Zhang et al., 2022).
MP can alter plant growth, the inherent properties of soil, and the activity of microbial communities along with their composition (Wang et al., 2022). MP in the soil also causes reduced root diameter. Soil bulk density reduction directly affects MP and alters soil pore, structure, and water transportation (Leifheit et al., 2021). MP contains different toxic additives, directly harming soil biota (Kim et al., 2020). The potentially stabilized carbon and soil structure is improved by arbuscular mycorrhizal fungi (AMF) (Rillig and Mummey, 2006; Verbruggen et al., 2016). AMF can be affected by pollutants (Cabello, 1997; Joner and Leyval, 2003; Leifheit et al., 2021). By facilitating the accumulation of organic pollutants and heavy metals through earthworms, highly concentrated (>0.5%, w/w) small-sized MP poses severe damage to earthworms (Cui et al., 2022).
Groundwater aquifers can be affected by the vertical transportation of MP from farmland soil, which can be detrimental to aquifer microorganisms and groundwater drinkers (Khant and Kim, 2022). MP intrusion in drinking water can pose potential health hazards in the form of particle/chemical/biofilms (Kirstein et al., 2021). Plant roots can also uptake MP while the cropland groundwater is contaminated by MP particles (De Souza MacHado et al., 2018; Natesan et al., 2021). MP can enter the food chain through plant uptake and microbial activity (Igalavithana et al., 2022). Soil manifests several potential exposure pathways for nanoplastics to organisms and human health, including groundwater aquifer contamination (Hurley and Nizzetto, 2018).
MP has been identified in organic fertilizers in different countries (Weithmann et al., 2018; Xu et al., 2022; Zhang et al., 2022). However, in Bangladesh, previous research is yet to be performed on MP in available organic fertilizers. As organic fertilizer can be a means for the intrusion of MP into the soil, this intrusion can result in several serious problems, so research was required on this topic. Therefore, this study aimed to 1) identify, quantify, and characterize MP in organic fertilizer; 2) assess the potential MP contribution of organic fertilizer to agricultural land, along with the distribution path of MP in agricultural land; and 3) assess ecological risk appraisal.
2 Methodology
2.1 Study area and sample collection
Eighteen samples were collected from shops and nurseries from different places in Dhaka. Dhaka is the capital of Bangladesh, which is situated in South Asia. It is one of the most populated and fastest-growing megacities in the world. More than 1 kg of fertilizer was available for purchase. So, 18 kg of 18 different samples were purchased for further analysis. The samples were first carried to the Environmental Health and Ecotoxicology Laboratory of Jahangirnagar University. After reaching the laboratory, these samples were stored at −4°C for further analysis. Supplementary Table S1 consists of the basic description of the collected samples.
2.2 Sample preparation and extraction process
First, each sample packet was cut and properly mixed separately to make it homogenous. After making it homogenous, 50 g of organic fertilizer was measured with the help of electrical balance from each sample and kept in different glass beakers fully covered with foil paper to protect it from atmospheric contamination. Then, the samples were oven-dried at 60°C (Parvin et al., 2022; Haque et al., 2023). After completely drying, the samples were cooled to room temperature. After cooling, 10 g from each sample was measured and kept in another Pyrex glass beaker with proper labeling. Up to 100 mL hydrogen peroxide (Merck, Germany) was added to each sample to digest the organic matter of the samples. Different organic fertilizers have different ratios of organic portions. This is why the addition of hydrogen peroxide was different for different samples. Among them, S.18 required more than 100 mL of hydrogen peroxide to digest its entire organic portion. After digestion, the beakers were kept undisturbed for 48 h to allow the semi-solid fractions to settle to the bottom. Then, the liquid from the upper layer of the beaker was collected through a pipette and filtered using 0.45-μm Whatman microfiber glass filter paper. Then, each filter paper was stored in a different Petri dish with a given appropriate sample number and preserved for further analysis. The semi-solid portion of each beaker underwent a density separation process. First, it was stirred with 40 mL of ZnCl2 solution (d = 1.7 g/mL) for 30 min and kept undisturbed again for 48 h to allow the semi-solid fractions to settle to the bottom (Parvin et al., 2022; Haque et al., 2023). Then, the upper layer of the liquid was again collected through a pipette and filtered using 0.45-μm Whatman microfiber glass filter paper. This filter paper was also stored in a different Petri dish with an appropriate sample number and preserved for further analysis.
2.3 MP inspection with a stereo microscope
The probable MP particles found in the sample filter paper were observed using a stereo microscope (Leica EZ4 W and EZ4 E), and pictures were captured for further analysis. The size of the MP particles was measured using ImageJ software (version 2022). Based on the morphology, the particles were divided into fiber, fragment, foam, film, and pellet. They were also divided into the following seven categories according to their color: red, black, white, blue, brown, green, and transparent. According to their size, MP particles were divided into the following five classes: class 1: <0.5 mm; class 2 (0.5 mm–1.00 mm); class 3 (1.01 mm–2.00 mm); class 4 (2.01 mm–3.00 mm); and class 5 (3.01 mm–5.00 mm). The quantity, morphology, color, and size of the MP particles in each sample were recorded very carefully.
2.4 MP inspection with FTIR analysis
First, a few representative samples were selected randomly and then analyzed by Fourier-transform infrared (FTIR) spectroscopy (IRPrestige-21) to identify the polymer types. The selected MP sample represented the total MP identified visually. First, the MP samples were mixed with the KBr crystal, and KBr pellets were prepared. Generally, MP was distributed on a KBr crystal. The measurement was completed in transmission mode in a wavenumber range of 400–4,000 cm−1 (Tanaka and Takada, 2016; Jabeen et al., 2017). Each polymer absorption band was identified using Spectra Base™ databases, an accessible online spectral repository from John Wiley & Sons, Inc. Since relying only on the automated library databases may lead to false identification, it compared to absorption bands of each polymer reported in the literature (Jung et al., 2018; Haque et al., 2023).
2.5 SEM and EDAX data extraction
The MP sample was placed on the carbon plate under the microscope to capture high-resolution images for further analysis of micro and nanoparticle imaging characterization and to identify the elemental composition of materials. Extracted representative samples were chosen for the analysis.
2.6 MP hazard assessment
2.6.1 MP contribution to agricultural soil by fertilizer
The following equation estimates the contribution of MP from fertilizer to the soil:
Here,
Here, CR indicates the contribution rate,
2.6.2 Polymer hazard index
MP content and chemical composition are evaluated to assess the possible hazard of MP in organic fertilizer. The chemical toxicity of various polymers is used to assess the environmental impact of MP. The following equation is used to calculate the polymer hazard index:
Here, Pn is the percentage of specific polymer types, and Hs is the hazard score for specific polymer types (Supplementary Table S2) based on Lithner et al. (2011).
2.6.3 Pollution load index
The pollution load index (PLI) is often used worldwide to calculate the pollution load index. The PLI is calculated from the following equation that is based on Hakanson. (1980):
Here,
2.6.4 Potential ecological risk index
The potential ecological risk (PERI) for MP in fertilizers is now a prime concern worldwide. However, no specific equation for calculating the potential ecological risk from MP in organic fertilizer exists. The following equation is used for the calculation. This terminology is based on Hakanson (1980).
Here,
The target hazard quotient (THQ) is calculated by the total percentages of particular polymers in the overall sample
2.7 Statistical analysis
Microsoft Excel 2020 was used for calculating the standard deviation, average, stack diagram, pie chart, and error. FTIR and other graphs were prepared with the help of Origin Pro 2020.
2.8 Quality control
Cotton latex gloves and cotton test suits were used to avoid contamination during analytical procedures. The apparatus used in this analysis was plastic-free. All apparatus were first cleaned with distilled water, rather than oven-dried, to make them free from contamination. During sample digestion, density separation, filtering, filter paper preservation, SEM, EDAX, and FTIR were performed with care to ensure the sample was free from contamination. Moreover, blank samples and multiple samples (n = 3) were analyzed for each sampling location to ensure the best quality analysis.
3 Results and discussion
3.1 Abundance of MP in different samples
MP was found in every organic fertilizer sample. On average, 1,529.62 ± 420.2 items/kg MP was found from the analysis. Among all 18 samples, Mazim Agro fertilizer (S.12) was found to have a significant concentration of MP, which was 3,466.67 ± 1,357.69 items/kg, and the least amount of MP was found in M/S L.P. Enterprises vermicompost (S.8) with an abundance of 433.33 ± 152.75 items/kg (Figure 1).
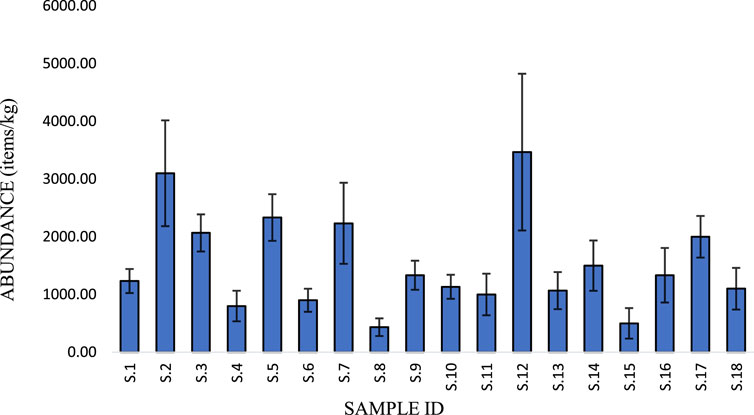
FIGURE 1. Microplastic (MP) abundance in different organic fertilizer samples.
No previous study took place on this topic in Bangladesh. Recently, research was conducted on MP in agricultural lands of Bangladesh, in which MP abundance was higher than the abundance found in this study (Hossain et al., 2023). However, the presence of highly abundant MP in organic fertilizer indicates that increased organic fertilizer usage can be a significant reason behind MP pollution in agricultural land. According to this study, the abundance of MP particles in organic fertilizers found in Bangladesh fluctuates widely from the abundance of MP particles in organic fertilizers from other countries found in previous studies. In China (organic fertilizer), it was 4.70 times higher (Zhang et al., 2022); in Mexico (chicken feces), it was 84.85 times less (Huerta Lwanga et al., 2017); in Ireland (sewage sludge), it was 12.80 times less (Mahon et al., 2017). These MP particles may be derived from the raw component used to create organic compost. Organic fertilizer is mainly composted animal manure, compost, sewage sludge, food industry wastes, vermicompost, and municipal organic wastes. This raw material may be contaminated with plastic or MP as plastic material has a long life. Once it is in the environment, plastic wastes can slowly degrade and produce a large amount of tiny plastic debris due to physical, chemical, and biological processes and form MP (Zhang et al., 2021). MP ultimately mixes with soil, groundwater, and surface water and deteriorates the surface water quality (Haque et al., 2023), properties of soil (Leifheit et al., 2021), soil biota (Kim et al., 2020), and groundwater quality (Khant and Kim, 2022). These reservoirs also transfer MP to the human food chain (Parvin et al., 2021; Haque et al., 2023). It may cause several hazardous effects on humans and the biota. Necessary steps should be taken to solve this issue quickly to secure our existence.
3.2 Characteristics of MP found in organic fertilizer
3.2.1 Color detection
Analyzing all samples, a total of seven different colored MP particles were found, i.e., black, blue, white, green, red, transparent, and brown (Figure 2).
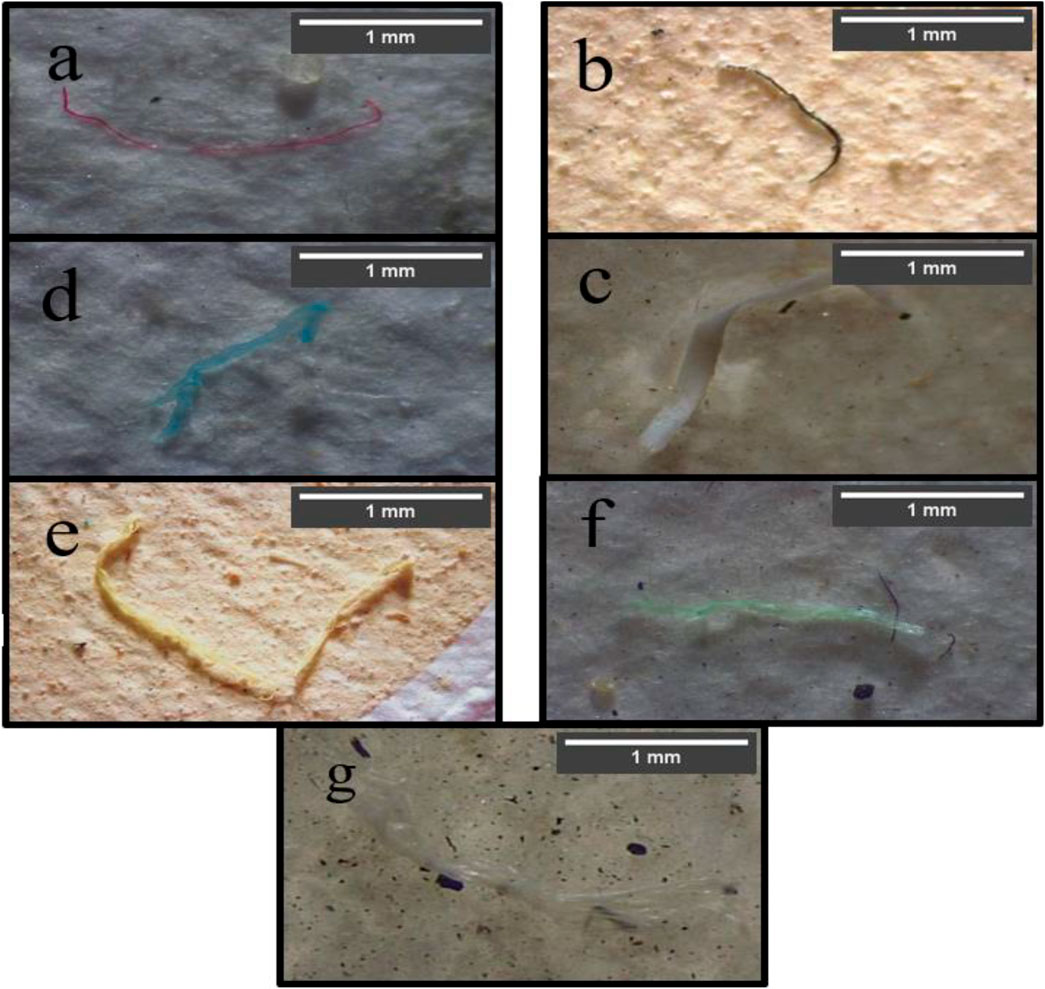
FIGURE 2. Images of different microplastic (MP) colors. Here, (A) indicates red; (B) indicates black; (C) indicates white; (D) indicates blue; (E) indicates brown; (F) indicates green; and (G) indicates transparent.
The most abundant color found was black (42%), and the least abundant color was brown (5%). The distribution pattern was black (42%) > blue (22%) > white (11%) > green (7%) > red (7%) > transparent (6%)>brown (5%). The occurrence of green and red showed the same percentage. However, in actual quantity, the abundance of green (2,033.33 items/kg) was slightly higher than that of red (1,866.67 items) (Figure 3B). Among the 18 samples, only five contain all seven colors, i.e., S.5, S.7, S.9, S.10, and S.12. Black and blue MPs were found in each sample. Only four different colors were found in sample S.15, i.e., black, white, blue, and brown. The appearance of several colors in every sample indicates that the intrusion of MP in organic fertilizers comes from various sources. Based on different samples, black varied from 21.88% to 59.68%; blue varied from 11.76% to 40.00%; white varied from 0% to 31.25%; green varied from 0% to 23.08%; red varied from 0% to 15.71%; transparent varied from 0% to 25.93%; and brown varied from 0% to 16.67% (Figure 3A).
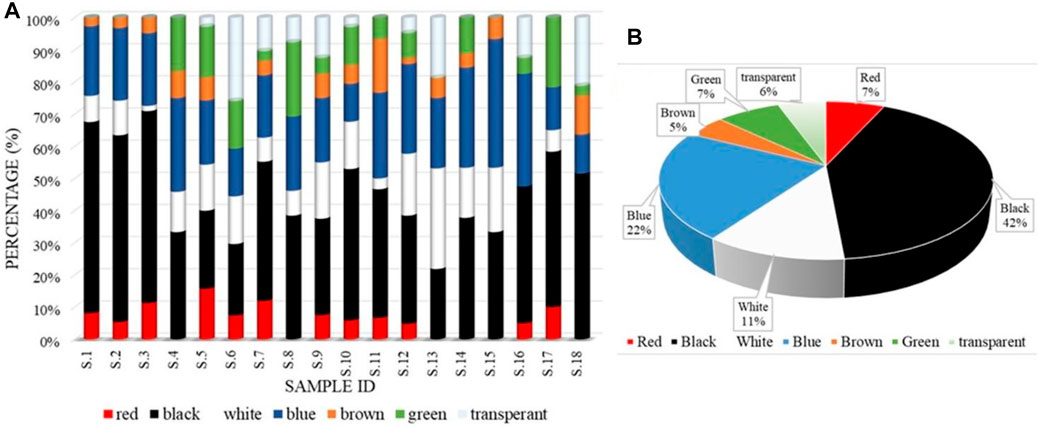
FIGURE 3. Percentage of different color appearances in (A) different samples and (B) total microplastic (MP).
vColor is an important inherent property of plastic material. Depending upon its use, color variation occurs on plastic materials. MP occurs from the slow degradation of plastic material (Piarulli et al., 2019). The color variation on MP is mainly derived from the variation of color in plastic materials. Colors are created in plastic using different types of dye, especially chemical dye, for its low cost and availability. Chemical dyes contain different types of hazardous elements that harm humankind when ingested (Lellis et al., 2019). However, significant discoloration occurs in the transition from plastic to MP. Significant color variation in MP has already been observed (Afrin et al., 2020; Haque et al., 2023; Hossain et al., 2023). MP color may also mislead soil biota to consume it as food like other aquatic organisms (Haque et al., 2023). This way, it may also hamper the human body by entering the food web. A recent study stated that black plastics are the least recycled and most released into the environment. So, this could be a reason for black being the most abundant color. On the other hand, the study also claimed that black plastics might contain many toxic additives (Huang and Xu, 2022). So, organic fertilizers of Bangladesh may pose more threats to soil biota as these fertilizers contain MPs that are significantly black in color.
3.2.2 Size detection
MP was segregated into a total of five different sizes, i.e., <0.5 mm, 0.5–1.00 mm, 1.01–2.00 mm, 2.01–3.00 mm, and 3.01–5.00 mm, in their size variation (Figure 4).
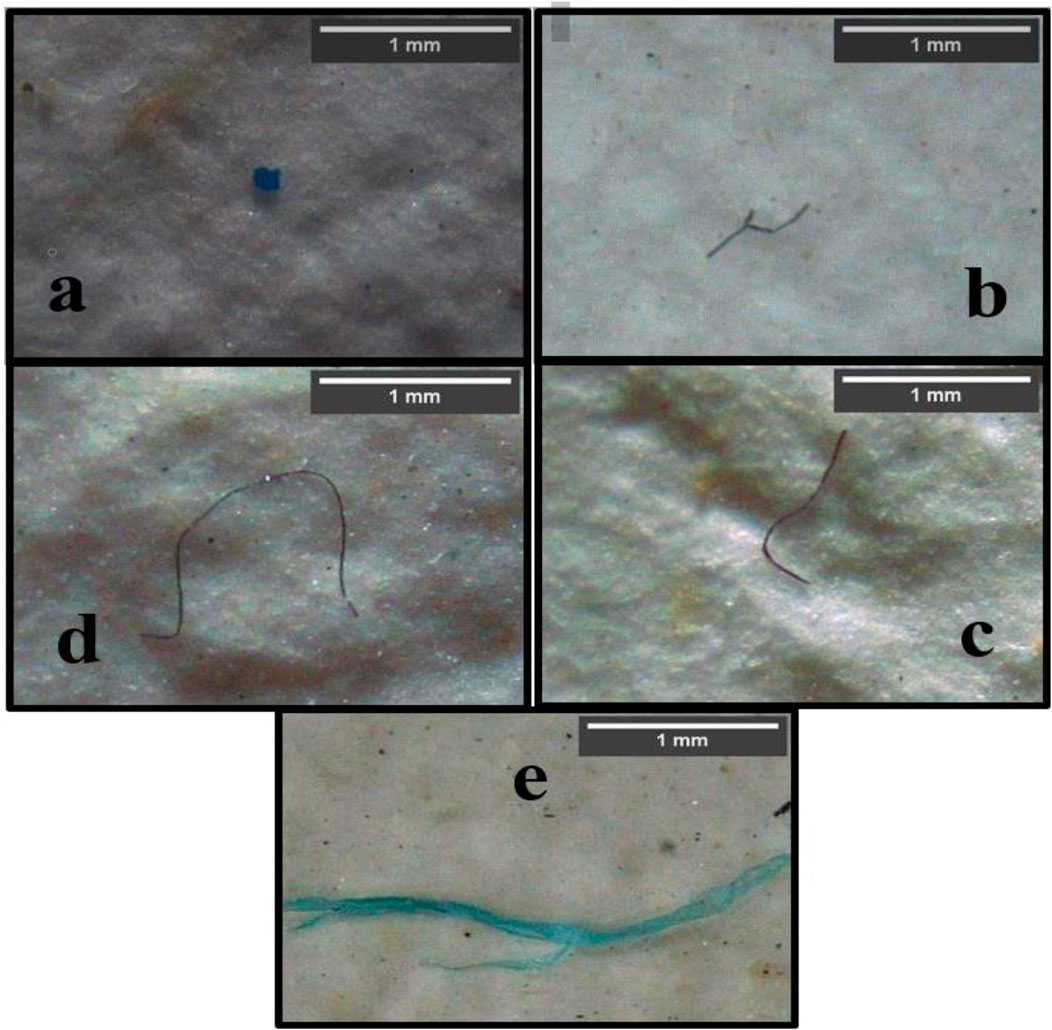
FIGURE 4. Images of microplastic (MP) in different size ranges. Here, (A) indicates a size range of “<0.5 mm;” (B) indicates a size range of “0.5–1.00 mm;” (C) indicates a size range of “1.01–2.00 mm;” (D) indicates a size range of “2.01–3.00 mm;” and (E) indicates a size range of ‘3.01–5.00 mm.
The 0.5 mm–1.00 mm size range (30%) was the most dominant here. The least abundant size range was 3.01–5.00, with an abundance of only 9%. The distribution pattern was 0.5 mm–1.00 mm (30%) > 1.01 mm–2.00 mm (26%) > less than 0.5 mm (22%) > 2.01 mm–3.00 mm (13%) > 3.01 mm–5.00 mm (9%) (Figure 5B). All the size ranges were found in most of the samples. No MP was found in the size range of 3.01 mm–5.00 mm′ in S.1, S.8, S.11, and S.18. The size range of 2.01 mm–3.00 mm was missing in S.13, and <5 mm was missing in sample S.15. Depending on different samples, the size range of <5 mm varied from 0% to 34.41%; the size range of 0.5 mm–1.00 mm varied from 16.13% to 54.55%; the size range of 1.01 mm–2.00 mm varied from 11.76% to 40.00%; size range of 2.01 mm–3.00 mm varied from 0% to 26.67%; and size range of 3.01 mm–5.00 mm varied from 0% to 25.00%. The highest variation was found in the range of 0.5 mm–1.00 mm, and the lowest variation was found in the range of 3.01–5.00 mm (Figure 5A).
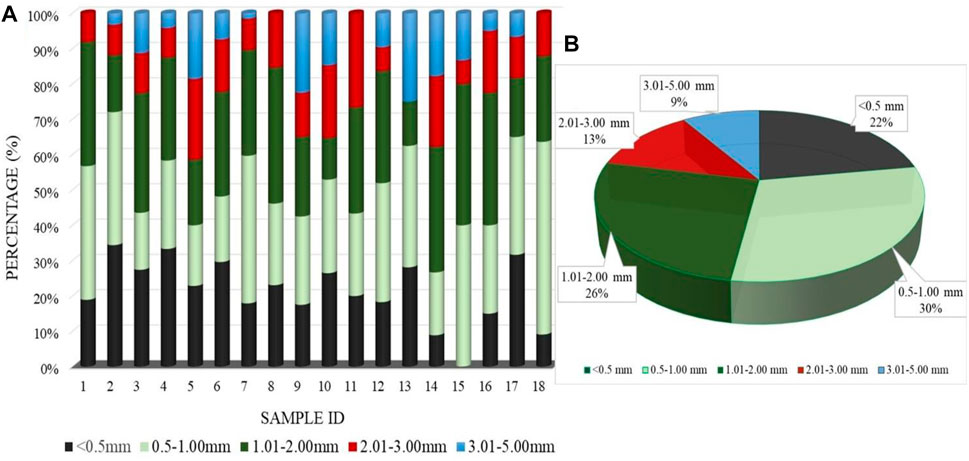
FIGURE 5. Size variation percentages in (A) different samples and (B) the total microplastic (MP).
MPs form from different degradation processes of plastic material (Zhang et al., 2021). However, in this process, all MP particles do not break down into similar sizes. MP size varieties are already found in several studies (Afrin et al., 2020; Haque et al., 2023; Hossain et al., 2023). In this study, the range of 0.5–1.00 mm is predominant. Moreover, in a study in China, the range of 2.00–5.00 mm is predominant in organic fertilizers from bio-waste fermentation and composting (Weithmann et al., 2018). The smaller the particle size, the greater the threat potential. So, fertilizers from Bangladesh can pose an earlier threat than fertilizers from China.
3.2.3 Morphology type detection
A total of five different morphology types were found in the analysis, namely, fibers, fragments, film, foam, and pellets in various shapes (Figure 6).
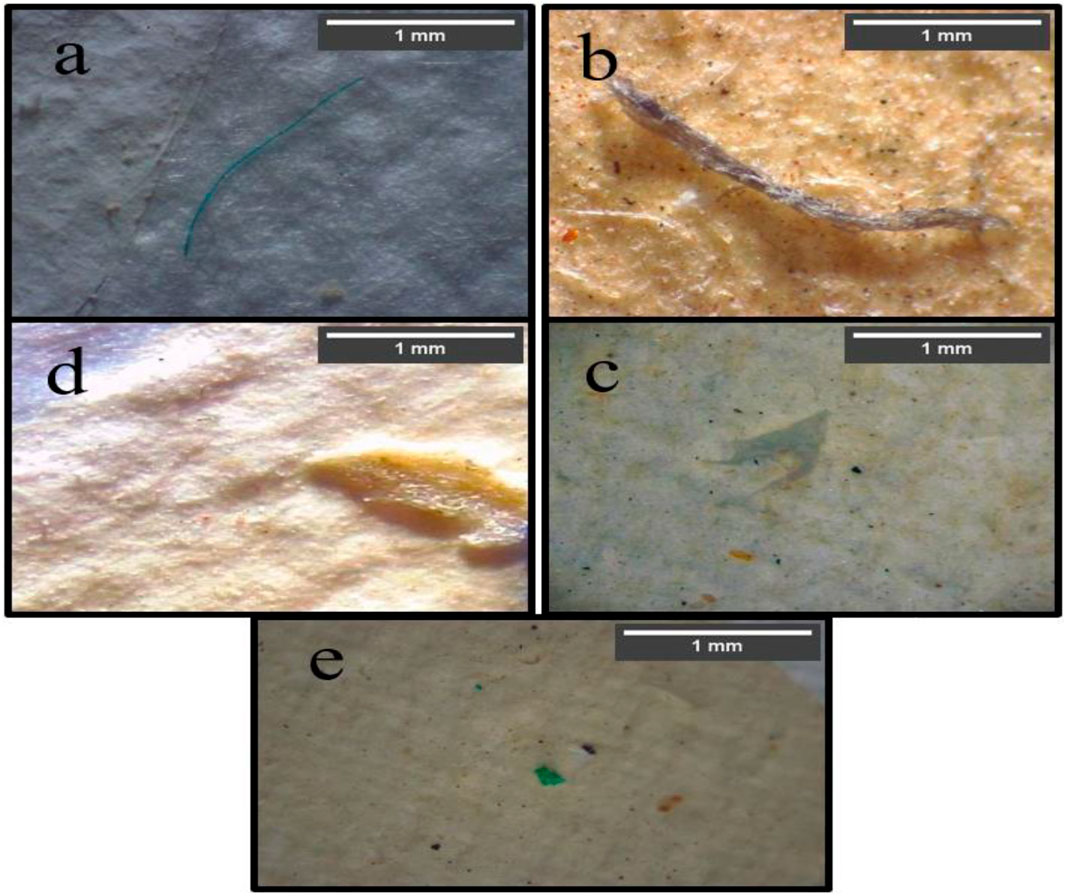
FIGURE 6. Images of different microplastic (MP) morphology types. Here, (A) indicates fiber; (B) indicates fragment; (C) indicates film; (D) indicates foam; and (E) indicates pellet.
Fiber was the most abundant (57%) among them, and foam was found to be the least abundant (5%). The distribution pattern was fiber (57%) > fragment (19%)> film (11%) > pellet (8%) > foam (5%) (Figure 7B). Fiber and fragments were found in every sample. Among the 18 samples, pellets were found in 15 samples, film was found in 14 samples, and foams were found in 12 samples only. Depending on different samples, the occurrence of fiber varied from 26.67% to 79.03%; the occurrence of fragment varied from 7.53% to 44.44%; the occurrence of pellet varied from 0% to 30.77%; the occurrence of film varied from 0% to 27.27%, and occurrence of foam varied from 0% to 22.5%. The highest variation was found in fibers, and the lowest was found in films. The lowest limit of fiber occurrence is greater than the highest limit of foam occurrence. In every sample, fibers were predominant compared to foams (Figure 7A).
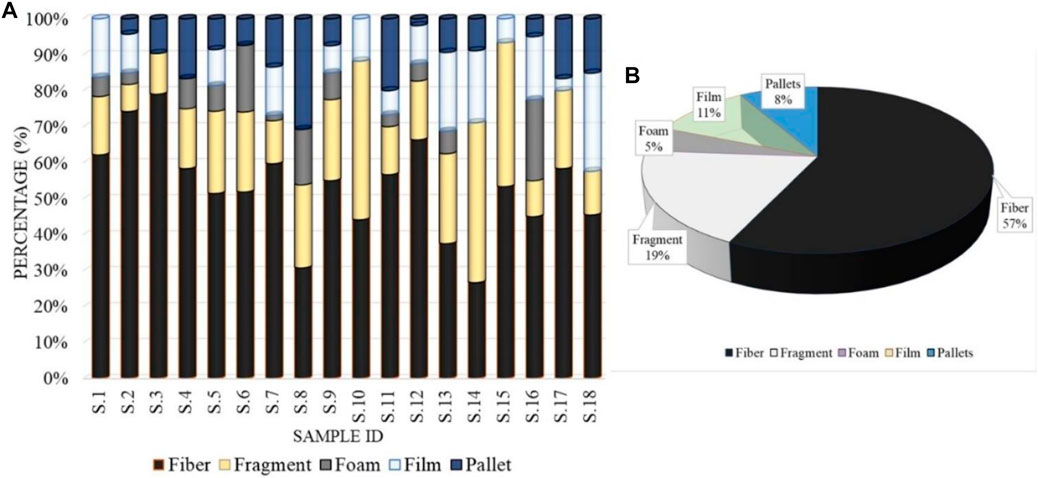
FIGURE 7. Morphology variation percentages in (A) different samples and (B) the total microplastic (MP).
Plastic materials also deformed into various types of morphology (Afrin et al., 2020; Haque et al., 2023; Hossain et al., 2023). This study shows that fiber is most abundant in organic fertilizer. However, from a study on MP in agricultural fields in Bangladesh, fragments are found to be predominant in agricultural soils (Himu et al., 2022). So, MP may intrude into the agricultural lands from many more diverse sources. Moreover, MP shape or morphological structure is also an important factor in carrying additives or acting as a vector. The large surface area may carry a large number of additives on it. Fiber, fragment, foam, and film surfaces vary from MP to MP. The foam material can also easily absorb additives on it.
3.3 Chemical composition of MP by FTIR
FTIR spectroscopy was applied to examine the chemical composition of these plastics. From the samples of organic fertilizer, a representative sample set was selected for FTIR analysis. The chemical composition distribution pattern revealed the presence of HDPE (27.78%), LDPE (22.22%), ABS (16.67%), nitrile (5.55%), EVA (11.11%), nylon (5.55%), and unidentified (11.11%). The distribution pattern was HDPE > LDPE > ABS > EVA > nitrile and nylon (Figure 8).
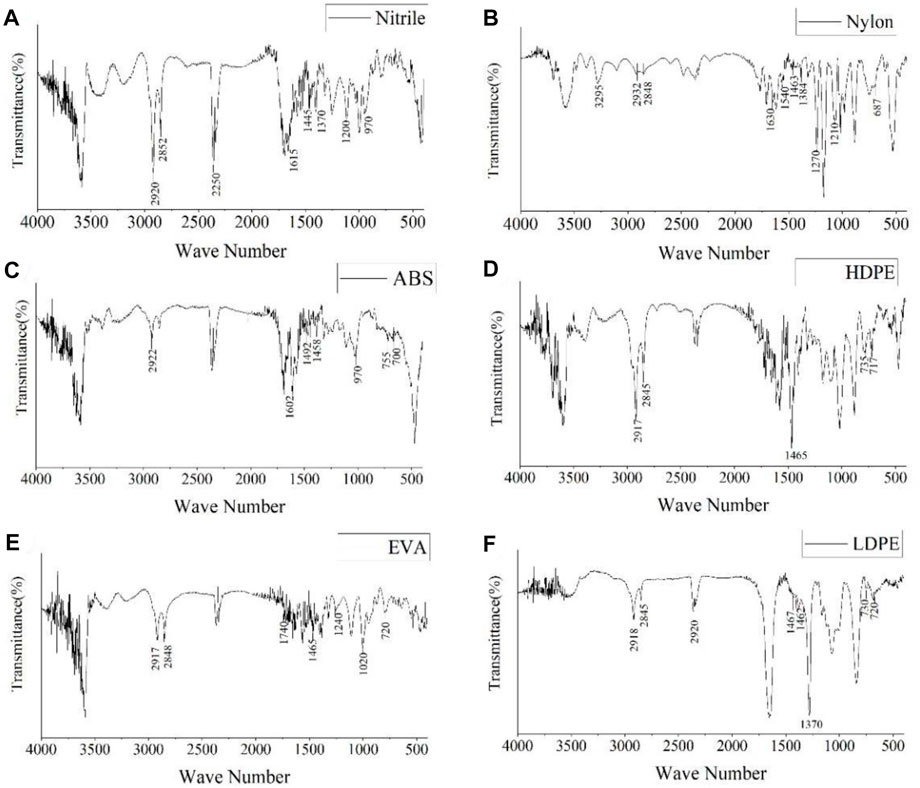
FIGURE 8. Detected polymer types of microplastic (MP) in organic fertilizer. Here (A) Nitrile, (B) Nylon, (C) ABS, (D) HDPE (E) EVA and (F) LDPE.
Figure 8 illustrates the FT-IR spectra of the identified MP in the samples. In nitrile, characteristic peaks were found at wavenumbers 2,920 cm−1, 2,852 cm−1, 2,250 cm−1, 1,615 cm−1, 1,445 cm−1, 1,370 cm−1, 1,200 cm−1, and 970 cm−1, while eight distinct LDPE peaks were found. These wavenumbers show the existence of =C-H stretching for peaks at 2,920 cm−1 and 2,852 cm−1; CN stretches for peaks at 2,250 cm−1; C=C stretch for peaks at 1,615 cm−1; CH2 bending vibration at peaks 1,445 cm−1, 1,370 cm−1, and 1,200 cm−1; and =CH-H bending vibration at peaks 970 cm−1 (Figure 8A) (Verleye et al., 2001; Haque et al., 2022). In nylon (Figure 8B), characteristic peaks were found at wavenumbers 3,295 cm−1, 2,932 cm−1, 2,848 cm−1, 1,630 cm−1, 1,540 cm−1, 1,463 cm−1, 1,270 cm−1, 1,210 cm−1, and 687 cm−1. These wavenumbers show the existence of N-H stretching at peak 3,290 cm−1; C-H stretching at peaks 2,932 cm−1 and 2,858 cm−1; C=O stretching band at peak 1,630 cm−1; CH2 band at peaks 1,540 and 1,463 cm−1; N-H band at peak 1,270 cm−1; CH2 peak 1,210 cm−1; and C=O stretching at peak 687 cm−1 (Verleye et al., 2001; Noda et al., 2007). The distinctive peaks in acrylonitrile butadiene styrene (ABS) (Figure 8C) were identified at wavenumbers 2,922 cm−1, 1,602 cm−1, 1,492 cm−1, 970 cm−1, 755 cm−1, and 700 cm−1. These wavenumbers show the existence of a C-H stretching band at peak 2,922 cm−1, aromatic ring stretching vibration at peak 1,602 cm−1, CH2 bending vibration at peak 1,492 cm−1, =CH-H bending vibration at peak 970 cm−1, =CH bends at peak 755 cm−1, and aromatic -CH out-of-plane bending at peak 700 cm−1 (Verleye et al., 2001). At wavenumbers 2,917 cm−1, 2,845 cm−1, 1,465 cm−1, 735 cm−1, and 717 cm−1, five distinct HDPE peaks were found (Figure 8D). These wavenumbers show the existence of C-H stretching for peaks at 2,917 cm−1 and 2,845 cm−1; CH2 bending vibration at peak 1,465 cm−1; and CH2 rock at peaks 735 cm−1 and 717 cm−1 (Noda et al., 2007; Chércoles Asensio et al., 2009). In EVA, characteristic peaks were found at wavenumbers 2,917 cm−1, 2,848 cm−1, 1,740 cm−1, 1,465 cm−1, 1,240 cm−1, 1,020 cm−1, and 720 cm−1 (Figure 8E). These wavenumbers show the existence of C-H asymmetric and symmetric stretching vibration, respectively, at peaks 2,917 cm−1 and 2,848 cm−1, C=O stretching band at peak 1,740 cm−1, CH2 band at peak 1,465 cm−1, C (=O) O stretching at peak 1,240 cm−1, and CH2 rock at peak 720 cm−1 (Noda et al., 2007; Chércoles Asensio et al., 2009). In LDPE, characteristic peaks were found at wavenumbers 2,918 cm−1, 2,845 cm−1, 1,467 cm−1, 1,462 cm−1, 730 cm−1, and 720 cm−1, and six distinct LDPE peaks were found (Figure 8F). These wavenumbers show the existence of C-H stretching for peaks at 2,918 cm−1 and 2,845 cm−1, CH2 bending vibration at peaks 1,467 cm−1 and 1,462 cm−1, and CH2 rock at peaks 730 cm−1 and 720 cm−1 (Noda et al., 2007; Chércoles Asensio et al., 2009).
Analyzing a small number of samples makes it hard to accurately predict the most abundant polymer groups in MP. In samples of organic fertilizer, there is a considerable probability that different polymers may be discovered.
3.4 Surface morphology of MP by SEM and EDAX
SEM is generally used to characterize or identify MP through a high-resolution image that neatly shows the surface of MP. Energy-dispersive X-ray analysis is another method that may be used to examine MP for specific elemental composition. EDAX creates the chemical composition of the MP surface, while SEM magnifies and produces high-quality visualizations of the MP surface.
For the SEM examination, randomly representative samples of organic fertilizer were selected. Figure 9 shows SEM and EDAX for representative MP. However, it is very challenging to identify the MP surface. According to the SEM image findings, MP fibers (Figure 9A) were made up of cracks (a.1), flakes (a.2), and linear fractures (a.3). The fragments (Figure 9B) were composed of multiple layers of tiny pieces (b.1), having a rough surface (b.2) and numerous breaks along the edges (b.3) (Haque et al., 2023). Moreover, it has been observed from the SEM images that the MP is sufficiently being converted into nanoplastic particles, which is a significant challenge for us.
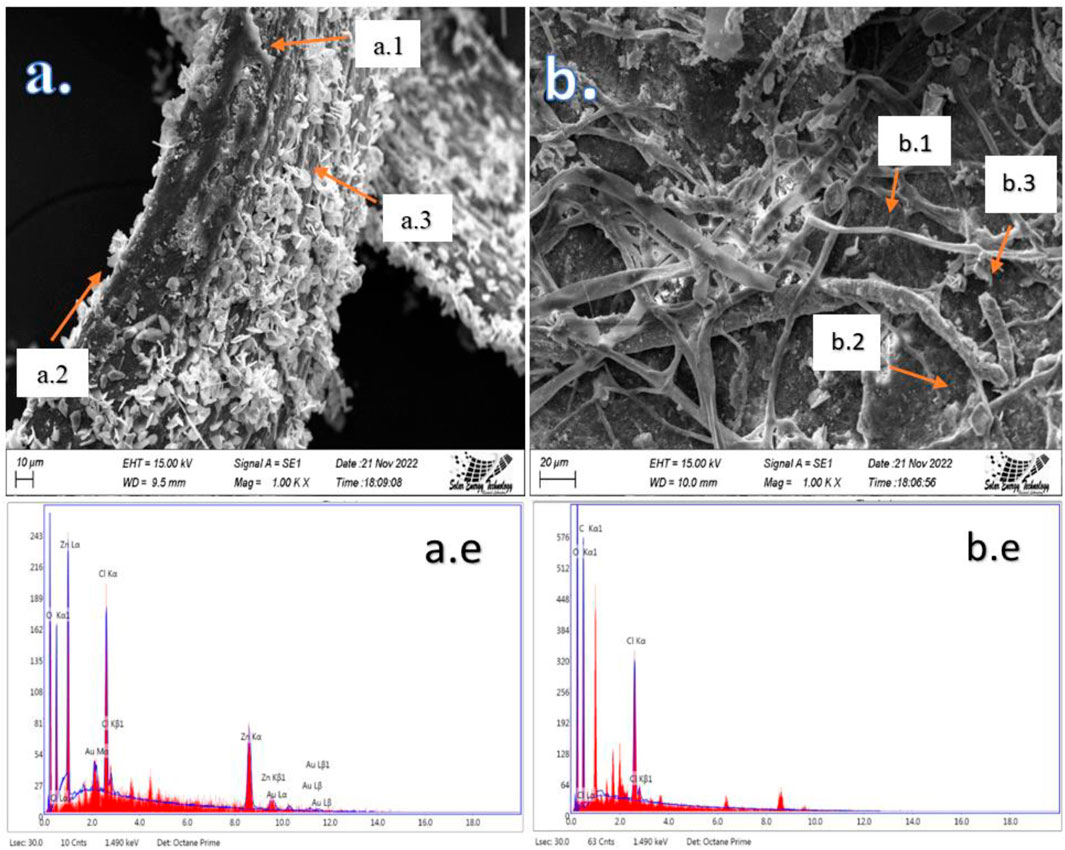
FIGURE 9. Scanning electron microscope (SEM) (A,B) and energy-dispersive X-ray analysis (EDAX) (a.e, b.e) image.
Moreover, there is no doubt that it will have a disastrous impact on human health and the environment. However, in EDAX, K, Au, Zn, Cl, C, and O were found on the surface of the MP particle (Figure 9a.e). K, Cl, C, and O were found on the MP particle surface from Figure 9b.e. These elements are not inherent (except C and O) to MP. These might have come from other environmental/anthropogenic sources. Potassium (K) was predominant in both particles. The existence of these inorganic materials on the surface of the MP was ensured through EDAX. These materials may exist as environmental pollutants and become connected with MP or be additive compounds inside the MP polymer matrix.
MP has been reported to work in tandem with other harmful compounds, acting as a vector for their transmission throughout the environment in several previous studies. As, Cd, Cr, Cu, Mn, Ni, Pb, and Zn are being identified on the surface of microplastics (Koelmans et al., 2016; Wirnkor et al., 2019; Amelia et al., 2021). Heavy metal concentration on the MP surface is also measured using an inductively coupled plasma mass spectrophotometer (ICP-MS) and by inductively coupled plasma-optical emission spectrometry (ICOMS) (Koelmans et al., 2016; Mohsen et al., 2019). MP was also found to serve as a carrier for different organic pollutants such as polychlorinated biphenyls (PCBs) (Heskett et al., 2012), polyaromatic hydrocarbons (PAHs, e.g., fluoranthene and phenanthrene) (Saha et al., 2009), hexachlorocyclohexane isomers (HCHs), dichlorodiphenyltrichloroethane (DDT) and related compounds (Colabuono et al., 2010), hexachlorocyclohexane (HCH) (Heskett et al., 2012), chlordane, cyclodienes, mirex, hexachlorobenzene, and hopanes (Colabuono et al., 2010; Yeo et al., 2017). All of these pollutants are harmful to humankind and the environment (Koelmans et al., 2016; Wirnkor et al., 2019; Amelia et al., 2021).
3.5 Comparison of abundance and characteristics of MP with different existing literature
3.5.1 Comparison of abundance and characteristics of MP in sludge and fertilizer with different existing international literature
The highest amount of MP found in chicken feces in Mexico was 129.8 ± 82.3 × 10³ items/kg (Huerta Lwanga et al., 2017), which is 84.85 times higher than that found in this study. Among four different WWTP effluents from the research in Sweden, MPs were found to be a maximum of 16.7 ± 1.96 × 10³ items/kg (Magnusson and Norén, 2014). Commercial organic fertilizer from China (Xu et al., 2022) contains more MP (9210.4 ± 1743.1 items/kg) than that from Bangladesh. However, another study on organic fertilizer from 22 provinces (differently formulated) in China (Zhang et al., 2022) found it to contain fewer MP (325 ± 511 items/kg) than Bangladeshi commercial fertilizers. Finished sewage sludge compost in China (L. Zhang et al., 2020) was found to be the lowest in MP abundance (254.6 ± 84.1 items/kg) among other research studies conducted by China in compost/sludge/organic fertilizers. Both biowaste composting plant and biowaste digestion plant samples showed less abundance (Weithmann et al., 2018). Fibers were the most predominant in most of the research, whereas black MPs were most predominant in two different samples, including this study. PE was found to be the most predominant in several studies. However, this study found HDPE to be predominant in polymer types in organic fertilizers of Bangladesh. This study’s most dominant size range was 0.5–1.00 mm (Table 1).
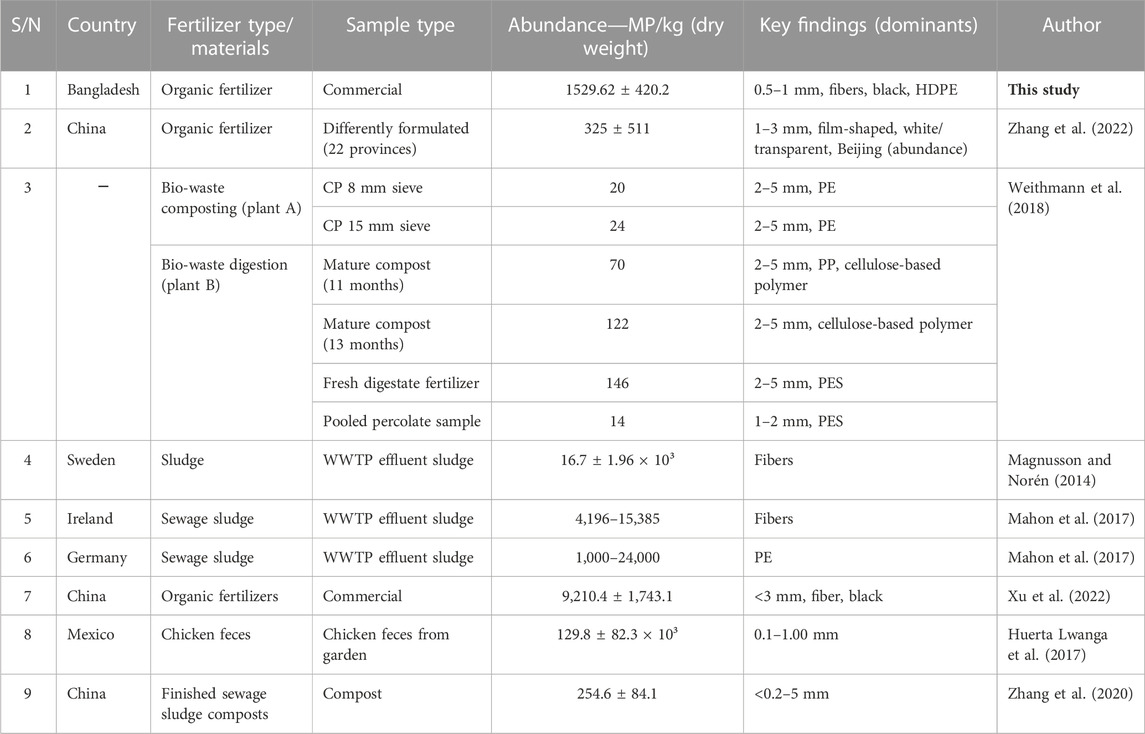
TABLE 1. MP abundance and characteristics with some previous literature on sludge and fertilizer.
3.5.2 Comparison of abundance and characteristics of MP in groundwater and soil reservoirs with different existing literature
A wide range of fluctuations in the abundance of MP was found in the coastline soils of Shandong Province, China (1.3–14,712.5 items/kg) (Q. Zhou et al., 2018). MP abundance in soils of tidal freshwater wetlands was found to be 1,270 ± 150 items/kg in Washington, United States (Helcoski et al., 2020). In a study from Sydney, Australia, 300 to 6,900 items/kg of MP were found in the soil of an industrial area (Fuller and Gautam, 2016). These three different studies provide evidence that MP is available in different types of soils.
The occurrence of MP in farmland soil in a suburb, agricultural soil, farmland with no direct anthropogenic plastic pollution, mulching cropped soils, non-mulching cropped soils, the soil of croplands, the soil of pastures, and Mayan home gardens was detected with an abundance of 107 items/kg (Zhang et al., 2022), 40.35 mg/kg (0.9–2.00 mm) (Li et al., 2020), 20 to 110 items/kg (Feng et al., 2020), 571.2 items/kg (B. Zhou et al., 2020), 262.7 items/kg (B. Zhou et al., 2020), 306 ± 360 items/kg (Corradini et al., 2019), and 184 ± 266 items/kg (Fuller and Gautam, 2016) respectively. So, it can be said that farm/agricultural/gardening soils are getting polluted by MP particles. Among all of the agricultural lands regarding MP contamination (Table 2), Bangladeshi agricultural land shows contamination many times higher than that in other regions (Hossain et al., 2023).
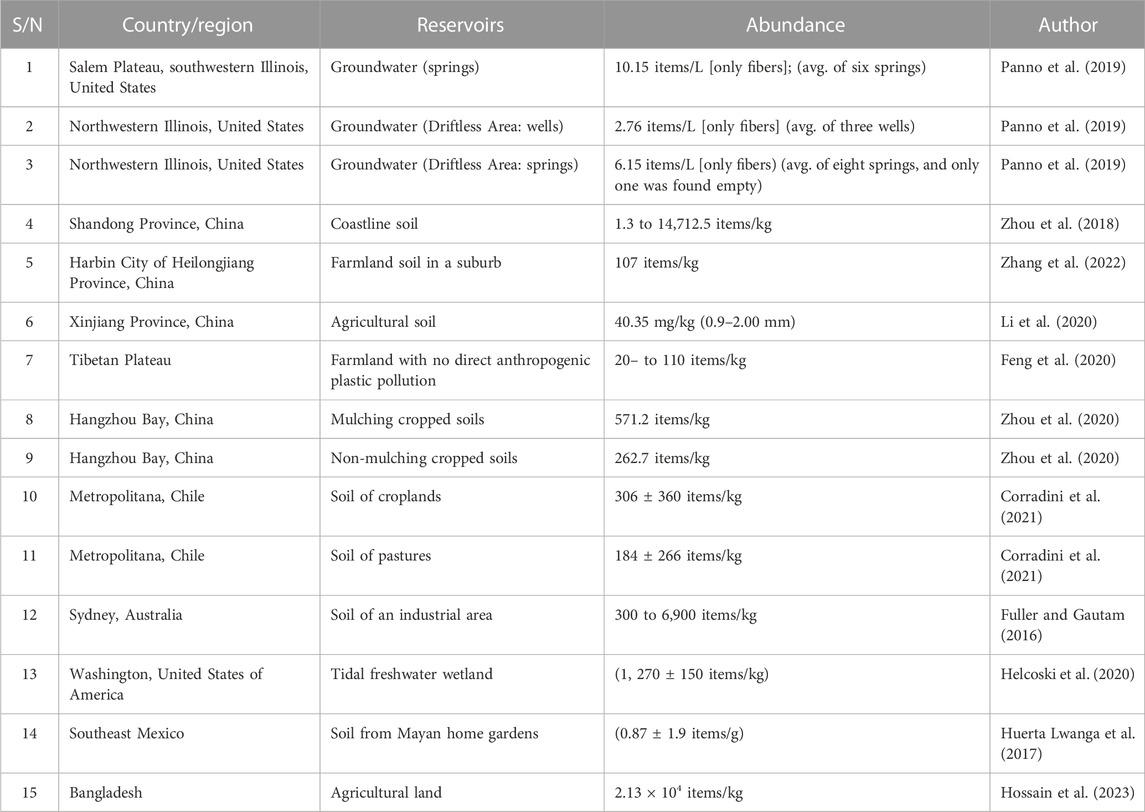
TABLE 2. Comparison of MP abundance and characteristics with some previous literature on soil and groundwater reservoirs.
Groundwater (springs) in Salem Plateau, southwestern Illinois, United States, was found to be contaminated by 10.15 items/L (avg. of six springs) MP particle fibers. The study detected MP in groundwater from northwestern Illinois, United States, containing 2.76 items/L [only fibers] (avg. of three wells) MP particles in the Driftless Area (wells) and 6.15 items/L [only fibers) (avg. of eight springs) MP particles in the Driftless Area (springs) (Panno et al., 2019).
3.6 MP contribution to agricultural soil by fertilizer
MP contribution to the soil by organic fertilizer is calculated by Eqs 1, 2. The highest number of MPs contributed to agricultural land is from S.12 (2,201.34–31,44.27 items/m3) and the lowest from S.8 (275.16–393.03 items/m3). The average MP contribution from organic fertilizer to agricultural land was 971.31–1,387.37 particles kg/m3. The average contribution rate is 0.005% (Supplementary Table S3).
3.6.1 Proposed mechanism for transmission of microplastics from organic fertilizers
Analyzing previous studies from Tables 1, 2 on MP contamination revealed that organic fertilizers/fertilizer materials (sludge), agricultural soil, and groundwater aquifers can be contaminated with MP particles. In this study, several pieces of evidence have been provided; commercial organic fertilizers in Bangladesh are contaminated with MP particles.
Organic fertilizers are widely used worldwide to enrich the nutrients of agricultural land. This fertilizer helps the farmers grow more products on their land. When the organic fertilizer is mixed with agricultural land, it contaminates the soil with its inherent MP properties. After being mixed with the soil, it also bioaccumulates with other toxic additives, especially heavy metals. Being carriers of different toxic elements makes MP more harmful than before. Then, they affect the soil properties, especially soil biota (De Souza MacHado et al., 2018; Kim et al., 2020). Soil biota, through their burrowing operations, especially earthworms, can directly consume tiny plastics, produce secondary MP, and introduce MP into the soil. Size-selective movement of MP by earthworms (L. terrestris) from the soil surface into their burrows indicates that the biogenic transport of MP inside soils may be a source of contamination for groundwater and the terrestrial food chain (Huerta Lwanga et al., 2017). It is also mixed with groundwater by several natural hydrologic processes, soil migration, surface runoffs, and anthropogenic sources, particularly industrial activities (Panno et al., 2019; Chia et al., 2021; Natesan et al., 2021). MP is also found in different fruits (Oliveri Conti et al., 2020), vegetables (Oliveri Conti et al., 2020), and rice (Y. Dong et al., 2020; Y; Liu et al., 2022; Wu et al., 2022). By consuming rice and vegetables and drinking water, MP enters the human food chain (Figure 10). These MPs cause devastating effects on soil biota (Kim et al., 2020), aquatic organisms (Haque et al., 2023), and ultimately, the human body (Blackburn and Green, 2022). However, currently, there are no policies and guidelines for handling MP. Considering its adverse effects on us, the decision-makers should come forward and make decisions to minimize its contamination.
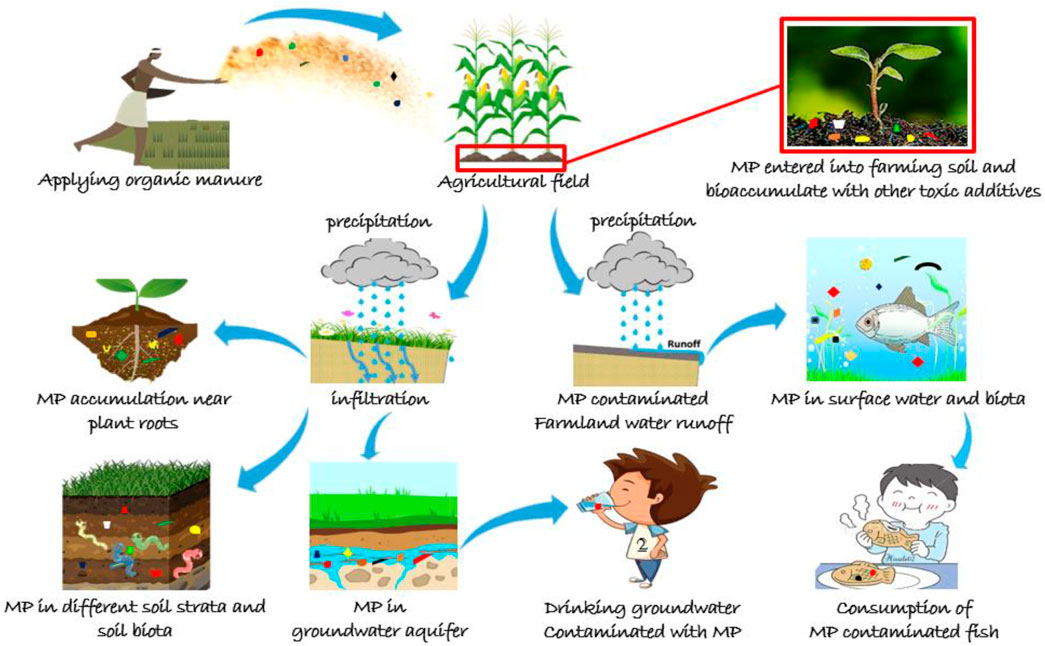
FIGURE 10. Graphical illustration of the entry of microplastic (MP) into the soil, soil biota, groundwater aquifer, and human body from organic fertilizers through agricultural activity.
3.7 Ecological risk assessment
MPs are ingested by different aquatic organisms (fish, crabs, and snails) (Haque et al., 2023), soil biota (Kim et al., 2020), different animals (Huerta Lwanga et al., 2017), and ultimately, humans (Leslie et al., 2022). This causes several devastating impacts on the human body and biotic organisms, including physical stress and damage, apoptosis, necrosis, inflammation, oxidative stress, and immunological stress (Yee et al., 2021; Blackburn and Green, 2022; Haque et al., 2023). MP is composed of different types of monomers that contain different hazardous materials. It can significantly hamper the biotic components of the earth. The chemical constituents of more than 50% of plastics are dangerous according to a hazard-ranking framework based on the United Nations’ Globally Harmonized System of categorizing and labeling chemicals (Lithner et al., 2011). Ecological risk is calculated based on PHI, PLI, and PERI parameters. The terminology used in this calculation is given in Table 3.
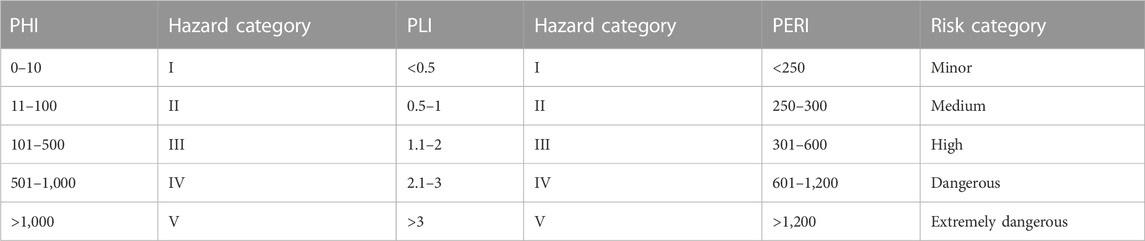
TABLE 3. Terminology used to explain the MP pollution hazard category criteria.
3.7.1 Polymer hazard index
The polymer hazard index is calculated based on the chemical composition of MP found in organic fertilizer. Eq. 3 is used for calculating the polymer hazard index. According to this study, the risk posed by organic fertilizer is in category V (Supplementary Table S4).
3.7.2 Pollution load index
The pollution load index is often a useful tool to measure the risk from any specific pollutant. MP is an emerging pollutant in the world. No specific rules for calculating the pollution load index from MP pollutants exist. Eqs 4, 5 are used for calculating the pollution load index. According to the pollution load index, all fertilizers are in the range 1–3. It belongs to hazard categories III and IV. On average, it belongs to hazard category III (Supplementary Table S5).
3.7.3 Potential ecological risk
The PERI is calculated to identify the potential threat from MP toward the environment. Eqs 6, 7 are used for calculating the PERI. According to the PERI, all fertilizers pose extreme danger to the environment. None of them is safe from MP hazards (Supplementary Table S5).
MP from organic fertilizer can threaten the soil ecosystem in different ways. First, when MPs are introduced into agricultural land, they alter important soil properties such as soil organic matter content, soil water-holding capacity (De Souza MacHado et al., 2018; De Souza Machado et al., 2019), soil pH (Dong et al., 2019; Yang et al., 2021), soil nutrient cycle (H. Liu et al., 2017; Rillig, 2018), groundwater recharge cycle (Panno et al., 2019; Chia et al., 2021; Natesan et al., 2021), and soil biota (Kim et al., 2020; Kumar et al., 2020). Soil pH could be changed by MP chemical composition. PA and HDPE have been found to increase the pH of the soil (Yang et al., 2021), while PS and PTFE can lower it (Dong et al., 2019). HDPE has been detected in fertilizer, which will alter the pH of soil. The soil nutrient cycle is altered by MP. H. Liu et al. (2017) reported that MP could increase the breakdown of organic matter, ultimately increasing soil nutrient (C, N, P, and K) deposition. Moreover, MPs themselves are a significant reservoir of carbon. Therefore, increasing the amount of MPs in soil with organic fertilizer will increase soil carbon (Rillig, 2018). MP largely affects the microbial community of soil. Kumar et al. (2020) suggested that microbial population is proportional to MP concentration. Moreover, another study on MP chemical composition suggests that PE and PVC significantly decrease the microbial community population, and the decreasing rate is higher for PE (Fei et al., 2020). MP can also serve as a habitat for microorganisms and decomposers (Yu et al., 2022). Altering these soil properties also hampers crop and plant production. It also causes delayed or lowered seed germination, slows plant growth, modifies root characteristics, lowers biomass, delays and lowers fruit yield, conflicts with photosynthesis, and induces oxidative damage and genotoxicity (Qi et al., 2018; Hernández-Arenas et al., 2021; Yu et al., 2022). Moreover, MP also acts as a carrier of different hazardous materials (Haque et al., 2023). The combined effect of that pollutant is also devastating for the ecosystem.
4 Conclusion
MP pollution has become a crucial topic of concern in the present world. This research reveals the presence of MP in every organic fertilizer manufactured in Bangladesh and its potential ecological risk with the distribution pathway. In addition to this study, the general features of MP, such as their abundance, size range, color variety, morphology types, and any potentially toxic additives, were also observed. On average, 1,529.62 ± 420.2 items/kg MP were detected in the study, ranging from 433.33 ± 152.75 items/kg to 3,466.67 ± 1,357.69 items/kg in different organic fertilizers. The polymer types found in the analysis are nylon, nitrile, EVA, HDPE, LDPE, and ABS. Different elements were found in EDAX of the MP surface; among them, potassium (k) was dominant. This study determines that MP contribution to agricultural land from organic fertilizer is 971.31–1,387.37 items/m3 area. The potential ecological risk posed by organic fertilizer was in the extremely dangerous category. Moreover, the MP vector for different pollutant characteristics makes the ecological risk more hazardous. Different dedicated studies are required on source analysis of MP in organic fertilizer to identify the specific source of these MPs in organic fertilizer and the vector characteristics of MP. This MP pollutant in organic fertilizer must be mitigated as soon as possible for the welfare of soil quality, production of crops, and human health. Therefore, more regulations must be implemented to reduce or prohibit the introduction of MP in commercial organic fertilizer production, and MP contamination must be routinely examined before commercialization.
Data availability statement
The original contributions presented in the study are included in the article/Supplementary Material; further inquiries can be directed to the corresponding author.
Author contributions
MRn: conceptualization, study design, sample collection, chemical analysis, and drafting of the manuscript. MH: conceptualization, study design, sample collection, chemical analysis, drafting the manuscript, manuscript writing, and revising. ST: sample collection, chemical analysis, and drafting of the manuscript. MRh: conceptualization, study area selection, analysis, study design, and supervision of the whole study. All authors contributed to the article and approved the submitted version.
Conflict of interest
The authors declare that the research was conducted in the absence of any commercial or financial relationships that could be construed as a potential conflict of interest.
Publisher’s note
All claims expressed in this article are solely those of the authors and do not necessarily represent those of their affiliated organizations, or those of the publisher, the editors, and the reviewers. Any product that may be evaluated in this article, or claim that may be made by its manufacturer, is not guaranteed or endorsed by the publisher.
Supplementary material
The Supplementary Material for this article can be found online at: https://www.frontiersin.org/articles/10.3389/fenvs.2023.1205603/full#supplementary-material
References
Afrin, S., Uddin, M. K., and Rahman, M. M. (2020). Microplastics contamination in the soil from urban landfill site, Dhaka, Bangladesh. Heliyon 6 (11), e05572. doi:10.1016/J.HELIYON.2020.E05572
Alimba, C. G., and Faggio, C. (2019). Microplastics in the marine environment: Current trends in environmental pollution and mechanisms of toxicological profile. Environ. Toxicol. Pharmacol. 68, 61–74. doi:10.1016/J.ETAP.2019.03.001
Amelia, T. S. M., Khalik, W. M. A. W. M., Ong, M. C., Shao, Y. T., Pan, H. J., and Bhubalan, K. (2021). Marine microplastics as vectors of major ocean pollutants and its hazards to the marine ecosystem and humans. Prog. Earth Planet. Sci. 8 (1), 12–26. doi:10.1186/S40645-020-00405-4
Bajt, O. (2021). From plastics to microplastics and organisms. FEBS Open Bio 11 (4), 954–966. doi:10.1002/2211-5463.13120
Blackburn, K., and Green, D. (2022). The potential effects of microplastics on human health: What is known and what is unknown. Ambio 51 (3), 518–530. doi:10.1007/S13280-021-01589-9
Cabello, M. N. (1997). Hydrocarbon pollution: Its effect on native arbuscular mycorrhizal fungi (AMF). FEMS Microbiol. Ecol. 22 (3), 233–236. doi:10.1111/J.1574-6941.1997.TB00375.X
Chércoles Asensio, R., San Andrés Moya, M., De La Roja, J. M., and Gómez, M. (2009). Analytical characterization of polymers used in conservation and restoration by ATR-FTIR spectroscopy. Anal. Bioanal. Chem. 395 (7), 2081–2096. doi:10.1007/S00216-009-3201-2
Chia, R. W., Lee, J. Y., Kim, H., and Jang, J. (2021). Microplastic pollution in soil and groundwater: A review. Environ. Chem. Lett. 19 (6), 4211–4224. doi:10.1007/S10311-021-01297-6
Chico-Ortiz, N., Mahu, E., Crane, R., Gordon, C., and Marchant, R. (2020). Microplastics in Ghanaian coastal lagoon sediments: Their occurrence and spatial distribution. Regional Stud. Mar. Sci. 40, 101509. doi:10.1016/J.RSMA.2020.101509
Colabuono, F. I., Taniguchi, S., and Montone, R. C. (2010). Polychlorinated biphenyls and organochlorine pesticides in plastics ingested by seabirds. Mar. Pollut. Bull. 60 (4), 630–634. doi:10.1016/J.MARPOLBUL.2010.01.018
Corradini, F., Meza, P., Eguiluz, R., Casado, F., Huerta-Lwanga, E., and Geissen, V. (2019). Evidence of microplastic accumulation in agricultural soils from sewage sludge disposal. Sci. Total Environ. 671, 411–420. doi:10.1016/J.SCITOTENV.2019.03.368
Corradini, F., Casado, F., Leiva, V., Huerta-Lwanga, E., and Geissen, V. (2021). Microplastics occurrence and frequency in soils under different land uses on a regional scale. Sci. Total Environ. 752, 141917. doi:10.1016/J.SCITOTENV.2020.141917
Cui, W., Gao, P., Zhang, M., Wang, L., Sun, H., and Liu, C. (2022). Adverse effects of microplastics on earthworms: A critical review. Sci. Total Environ. 850, 158041. doi:10.1016/J.SCITOTENV.2022.158041
De Souza MacHado, A. A., Lau, C. W., Till, J., Kloas, W., Lehmann, A., Becker, R., et al. (2018). Impacts of microplastics on the soil biophysical environment. Environ. Sci. Technol. 52 (17), 9656–9665. doi:10.1021/acs.est.8b02212
De Souza Machado, A. A., Lau, C. W., Kloas, W., Bergmann, J., Bachelier, J. B., Faltin, E., et al. (2019). Microplastics can change soil properties and affect plant performance. Environ. Sci. Technol. 53 (10), 6044–6052. doi:10.1021/ACS.EST.9B01339
Dong, Z., Zhu, L., Zhang, W., Huang, R., Lv, X. W., Jing, X., et al. (2019). Role of surface functionalities of nanoplastics on their transport in seawater-saturated sea sand. Environ. Pollut. 255 (Pt 1), 113177. doi:10.1016/J.ENVPOL.2019.113177
Dong, Y., Gao, M., Song, Z., and Qiu, W. (2020). Microplastic particles increase arsenic toxicity to rice seedlings. Environ. Pollut. 259, 113892. doi:10.1016/J.ENVPOL.2019.113892
Fei, Y., Huang, S., Zhang, H., Tong, Y., Wen, D., Xia, X., et al. (2020). Response of soil enzyme activities and bacterial communities to the accumulation of microplastics in an acid cropped soil. Sci. Total Environ. 707, 135634. doi:10.1016/J.SCITOTENV.2019.135634
Feng, S., Lu, H., Tian, P., Xue, Y., Lu, J., Tang, M., et al. (2020). Analysis of microplastics in a remote region of the Tibetan Plateau: Implications for natural environmental response to human activities. Sci. Total Environ. 739, 140087. doi:10.1016/J.SCITOTENV.2020.140087
Fuller, S., and Gautam, A. (2016). A procedure for measuring microplastics using pressurized fluid extraction. Environ. Sci. Technol. 50 (11), 5774–5780. doi:10.1021/acs.est.6b00816
Hakanson, L. (1980). An ecological risk index for aquatic pollution control.a sedimentological approach. Water Res. 14 (8), 975–1001. doi:10.1016/0043-1354(80)90143-8
Haque, M. R., Ali, M. M., Ahmed, W., and Rahman, M. M. (2022). Assessment of metal(loid)s pollution in water and sediment from an urban river in Bangladesh: An ecological and health risk appraisals. Case Stud. Chem. Environ. Eng. 6, 100272. doi:10.1016/J.CSCEE.2022.100272
Haque, M. R., Ali, M. M., Ahmed, W., Siddique, M. A. B., Akbor, M. A., Islam, M. S., et al. (2023). Assessment of microplastics pollution in aquatic species (fish, crab, and snail), water, and sediment from the Buriganga River, Bangladesh: An ecological risk appraisals. Sci. Total Environ. 857, 159344. doi:10.1016/J.SCITOTENV.2022.159344
Hartmann, N. B., Hüffer, T., Thompson, R. C., Hassellöv, M., Verschoor, A., Daugaard, A. E., et al. (2019). Are we speaking the same language? Recommendations for a definition and categorization framework for plastic debris. Environ. Sci. Technol. 53 (3), 1039–1047. doi:10.1021/ACS.EST.8B05297
He, D., Luo, Y., Lu, S., Liu, M., Song, Y., and Lei, L. (2018). Microplastics in soils: Analytical methods, pollution characteristics and ecological risks. TrAC Trends Anal. Chem. 109, 163–172. doi:10.1016/J.TRAC.2018.10.006
Helcoski, R., Yonkos, L. T., Sanchez, A., and Baldwin, A. H. (2020). Wetland soil microplastics are negatively related to vegetation cover and stem density. Environ. Pollut. 256, 113391. doi:10.1016/J.ENVPOL.2019.113391
Hernández-Arenas, R., Beltrán-Sanahuja, A., Navarro-Quirant, P., and Sanz-Lazaro, C. (2021). The effect of sewage sludge containing microplastics on growth and fruit development of tomato plants. Environ. Pollut. 268 (Pt B), 115779. doi:10.1016/J.ENVPOL.2020.115779
Heskett, M., Takada, H., Yamashita, R., Yuyama, M., Ito, M., Geok, Y. B., et al. (2012). Measurement of persistent organic pollutants (POPs) in plastic resin pellets from remote islands: Toward establishment of background concentrations for International Pellet Watch. Mar. Pollut. Bull. 64 (2), 445–448. doi:10.1016/J.MARPOLBUL.2011.11.004
Himu, M. M., Afrin, S., Akbor, M. A., Bakar Siddique, M. A., Uddin, M. K., and Rahman, M. M. (2022). Assessment of microplastics contamination on agricultural farmlands in central Bangladesh. Case Stud. Chem. Environ. Eng. 5, 100195. doi:10.1016/J.CSCEE.2022.100195
Hossain, M. N., Rahman, M. M., Afrin, S., Akbor, M. A., Siddique, M. A. B., and Malafaia, G. (2023). Identification and quantification of microplastics in agricultural farmland soil and textile sludge in Bangladesh. Sci. Total Environ. 858, 160118. doi:10.1016/J.SCITOTENV.2022.160118
Huang, Y., and Xu, E. G. (2022). Black microplastic in plastic pollution: Undetected and underestimated? Water Emerg. Contam. Nanoplastics 1 (3), 14. doi:10.20517/WECN.2022.10
Huerta Lwanga, E., Mendoza Vega, J., Ku Quej, V., Chi, J. de los A., Sanchez del Cid, L., Chi, C., et al. (2017). Field evidence for transfer of plastic debris along a terrestrial food chain. Sci. Rep. 7 (1), 14071. doi:10.1038/S41598-017-14588-2
Hurley, R. R., and Nizzetto, L. (2018). Fate and occurrence of micro(nano)plastics in soils: Knowledge gaps and possible risks. Curr. Opin. Environ. Sci. Health 1, 6–11. doi:10.1016/J.COESH.2017.10.006
Igalavithana, A. D., Mahagamage, M. G. Y. L., Gajanayake, P., Abeynayaka, A., Gamaralalage, P. J. D., Ohgaki, M., et al. (2022). Microplastics and potentially toxic elements: Potential human exposure pathways through agricultural lands and policy based countermeasures. Microplastics 1 (1), 102–120. doi:10.3390/MICROPLASTICS1010007
Jabeen, K., Su, L., Li, J., Yang, D., Tong, C., Mu, J., et al. (2017). Microplastics and mesoplastics in fish from coastal and fresh waters of China. Environ. Pollut. 221, 141–149. doi:10.1016/J.ENVPOL.2016.11.055
Joner, E. J., and Leyval, C. (2003). Rhizosphere gradients of polycyclic aromatic hydrocarbon (PAH) dissipation in two industrial soils and the impact of arbuscular mycorrhiza. Environ. Sci. Technol. 37 (11), 2371–2375. doi:10.1021/ES020196Y
Jung, M. R., Horgen, F. D., Orski, S. V., Rodriguez, C. V., Beers, K. L., Balazs, G. H., et al. (2018). Validation of ATR FT-IR to identify polymers of plastic marine debris, including those ingested by marine organisms. Mar. Pollut. Bull. 127, 704–716. doi:10.1016/J.MARPOLBUL.2017.12.061
Khant, N. A., and Kim, H. (2022). Review of current issues and management strategies of microplastics in groundwater environments. Water 14 (7), 1020. doi:10.3390/W14071020
Kim, S. W., Waldman, W. R., Kim, T. Y., and Rillig, M. C. (2020). Effects of different microplastics on nematodes in the soil environment: Tracking the extractable additives using an ecotoxicological approach. Environ. Sci. Technol. 54 (21), 13868–13878. doi:10.1021/ACS.EST.0C04641
Kirstein, I. v., Gomiero, A., and Vollertsen, J. (2021). Microplastic pollution in drinking water. Curr. Opin. Toxicol. 28, 70–75. doi:10.1016/J.COTOX.2021.09.003
Koelmans, A. A., Bakir, A., Burton, G. A., and Janssen, C. R. (2016). Microplastic as a vector for chemicals in the aquatic environment: Critical review and model-supported reinterpretation of empirical studies. Environ. Sci. Technol. 50 (7), 3315–3326. doi:10.1021/acs.est.5b06069
Kumar, M., Xiong, X., He, M., Tsang, D. C. W., Gupta, J., Khan, E., et al. (2020). Microplastics as pollutants in agricultural soils. Environ. Pollut. 265 (Pt A), 114980. doi:10.1016/J.ENVPOL.2020.114980
Leifheit, E. F., Lehmann, A., and Rillig, M. C. (2021). Potential effects of microplastic on arbuscular mycorrhizal fungi. Front. Plant Sci. 12, 626709. doi:10.3389/FPLS.2021.626709
Lellis, B., Fávaro-Polonio, C. Z., Pamphile, J. A., and Polonio, J. C. (2019). Effects of textile dyes on health and the environment and bioremediation potential of living organisms. Biotechnol. Res. Innovation 3 (2), 275–290. doi:10.1016/J.BIORI.2019.09.001
Leslie, H. A., van Velzen, M. J. M., Brandsma, S. H., Vethaak, A. D., Garcia-Vallejo, J. J., and Lamoree, M. H. (2022). Discovery and quantification of plastic particle pollution in human blood. Environ. Int. 163, 107199. doi:10.1016/j.envint.2022.107199
Li, W., Wufuer, R., Duo, J., Wang, S., Luo, Y., Zhang, D., et al. (2020). Microplastics in agricultural soils: Extraction and characterization after different periods of polythene film mulching in an arid region. Sci. Total Environ. 749, 141420. doi:10.1016/J.SCITOTENV.2020.141420
Lithner, D., Larsson, A., and Dave, G. (2011). Environmental and health hazard ranking and assessment of plastic polymers based on chemical composition. Sci. Total Environ. 409 (18), 3309–3324. doi:10.1016/J.SCITOTENV.2011.04.038
Liu, H., Yang, X., Liu, G., Liang, C., Xue, S., Chen, H., et al. (2017). Response of soil dissolved organic matter to microplastic addition in Chinese loess soil. Chemosphere 185, 907–917. doi:10.1016/J.CHEMOSPHERE.2017.07.064
Liu, Y., Guo, R., Zhang, S., Sun, Y., and Wang, F. (2022). Uptake and translocation of nano/microplastics by rice seedlings: Evidence from a hydroponic experiment. J. Hazard. Mater. 421, 126700. doi:10.1016/J.JHAZMAT.2021.126700
Löhr, A., Savelli, H., Beunen, R., Kalz, M., Ragas, A., and van Belleghem, F. (2017). Solutions for global marine litter pollution. Curr. Opin. Environ. Sustain. 28, 90–99. doi:10.1016/J.COSUST.2017.08.009
Magnusson, K., and Norén, F. (2014). Screening of microplastic particles in and down-stream a wastewater treatment plant.
Mahon, N., Crute, I., Simmons, E., and Islam, M. M. (2017). Sustainable intensification – “oxymoron” or “third-way”? A systematic review. Ecol. Indic. 74, 73–97. doi:10.1016/J.ECOLIND.2016.11.001
Mohsen, M., Wang, Q., Zhang, L., Sun, L., Lin, C., and Yang, H. (2019). Heavy metals in sediment, microplastic and sea cucumber Apostichopus japonicus from farms in China. Mar. Pollut. Bull. 143, 42–49. doi:10.1016/J.MARPOLBUL.2019.04.025
Nasir Khan, M. (2018). “Obsolete: Fertilizers and their contaminants in soils, surface and groundwater,” in Reference module in earth systems and environmental Sciences. doi:10.1016/B978-0-12-409548-9.09888-2
Natesan, U., Vaikunth, R., Kuma, P., Ruthra, R., and Srinivasalu, S. (2021). Spatial distribution of microplastic concentration around landfill sites and its potential risk on groundwater. Chemosphere 277, 130263. doi:10.1016/J.CHEMOSPHERE.2021.130263
Noda, I., Dowrey, A. E., Haynes, J. L., and Marcott, C. (2007). “Group frequency assignments for major infrared bands observed in common synthetic polymers,” in Physical properties of polymers handbook, 395–406. doi:10.1007/978-0-387-69002-5_22
Oliveri Conti, G., Ferrante, M., Banni, M., Favara, C., Nicolosi, I., Cristaldi, A., et al. (2020). Micro- and nano-plastics in edible fruit and vegetables. The first diet risks assessment for the general population. Environ. Res. 187, 109677. doi:10.1016/J.ENVRES.2020.109677
Panno, S. V., Kelly, W. R., Scott, J., Zheng, W., McNeish, R. E., Holm, N., et al. (2019). Microplastic contamination in karst groundwater systems. Ground Water 57 (2), 189–196. doi:10.1111/GWAT.12862
Parvin, F., Jannat, S., and Tareq, S. M. (2021). Abundance, characteristics and variation of microplastics in different freshwater fish species from Bangladesh. Sci. Total Environ. 784, 147137. doi:10.1016/J.SCITOTENV.2021.147137
Parvin, F., Hassan, Md. A., and Tareq, S. M. (2022). Risk assessment of microplastic pollution in urban lakes and peripheral Rivers of Dhaka, Bangladesh. J. Hazard. Mater. Adv. 8, 100187. doi:10.1016/J.HAZADV.2022.100187
Piarulli, S., Scapinello, S., Comandini, P., Magnusson, K., Granberg, M., Wong, J. X. W., et al. (2019). Microplastic in wild populations of the omnivorous crab Carcinus aestuarii: A review and a regional-scale test of extraction methods, including microfibres. Environ. Pollut. 251, 117–127. doi:10.1016/J.ENVPOL.2019.04.092
Qi, Y., Yang, X., Pelaez, A. M., Huerta Lwanga, E., Beriot, N., Gertsen, H., et al. (2018). Macro- and micro-plastics in soil-plant system: Effects of plastic mulch film residues on wheat (Triticum aestivum) growth. Sci. Total Environ. 645, 1048–1056. doi:10.1016/J.SCITOTENV.2018.07.229
Rillig, M. C., and Mummey, D. L. (2006). Mycorrhizas and soil structure. New Phytol. 171 (1), 41–53. doi:10.1111/J.1469-8137.2006.01750.X
Rillig, M. C. (2018). Microplastic disguising as soil carbon storage. Environ. Sci. Technol. 52 (11), 6079–6080. doi:10.1021/ACS.EST.8B02338
Saha, M., Togo, A., Mizukawa, K., Murakami, M., Takada, H., Zakaria, M. P., et al. (2009). Sources of sedimentary PAHs in tropical Asian waters: Differentiation between pyrogenic and petrogenic sources by alkyl homolog abundance. Mar. Pollut. Bull. 58 (2), 189–200. doi:10.1016/J.MARPOLBUL.2008.04.049
Steiner, T., Möller, J. N., Löder, M. G. J., Hilbrig, F., Laforsch, C., and Freitag, R. (2022). “Microplastic contamination of composts and liquid fertilizers from municipal biowaste treatment plants: Effects of the operating conditions,” in Waste biomass valorization. doi:10.1007/S12649-022-01870-2
Tanaka, K., and Takada, H. (2016). Microplastic fragments and microbeads in digestive tracts of planktivorous fish from urban coastal waters. Sci. Rep. 6 (1), 34351–34358. doi:10.1038/srep34351
van Cauwenberghe, L., Devriese, L., Galgani, F., Robbens, J., and Janssen, C. R. (2015). Microplastics in sediments: A review of techniques, occurrence and effects. Mar. Environ. Res. 111, 5–17. doi:10.1016/J.MARENVRES.2015.06.007
Verbruggen, E., Jansa, J., Hammer, E. C., and Rillig, M. C. (2016). Do arbuscular mycorrhizal fungi stabilize litter-derived carbon in soil? J. Ecol. 104 (1), 261–269. doi:10.1111/1365-2745.12496
Verleye, G. A. L., Roeges, N. P. G., and De Moor, M. O. (2001). Easy identification of plastics and rubbers, 160.
Wang, F., Wang, Q., Adams, C. A., Sun, Y., and Zhang, S. (2022). Effects of microplastics on soil properties: Current knowledge and future perspectives. J. Hazard. Mater. 424, 127531. doi:10.1016/J.JHAZMAT.2021.127531
Weithmann, N., Möller, J. N., Löder, M. G. J., Piehl, S., Laforsch, C., and Freitag, R. (2018). Organic fertilizer as a vehicle for the entry of microplastic into the environment. Sci. Adv. 4 (4), eaap8060. doi:10.1126/SCIADV.AAP8060
Wirnkor, V. A., Ebere, E. C., Ngozi, V. E., and Oharley, N. K. (2019). Microplastic-toxic chemical interaction: A review study on quantified levels, mechanism and implication. doi:10.20944/PREPRINTS201908.0260.V1
Wu, X., Hou, H., Liu, Y., Yin, S., Bian, S., Liang, S., et al. (2022). Microplastics affect rice (oryza sativa L.) quality by interfering metabolite accumulation and energy expenditure pathways: A field study J. Hazard. Mater. 422, 126834. doi:10.1016/J.JHAZMAT.2021.126834
Xu, J., Yang, A., Yan, Y., Xu, Y., Tang, M., Li, P., et al. (2022). Quantification and identification of microplastics in organic fertilizers: The implication for the manufacture and safe application. doi:10.21203/RS.3.RS-1332449/V1
Yang, W., Cheng, P., Adams, C. A., Zhang, S., Sun, Y., Yu, H., et al. (2021). Effects of microplastics on plant growth and arbuscular mycorrhizal fungal communities in a soil spiked with ZnO nanoparticles. Soil Biol. Biochem. 155, 108179. doi:10.1016/J.SOILBIO.2021.108179
Yee, M. S. L., Hii, L. W., Looi, C. K., Lim, W. M., Wong, S. F., Kok, Y. Y., et al. (2021). Impact of microplastics and nanoplastics on human health. Nanomaterials 11 (2), 496–523. doi:10.3390/NANO11020496
Yeo, B. G., Takada, H., Hosoda, J., Kondo, A., Yamashita, R., Saha, M., et al. (2017). Polycyclic aromatic hydrocarbons (PAHs) and hopanes in plastic resin pellets as markers of oil pollution via international pellet watch monitoring. Archives Environ. Contam. Toxicol. 73 (2), 196–206. doi:10.1007/s00244-017-0423-8
Yu, H., Zhang, Y., Tan, W., and Zhang, Z. (2022). Microplastics as an emerging environmental pollutant in agricultural soils: Effects on ecosystems and human health. Front. Environ. Sci. 10, 217. doi:10.3389/fenvs.2022.855292
Zhang, L., Xie, Y., Liu, J., Zhong, S., Qian, Y., and Gao, P. (2020). An overlooked entry pathway of microplastics into agricultural soils from application of sludge-based fertilizers. Environ. Sci. Technol. 54 (7), 4248–4255. doi:10.1021/ACS.EST.9B07905
Zhang, K., Hamidian, A. H., Tubić, A., Zhang, Y., Fang, J. K. H., Wu, C., et al. (2021). Understanding plastic degradation and microplastic formation in the environment: A review. Environ. Pollut. 274, 116554. doi:10.1016/J.ENVPOL.2021.116554
Zhang, S., Li, Y., Chen, X., Jiang, X., Li, J., Yang, L., et al. (2022). Occurrence and distribution of microplastics in organic fertilizers in China. Sci. Total Environ. 844, 157061. doi:10.1016/J.SCITOTENV.2022.157061
Zhou, Q., Zhang, H., Fu, C., Zhou, Y., Dai, Z., Li, Y., et al. (2018). The distribution and morphology of microplastics in coastal soils adjacent to the Bohai Sea and the Yellow Sea. Geoderma 322, 201–208. doi:10.1016/J.GEODERMA.2018.02.015
Keywords: microplastic, organic fertilizer, abundance, morphology, risk assessment, adverse effect
Citation: Rana MM, Haque MR, Tasnim SS and Rahman MM (2023) The potential contribution of microplastic pollution by organic fertilizers in agricultural soils of Bangladesh: quantification, characterization, and risk appraisals. Front. Environ. Sci. 11:1205603. doi: 10.3389/fenvs.2023.1205603
Received: 14 April 2023; Accepted: 08 June 2023;
Published: 23 June 2023.
Edited by:
Ali Atamaleki, North Khorasan University of Medical Sciences, IranReviewed by:
Kazem Samimi, Shahid Beheshti University of Medical Sciences, IranMasoumeh Rahmatinia, Shahid Beheshti University, Iran
Aniruddha Sarker, National Institute of Agricultural Science, Republic of Korea
Copyright © 2023 Rana, Haque, Tasnim and Rahman. This is an open-access article distributed under the terms of the Creative Commons Attribution License (CC BY). The use, distribution or reproduction in other forums is permitted, provided the original author(s) and the copyright owner(s) are credited and that the original publication in this journal is cited, in accordance with accepted academic practice. No use, distribution or reproduction is permitted which does not comply with these terms.
*Correspondence: Md. Mostafizur Rahman, cmFobWFubW1AanVuaXYuZWR1
†These authors have contributed equally to this work