Abstract
To evaluate perceived risk, it is necessary to understand both the type of risk and the residents’ perceptions. With the rise of information on technology and digital platforms, new avenues have emerged for examining citizens’ risk perception in participatory settings. However, the lack of theoretical and methodological approaches in this area calls for further research. The objective of this article is to fill the existing research gap by conducting a scoping review of published literature that examines risk perception related to the petrochemical industry, specifically focusing on digital platforms and the utilization of participatory processes in assessing risk perception within this industry context. The review analyzes the types of questions and responses encountered during participatory processes. The authors selected and studied 10 papers in-depth after applying specific selection criteria. They identified two types of risks—natural and technological—associated with the petrochemical industry, and two types of questions: general questions such as demographics, education, and employment, and specific questions such as risk perception, trust in government and company information, type of risk, or proximity to polluted areas. The paper identifies two question types in participatory processes: general and specific. It emphasizes that the most frequent participation level is consultation, involving seeking public feedback for decision-making. Risk perception is a common topic in participatory processes, highlighting the importance of understanding and addressing public concerns about activities risks. Understanding risk and questions raised during participation is crucial to studying risk perception. This knowledge can improve policies, identify risk mitigation solutions, and identify relevant questions to aid in logical answers.
Systematic Review Registration: http://www.prisma-statement.org/?AspxAutoDetectCookieSupport=1
1 Introduction
The petrochemical industry refers to compounds and polymers derived directly or indirectly from gas or crude oil and used in the chemical industry (Matar and Hatch, 2001). Petrochemical clusters entail a wide range of risks either for the environment or the people living alongside them, both on a short-term and a long-term basis (World Health Organization, 2010). The report “Environment and Health Risks: A Review of the Influence and Effects of Social Inequalities” provided by the World Health Organization (WHO, 2010) points to six environmental health challenges: air quality, housing and residential location, unintentional injuries in children, work-related health risks, waste management and climate change, social and gender-related inequalities, and children’s exposure to risks.
In the past decades, several studies have focused on the perception of technological risk derived from the petrochemical industry (e.g., Pasetto, Mattioli, and Marsili, 2019). For example, Fonzo et al. (2022)conducted a review of the existing research on the distribution of health hazards in industrial pollution, and they demonstrated the social dimension of health hazards from industrial contamination. Dettori, Pittaluga, Busonera, Gugliotta, Azara, Piana, Arghittu and Castiglia presented a work aimed at assessing the risk perception and evaluating the community outrage linked to environmental factors among a self-selected sample of citizens living in an area characterized by the presence of industrial structures of high emotional impact (Dettori et al., 2020), and Pasetto, Mattioli, and Marsili (2019) reviewed health inequalities in areas affected by industrially contaminated sites. Some other studies have concentrated on the impact of the petrochemical industry on human health, focusing on potential adverse health outcomes (Bamber et al., 2019), cancer (Domingo et al., 2020).
Through emerging information technology and social media, people’s perception of technological risks derived from industrial complexes has gained new research interest. The appearance of digital platforms offering new participatory channels enables innovative methodologies such as Public Participation Geographic Information Systems (PPGIS). PPGIS is considered to be a field within Geographic Information Science where citizens can use geospatial technologies and generate data to support decision-making processes (Laatikainen et al., 2017). The term PPGIS was first used in 1996 at the National Center for Geographic Information and Analysis meetings in the United States, and its relevance has been emphasized repeatedly (Saadallah, 2020). Brown and Kyttä have conducted literature reviews centred on a deeper understanding of PPGIS’s multiple dimensions (Brown and Kyttä, 2014). There is an agreement in understanding PPGIS as an alternative tool to public participation processes (Sawicki and Peterman, 2002; Weiner et al., 2002; Sieber, 2006; Dunn, 2007; McLain et al., 2013). However, PPGIS has been driven more by the explorations into the potential and the opportunities of new technologies (applied research) than conceptual and theoretical research (basic research), therefore its body of knowledge is heterogeneous in its concept and methods (Brown and Kyttä, 2014).
The main objective of this paper is to analyze how the participatory process is used to approach risk perception in petrochemical clusters, to determine what risks are more commonly studied, and to pinpoint the main outcomes of using participatory techniques to assess risk perception in petrochemical clusters. To do so, we conduct a comprehensive and up-to-date review of peer-reviewed journals published from 2000 to 2022, examine risk perception related to the petrochemical industry, and focus on participatory processes based on spatial digital platforms. Furthermore, this study’s scope includes a wide range of public participation, from minimal involvement, in which community members are simply informed about projects, to more active participation, in which their input is considered in decision-making processes. It seeks to answer the question, how does the participatory process help to explore the perception of the technological risk through the various levels of participation? By examining these various levels of public participation, we hope to shed light on how community involvement shapes, alters, or enhances perceptions of the petrochemical industry.
This paper fills a gap in risk perception studies and contributes to participatory process research and the social impact of petrochemical clusters. Overall, this paper serves as an important resource for researchers, policymakers, and practitioners interested in risk perception assessment and public participation methodologies. By filling a gap in the literature, this paper helps understand the complex interplay between risk perception and public participation and sheds light on how the local community can engage in the risk management process.
After the Methods section, the paper focuses on the type of questions included in PPGIS questionnaires, the way information is extracted and analyzed, and the spatial approach adopted. An analysis of data collection and data analysis methods is conducted, and the main outcomes are summarized.
2 Methods
A scoping review protocol was developed based on the PRISMA-SCR (Preferred Reporting Items for Systematic Reviews and Meta-Analyses Extension for Scoping Reviews) checklist (see supplementary materials) and explanation (Tricco et al., 2018). This method was chosen because scoping reviews are focused on addressing topics where different study designs may be used, which requires a comprehensive systematization of the existing literature.
2.1 Inclusion criteria
We included peer-reviewed papers that investigated the linkages between the public participatory process and the perception of petrochemical risk published from January 2000 until December 2022. For a paper to be included in the review it had to meet the following criteria:
1‐ It should apply a public participatory process (e.g., PPGIS, Participatory mapping, questionnaire).
2‐ It should focus on technological risk perception.
3‐ It should focus on the petrochemical industry, or other synonymous.
4‐ It should be written in the English language.
2.2 Search strategy and study selection
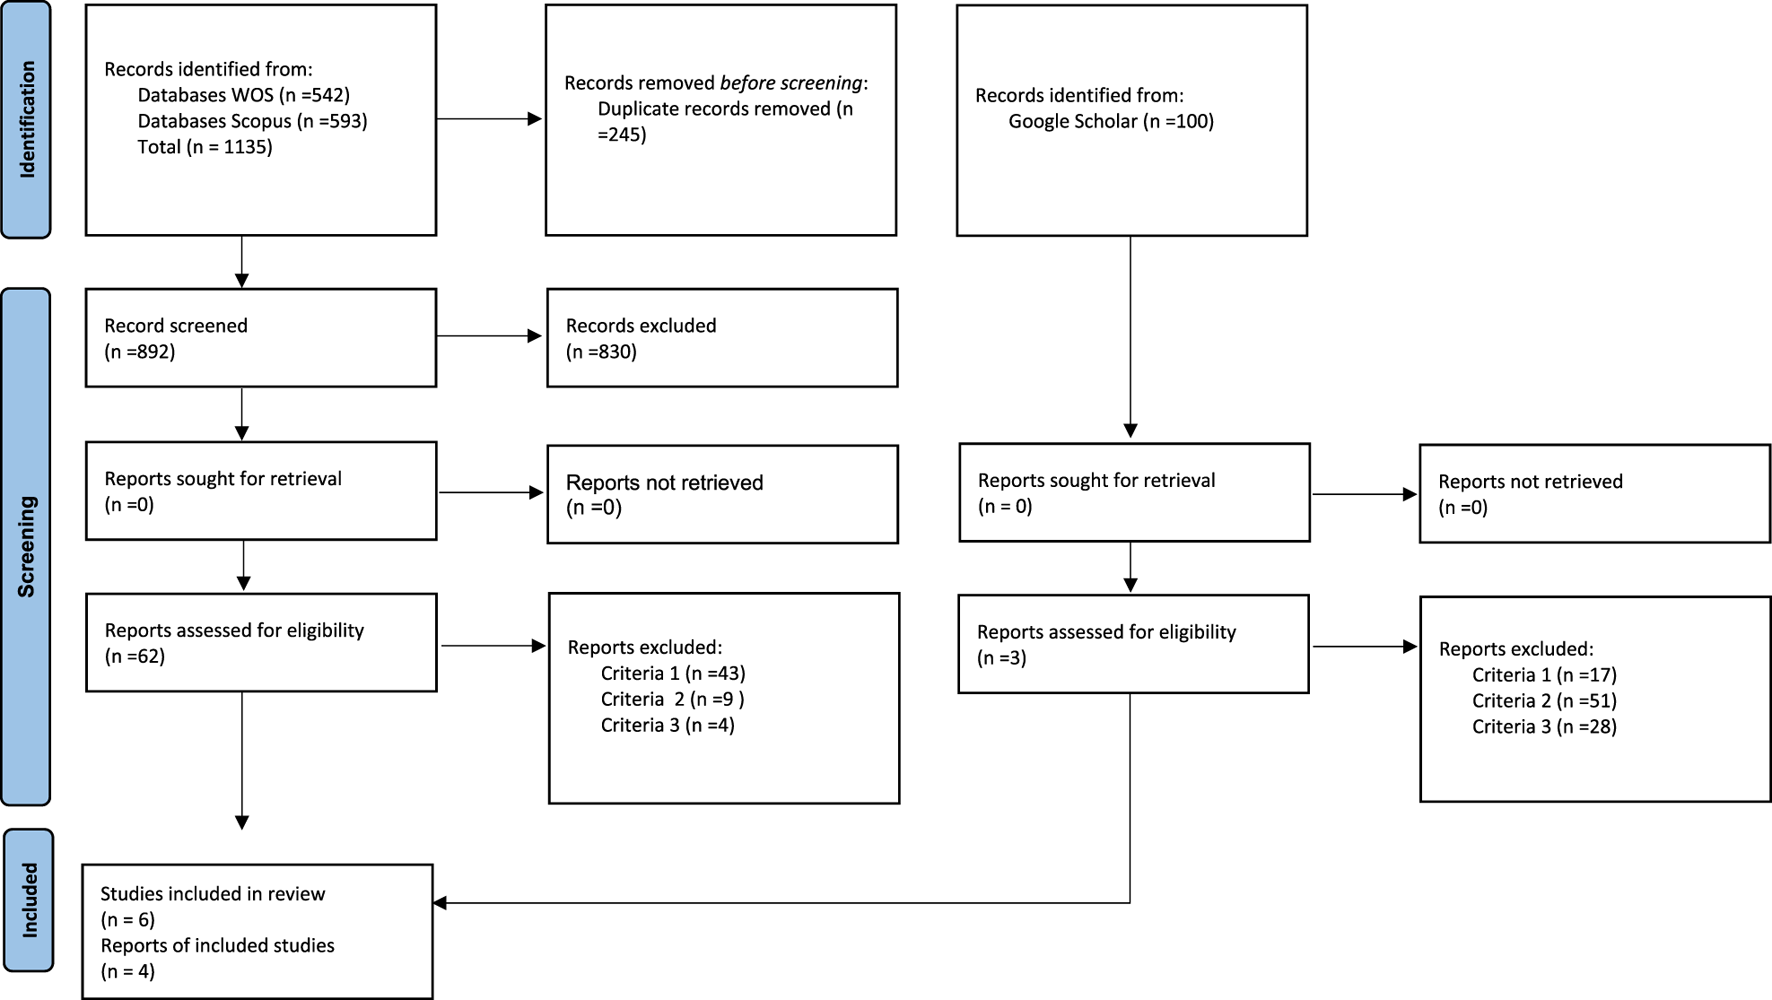
Papers meeting the inclusion criteria were identified in 3 steps (Figure 1). Firstly 1), a literature search was conducted on Web of Science and SCOPUS using search terms synthesized in search sentences (Table 1). The four key terms were Public Participation, Geographic Information System, Risk Perception, and Petrochemical; a set of synonyms was chosen for each term (Table 2). Afterwards, 2) a prospective search was made in Google Scholar using a sentence with selected keywords used in the papers’ abstracts (perception of risk, technological site, public participation, GIS). Finally, 3) the inclusion/exclusion criteria were applied.
FIGURE 1

Search strategy diagram.
TABLE 1
| Database | Search status | Syntax |
|---|---|---|
| SCOPUS | Title | TITLE-ABS-KEY (“Geographic information system” OR “GIS” OR “geographic information system for public participation” OR “public participation geographic information system” OR “PPGIS” OR “public participation GIS” OR “shared geographic information” OR “participatory app” OR “participatory GIS” OR “PGIS” OR “public engagement app” OR“public engagement GIS” OR “citizen science” OR “participatory mapping” OR “volunteer geographic information” OR “VGI” OR “GIS survey” OR “geographic information technology” OR “GIT”) AND TITLE-ABS-KEY (“technol*” OR “manmade” OR “man-made” OR “anthro* risk”) AND TITLE-ABS-KEY (“risk perception” OR “disaster perception” OR “catastrophe perception” OR “risk assessment” OR “disaster assessment” OR “catastrophe assessment”)) |
| Abstract | ||
| Keywords | ||
| Web of Science | Topics | (TS)= (“Geographic information system” OR “GIS” OR “geographic information system for public participation” OR “public participation geographic information system” OR “PPGIS” OR “public participation GIS” OR “shared geographic information” OR “participatory app” OR “participatory GIS” OR “PGIS” OR “public engagement app” OR “public engagement GIS” OR “citizen science” OR “participatory mapping” OR “volunteer geographic information” OR “VGI” OR “GIS survey” OR “geographic information technology” OR “GIT”) AND(TS)=(“technol* “ OR “man-made” OR “man-made “ OR “anthro* risk”) AND(TS)=(“risk perception” OR “disaster perception” OR “catastrophe perception” OR “risk assessment” OR “disaster assessment” OR “catastrophe assessment”) |
| Google Scholar | Abstract keywords | “perception of risk” OR “technological site” OR “public participation” OR, “GIS |
Search syntax used for literature search.
TABLE 2
| PPGIS | Petrochemical risk | Risk perception | |
|---|---|---|---|
| Synonyms 1 | GIS | Man-made risk | Risk perception |
| Synonyms 2 | Geographic information system for public participation | Anthropic risk | Disaster perception |
| Synonyms 3 | Public participation geographic information system | Technological risk | Catastrophe perception |
| Synonyms 4 | PPGIS | Risk assessment | |
| Synonyms 5 | Public participation GIS | Disaster assessment | |
| Synonyms 6 | Shared geographic information | Catastrophe assessment | |
| Synonyms 7 | Participatory app | ||
| Synonyms 8 | Participatory GIS | ||
| Synonyms 9 | PGIS | ||
| Synonyms 10 | Public engagement app | ||
| Synonyms 11 | Public engagement GIS | ||
| Synonyms 12 | Citizen science | ||
| Synonyms 13 | Participatory mapping | ||
| Synonyms 14 | Volunteer geographic information | ||
| Synonyms 15 | VGI | ||
| Synonyms 16 | GIS survey | ||
| Synonyms 17 | Geographic information technology | ||
| Synonyms 18 | GIT |
Search terminology in WOS, Scopus, and Google Scholar.
These searches resulted in a total of 1,135 articles on WOS and SCOPUS; they were exported into the reference management software, Zotero, and duplicates were removed, resulting in 892 original articles. After an abstract screening, 62 articles were identified. A full-text screening determined that six articles met the inclusion criteria. In addition to utilizing the Web of Science (WOS) and Scopus databases, Google Scholar was also employed as an external database to augment the inclusion of relevant scholarly articles. Given a large number of Google Scholar results (over 100,000 entries, including grey literature), only the first 100 articles from each search were screened, as per Haddaway et al. (2015). Three articles out of those 100 determined by the search query met the inclusion criteria.
Subsequently, the papers meeting the search criteria were reviewed (Wendelboe-Nelson et al., 2019; Jelks et al., 2021). One additional article meeting the inclusion criteria was found by reviewing the literature of the selected papers. Figure 2 shows the screening process.
FIGURE 2
PRISMA 2020 flow diagram for new systematic reviews, which included searches of databases, registers and other resources.
2.3 Data extraction and data synthesis
Data extraction was conducted by producing a data charting form. Only the papers published after the year 2000 onwards were included. Once all exclusion criteria were applied, the data from the remaining studies were charted under the following fields in Tables 3, 4. The first table includes fields of the extracted data about the article such as the name of authors, country, year of publication, and institution (Table 3). The second includes fields of the extracted data on the case of study, the theoretical and methodological approach, the characteristics of the population that responded to the survey, the type of risk analyzed, and the questions included in the survey (Table 4).
TABLE 3
| # | Field | Description |
|---|---|---|
| 1 | ID | Unique ID for each paper |
| 2 | Title | Title of each paper |
| 3 | Authors | Name of who wrote the paper |
| 4 | Department/University | Department/University where the research was conducted |
| 5 | Journal | Journal where the paper was published |
| 6 | Year | The year when the paper was published |
| 7 | Country | Country where the paper was published |
Data charting form about the articles.
TABLE 4
| # | Field | Description | |
|---|---|---|---|
| 8 | Study year | The year when the study was conducted | |
| 9 | Study area | The country where the study was conducted | |
| 10 | Region | World region where the study was conducted | |
| 11 | City | The city where the study was conducted | |
| 12 | Case study | Name of the case study | |
| 13 | Country study | The country where the research was conducted | |
| 14 | Scale_0 | The scale of map representation | |
| 15 | Scale_1 | Geographical scale: local, regional, national, and global | |
| 16 | Theoretical approaches | Approaches used in the theoretical parts of the paper | |
| 17 | Methodological approaches | Approaches | Approaches used in the methodological part of the paper |
| Level of participation process | refers to the extent to which the public is involved in decision-making | ||
| Participants type | Category of participants as target population, sample, stakeholders, experts | ||
| 18 | Method Tools | Tools used in the methodological section | |
| 19 | Population | Type of population under study (residents, children, etc.) | |
| 20 | Age | Population age range | |
| 21 | Number | Number of people under study | |
| 22 | Risk type | Type of the risks in technological sites | |
| 23 | Software | Software used | |
| 24 | Purpose | Purpose of the study | |
| 25 | Results | Results of the study | |
Data charting form on the case study.
3 Results
3.1 Study characteristics
A total of 893 articles based on the search on WOS and SCOPUS were retrieved, of which 62 were included for full-text screening. Six papers fulfilled all established inclusion criteria. Also, based on the Google Scholar search engine, 100 papers were reviewed, and four papers summarized the general information of each study (Table 5). The scoping review found that most of the included papers were published within the last 5 years, with 50% published after 2018 and 20% published between 2014 and 2018. The other studies were published before 2014. The United Kingdom was the most represented country in terms of country of publication, with seven studies, followed by the Netherlands and the United States (Table 5). Almost all the papers were published in high-quality journals (Q1 and Q2), with Journal of Risk Research accounting for 25% of all publications (Table 5).
TABLE 5
| ID | Title | Authors | Department/University | Journal | Year | Country |
|---|---|---|---|---|---|---|
| 1 | Risk communication and local perceptions of petrochemical pollution risk: A comparison of the petrochemical industry complexes at different development stages | Hung-Chih Hung, Chia-Fang Li, Chih-Hsuan Hung | Department of Real Estate and Built Environment, National Taipei University, Address: 151, University Road, San-Shia, New Taipei City, 237303, Taiwan | Environmental Science & Policy | 2020 | Netherlands |
| 2 | Risk assessment of aero technogenic pollution generated by industrial enterprises in Algeria and Ukraine | Mykola Kharytonov, Aissa Benselhoub, Regina Kryvakovska, Iryna Klimkina, Ahcene Bouhedja, Soufiane Bouabdallah, Raouf Chaabia, Tetyana L. Vasylyeva | Dnipropetrovsk State Agrarian and Economic University, Department of Ecology and Environment Protection, Dnipro, Ukraine | Studia Universitatis Vasile Goldis Arad, Seria Stiintele Vietii | 2017 | Romania |
| 3 | Proximity and risk perception. Comparing risk perception ‘profiles’ in two petrochemical areas of Sicily (Augusta and Milazzo) | Guido Signorino | Department of Economics, Statistics, Mathematics and Sociology ‘V. Pareto’, University of Messina, Messina, Italy | Journal of Risk Research | 2012 | United Kingdom |
| 4 | Proximity (Mis)perception: Public Awareness of Nuclear, Refinery, and Fracking Sites | Benjamin A. Lyons, Heather Akin, Natalie Jomini Stroud | Department of Communication, University of Utah, Salt Lake City, UT, United States | Risk Analysis | 2019 | United Kingdom |
| 5 | Environmental Management Systems and Local Community Perceptions: the Case of Petrochemical Complexes Located in Ports: EMSs and Local Community Perceptions: Petrochemical Complexes in Ports | Miguel Ángel López-Navarro, Vicente Tortosa-Edo, Jaume Llorens-Monzonís | Universitat Jaume I, Department of Business Administration and Marketing, Castellón, Spain | Business Strategy and the Environment | 2015 | United Kingdom |
| 6 | Environmental health risk relationships, responsibility, and sources of information among Vietnamese Americans in coastal Mississippi | Hannah H. Covert, Mya Sherman, Daniel Le, Maureen Y. Lichtveld | Center for Gulf Coast Environmental Health Research, Leadership and Strategic Initiatives, Tulane University, New Orleans, Louisiana, United States | Health, Risk&Society | 2020 | United Kingdom |
| 7 | The study of the perception of the petrochemical risk using a public participation geographic information system. A case applied to camp de tarragona (Spain) | Edgar Bustamante Picón, Joan Alberich, Yolanda Pérez-Albert | Blinded | SSRN | 2022 | Spain |
| 8 | Public perception for monitoring and management of environmental risk: the case of the tires’ fire in Drama region, Greece | Pigi A. Vangeli, Antonia Koutsidou, Alexandra Gemitzi, Konstantinos P. Tsagarakis | Department of Environmental Engineering, Democritus University of Thrace, Xanthi, Greece | Journal of Risk Research | 2014 | United Kingdom |
| 9 | Public participation and the concept of space in environmental governance: An application of PPGIS: PPGIS AND THE ENVIRONMENTAL GOVERNANCE | Milan Tung-Wen Sun,Yun-Tung Tsai, Mei-Chiang Shih, Jessica Yu-Wen Lin | Department of Public Policy and Administration, National Chi Nan University | Journal of Risk Research | 2009 | United Kingdom |
| 10 | A volunteered geographic information system for managing environmental pollution of coastal zones: A case study in Nowshahr, Iran | Sima Fatehian, Mohammadreza Jelokhani-Niaraki, Ata Abdollahi Kakroodi, Qiuomars Yazanpanah Dero, Najmeh Neysani Samany | Department of GIS and Remote Sensing, Faculty of Geography, University of Tehran, Tehran, Iran | Ocean & Coastal Management | 2018 | United Kingdom |
General information on each study.
Table 6 summarises the main study characteristics of each paper based on the search process. Papers 1, 2, 4, 6, 7 and 10 were studied after 2016, papers 5 and 8 between 2010 and 2016, and papers 3 was studied in 2012 and 9 before 2010. Regarding the area of study, most of them took place in Europe, followed by Asia, the United States and Africa. Furthermore, the spatial scale used in the selected papers is only defined in papers; 1, 7, 8, and 10. Papers 1, 7, and 8 used a regional scale for their research, but only paper 10 used a local scale for the analyses.
TABLE 6
| ID | Study year | Country study | Region | City | Scale_0 | Scale_1 |
|---|---|---|---|---|---|---|
| 1 | 2020 | Taiwan | Yunlin country | near to Mailiao | 1:8000 | Regional scale |
| 2 | 2017 | Ukraine, Algeria | South-east of Ukraine and the north of Algeria | Kryvyi Rih in Ukraine and Annaba areas | Unknown | Unknown |
| 3 | 2008 | Italy | Eastern and north coasts of Sicily | Augusta and Milazzo | Unknown | Unknown |
| 4 | 2014 | United States | Whole country | whole country | Unknown | Unknown |
| 5 | 2011 | Spain | Port of Castellón | Castellón | Unknown | Unknown |
| 6 | 2016 | United States | Biloxi, Mississippi | Biloxi | Unknown | Unknown |
| 7 | 2020 | Spain | North of Tarragona and South of Tarragona | Tarragona | 1:5000 | Regional scale |
| 8 | 2011 | Greece | The northern part of Greece | the prefecture of Drama | 1:50000 | Regional scale |
| 9 | 2008 | Taiwan | South of Taiwan | Tainan | Unknown | Unknown |
| 10 | 2017 | Iran | Mazandaran | Nowshahr | 1:300 | Local-scale |
Summary of the main study characteristics of the selected papers.
Table 7 presents the summaries of the theoretical and methodological approaches and case studies. Regarding the theoretical approaches, most of them investigated risk perception together with other related topics (i.e., environmental risk perception, citizen science and governance policies, and risk management). Environmental risk perception refers to an individual’s cognitive assessment of the significance and immediacy of safeguarding the environment, as well as their comprehension of the interdependencies between human beings and the natural world (Zeng et al., 2020). Citizen science is a collaborative approach to scientific research in which members of the general public participate actively in various phases of scientific projects. Environmental risk management involves the systematic identification, evaluation, and mitigation of potential environmental risks.
TABLE 7
| ID | Country | Case study | Theoretical approaches | Methodological approaches | ||
|---|---|---|---|---|---|---|
| Approaches | Level of participation process | |||||
| Qualitative | Quantitative | |||||
| 1 | Taiwan | Naphtha cracker complexes | Environmental risk perception | -Interviews | -Spatial analysis | Informing |
| -Surveys | ||||||
| -Statistical analysis | ||||||
| 2 | Ukraine, Algeria | El Hadjar Metallurgical plant and Kryvyi Rih | Environmental risk perception | -Interviews | -Spatial analysis | Informing |
| 3 | Italy | Raffineria di Milazzo and Augusta-Priolo | Risk perception | -Interviews | -Statistical analysis | Consulting |
| 4 | United States | Unknown | Risk perception | - | -Statistical analysis based on logistic regressions | Consulting |
| -National survey sample | ||||||
| 5 | Spain | El Serrallo | Risk perception | -Questionnaire | - Surveys | Consulting |
| -Statistical analysis | ||||||
| 6 | United States | Biloxi | Risk perception | -Interviews | - | Empowering |
| 7 | Spain | Tarragona | Risk perception | - | -Survey based on the PPGIS | Involving |
| -Spatial analysis (hotspot) | ||||||
| 8 | Greece | Unknown | Environmental risk perception | - | -Questionnaire | Consulting |
| - Statistical analysis | ||||||
| 9 | Taiwan | An-Shun | Citizen science and Governance policies | - | -Survey based on the PPGIS | Involving |
| 10 | Iran | Unknown | Citizen science and Risk management | - | -Survey based on the PPGIS | Empowering |
| - Spatial analysis | ||||||
Summaries of the theoretical, methodological approaches and case studies in the selected papers.
In terms of methodological approaches, qualitative (interview and observations) and quantitative analyses (questionnaire, online questionnaire, survey) were commonly used; only paper 6 (Covert et al., 2020) used qualitative analyses exclusively, and only paper 2 (Kharytonov et al., 2017) used quantitative analyses exclusively.
The level of participation was also approached, taking as a reference the International Association for Public Participation (IAP2) framework (
IAP, 2018). The IAP2 has categorized the levels of participation into five, which are:
1. Inform: This level aims to provide accurate and timely information to the public regarding the project or issue.
2. Consult: The second level solicits feedback and input from the general public to gather their concerns and ideas and incorporate them into decision-making.
3. Involvement: This level involves working directly with the public to ensure that their interests and aspirations are reflected in the alternatives developed.
4. Collaborate: This level involves working with the public to develop solutions and alternatives and ensure their active participation in decision-making.
5. Empowerment: At the highest level of participation, the public has the final decision-making authority, ensuring their opinions and aspirations are reflected in the final outcome.
Consulting was the most commonly used level of participation in the selected papers, appearing in four of them.
Regarding social characteristics (Table 8), the participatory process was mainly carried out among the residents in the areas under study in most of the papers, although paper 10 (Fatehian et al., 2018) focused on social groups such as children and tourists.
TABLE 8
| ID | Population | Gender | Age | Number |
|---|---|---|---|---|
| 1 | Residents | All | Unknown | 456 |
| 2 | Children | All | Unknown | 20 |
| 3 | Residents | All | 18–60 | 1,222 |
| 4 | Residents | All | 18≤ | 9,810 |
| 5 | Residents | All | 18≤ | 992 |
| 6 | Residents | All | 18≤ | 49 |
| 7 | Residents | All | 16≤ | 431 |
| 8 | Residents | All | Unknown | 505 |
| 9 | Residents | All | Unknown | 193 |
| 10 | Residents and tourists | All | Unknown | Unknown |
Summary of the population, gender, age and number of participants.
Regarding age, papers 1, 2, 8, 9 and 10 (Kharytonov et al., 2017; Fatehian et al., 2018, 2018; Hung et al., 2020; Bustamante Picón et al., 2022) did not consider respondent representativeness. However, papers 4, 5 and 6 (López-Navarro et al., 2015; Covert et al., 2020; Lyons et al., 2020) were conducted considering people over the age of 18; paper 7 (Bustamante Picón et al., 2022) was based on the participation of people over 16; and paper 3 (Signorino, 2012) focused on participants between 18 and 60 years old. The number of participants in each study was pretty heterogeneous; paper 10 (Fatehian et al., 2018) did not mention the number of participants in the study.
3.1.1 Type of risks
Table 9 summarizes the studies organized by risk and type of risk. Almost all papers focused on technological risk, while papers 1 and 3 (Signorino, 2012; Hung et al., 2020) studied both types of risks (natural and technological risks).
TABLE 9
| ID | Type of the risks | Natural risk | Technological risk |
|---|---|---|---|
| 1 | Air pollution | ■ | ■ |
| Dustfall | ■ | ||
| 2 | Nitrogen and sulphur dioxides | ■ | |
| 3 | Dangerous Company | ■ | |
| Flooding | ■ | ||
| Noise | ■ | ||
| 4 | Pollution from nuclear sites, refineries, and fracking wells | ■ | |
| 5 | Oily wastes | ■ | |
| Numerous solid wastes | ■ | ||
| Underwater noise | ■ | ||
| Ballast water | ■ | ||
| Fire and leakages | ■ | ||
| 6 | Oil spill | ■ | |
| 7 | Toxic clouds | ■ | |
| Fire and explosion | ■ | ||
| 8 | Spread of chemical products in water | ■ | |
| 9 | Electrocatalytic oxidation of sodium pentachlorophenol | ■ | |
| 10 | Wastewater | ■ | |
| Garbage | ■ | ||
| Oily wastes | ■ | ||
| Accumulated solid waste | ■ |
The type of the risks.
The concept of natural risk is defined as the attribute of a natural manifestation (hazard), the consequences of which can be harmful (vulnerability) to society. Natural risks differ from technological risks in that the cause (hazard) is not (a priori) linked to human activity, but rather to a natural origin. On the contrary, technological or industrial risks have an anthropogenic origin linked to an installation, an infrastructure, or a way of life of a given civilization.
Papers 1 and 3 (Signorino, 2012; Hung et al., 2020) considered natural and technological risks and established links between both types of hazards. Paper 1, for example, mentions potential sources of technological risks that have resulted in increased air pollution (Hung et al., 2020).
Technological risk is defined as the likelihood of physical, social, and financial harm/detriment/loss due to technology aggregated over its entire lifecycle (Renn and Benighaus, 2013). Although clearly defined, the everyday use of this word has a myriad of connotations (Scheer and Ulbig, 2010; Renn, 2017). Technological hazard refers to the threat potential of a technology or its products (i.e., the potential to harm people, nature, capital, or human-made facilities). In public perception, terms such as hazards and risks are often used interchangeably, which provides a unique challenge for risk communication (Scheer and Ulbig, 2010).
The technological risk was examined in nine papers. Paper 2 (Kharytonov et al., 2017) focused on nitrogen and sulphur dioxides produced by metallurgical enterprises as a type of risk that is related to technological risk and increases air pollution; paper 3 (Signorino, 2012) dealt with noise as a type of risk posed by a petrochemical complex; paper 4 (Lyons et al., 2020) focused on pollution from nuclear sites, refineries, and fracking wells; paper 5 (López-Navarro et al., 2015) focused on oily wastes, solid wastes, underwater noise, ballast water, and accidents such as fires and leakages; paper 6 (Covert et al., 2020) concentrated on oil spills from petroleum complexes, while paper 7 (Bustamante Picón et al., 2022) investigated toxic clouds, fires, and explosions; paper 8 (Vangeli et al., 2014) focused on the spread of chemical products in water; paper 9 (Sun et al., 2009) focused on the electrocatalytic oxidation of sodium pentachloro phenate; and paper 10 (Fatehian et al., 2018) focused on wastewater, garbage, oil, and accumulated solid waste from agricultural factories.
4 Analyzing the participatory process questions
Papers pose two main types of questions: general questions such as age, gender, ethnicity, living area, or employment, and specific questions such as risk perception, type of risk, polluted area, health risk perception, or distance to the polluted area. Table 6 shows the type and terms of questions in each paper.
4.1 General questions
Common contextual questions such as age, gender or education level are defined in the participation process in three papers: employment in two papers, and ethnicity and place of residence in one paper. The questions related to employment were frequently asked in the papers due to their relevance to the case study and analyses being conducted. One paper asks for the name of the respondent, and four papers do not make any general questions (Table 10).
TABLE 10
| ID | References | General questions | Number of papers |
|---|---|---|---|
| 10 | Fatehian et al. (2018) | Name | 1 |
| 4, 5, 6, 7 | López-Navarro et al. (2015), Covert et al. (2020), Lyons et al. (2020), Bustamante Picón et al. (2022) | Age | 4 |
| 4, 5, 6, 7 | López-Navarro et al. (2015), Covert et al. (2020), Lyons et al. (2020), Bustamante Picón et al. (2022) | Gender | 4 |
| 4 | Lyons et al. (2020) | Ethnicity | 1 |
| 4, 5, 7 | López-Navarro et al. (2015), Lyons et al. (2020), Bustamante Picón et al. (2022) | Education | 3 |
| 9 | Sun et al. (2009) | Living area | 1 |
| 6, 7 | Covert et al. (2020), Bustamante Picón et al. (2022) | Employment | 2 |
Type of the general questions in the selected papers.
4.2 Specific questions
Specific questions tend to be the bulk of the questions asked to participants. They are laid out in a variety of formats such as open-ended questions, closed-ended questions, Likert scale questions, rating questions, participatory mapping questions, and multiple questions. The most common question refers to risk perception, although the type of risk and level of trust in the government also appear (Table 11).
TABLE 11
| ID | References | Questions | Number of papers |
|---|---|---|---|
| 1, 2, 3, 5, 6, 7, 8 | Signorino (2012), Vangeli et al. (2014), López-Navarro et al. (2015), Kharytonov et al. (2017), Covert et al. (2020), Hung et al. (2020), Bustamante Picón et al. (2022) | Risk perception | 7 |
| 1, 3, 5 | Signorino (2012), López-Navarro et al. (2015), Hung et al. (2020) | Trust in the information provided by the government | 3 |
| 3, 5 | Signorino (2012), López-Navarro et al. (2015) | Trust in the information provided by companies | 2 |
| 2, 4, 7, 10 | Kharytonov et al. (2017), Fatehian et al. (2018), Lyons et al. (2020), Bustamante Picón et al. (2022) | Type of risk | 4 |
| 9, 10 | Sun et al. (2009), Fatehian et al. (2018) | Polluted area | 2 |
| 6, 8 | Vangeli et al. (2014), Covert et al. (2020) | Health risk perception | 2 |
| 4, 7 | Lyons et al. (2020), Bustamante Picón et al. (2022) | Distance to the polluted area | 2 |
Type of the specific questions in the selected papers.
4.2.1 Risk perception
Risk perception refers to the subjective assessment of the probability of a specified type of accident happening and how concerned people are about its consequences (Sjöberg et al., 2004). It also includes evaluations of the probability and consequences of a negative outcome (Sjöberg et al., 2004). Regarding methods, almost all papers rely on surveys and in-depth interviews to assess risk perception; only paper 2 (Kharytonov et al., 2017) used an open interview as a tool for data collection. Papers 1, 3, and 6 (Signorino, 2012; Covert et al., 2020; Hung et al., 2020) used statistical software, such as SPSS and Excel, to analyze answers and outcomes, while papers 2, 5, and 7 (López-Navarro et al., 2015; Kharytonov et al., 2017; Bustamante Picón et al., 2022) ran analyses using their own specific software.
In paper 1 (Hung et al., 2020), there are a variety of questions, including multiple-choice, Likert, and rating scale questions, as well as open-ended questions. Papers 3, 5, and 6 (Signorino, 2012; López-Navarro et al., 2015; Covert et al., 2020) attempt to address the question through the survey by using a variety of queries, including close-ended questions, multiple-choice questions, multiple questions, Likert and open-ended questions. Only paper 7 (Bustamante Picón et al., 2022) focuses on participatory mapping (Table 12) (Figure 3).
TABLE 12
| ID | Method-tools | Software | Specific questions category |
|---|---|---|---|
| 1 | survey and in-depth interview | SPSS | • trust in the information provided by the government |
| • risk perceptions | |||
| 2 | open interview | SAMASAFIA | • type of risk |
| • risk perceptions | |||
| 3 | survey and in-depth interview | SPSS | • trust in the information provided by companies |
| • risk perceptions | |||
| 4 | survey | GIS statistics and SPSS | • distance to the polluted area |
| • type of risk | |||
| 5 | primary and secondary documents and surveys | XLSTAT | • trust in the information provided by companies |
| • risk perceptions | |||
| 6 | survey and in-depth interview | Excel | • health risk perception |
| • risk perceptions | |||
| 7 | Survey | PPGIS based on Survey Monkey | • distance to the polluted area |
| • type of risk | |||
| • risk perceptions | |||
| 8 | survey and in-depth interview | SPSS and ArcMap GIS | • health risk perception |
| • risk perceptions | |||
| 9 | survey and in-depth interview | PPGIS and SPSS | • polluted area |
| 10 | survey and in-depth interview | Google Maps, Marker Cluster | • polluted area |
| API service, and VGI | • type of risk |
Publication addressed the specific questions.
FIGURE 3
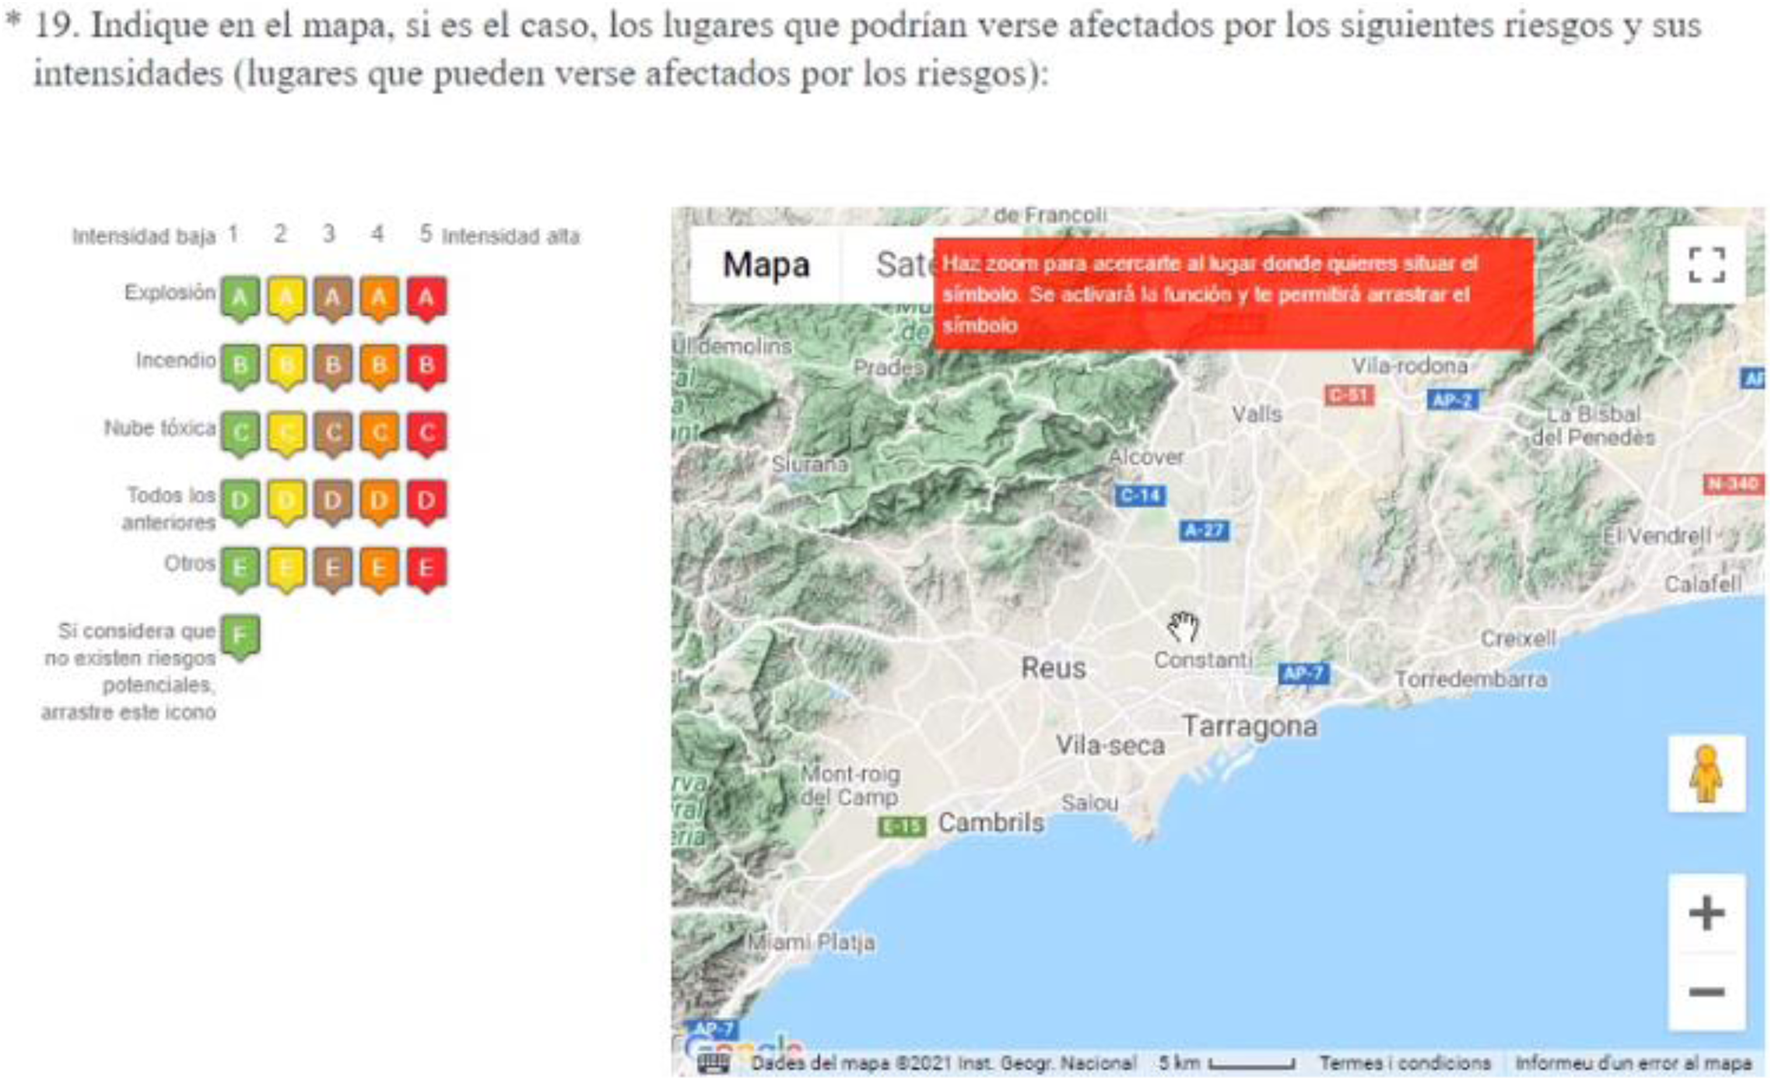
An example of a risk perception question in selected studies (Bustamante Picón et al., 2022). (Translation of figure: Indicate on the map, if applicable, the places that could be affected by the following risks and their intensities (places that may be affected by the risks).
4.2.2 Trust in the information provided by the government and companies
Citizens’ trust in the government as a whole is a central element in social psychology (Hassan et al., 2020). Trust in government also influences people’s support for government policies during crises, health policies a case in point (Sankar et al., 2003; Hassan et al., 2020). Trust in government information has been approached through surveys, in-depth interviews, and statistical software (Table 12).
4.2.3 Type of risk
Natural hazards are extreme natural phenomena with consequences that can harm natural and man-made environments. They occur worldwide, are rare in a particular location and time, and contribute to the evolution of the Earth’s landscape (Bathrellos et al., 2021; Skilodimou and Bathrellos, 2021). On the other hand, a technological hazard is an anthropogenic hazard that can harm people, the environment, or facilities (Skilodimou and Bathrellos, 2021). Desertification, water and soil pollution/degradation, land use changes, waste, and hazardous material accidents may also be related to technological hazards. Methodologically, these papers rely on open interviews, in-depth interviews, and surveys. Furthermore, the survey and interviews mostly used open-ended questions, multiple-choice questions, rating questions, Likert scale questions, and close-ended questions. In terms of software, paper 2 (Kharytonov et al., 2017) had its own software known as SAMASAFIA, while others used ArcMap, SPSS, and other commercial programs.
4.2.4 Polluted area
Papers 9 and 10 (Sun et al., 2009; Fatehian et al., 2018) elicit from participants where pollution occurs, in order to identify unknown polluted areas (Figure 4). Only the survey and in-depth interview were used as method tools for the publications that addressed the polluted area question. Furthermore, SPSS and Google Maps marker clusters were used as data collection and analysis software.
FIGURE 4
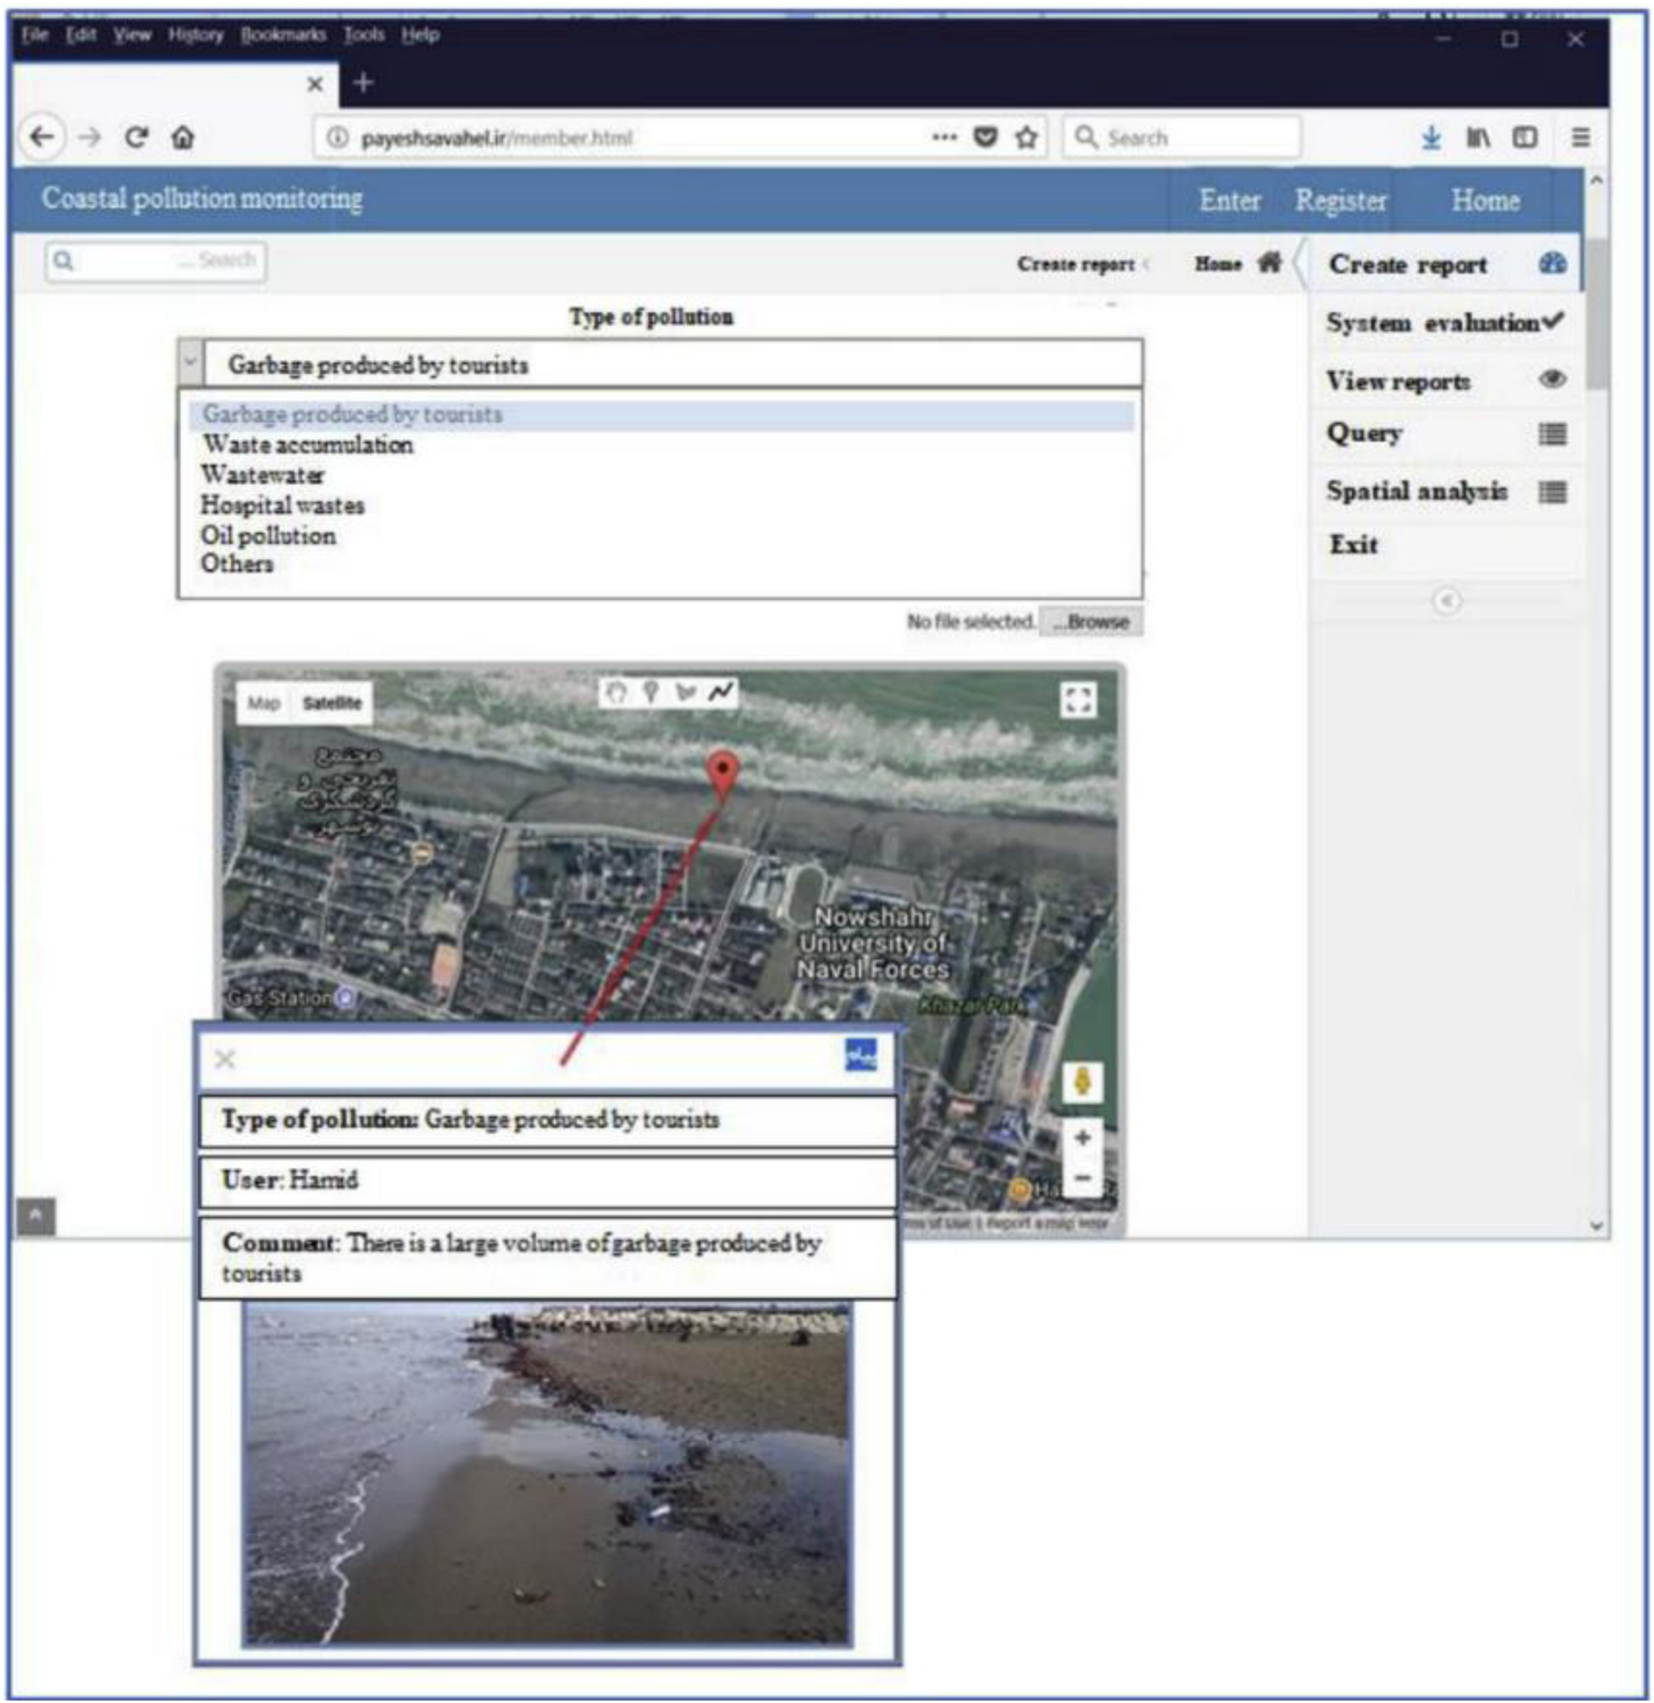
An example of the type of risk question in the selected studies (Fatehian et al., 2018).
4.2.5 Health risk perception
Perceptions of health-related risks are required in order to take protective action, such as adopting a healthier lifestyle, attending health screenings, and following medical advice (Renner et al., 2015). It appears logical that the greater the perceived risk is to one’s health, the stronger the motivation for protective action appears to be (Renner et al., 2015). As a result, it is critical to comprehend how people perceive health risks, the accuracy of these perceptions, and how information about one’s health risks is received. Papers 6 and 8 (Vangeli et al., 2014; Covert et al., 2020) focus on health risk perception using surveys and in-depth interviews. Some papers used a variety of tools such as paper 8 (Vangeli et al., 2014) where text questions, multiple-choice questions, rating questions, open-ended questions, and close-ended questions were all used in their public participation processes (Table 12).
4.2.6 Distance to the polluted area
Only papers 4 and 7 (Lyons et al., 2020; Bustamante Picón et al., 2022) focus on the distance to a polluted area. Both of them used the survey as a method tool, and paper 4 (Lyons et al., 2020) also used open-ended questions, rating questions, and close-ended questions.
4.2.7 Purpose and outcomes
Table 13 summarizes the purpose and outcomes addressed by each paper during the participatory process. Papers focus on a variety of topics, ranging from risk information (paper 1) to socioeconomic attitudes (paper 3) and environmental issues (e.g., papers 2, 6). However, most papers aim at assessing risk perception, from a myriad of slants (e.g., papers 4, 7, 8, 10).
TABLE 13
| ID | Purpose | Results |
|---|---|---|
| 1 | • To understand the relationships between local context, risk communication, and petrochemical pollution risk perception | • The respondents rated lower levels of trust in the risk information provided by the government |
| • To evaluate perceived risk, from the highest to the lowest | • The highest perceived level of risk is located along the coastline | |
| • To evaluate the levels of trust in risk information | ||
| 2 | • To monitor air pollution | • Significant increase in nitrogen dioxide concentrations in the atmosphere of industrial areas |
| • The revealed tendency to higher content of nitrogen dioxide in the atmosphere in large cities indicates the existence of risk fallout of nitric acid rain not only within cities but also in the surrounding suburban areas | ||
| 3 | • To compare risk perception profiles of the population residing in the neighbourhood of two petrochemical sites | • Respondents expressed their views on social risk of dangerous firms, air pollution, flooding and noise |
| 4 | • To analyze factors that could help people form more accurate perceptions or distort impressions | • Results show that risk perception significantly interacted with proximity to risk areas |
| 5 | • To evaluate the relationship between citizens participating in the perception of risk and trust in companies | • Trust in companies was lower among the residents living near the petrochemical area |
| • Risk perception was found to be more intense when they resided closer to the petrochemical port complex | ||
| 6 | • To evaluate the risk of pollution affecting water and air quality | • Participants point to dust and water as the main risks for their health |
| 7 | • To analyze population’s risk perception by applying a Public Participation Geographic Information System (PPGIS) | • The highest perceptions occur among those who live nearby (less than 1 km away) |
| • Population believes that their risk perception in the petrochemical industry is high | ||
| • Elderly people have more perception of risk | ||
| • A population with a family member working in the petrochemical industry have a lower risk perception | ||
| • Risk is perceived as higher at nighttime | ||
| 8 | • To investigate residents’ perceptions of an industrial accident with environmental consequences | • Resident’s risk perceptions were elicited after a severe environmental accident; people supported rehabilitating the site notwithstanding the cost |
| 9 | • To evaluate whether PPGIS can develop local geographic knowledge that should be considered when dealing with environmental pollution | • A good deal of the input was given by people living in the vicinity |
| 10 | • To design and implement a Volunteered Geographic Information (VGI)based system through the integration of concepts and methods from three areas of Geographic Information System (GIS), coastal pollution management, and public participation to monitor coastal pollution | • The highest amount of pollution belonged to scattered solid material, including tree foliage, wood chips, plaster, and other wastes |
Purpose and results of the selected papers.
5 Discussion and conclusion
It has been recognized that public participation and social science are pertinent tools in decision-making and problem-solving (Brown and Kyttä, 2014; Laatikainen et al., 2017); it is also acknowledged that conflicts involving the localization of hazardous facilities should be resolved through collaboration between the agencies or industries involved and those affected (Gouldson and Bebbington, 2007). This dialogue can be achieved by involving the public in a number of processes such as public meetings, citizen panels, or decision-making practices more transparent and democratic (Gouldson and Bebbington, 2007), and public participation activities. The public participation process on digital platforms provides a new approach to planning processes, allowing for greater and more diverse participation than traditional participatory methods (Saadallah, 2020). Despite the growing popularity of digital platforms for public participation, there is still a lack of research on how to effectively measure and analyze risk perception across these environments. While studies have been conducted on risk perception in general, there is a need for more research that specifically focuses on digital participation methods, such as Public Participation Geographic Information Systems (PPGIS) and Volunteered Geographic Information (VGI).
During the process of selecting and filtering the scientific literature (applying the inclusion/exclusion criteria), the number of available articles was considerably reduced; only ten publications were analysed. Thus, it is evident that there are few resources written in English that study the participatory process, petrochemical clusters and technological risk. For this reason, it should be noted that this study is not a comprehensive study of this topic, but it offers some new exploratory perspectives on the use of the participatory process in the perception of technological risk in petrochemical areas. Furthermore, it is considered that there is a need to extend the application of this type of tools in the perception of technological risk.
This paper demonstrates that the most frequently asked questions in PPGIS studies in petrochemical clusters relate to risk perception, followed by questions about perceived risk; this is relevant because it demonstrates the link between petrochemical clusters and various dimensions of risk. Another insight is the potential influence of age and gender in risk perception, as it would appear that outcomes correlated to both variables.
Future research should concentrate on understanding the relationship between social structure and risk perception, and also on the impacts of perceived risks on mental health, including stress and anxiety-related issues. Another pending study should focus on specific areas, such as the impact of noise and smells on the population, and the role of PPGIS procedures to gather this kind of information.
Statements
Data availability statement
The original contributions presented in the study are included in the article/Supplementary material, further inquiries can be directed to the corresponding author.
Author contributions
All authors contributed to the study design, data analysis, and interpretation of the results. MG drafted the article, and all authors critically revised the article. All authors contributed to the article and approved the submitted version.
Funding
This research was funded by 1) the Spanish Ministry of Science, Innovation and Universities (AEI/FEDER, UE) under Grant Grant RESTAURA (contract number PID2020-114363GB-I00); 2) the GRATET Research Group, which is funded by the Catalan Government under code 2009-SG744; 4) the Agency for Management of University and Research (AGAUR, Generalitat de Catalunya, Spain) through 2017-SGR-245 grant; and 5) the Spanish Ministry of Science and Innovation under Grant for predoctoral research training staff under code PRE-2021-098679. The APC was funded by the Spanish Ministry of Science, Innovation and Universities (AEI/FEDER, UE) under Grant RESTAURA (contract number PID2020-114363GB-I00).
Conflict of interest
The authors declare that the research was conducted in the absence of any commercial or financial relationships that could be construed as a potential conflict of interest.
Publisher’s note
All claims expressed in this article are solely those of the authors and do not necessarily represent those of their affiliated organizations, or those of the publisher, the editors and the reviewers. Any product that may be evaluated in this article, or claim that may be made by its manufacturer, is not guaranteed or endorsed by the publisher.
References
1
Bamber A. M. Hasanali S. H. Nair A. S. Watkins S. M. Vigil D. I. Van Dyke M. et al (2019). A systematic review of the epidemiologic literature assessing health outcomes in populations living near oil and natural gas operations: study quality and future recommendations. Int. J. Environ. Res. Public Health16, 2123. 10.3390/ijerph16122123
2
Bathrellos G. D. Skilodimou H. D. Zygouri V. Koukouvelas I. K. (2021). Landslide: a recurrent phenomenon? Landslide hazard assessment in mountainous areas of central Greece. Z. Fur Geomorphol.63, 95–114. 10.1127/zfg/2021/0670
3
Brown G. Kyttä M. (2014). Key issues and research priorities for public participation GIS (PPGIS): a synthesis based on empirical research. Appl. Geogr.46, 122–136. 10.1016/j.apgeog.2013.11.004
4
Bustamante Picón E. Alberich J. Pérez-Albert Y. (2022). The study of the perception of the petrochemical risk using a public participation geographic information system. A case applied to camp de tarragona (Spain). SSRN. 10.2139/ssrn.4110995
5
Covert H. H. Sherman M. Le D. Lichtveld M. Y. (2020). Environmental health risk relationships, responsibility, and sources of information among Vietnamese Americans in coastal Mississippi. Health Risk Soc.22, 362–376. 10.1080/13698575.2020.1840528
6
Delpino-Chamy M. Pérez Albert Y. (2022). Assessment of citizens’ perception of the built environment throughout digital platforms: a scoping review. Urban Sci.6, 46. 10.3390/urbansci6030046
7
Dettori M. Pittaluga P. Busonera G. Gugliotta C. Azara A. Piana A. et al (2020). Environmental risks perception among citizens living near industrial plants: a cross-sectional study. Int. J. Environ. Res. Public Health17, 4870. 10.3390/ijerph17134870
8
Domingo J. L. Marquès M. Nadal M. Schuhmacher M. (2020). Health risks for the population living near petrochemical industrial complexes. 1. Cancer risks: a review of the scientific literature. Environ. Res.186, 109495. 10.1016/j.envres.2020.109495
9
Dunn C. E. (2007). Participatory GIS — a people’s GIS?Prog. Hum. Geogr.31, 616–637. 10.1177/0309132507081493
10
Fatehian S. Jelokhani-Niaraki M. Kakroodi A. A. Dero Q. Y. Samany N. N. (2018). A volunteered geographic information system for managing environmental pollution of coastal zones: a case study in Nowshahr, Iran. Ocean Coast. Manag.163, 54–65. 10.1016/j.ocecoaman.2018.06.008
11
Fonzo D. D. Fabri A. Pasetto R. (2022). Distributive justice in environmental health hazards from industrial contamination: a systematic review of national and near-national assessments of social inequalities. Soc. Sci. Med.297, 114834. 10.1016/j.socscimed.2022.114834
12
Gouldson A. Bebbington J. (2007). Corporations and the governance of environmental risk. Environ. Plan. C Gov. Policy25, 4–20. 10.1068/c0614j
13
Haddaway N. R. Collins A. M. Coughlin D. Kirk S. (2015). The role of Google Scholar in evidence reviews and its applicability to grey literature searching. PloS One10 (9), e0138237. 10.1371/journal.pone.0138237
14
Hassan M. S. Halbusi H. A. Najem A. Razali A. Williams K. A. Mustamil N. M. (2020). Impact of risk perception on trust in government and self-efficiency during COVID-19 pandemic: does social media content help users adopt preventative measures?Res. Square. 10.21203/rs.3.rs-43836/v1
15
Hung H.-C. Li C.-F. Hung C.-H. (2020). Risk communication and local perceptions of petrochemical pollution risk: a comparison of the petrochemical industry complexes at different development stages. Environ. Sci. Policy114, 549–559. 10.1016/j.envsci.2020.09.014
16
IAP (2018). Core values, ethics, spectrum – the 3 pillars of public participation - international association for public participation. Available at: https://www.iap2.org/page/pillars.
17
Jelks N. O. Jennings V. Rigolon A. (2021). Green gentrification and health: a scoping review. Int. J. Environ. Res. Public Health18, 907. 10.3390/ijerph18030907
18
Kharytonov M. Benselhoub A. Kryvakovska R. Klimkina I. Bouhedja A. Bouabdallah S. et al (2017). Risk assessment of aerotechnogenic pollution generated by industrial enterprises in Algeria and Ukraine. Univ. Vasile Goldis Ser. Stiintele Vietii27, 99–104.
19
Laatikainen T. E. Broberg A. Kyttä M. (2017). The physical environment of positive places: exploring differences between age groups. Prev. Med.95, S85–S91. 10.1016/j.ypmed.2016.11.015
20
López-Navarro M. Á. Tortosa-Edo V. Llorens-Monzonís J. (2015). Environmental management systems and local community perceptions: the case of petrochemical complexes located in ports. Bus. Strategy Environ.24, 236–251. 10.1002/bse.1817
21
Lyons B. A. Akin H. Stroud N. J. (2020). Proximity (Mis)perception: public awareness of nuclear, refinery, and fracking sites. Risk Anal.40, 385–398. 10.1111/risa.13387
22
Matar S. Hatch L. F. (2001). Chemistry of petrochemical processes. Boston, USA: Gulf Professional Publication.
23
McLain R. Poe M. Biedenweg K. Cerveny L. Besser D. Blahna D. (2013). Making sense of human ecology mapping: an overview of approaches to integrating socio-spatial data into environmental planning. Hum. Ecol.41, 651–665. 10.1007/s10745-013-9573-0
24
Pasetto R. Mattioli B. Marsili D. (2019). Environmental justice in industrially contaminated sites. A review of scientific evidence in the WHO European region. Int. J. Environ. Res. Public Health16, 998. 10.3390/ijerph16060998
25
Renn O. (2017). Risk Governance: coping with uncertainty in a complex world. Oxford, England: Routledge.
26
Renn O. Benighaus C. (2013). Perception of technological risk: insights from research and lessons for risk communication and management. J. Risk Res.16, 293–313. 10.1080/13669877.2012.729522
27
Renner B. Gamp M. Schmälzle R. Schupp H. T. (2015). “Health risk perception,” in International encyclopedia of the social & behavioral sciences (Amsterdam, Netherlands: Elsevier), 702–709. 10.1016/B978-0-08-097086-8.14138-8
28
Saadallah D. M. (2020). Utilizing participatory mapping and PPGIS to examine the activities of local communities. Alexandria Eng. J.59, 263–274. 10.1016/j.aej.2019.12.038
29
Sankar P. Schairer C. Coffin S. (2003). Public mistrust: the unrecognized risk of the CDC smallpox vaccination program. Am. J. Bioeth.3, 22–25. 10.1162/152651603322614742
30
Sawicki D. S. Peterman D. R. (2002). Surveying the extent of PPGIS practice in the United States. Community Participation Geogr. Inf. Syst., 17–36. 10.1201/9780203469484.ch2
31
Scheer D. Ulbig E. (Editors) (2010). (Berlin, Germany: Federal Institute for Risk Assessment).Communication of risk and hazard from the angle of different stakeholders: final report
32
Sieber R. (2006). Public participation geographic information systems: a literature review and framework. Ann. Assoc. Am. Geogr.96, 491–507. 10.1111/j.1467-8306.2006.00702.x
33
Signorino G. (2012). Proximity and risk perception. Comparing risk perception ‘profiles’ in two petrochemical areas of Sicily (Augusta and Milazzo). J. Risk Res.15, 1223–1243. 10.1080/13669877.2012.670129
34
Sjöberg L. Moen B.-E. Rundmo T. (2004). Explaining risk perception. Eval. Psychometric Paradigm Risk Percept. Res.10 (2), 665–612.
35
Skilodimou H. D. Bathrellos G. D. (2021). Natural and technological hazards in urban areas: assessment, planning and solutions. Sustainability13, 8301. 10.3390/su13158301
36
Sun M. T.-W. Tsai Y.-T. Shih M.-C. Lin J. Y.-W. (2009). Public participation and the concept of space in environmental governance: an application of PPGIS. Public Adm. Dev.29, 250–261. 10.1002/pad.527
37
Tricco A. C. Lillie E. Zarin W. O’Brien K. K. Colquhoun H. Levac D. et al (2018). PRISMA extension for scoping reviews (PRISMA-ScR): checklist and explanation. Ann. Intern. Med.169, 467–473. 10.7326/M18-0850
38
Vangeli P. A. Koutsidou A. Gemitzi A. Tsagarakis K. P. (2014). Public perception for monitoring and management of environmental risk: the case of the tires’ fire in Drama region, Greece. J. Risk Res.17, 1183–1206. 10.1080/13669877.2013.875932
39
Weiner D. Harris T. M. Craig W. J. (2002). Community participation and geographic information systems. Community Participation Geogr. Inf. Syst., 3–16. 10.1201/9780203469484.pt1
40
Wendelboe-Nelson C. Kelly S. Kennedy M. Cherrie J. (2019). A scoping review mapping research on green space and associated mental health benefits. Int. J. Environ. Res. Public Health16, 2081. 10.3390/ijerph16122081
41
World Health Organization (2010). Environment and health risks: a review of the influence and Effects of social inequalities, Houston, TX, USA: Mickey Leland Center Information Portal.
42
Zeng J. Jiang M. Yuan M. (2020). Environmental risk perception, risk culture, and pro-environmental behavior. Int. J. Environ. Res. Public Health17, 1750. 10.3390/ijerph17051750
Summary
Keywords
perception of risk, technological site, public participation, GIS, participatory process
Citation
Gheitasi M, Serrano Giné D and Pérez-Albert Y (2023) Exploring public participation process and its differing degrees in influencing risk perception within the petrochemical industry: a scoping review. Front. Environ. Sci. 11:1218995. doi: 10.3389/fenvs.2023.1218995
Received
06 June 2023
Accepted
30 November 2023
Published
21 December 2023
Volume
11 - 2023
Edited by
Sudhir Kumar Pandey, Guru Ghasidas Vishwavidyalaya, India
Reviewed by
Ortwin Renn, Research Institute for Sustainability—Helmholtz Centre Potsdam, Germany
Chuanyuan Wang, Chinese Academy of Sciences (CAS), China
Updates
Copyright
© 2023 Gheitasi, Serrano Giné and Pérez-Albert.
This is an open-access article distributed under the terms of the Creative Commons Attribution License (CC BY). The use, distribution or reproduction in other forums is permitted, provided the original author(s) and the copyright owner(s) are credited and that the original publication in this journal is cited, in accordance with accepted academic practice. No use, distribution or reproduction is permitted which does not comply with these terms.
*Correspondence: Mahdi Gheitasi, mahdi.gheitasi@urv.cat
ORCID: Mahdi Gheitasi, orcid.org/0000-0002-9537-5993; David Serrano Giné, orcid.org/0000-0003-1676-7110; Yolanda Pérez Albert, orcid.org/0000-0003-1634-4986
Disclaimer
All claims expressed in this article are solely those of the authors and do not necessarily represent those of their affiliated organizations, or those of the publisher, the editors and the reviewers. Any product that may be evaluated in this article or claim that may be made by its manufacturer is not guaranteed or endorsed by the publisher.