 Nikoleta Jones1
 Alfie Begley1
 Chrysovalantis Malesios1*
 Juraj Svajda2James McGinlay1
 Panayiotis G. Dimitrakopoulos3
- 1Global Sustainable Development, School for Cross Faculty Studies, The Ramphal Building, University of Warwick, Coventry, United Kingdom
- 2Faculty of Natural Sciences, Matej Bel University, Banska Bystrica, Slovakia
- 3Department of Environment, University of the Aegean, Mytilene, Greece
Protected Areas (PAs) are the most widely applied tool for biodiversity conservation. The primary role of these areas is to protect and restore ecosystems, but it has become increasingly evident that in order to designate effective PAs it is also crucial to take into consideration how they contribute to sustainable local socio-economic targets. In the past decade studies focusing on social impacts of PAs have increasingly studied a number of impacts such as on people’s quality of life, income and connectedness to nature. Although the literature on social impacts of PAs has increased there is limited evidence regarding the distribution of these impacts across different locations inside and near PAs. Addressing this gap is useful for practitioners considering that it is now widely accepted that social impacts are a significant predictor for the level of public support for PA. In the current study we explore this topic and analyse the spatial distribution of perceived social impacts in 4 European Protected Areas using primary data from 1,251 households. We apply a new modeling framework using Bayesian statistics revealing that social impacts are often unevenly distributed between local communities and extend outside the boundaries of a PA. Our analysis also shows that spatial proximity with other people (what are the perceptions of people who live nearby) is more important for predicting most perceived social impacts of PAs compared to how close respondents are to a PA. Our results highlight that social impacts may be geographically unevenly distributed in PAs and we present a new way of measuring the spatial distribution of these impacts which can be useful for national park authorities and in general managers of PAs.
1 Introduction
The Designation of Protected Areas (PAs) is the most important policy internationally for the protection of biodiversity. According to the International Union for the Conservation of Nature (IUCN) a PA is a clearly defined geographical area, recognised, dedicated and managed, through legal or other effective means, to achieve the long-term conservation of nature with associated ecosystem services and cultural values (Day et al., 2012). At an international level, approximately 17% of terrestrial and inland water areas and 8% of coastal waters and the ocean consist of PAs (UNEP, 2021).
Europe is the region in the world with proportionally the highest number of PAs (European Environment Agency, 2017). Currently, it is estimated that approximately 22.7% of land and 8.25% of water is protected in the region under a mosaic of designations such as the NATURA 2000 network (areas listed under both the Habitats and Birds Directives 92/43/EEC, 2009/147/EC), the Ramsar convention and nature reserves (https://biodiversity.europa.eu/protected-areas/coverage-representativity). Despite the wide designation of PAs, human pressures on biodiversity remain significant in the European region (Mammides et al., 2020). To address this challenge the new EU Biodiversity Strategy for 2030 states that PAs will remain an instrumental policy tool for the protection of biodiversity in the European region having also a significant role for the mitigation of the adverse impacts of climate change (European Commission, 2020). Specifically, the strategy aims to conserve 30% of the land area and 30% of the sea area in the European Union in line with the Kumnig-Montreal Global Biodiversity Framework (https://www.cbd.int/gbf/).
Although PAs were initially designed as a policy tool to protect biodiversity, it is now widely recognised that their role should be much broader and PA management plans need also to promote local socio-economic priorities. This is because the ecological and social effectiveness of PAs is closely interconnected (Ban et al., 2019).
One of the most important obstacles in designating effective PAs is the lack of consideration of social impacts. Although PAs can have significant positive social impacts, including beneficial effects on health and wellbeing (Romagosa, 2018; Burdon et al., 2019; Rodrigues et al., 2022) they can also have social costs for certain groups in the local communities living inside or near their borders (Jones et al., 2020a). The designation of PAs often introduces fundamental changes to local and regional economies and societies, such as restrictions on fishing and logging activities (Lockwood, 2010; Brandt et al., 2015; Schreckenberg et al., 2016; Campbell et al., 2017; Ban et al., 2019; Bennett et al., 2019). These negative impacts on local communities often results in inefficient PA management (Rife et al., 2013) where locals ignore PA regulations resulting in significant damage to biodiversity.
Following the Convention of Biological Diversity and Aichi target 11 (CBD, 2020) several studies focused on issues of social equity in PAs (Franks et al., 2018; Zafra-Calvo et al., 2019), emphasizing the need to conduct subjective assessments of social impacts (capturing perceived social impacts) (Bennett et al., 2019; Jones et al., 2020b) and explore how these impacts are distributed between different stakeholders (de Lange et al., 2016; Oldekop et al., 2016). Social impacts are important as they are closely linked with the level of public support for PAs with higher benefits resulting in higher levels of acceptance (Bennett et al., 2019; Buta et al., 2014; McGinlay et al., 2023).
Despite the increase of studies on this topic, there is very limited evidence regarding the spatial distribution of impacts within a PA and thus there is a lack of evidence regarding whether benefits and costs of PAs are distributed in an equitable manner across different communities living near or inside a PA. An existing study has found that living near a PA has a positive effect on wellbeing levels in countries in the Global South (Naidoo et al., 2019). Furthermore, Jones et al. (2020b) found that an individual’s location in the PA is an explanatory parameter for people’s wellbeing level. Going beyond these two publications, no study currently exists that explores how social impacts of PAs are distributed across different communities and what are the key factors explaining spatial variations of social impacts. A key question that remains unclear is whether PAs are equitable from a spatial perspective or are there issues with the distribution of social impacts? As a result of the lack of studies there is also no suggested methodology in the literature on how to assess the spatial distribution of social impacts.
This is an important area of research considering that PAs are primarily a spatial policy tool with a geographical focus (IUCN, 2008). Specific boundaries of the PA are set within which certain restrictions exist for locals. In this study, we contribute to this line of enquiry and explore whether the location of residents in a PA along with other social factors influence the outcomes people perceive as a result of a PA. These include the impact of the PA on their personal income, their quality of life, their involvement in recreational activities, how well they are connected to nature and their relations with other members of the local community. In order to explore potential links between people’s location and perceived social impacts we propose a new modeling framework utilizing data from 1,251 structured questionnaires distributed to local residents of four European PAs.
2 Methods
2.1 Data collection
In order to explore the spatial distribution of perceived social impacts we collected primary data using structured questionnaires from four PAs between 2020-2021: Prespes National Park (Greece), Pieniny National Park (Slovakia), Eifel National Park (Germany) and Peak District National Park (United Kingdom) (Figure 1).
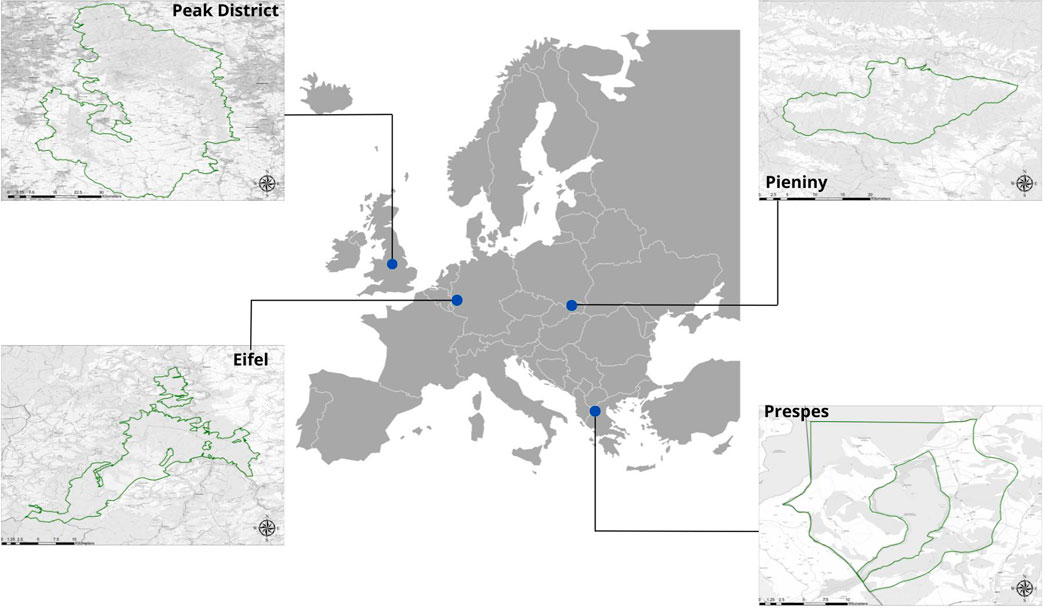
FIGURE 1. Location of the case study areas.
The four PAs were selected based on the following criteria: a) areas that have local communities living inside their boundaries; b) areas that are large enough to allow the exploration of spatial distribution; c) areas that are designated as National Parks and managed mainly by the state so that when comparing the results the governance framework is similar; d) areas that are in Europe as they fall under similar legislative framework.
Data on perceived social impacts of residents of the PAs were solely related to impacts of specific the PA each respondent resides and not to other remaining protected areas.
In all research areas, the sampling frame included those who live inside the PA or within a 10 km buffer zone around the PA boundary. The specific distance from the borders of the PAs was inspired by previous research (Oldekop et al., 2016; Naidoo et al., 2019) arguing that the distance of 10 km could be considered the threshold at which PAs can exert socio-economic impacts to residents. Details of the research areas, the sampling frame, the sample and the mean of survey distribution are available in Table 1. Due to the low response rate expected in online surveys the sample invited to participate to these surveys was much higher compared to the one of the face to face surveys.
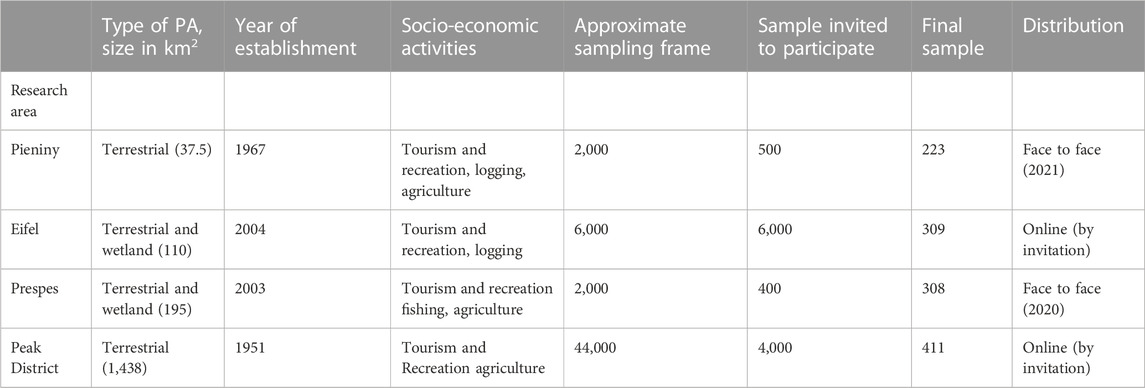
TABLE 1. Characteristics of PAs and details of distribution process.
2.2 Questionnaire description
The questionnaire captured perceptions about social impacts of the PA, socio-economic attributes and the location of the individual. We explored perceptions of 5 types of social impacts: Personal income, quality of life, recreation, connectedness to nature and social relations. These were considered to be the most frequent impacts noted in PAs in Europe based on a recent literature review (Jones et al., 2020b).
Geographical coordinates of local residents’ were used to capture the location of the respondents at village/town level (i.e., urban areas within or at a maximum of 10 km distance from borders of PAs). Regarding the independent variables a number of socio-economic indicators were captured which have been identified in the literature as potential determinants of people’s perceptions of PAs (Table 2). These included: a) place attachment (Lin and Lockwood, 2014); b) subjective wellbeing (Jones et al., 2020b); c) trust in institutions managing the PA (Cherry et al., 2018; Bennett et al., 2019); d) demographics (gender, age, education and income) and e) personal socio-environmental values (Stern et al., 1999; Lopez-Mosquera and Sanchez, 2012; Wynveen et al., 2015). A detailed description of dependent variables (impacts) and independent variables is provided in Table 2.
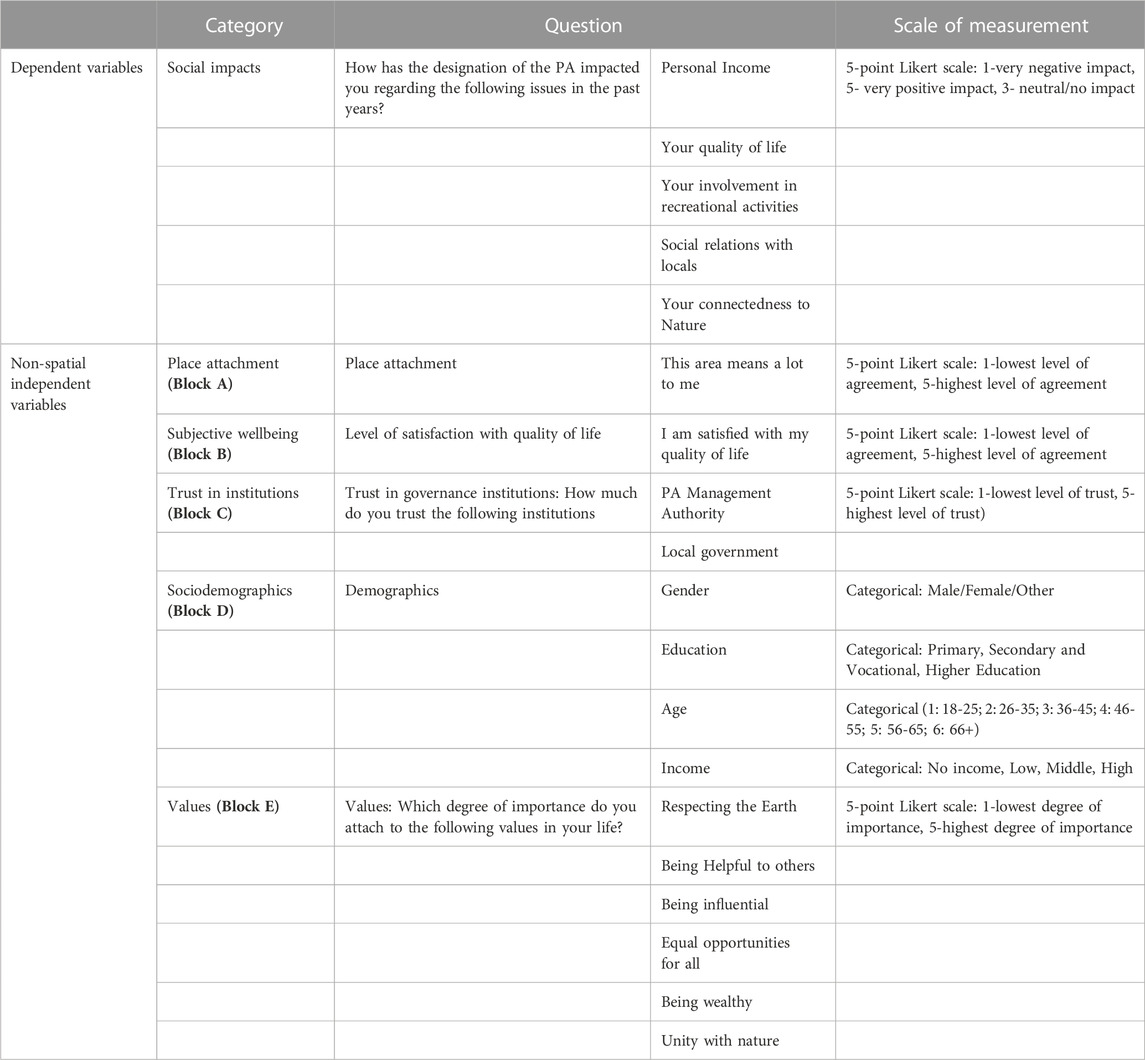
TABLE 2. Description of dependent variables (impacts) & independent non-spatial variables.
2.3 Data analysis
We developed a detailed methodological framework in order to explore the spatial distribution of social impacts in the PAs and also investigate whether spatial aspects may influence perceived social impacts (see also Figure 2).
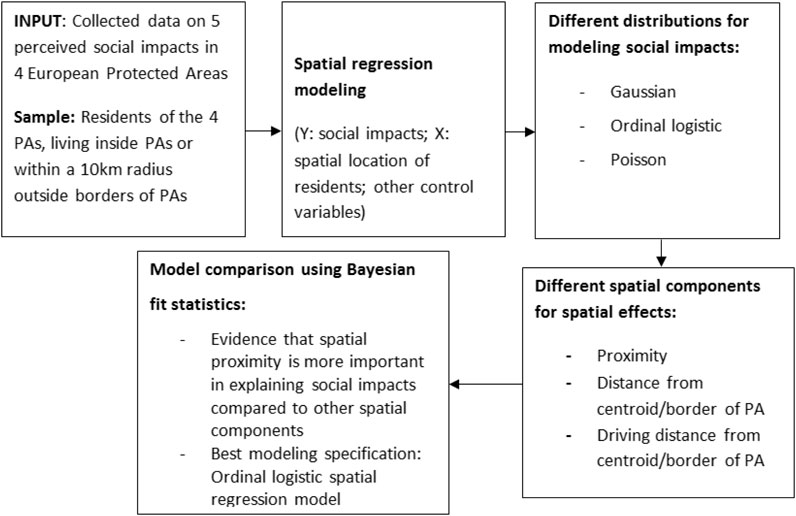
FIGURE 2. Step-by-step description of methods of the current study.
Step 1:. We first examined overall spatial effects through the calculation of Global Moran’s I statistic of spatial autocorrelation which is frequently used for ecological data (Beguin et al., 2012; Gaspard et al., 2019; Legendre, 1993; Lichstein et al., 2002). In this study Moran’s I are used to estimate if one respondent’s perceptions of social impacts are similar/dissimilar to the perceptions of social impacts of other respondents located nearby or whether location does not play any role at all. A detailed description of the Global Moran’s I statistic process is included in Supplementary Appendix SB. In particular, we calculated global Moran’s (for the complete datasets) and local Moran’s I statistic (for sub-regions within each PA) for a more refined examination of existence of spatial autocorrelations in the data.
Step 2:. Spatial maps were created, using ArcGIS, visualizing the distribution of impacts across different areas and the estimated Moran’s values. To identify the location of potentially significant clusters, constructed spatial maps were also created. All spatial maps for the visualization of the spatial clustering of perceived impacts in the study areas were constructed with the use of QGIS software (QGIS Development Team, 2015). Further details regarding the construction of the maps are available in Supplementary Appendix SB2.
Step 3:. Bayesian regression spatial modeling was used for the in-depth investigation of different spatial effects including the role of respondent’s location in relation to the PA and the role of spatial proximity between local residents regarding their views of perceived impacts. The former type of spatial information was measured through two distinct distances (measured in km): the distance (Euclidean and driving) from the centroid of the protected area and the distance (Euclidean and driving) from the border of the protected area. In addition, we estimated the driving distance (km) and driving time (in minutes) of each resident to the centroid/border of their protected area. Euclidean distance between residents was also utilized. Table 3 presents the different spatial variables included in the model.
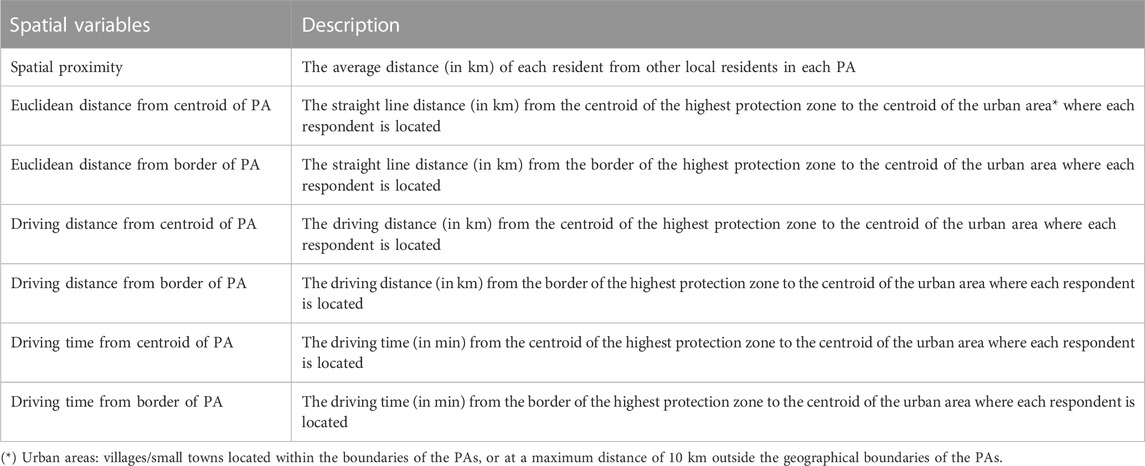
TABLE 3. Description of spatial variables used as predictors of impacts.
Step 4:. In this last step, a two-stage modelling approach was followed. Initially models were fitted including non-spatial independent variables to explain social impacts of respondents (these variables are presented in detail in Table 2). Then, upon selecting the statistically significant independent non-spatial variables, spatial measures were added in the models to explore the simultaneous effect of spatial and non-spatial information on social impacts. We used Bayesian statistics and employed suitably chosen regression models that combine both typical explanatory variables along with spatial information that is included in the models in the form of spatial components. Due to few missing data in certain variables, a multiple imputation (MI) methodology was applied, which is considered one of the most reliable processes for handling missing data in multivariate analysis (Rubin, 1996; Schafer and Graham, 2002). To perform MI, the SPSS MI module was utilized (IBM Corp. Released, 2020).
To model the social impacts of PAs, we used a set of explanatory variables (see Table 2). The selected predictor variables were included in the regression modeling as blocks, based upon the associations of certain variables to each other. We compared the performance of three modelling specifications under the wider family of Generalized Linear Models (GLMs) (Gaussian, Poisson and a logistic regression model with a logit link function). In all models the dependent variables were the five impacts, and predictors were the 5 blocks of predictors (A, B, C, D and E) (Table 2). Using a forward stepwise process, where each block of independent variables is added in the previous regression model, we select the best fitted model to the data. At a next stage, we analyzed the relationship between social impacts and spatial dependence using a variety of distance measures by means of the generalized regression modeling (GLM) approach and the best selected models of the 6 blocks of control variables following the Bayesian paradigm (Lindley, 1983). All analyses were carried out using the WinBUGS software (Lunn et al., 2000).
A detailed description of statistical regression models utilized for our analysis is included in Supplementary Appendix SB3.
3 Results
3.1 Social impacts
Regarding perceived social impacts all 5 impacts measured in the questionnaire were considered beneficial by respondents or as having no impact with average scores being over or very close to the average score of 3. Table 3 presents the mean score for each impact in each PA. Impact on income was considered as the least positive in all study areas compared to the other four impacts. Higher benefits were recorded in the Peak District National Park (Table 4) where 4 out of the 5 impacts had an average score over 4.
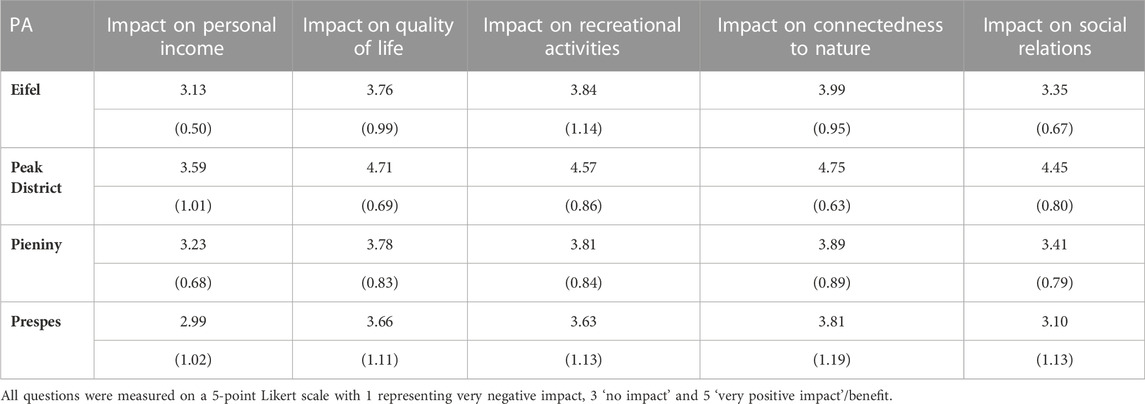
TABLE 4. Average impacts for the 4 PAs (standard deviation in parentheses).
3.2 Spatial distribution of social impacts
The global Moran’s values indicated a positive and statistically significant (p-value<0.1) spatial autocorrelation (I > 0) for most impacts (Table 5). This result reveals significant spatial dependence in the majority of perceived social impacts in all PAs of our study. In the next sections we present the spatial distribution of impacts in each case study. We also include one example map for each case study visualising the average distribution of one impact along with the average local Moran’s I values for each sub-region (Figures 3-6). Maps for the remaining impacts are included in the Supplementary Appendix SC.

TABLE 5. Moran’s I global index along with corresponding significances for each social impact in each PA.
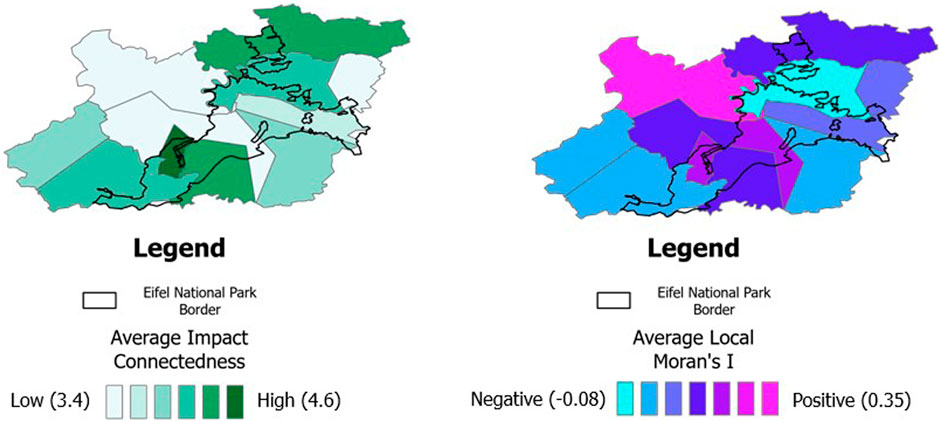
FIGURE 3. Spatial distribution of connectedness to nature in Eifel National Park (alongside local Moran’s I results).
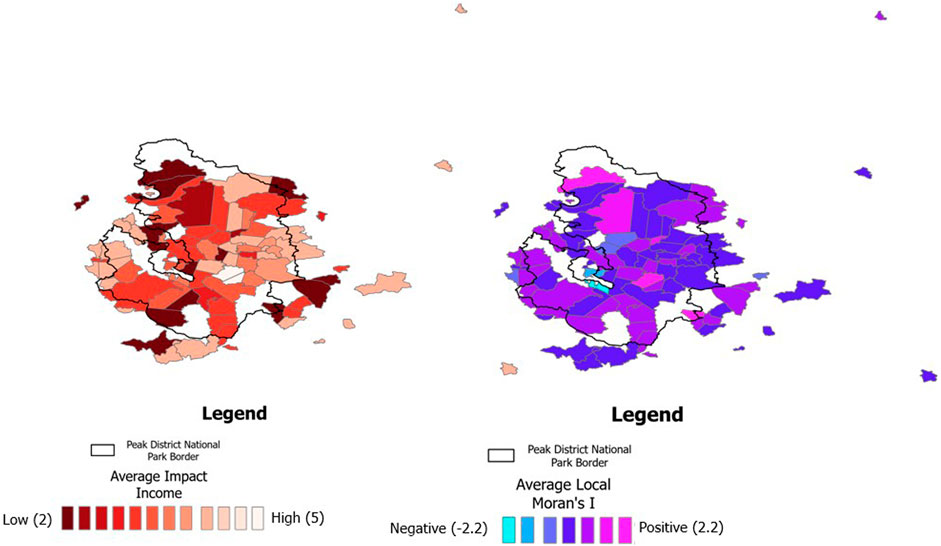
FIGURE 4. Spatial distribution of impact on personal income in the Peak District National Park (alongside local Moran’s I results).
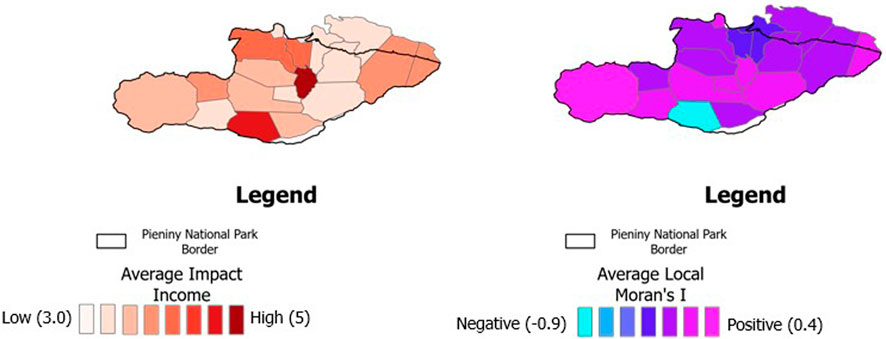
FIGURE 5. Spatial distribution of impact on personal income in Pieniny national park (alongside local Moran’s I results).
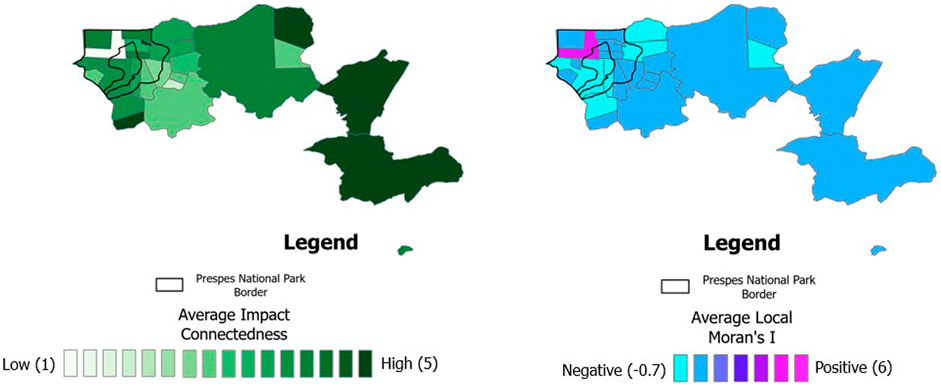
FIGURE 6. Spatial distribution of connectedness to nature in Prespes national park (alongside local Moran’s I results).
3.2.1 Eifel National Park
In Eifel National Park, all impacts were evaluated above the mean value of the Likert scale, revealing several benefits for local communities. Most important positive impact was connectedness to nature followed by quality of life. In terms of spatial variation, there were similarities in the responses of participants especially in areas where people thought that the benefits were not as important (compared to other areas of the national park) (Figure 3). Furthermore, respondents in the South and East of the park and in one area in the North perceived more benefits for their quality of life. In terms of impact on recreation, areas where higher scores were noted also tended to be dissimilar. Areas with lower benefit scores, such as areas that are enclosed by the park, had high positive local Moran’s I suggesting that respondents share their views (responses were more similar on these locations).
3.2.2 Peak District National Park
In the Peak District, overall, respondents perceive significant benefits from the existence of the park. This is more evident for the impact of the park on Quality of Life, Recreation and Connectedness to Nature (Table 4). Regarding similarity of values within locations our results show that there is a tendency for these values to be similar in areas where people perceive higher benefits on personal income (Figure 4). Higher values for the impact on quality of life correlate with a slight level of similarity between respondents. No spatial variation was noted for connectedness to nature whereas impact on social relations tended to be more beneficial in the north, central and east regions of the park. However, these areas tend to have dissimilar values where the lowest impact average area has the highest level of similar values.
3.2.3 Pieniny National Park
In Pieniny National Park urban communities, such as Spisska Stara Ves, had higher perceived social impacts overall. Impact on Quality of Life was the most important benefit according to respondents (Table 4). In terms of spatial variations, impact on income and social relations values tend to be similar across the locations of the park (Figure 5). In the remaining three impacts (Quality of Life, Recreation and Connectedness to Nature) the local Moran’s I values tend to suggest higher dissimilarity between locations.
3.2.4 Prespes National Park
In Prespes National Park social impacts were evaluated lower compared to the other 3 sites of our study (Table 4) with lowest values noted for impact on income. In the north-west of the park, on the shore of lake Prespa, low impact scores are noted with high spatial similarity. On the contrary, respondents from the eastern parts of the park noted higher benefits but there is more specific pattern of spatial similarity or dissimilarity. This suggests a high level of variation in the impact effect across the different social indicators.
3.3 The effect of spatial and non-spatial parameters on perceived social impacts
We completed a two-stage analysis to select the statistically significant non-spatial independent variables and then at a second stage we add the three spatial components to select between them the best indicator. This process allowed us to select the best model that includes the best performed non-spatial and spatial independent components.
3.3.1 Effect of non-spatial parameters
Results of the best model fit in terms of distributional specification for the response variables, utilizing the non-spatial independent indicators (first stage of step 4 in our methodology including the non-spatial variables) are included in the Supplementary Appendix Tables SA3, 4. Inspection of the model fit outputs reveals that Poisson regression gives the most parsimonious results in terms of variable selection, with this modeling specification providing the smallest number of statistically significant predictors when compared to other choices. Upon selecting the best regression models for the prediction of the five impacts, given by the ordinal logistic models fitted to the data, we can see that in all cases, all predictors are statistically significant (see Supplementary Appendix Tables SA2.
Table 6 presents the estimated median coefficients for the best selected models for each social impact, based upon the goodness-of-fit selection. It is noted that among the most important non-spatial predictors of social impacts are “Place attachment” and “Subjective wellbeing”, both affecting positively and significantly all social impacts. Personal environmental values indicator is positively associated with all perceived impacts. Positive connection in four out of the five impacts were found for trust in the management authority of the park. It is interesting though that trust in the national government is associated with perceived social impacts in a negative way.
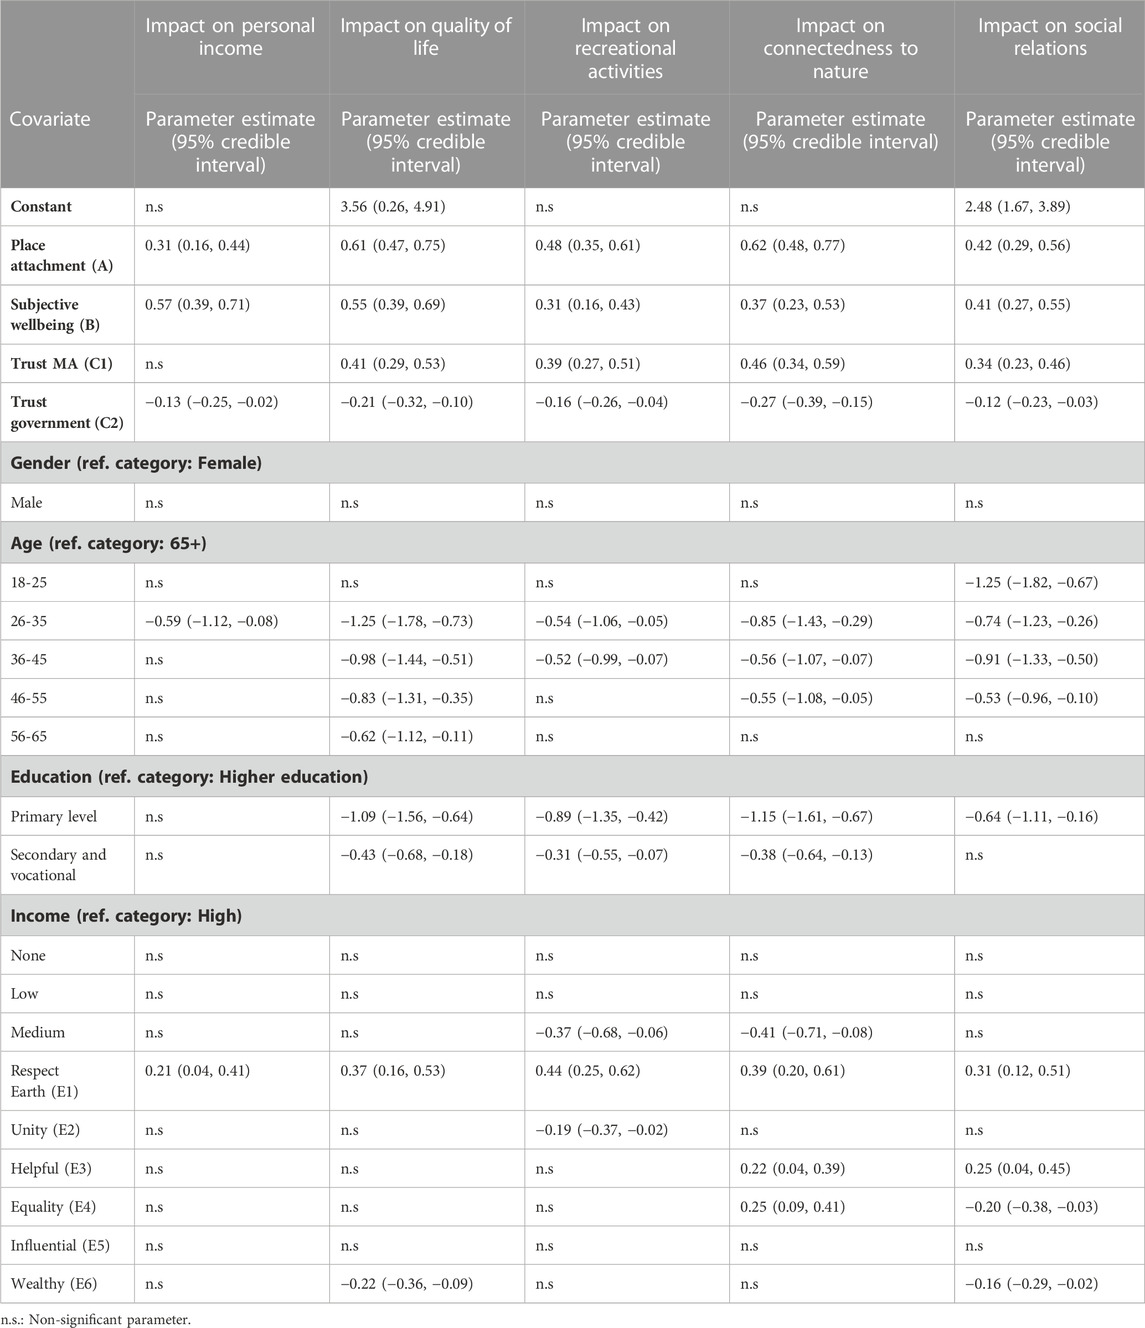
TABLE 6. Parameter estimates (median values) along with 95% credible intervals (in the parentheses) for the statistically significant covariates in the best selected regression models for the five perceived social impacts.
Respondents aged 26–35 years had the most negative perceptions on social impacts, in comparison to citizens of all other age categories. Education was also a significant predictor of social impacts in four out of the five models, with people of lower educational levels generally perceiving lower benefits in comparison to respondents with a higher educational level. Other demographic, such as gender and income, did not seem to have a significant role in explaining variations of social impacts.
3.3.2 Results of a model exploring the effect of spatial and non-spatial components
Table 7 presents the results of model fit for the ordinal logistic regression as selected from the non-spatial analysis, with the addition of the various distance measures (spatial independent variables, Table 7). Our results reveal that spatial proximity between local residents is a better measure of spatial dependence for explaining variations in perceived impacts when compared to other types of spatial dependence, i.e., relative location and accessibility to the PA. This significant effect of proximity is clear on all impacts except for impact on income, where it seems that spatial effects are not important for its estimation (the inclusion of each one of the spatial variables either increases or keeps at the same levels goodness-of-fit statistics produced by the non-spatial regression models-differences in the DIC values are below the 3 units which is required for indication of statistical difference between fitted models).
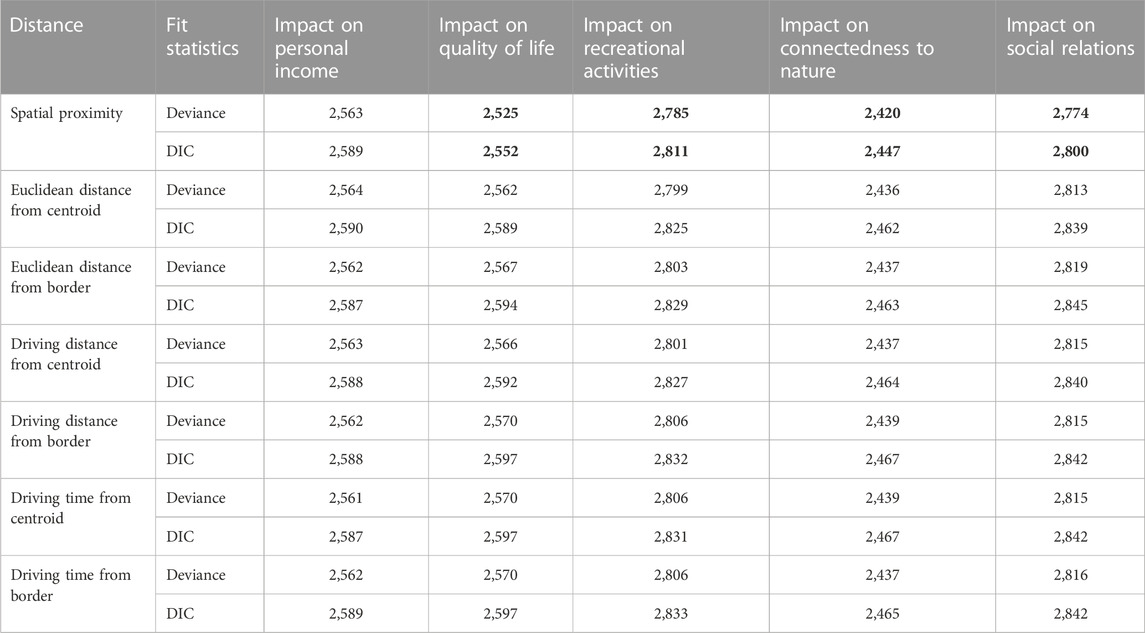
TABLE 7. Fit statistics for the best selected models with additional spatial components (in bold the lowest fit values indicating best fit for models including only statistically significant predictors).
When comparing the other three types of spatial distance (Euclidean and driving distance from centroid/border of PAs, driving time from centroid/borders), no large differences are observed.
The Euclidean distance from the centroid of the PAs results to models with a better fit compared to other type of distances for all impacts apart from income. This is an indication that the location of respondents in relation to the centroid of a PA is more important compared to accessibility to the national park (measured with driving distance and driving time in our study).
As a final assessment of model performance, for the best selected spatial models for the five impacts we assessed predictive performance visually by constructing spatial maps combining the observed values of impacts with their predictive values as obtained by the spatial regression modeling. Figure 7 compares observed with predicted values for the impacts on income and connectedness to nature. Blue points in the graphs indicate a good predictive performance (observed value falls within the 95% credible intervals of prediction), whereas red points indicate poor performance (observed value falls outside the 95% credible intervals). According to these figures the impact on income spatial model presented the best fit to the data (Figure 7). Social relations, recreation and quality of life also predicted relatively good fit, with few exceptions of values falling outside the credible intervals. Connectedness to nature had the worst fit of all impacts. The performance plots for the rest of the impacts in each national park in our study have been included in the Supplementary Appendix SC.
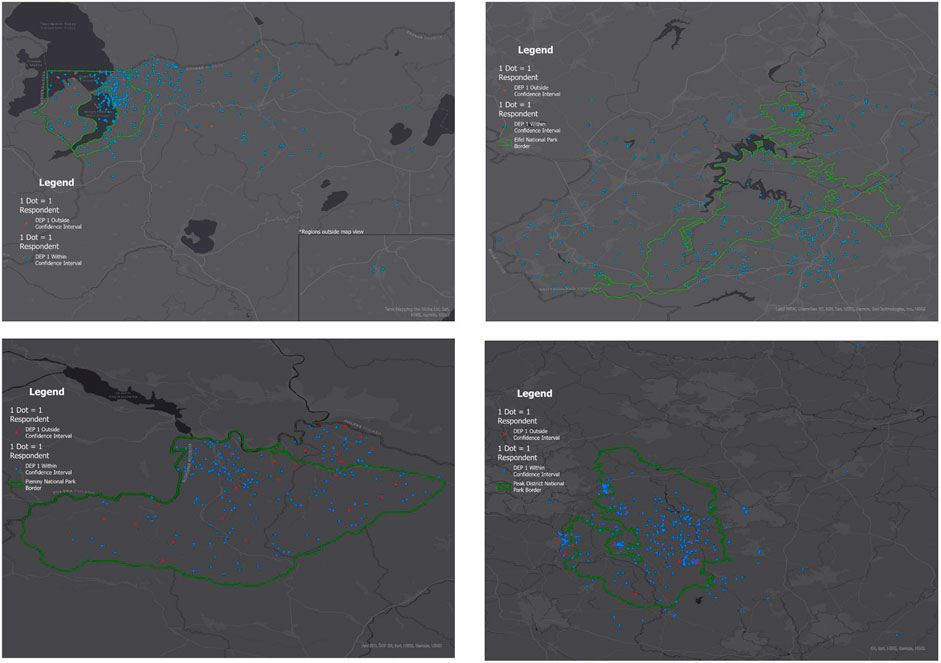
FIGURE 7. Predictive spatial maps for the 4 PAs for impact on income.
4 Discussion
In this study we examined the geographical distribution of social impacts in four European Protected Areas as these are perceived by local communities. Our analysis explores how social impacts are distributed in different locations within or close to a PA and also whether the location of the respondent in relation to the boundaries of the PA influence their perceptions.
Our results show that there are differences on how social impacts are distributed across different communities living inside or very close to the boundaries of a PA. For example, in Pieniny National Park it was noted that urban communities (Spisska Stara Ves) have higher perceived social impacts revealing a better appreciation of the contribution of the park on how they connect to nature and their quality of life. In Prespes National Park our results show that those who live closer to the park perceive lower benefits regarding certain impacts. These findings may reveal issues with uneven geographical distribution of social impacts in protected areas.
In order to understand why social impacts may be unevenly distributed we explored whether spatial differentiations in social impacts are attributed to the location of the individual (in relation to the boundaries of the PA) or whether this is explained by other social parameters. From the global and local Moran values analysis we note a significant spatial dependence in most perceived social impacts in the four PAs under study. Our results showed that proximity of respondents to each other is the most important determinant of perceived social impacts when compared to all 7 spatial measures included in the study, including proximity to the border and proximity to the centroid of the PA (average distance, straight line, driving distance). This result reveals that the proximity to the border of the PA determines to some extent how people perceive social impacts but a more important predictor are the perceptions of people who the respondent lives nearby. This was particularly evident in the case of negative perceptions as in areas where people tended to perceive lower benefits participants tended to have similar perceptions. This result was verified in the four out of the five impacts, with the exception of impact on income. It seems that when people consider impact of PAs on income, the spatial proximity is no longer a significant connecting factor for similar perceptions, in comparison to all other perceived impacts. This result may be explained considering that impact on income is expected to be closely linked with touristic activities and the location of specific infrastructure within a national park. Thus, perceptions may be influenced more by the proximity of economic activities rather than the community within which an individual lives and we would propose that additional research is conducted in this direction.
As proximity cannot be seen in isolation as an indicator explaining perceived social impacts we also tested whether other social parameters influence perceptions. We used indicators that have been highlighted in the literature as potential predictors of people’s perceptions for PAs (Lopez-Mosquera and Sanchez, 2012; Steg et al., 2018; Lin and Lockwood, 2014; Wynveen et al., 2015; Cherry et al., 2018; Bennett et al., 2019; Jones et al., 2020b). Apart from location, one of the most important parameters explaining perceived social impacts was place attachment. This result is in line with findings from Buta et al. (2014) where place attachment was found to influence pro-environmental civic engagement beliefs for PAs (Buta et al., 2014). Another indicator influencing perceptions of social impacts in our study was the level of trust in the PA management authority with residents who trusted the park authorities perceiving higher benefits. This type of trust can be considered a governance indicator and has been linked to public acceptance for PAs in previous studies (Cherry et al., 2018; Bennett et al., 2019). A possible explanation is that trust is linked with transparency aspects in PA management (Gall and Rodwell, 2016; Engen et al., 2018). Thus in cases where people feel that management authorities are transparent via channels of communication may also perceive higher benefits. These results can be helpful for practitioners when trying to explore the level of impacts of PAs as these are perceived by local communities.
When looking at the fit of the models we also noted that the location of the individual and social parameters contribute significantly in predicting all perceived impacts apart from Connectedness to Nature. A possible explanation is that connectedness to nature may not be linked directly to the location of the respondents in relation to a PA and its wider impacts compared to other social outcomes such as recreation and income.
These findings show that future research would benefit from exploring not only how impacts are distributed across different groups but also how these impacts are distributed within the geographical area of a PA and beyond its boundaries. This is an important topic considering that Aichi Target 11 in the Convention of Biological Diversity (CBD, 2020) highlights the need to consider issues of social equity and governance in PAs. In this context, social impacts play a central role but the majority of studies so far have focused on the distribution of impacts across different stakeholders (e.g., de Lange et al., 2016; Dawson et al., 2017). Since PAs are spatially designed and their social and economic restrictions are influenced by geographical boundaries policymakers would benefit, when attempting to address issues around social equity, to also consider that the designation of a PA will impact different areas of a PA in different ways. Our study provides a step-by-step methodological approach which can be useful for practitioners interested in capturing the spatial distribution of social impacts in their area.
5 Conclusion
In this study we explored the distribution of social impacts in four European PAs focusing on the spatial distribution of social impacts as these are perceived by local communities living near or inside PAs. We applied a new modeling framework using spatial autocorrelation analysis, spatial GIS mapping and Bayesian regression analysis taking into account three sources for spatial effects: spatial proximity between local residents, spatial distance from the centroid of a PA and distance from the border of a PA. Our analysis reveals that spatial proximity of respondents is more important for predicting perceived impacts of PAs than the other two types of spatial effects. Other social predictors of perceived impacts are place attachment, trust in institutions and an individual’s subjective wellbeing confirming previous studies. We argue that apart from exploring the distribution of impacts across different stakeholders, practitioners may find useful to consider also the spatial distribution of these impacts across different geographical areas of a PA. Conducting social impact assessments with a spatial angle can be essential in order to plan interventions mitigating negative impacts in areas of PAs which can be considered more disadvantaged compared to others receiving a variety of benefits such as increase of income from tourism and direct access to recreational activities. Through such interventions practitioners can maximise nature’s contributions to people across all areas of a PA leading also to higher levels of support for the designation of these areas.
Data availability statement
The datasets presented in this article are not readily available because We are restricted to sharing only secondary data due to ethics approvals by the ERC and Warwick University. Requests to access the datasets should be directed to nikoleta.jones@warwick.ac.uk.
Ethics statement
The studies involving humans were approved by the University of Cambridge and the University of Warwick respective ethics committee. The studies were conducted in accordance with the local legislation and institutional requirements. The participants provided their written informed consent to participate in this study.
Author contributions
All authors contributed to developing the main ideas and framework of the paper. CM, NJ, and AB. carried out the data analyses; CM, AB, NJ, JS, JM, and PD. contributed to the writing process. All authors contributed to the article and approved the submitted version.
Funding
The project has received funding from the European Research Council (ERC) under the European Union’s Horizon 2020 research programme (Project FIDELIO, grant agreement No. 802605).
Conflict of interest
The authors declare that the research was conducted in the absence of any commercial or financial relationships that could be construed as a potential conflict of interest.
Publisher’s note
All claims expressed in this article are solely those of the authors and do not necessarily represent those of their affiliated organizations, or those of the publisher, the editors and the reviewers. Any product that may be evaluated in this article, or claim that may be made by its manufacturer, is not guaranteed or endorsed by the publisher.
Supplementary material
The Supplementary Material for this article can be found online at: https://www.frontiersin.org/articles/10.3389/fenvs.2023.1229437/full#supplementary-material
References
Ban, N. C., Gurney, G. G., Marshall, N. A., Whitney, C. K., Mills, M., Gelcich, S., et al. (2019). Well-being outcomes of marine protected areas. Nat. Sustain. 2 (6), 524–532. doi:10.1038/s41893-019-0306-2
Beguin, J., Martino, S., Rue, H., and Cumming, S. G. (2012). Hierarchical analysis of spatially auto correlated ecological data using integrated nested Laplace approximation. Methods Ecol. Evol. 3, 921–929. doi:10.1111/j.2041-210x.2012.00211.x
Bennett, N. J., Di Franco, A., Calò, A., Nethery, E., Niccolini, F., Milazzo, M., et al. (2019). Local support for conservation is associated with perceptions of good governance, social impacts and ecological effectiveness. Conserv. Lett. 12, e12640. doi:10.1111/conl.12640
Brandt, J. S., Butsic, V., Schwab, B., Kuemmerle, T., and Radeloff, V. C. (2015). The relative effectiveness of protected areas, a logging ban and sacred areas for old growth forest protection in southwest China. Biol. Conserv. 181, 1–8. doi:10.1016/j.biocon.2014.09.043
Burdon, D., Potts, T., McKinley, E., Lew, S., Shilland, R., Gormley, K., et al. (2019). Expanding the role of participatory mapping to assess ecosystem service provision in local coastal environments. Ecosyst. Serv. 39, 101009. doi:10.1016/j.ecoser.2019.101009
Buta, N., Holland, S. M., and Kaplanidou, K. (2014). Local communities and protected areas: the mediating role of place attachment for pro-environmental civic engagement. J. Outdoor Recreat. Tour. 5 (6), 1–10. doi:10.1016/j.jort.2014.01.001
Campbell, S. J., Edgar, G. J., Stuart-Smith, R. D., Soler, G., and Bates, A. E. (2017). Fishing-gear restrictions and biomass gains for coral reef fishes in marine protected areas. Conserv. Biol. 32 (2), 401–410. doi:10.1111/cobi.12996
CBD-Convention on Biological Diversity (2020). “Zero draft of the post-2020 global biodiversity framework,” in Proceedings of the Open-ended working group on the post-2020 Global Biodiversity Framework, Second meeting, Kumming, China, 24–29 February 2020.
Cherry, C., Scott, K., Barrett, J., and Pidgeon, N. (2018). Public acceptance of resource-efficiency strategies to mitigate climate change. Nat. Clim. Change 8, 1007–1012. doi:10.1038/s41558-018-0298-3
Cumming, G. S., and Allen, C. R. (2017). Protected areas as social-ecological systems: perspectives from resilience and social-ecological systems theory. Ecol. Appl. 27, 1709–1717. doi:10.1002/eap.1584
Dawson, N., Martin, A., and Danielsen, F. (2017). Assessing equity in protected area governance: approaches to promote just and effective conservation. Conserv. Lett. 11. doi:10.1111/conl.12388
Day, J., Dudley, N., Hockings, M., Holmes, G., Laffoley, D., Stolton, S., et al. (2012). Guidelines for applying the IUCN protected area management categories to marine protected areas. Gland, Switzerland: IUCN, 36.
De Lange, E., Woodhouse, E., and Milner-Gulland, E. J. (2016). Approaches used to evaluate the social impacts of protected areas. Conserv. Lett. 9, 327–333. doi:10.1111/conl.12223
Dormann, F. C., McPherson, J. M., Araújo, M. B., Bivand, R., Bolliger, J., Carl, G., et al. (2007). Methods to account for spatial autocorrelation in the analysis of species distributional data: a review. Ecography 30, 609–628. doi:10.1111/j.2007.0906-7590.05171.x
Duncan, E. W., White, N. M., and Mengersen, K. (2017). Spatial smoothing in Bayesian models: a comparison of weights matrix specifications and their impact on inference. Int. J. Health Geogr. 16, 47. doi:10.1186/s12942-017-0120-x
EEA (2017). An introduction to europe’s protected areas. Available online: https://www.eea.europa.eu/themes/biodiversity/europe-protected-areas (Accessed on April 15, 2022).
Engen, S., Runge, C., Brown, G., Fauchald, P., Nilsen, L., and Hausner, V. (2018). Assessing local acceptance of protected area management using public participation GIS (PPGIS). J. Nat. Conservation 43, 27–34. doi:10.1016/j.jnc.2017.12.002
European Commission (2020). EU biodiversity strategy bringing nature back into our lives; communication from the commission to the European parliament, the Council, the European economic and social committee and the committee of the regions; European commission: Brussels, Belgium. Available online: https://ec.europa.eu/info/sites/info/files/communication-annex-eu-biodiversity-strategy-2030_en.pdf (Accessed on March 1, 2022).
Franks, P., Booker, F., and Roe, D. (2018). Understanding and assessing equity in protected area conservation: a matter of governance, rights, social impacts and human wellbeing; iied issue paper. London, UK: IIED.
Gall, S. C., and Rodwell, L. D. (2016). Evaluating the social acceptability of marine protected areas. Mar. Policy 65, 30–38. doi:10.1016/j.marpol.2015.12.004
Gaspard, G., Kim, D., and Chun, Y. (2019). Residual spatial autocorrelation in macroecological and biogeographical modeling: a review. J. Ecol. Environ. 43, 19. doi:10.1186/s41610-019-0118-3
Gelman, A., and Hill, J. (2007). Data analysis using regression and multilevel/Hierarchcal models. New York, USA: Cambridge University Press.
Guisan, A., and Zimmermann, N. E. (2000). Predictive habitat distribution models in Ecology. Ecol. Model. 135, 147–186. doi:10.1016/s0304-3800(00)00354-9
Holtvoeth, J., and Jones, N. (2020). Eifel National park. Exploring views of local residents on the national park and the impact of COVID-19. Report prepared for the project FIDELIO. Cambridge: University of Cambridge. Available at: https://warwick.ac.uk/fac/arts/schoolforcrossfacultystudies/igsd/research/fidelio/publications/eifel_report.pdf.
Johnson, D. R., and Creech, J. C. (1983). Ordinal measures in multiple indicator models: a simulation study of categorization error. Am. Sociol. Rev. 48, 398–407. doi:10.2307/2095231
Jones, N., Graziano, M., and Dimitrakopoulos, P. G. (2020a). Social impacts of European Protected Areas and policy recommendations. Environ. Sci. Policy 112, 134–140. doi:10.1016/j.envsci.2020.06.004
Jones, N., Malesios, C., Kantartzis, A., and Dimitrakopoulos, P. (2020b). The role of location and social impacts of Protected Areas on subjective wellbeing. Environ. Res. Lett. 15, 114030. doi:10.1088/1748-9326/abb96e
Legendre, P. (1993). Spatial autocorrelation: trouble or new paradigm? Ecology 74 (6), 1659–1673. doi:10.2307/1939924
Li, H., Calder, C. A., and Cressie, N. (2007). Beyond Moran’s I: testing for spatial dependence based on the spatial autoregressive model. Geogr. Anal. 39 (4), 357–375. doi:10.1111/j.1538-4632.2007.00708.x
Lichstein, J. W., Simons, T. R., Shriner, S. A., and Franzreb, K. E. (2002). Spatial autocorrelation and autoregressive models in Ecology. Ecol. Monogr. 72 (3), 445–463. doi:10.1890/0012-9615(2002)072[0445:saaami]2.0.co;2
Lin, C.-C., and Lockwood, M. (2014). Forms and sources of place attachment: evidence from two protected areas. Geoforum 53, 74–81. doi:10.1016/j.geoforum.2014.02.008
Lindley, D. V. (1983). Theory and practice of bayesian statistics. J. R. Stat. Soc. 32, 1–11. Series D (The Statistician) Vol. 32, No. 1/2, Proceedings of the 1982 I.O.S. Annual Conference on Practical Bayesian Statistics (Mar. - Jun., 1983). doi:10.2307/2987587
Lockwood, M. (2010). Good governance for terrestrial protected areas: a framework, principles and performance outcomes. J. Environ. Manag. 91 (3), 754–766. doi:10.1016/j.jenvman.2009.10.005
Lopez-Mosquera, N., and Sanchez, M. (2012). The role of satisfaction and emotional response in the choice mechanisms of suburban natural-areas users. Environ. Manag. 49 (1), 174–191. doi:10.1007/s00267-011-9753-x
Lunn, D. J., Thomas, A., Best, N., and Spiegelhalter, D. (2000). WinBUGS - a Bayesian modelling framework: concepts, structure, and extensibility. Statistics Comput. 10, 325–337. doi:10.1023/a:1008929526011
Mammides, C. (2020). A global analysis of the drivers of human pressure within protected areas at the national level. Sustain. Sci. 15, 1223–1232. doi:10.1007/s11625-020-00809-7
McCullagh, P. (1980). Regression models for ordinal data. J. R. Stat. Soc. Ser. B 42 (2), 109–127. doi:10.1111/j.2517-6161.1980.tb01109.x
Moran, P. (1950). A test for the serial independence of residuals. Biometrika 37, 178–181. doi:10.1093/biomet/37.1-2.178
Mukul, S. A., Rashid, A. Z. M. M., Quazi, S. A., Uddin, M. B., and Fox, J. (2012). Local peoples' responses to co-management regime in protected areas: a case study from Satchari National Park, Bangladesh. For. Trees Livelihoods 21 (1), 16–29. doi:10.1080/14728028.2012.669132
Naidoo, R., Gerkey, D., Hole, D., Pfaff, A., Ellis, A. M., Golden, C. D., et al. (2019). Evaluating the impacts of protected areas on human well-being across the developing world. Sci. Adv. 5 (4), eaav3006. doi:10.1126/sciadv.aav3006
Norman, G. (2010). Likert scales, levels of measurement and the “laws” of statistics. Adv. Health Sci. Educ. 15 (5), 625–632. doi:10.1007/s10459-010-9222-y
Oldekop, J. A., Holmes, G., Harris, W. E., and Evans, K. L. (2016). A global assessment of the social and conservation outcomes of protected areas. Conserv. Biol. 30, 133–141. doi:10.1111/cobi.12568
QGIS Development Team (2015). QGIS geographic information system. Open Source Geospatial Foundation Project. Available at: http://qgis.osgeo.org.
Rife, A. N., Erisman, B., Sanchez, A., and Aburto-Oropeza, O. (2013). When good intentions are not enough: insights on networks of “paper park” marine protected areas. Conserv. Lett. 6, 200–212. doi:10.1111/j.1755-263x.2012.00303.x
Roberto, E. (2018). The spatial proximity and connectivity method for measuring and analyzing residential segregation. Sociol. Methodol. 48 (1), 182–224. doi:10.1177/0081175018796871
Rodrigues, G. J., Villasante, S., and Sousa Pinto, I. (2022). Non-material nature’s contributions to people from a marine protected area support multiple dimensions of human well-being. Sustain. Sci. 17, 793–808. doi:10.1007/s11625-021-01021-x
Romagosa, F. (2018). Physical health in green spaces: visitors’ perceptions and activities in protected areas around Barcelona. J. Outdoor Recreat. Tour. 23, 26–32. doi:10.1016/j.jort.2018.07.002
Rubin, D. B. (1996). Multiple imputation after 18+ years. J. Am. Stat. Assoc. 91 (434), 473–489. doi:10.1080/01621459.1996.10476908
Sallustio, L., De Toni, A., Strollo, A., Di Febbraro, M., Gissi, E., Casella, L., et al. (2017). Assessing habitat quality in relation to the spatial distribution of protected areas in Italy. J. Environ. Manag. 201, 129–137. doi:10.1016/j.jenvman.2017.06.031
Schafer, J. L., and Graham, J. W. (2002). Missing data: our view of the state of the art. Psychol. Methods 7 (2), 147–177. doi:10.1037/1082-989x.7.2.147
Schreckenberg, K., Franks, P., Martin, A., and Lang, B. (2016). Unpacking equity for protected area conservation. Parks 22 (2), 11–28. doi:10.2305/iucn.ch.2016.parks-22-2ks.en
Spiegelhalter, D. J., Best, N. G., Carlin, B. P., and van der Linde, A. (2002). Bayesian measures of model complexity and fit. J. R. Stat. Soc. Ser. B 64 (4), 583–639. doi:10.1111/1467-9868.00353
Stern, P. C., Dietz, T., Abel, T., Guagnano, G. A., and Kalof, L. (1999). A value-belief-norm theory of support for social movements: the case of environmentalism. Hum. Ecol. Rev., 6, 81–97.
Sullivan, G., and Artino, A. R. (2013). Analyzing and interpreting data from Likert-type scales. J. Graduate Med. Educ. 5 (4), 541–542. doi:10.4300/jgme-5-4-18
UNEP (2021). Protected planet report 2020. Cambridge, UK; Gland, Switzerland: UNEP-WCMC and IUCN. Available here: https://livereport.protectedplanet.net/.
Wilson, B., Reid, R. J., Grellier, K., Thompson, P. M., and Hammond, P. S. (2004). Considering the temporal when managing spatial: a population range expansion impacts protected areas-based management for bottlenose dolphins. Animan Conserv. 4, 331–338. doi:10.1017/S1367943004001581
Wynveen, C. J., Wynveen, B. J., and Sutton, S. G. (2015). Applying the Value-Belief-Norm Theory to marine contexts: implications for encouraging pro-environmental behavior. Coast. Manag. 43 (1), 84–103. doi:10.1080/08920753.2014.989149
Zafra Calvo, N., Garmendia, E., Pascual, U., Palomo, I., Gross-Camp, N., Brockington, D., et al. (2019). Progress toward equitably managed protected areas in Aichi Target 11: a global Survey. BioScience 69, 191–197. doi:10.1093/biosci/biy143
Keywords: national parks, spatial autocorrelation, Bayesian statistics, nature conservation, social effectiveness, Peak District, Eifel
Citation: Jones N, Begley A, Malesios C, Svajda J, McGinlay J and Dimitrakopoulos PG (2023) Exploring the spatial distribution of social impacts in protected areas. Front. Environ. Sci. 11:1229437. doi: 10.3389/fenvs.2023.1229437
Received: 26 May 2023; Accepted: 22 November 2023;
Published: 19 December 2023.
Edited by:
Wei Wang, Chinese Research Academy of Environmental Sciences, ChinaReviewed by:
Pedro Laterra, National Scientific and Technical Research Council (CONICET), ArgentinaHao Wang, Peking University, China
Copyright © 2023 Jones, Begley, Malesios, Svajda, McGinlay and Dimitrakopoulos. This is an open-access article distributed under the terms of the Creative Commons Attribution License (CC BY). The use, distribution or reproduction in other forums is permitted, provided the original author(s) and the copyright owner(s) are credited and that the original publication in this journal is cited, in accordance with accepted academic practice. No use, distribution or reproduction is permitted which does not comply with these terms.
*Correspondence: Chrysovalantis Malesios, Y2hyeXNvdmFsYWRpcy5tYWxlc2lvc0B3YXJ3aWNrLmFjLnVr