 Małgorzata Bielenia
 Damian Dubisz2
 Ernest Czermański
- 1Division of Maritime Economy, Department of Maritime Transport and Seaborne Trade, Faculty of Economics, University of Gdańsk, Gdańsk, Poland
- 2Łukasiewicz Research Network—Poznań Institute of Technology, Faculty of Engineering Management, Poznań University of Technology, Poznań, Poland
Managing logistics processes from an environmental perspective is increasingly important in international supply chains. Essential elements of global logistics are supply chains based on intermodal logistic units. The specificity of this type of shipment, which often involves several modes of transport, requires a precise definition of model boundaries and identification of specific factors determining the level of carbon footprint. This research is focused on identifying the specific emissivity level of each intermodal transport stage. The conducted study refers to the international emission evaluation guidelines gathered in the UN GHG Protocol. The carbon footprint (CF) evaluation commenced during the case study indicated the need to consider the specificity of the assigned modes of transport. Hence selected emission factors such as US DEFRA, US EPA, KOBiZE and UNFCCC were engaged for better carbon footprint evaluation related to each stage of the intermodal transport process. In the summary part, the environmental efficiency level of each mode of transport has been compared. The sea freight mode was indicated as the most efficient in terms of overall kg*eCO2 per kilometre. The study shows that intermodal maritime transport, taking into account the weight of the goods transported and the distance, is approximately 68% more efficient than road transport. However, it must be mentioned that to identify the differences comprehensively, transshipment operations must also be taken into account in each scenario. Further research steps and recommendations have been presented in the last section of this research.
Introduction
The potential to stop the progress of global climate change through the implementation of appropriate legal acts has been noticed. The possibility of preventing adverse climate change is understood as a challenge for societies for the coming decades in the XXI century (Paprocki and Gajewski, 2020).
Due to the increasing importance of evaluating process efficiency within various areas of the economy, the emissivity key factor has been implemented. During the research carried out by Ahmed Ali et al. (2020) it has been pointed out that the emissivity of transport is responsible for 23% of global emissions and is the largest source of GHG emissions after industry. Detailed sources of emissions broken down by individual sectors of the economy are presented in Figure 1.
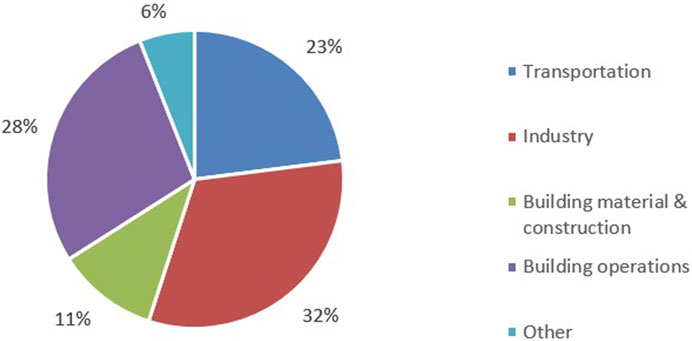
FIGURE 1. Global GHG emissions by economic sectors. Source: own elaboration based on (Ahmed Ali et al., 2020).
Decarbonisation of the transport sector has been identified as one of the most important factors that may contribute to reduce the carbon footprint (Gambhir et al., 2015; Dhar et al., 2017; Hill et al., 2019; Czermański et al., 2020; Haywood and Jakob, 2023; Zanobetti et al., 2023). Within the system, the shipping industry plays the crucial role in the international trade, accounting for approximately 90% of the total traded tonnage; this mode of transport is the key issue in the CF analysis. And, within the shipping industry, the container shipping is one of the most emission-sourcing sectors, but with the highest dependency on reliability, high frequency of port calls and energy consumption dependency. However, this significant involvement in international exchange also comes with a responsibility, as it contributes to about 2.5% of the world’s greenhouse gas emissions. To address this environmental impact, efforts are being made to enhance the common transport system through better modal integration, promote sustainability, adopt green technologies in the transportation sector, improve resource efficiency, and reduce carbon emissions. The International Maritime Organization has taken the initiative to combat these challenges. It has set an ambitious goal for its members, aiming for a remarkable 70% reduction in CO2 emissions by the year 2050. In an ideal scenario, the organization seeks to eliminate these emissions altogether. This commitment reflects the growing importance of mitigating the negative environmental effects of maritime transport and striving for a more sustainable and eco-friendly industry (Czermański et al., 2020).
For the correct carbon footprint measurement, proper emission factor sets supporting the process of managing transport processes are essential. The issue of reducing greenhouse gas (GHG) emissions from intermodal transport is part of the trend which has been observed (Ampah et al., 2021). This approach is consistent with increasing the role of introducing transport solutions based on hydrogen energy (McDowall, 2014; Parra et al., 2019). Simultaneously other solutions supporting the mitigation of emissivity of transportation processes that utilise electric battery vehicles are introduced in real market conditions (Zhao et al., 2016; Andwari et al., 2017; Woody et al., 2021). With respect to European policy aimed at reducing the carbon footprint by 2050, many international legal steps have been taken to enable the green transformation of European economies (UNFCCC, 1997; UN, 2015; UNFCCC, 2022). From the European perspective, an important document, the European Green Deal, was created, the main task of which is to set environmental goals to support the development of a low-emission economy in all European Union Member States (European Commission, 2020). The upcoming international changes would affect all sectors of the economy, including transportation. The transport sector is one of the significant contributors to GHG emissions mainly due to its reliance on petroleum-based fuels and coal (Bergqvist and Monios, 2019; Saifuddin et al., 2019).
The research highlights the importance of the use of the right type of vehicle for the right type of transport task. This applies to both road-based (Dubisz et al., 2022b) and ship-based fleets (Wang and Wang, 2021). Using integer programming, it is possible to create a model to support the selection of the optimal vessel, speed, route, and schedules. Wang and Wang (2021) point out that thanks to the use of a tailor-made simulation algorithm, it is possible to reduce the costs by about 5%, which is also reflected in a reduction of the carbon footprint of the intermodal transport processes. Simultaneously in the corresponding research a mathematical model of the liner scheduling recovery problem incorporates several control parameters that can significantly affect the overall level of efficiency of maritime intermodal transport (Abioye et al., 2021). Vessel speed adjustment, vessel handling rate adjustment, port skipping with and without containers can be included in the model developed by Abioye et al. (2021). Using simulation experiments, the efficiency of the fleet could be verified under several possible scenarios. The Diffused Memetic Optimizer algorithm has been proposed as a support tool for the recovery of ship berth schedules (Dulebenets, 2023). By applying different management modelling techniques, it was possible to achieve the most favourable ratio between efficiency and quality, depending on the scenario adopted. It was thus possible to optimise the handling resources available in port terminals. Issues related to improving the efficiency of the company’s operating model form the basis for its successful operation (Elmi et al., 2022). The appropriate design of recovery plans can increase the long-term profits of logistics operators. Elmi et al. (2022) point to the uncertainty of the business environment and the reaction time to unexpected events during the realisation of logistics processes. The proposed mathematical model is able to simulate and draw conclusions that can contribute to the continuous improvement of the efficiency of maritime logistics processes (Elmi et al., 2022). The organisation of vessel transport can benefit from the experience gained in the organisation of maritime rescue operations (Chen et al., 2023). Selected parameters of the intermodal sea transport chain indicate the need to reduce response times by choosing the right means of transport to meet transportation needs. An appropriate integer programming model can support the verification of the optimal configuration of a supply chain based on vessel transport. The research highlights the importance of using of the right type of vehicle for the right type of transport task. This applies to both road-based and ship-based fleets. Using integer programming, it is possible to create a model to support the selection of the optimal vessel, speed, route, and schedules. Through the use of a tailor-made simulation algorithm, it is possible to reduce the costs by about 5%, which is also reflected in a reduction of the carbon footprint of the intermodal transport processes (Wang and Wang, 2021). The authors of the another important study measured the resilience of China’s maritime economy based on adaptive capacity theory (Zhai et al., 2023). From 2000 to 2020, resilience was measured in 11 Chinese coastal provinces using a constructed system of assessment indicators including three sub-dimensions of resilience: resilience, adaptive capacity and evolution. The main finding is that although the gap between provinces in the regional level of maritime economic resilience is widening, the provinces, in general, are maintaining an upward trend. In other words it means that the provinces’ level of maritime economic resilience is steadily improving. The carried out spatial-temporal analysis of resilience interactions showed that the overall spatial characteristics of resilience are relatively stable. The Lu et al. (2023) article highlights the importance of energy conservation and emission reduction in changing climate. It was proved that optimization model can effectively reduce the operating cost during sailing cycles and control carbon emissions. Lu et al. (2023) found that speed optimization is also a potential method for reducing GHG emissions from ships. They investigated the speed optimization while considering ECAs by Multiple Objective Particle Swarm Optimization (MOPSO). Simultaneously Xiao et al. (2023b) noted that fuel consumption in shipping operations has a huge impact on the ecological environment, the port city environment, air quality and the health of residents. In addition, the paper uses Automatic Identification System (AIS) data records and data related to ships in U.S. coastal waters in 2021 in order to calculate emissions from ships in 30 U.S. ports in 2021. The results show a very significant trend in the distribution of ship emissions according to different types of ships and ports. Another research presents calculations based on the entire life cycle of bicycles and life cycle theory of carbon emissions generated and reduced over the entire life cycle of bicycles (Xiao et al., 2023a). The authors presented a very interesting study in which they estimate the amount of carbon emissions from public bikeshares. They wanted to prove that public bikes have positive implications in terms of reducing emissions and are a green travel mode. Xu et al. (2022) used comparative research to assess the influence of COVID-19 and the volatility of shipping index - the Baltic dry bulk freight rate index. The BDI is of particular significance in measuring the health of the world economy. In the literature the COVID-19 outbreak, appeared as a sudden disaster shocked most human activities. What is more the COVID-19 epidemic and the corresponding economic crisis have almost affected global production, supply and consumption. Xu et al. highlighted also the effects of the epidemic on the operations in shipping and port industries.
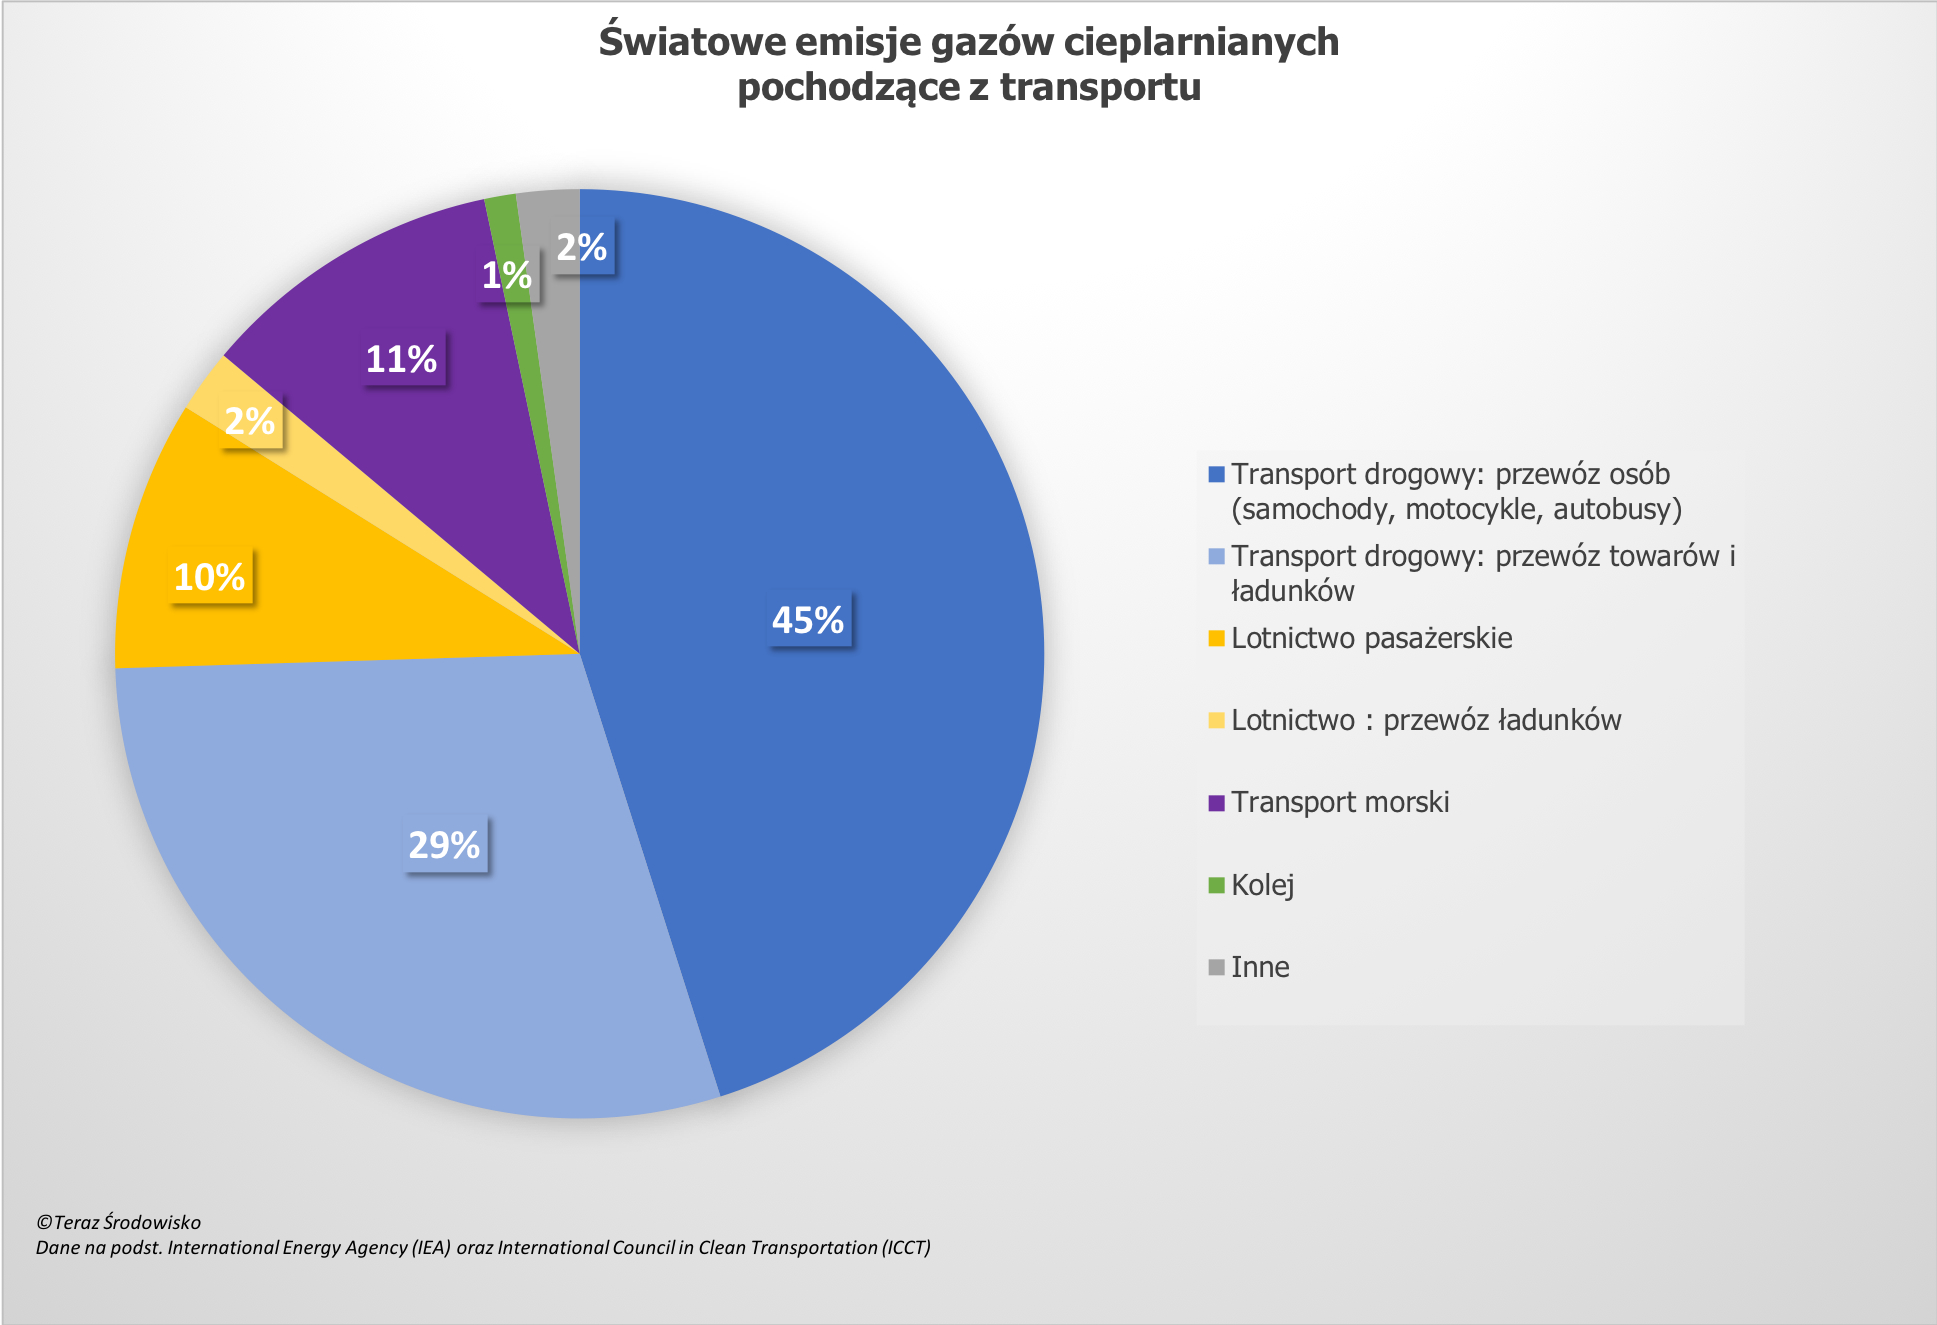
Sources of global greenhouse gas emissions within transport modes have been presented in Figure 2. Hence it can be observed which mode of transport generates the most GHGs. It can be observed that a quarter of the emissions come from road transport, which is responsible for 15% of all global GHG emissions. Passenger transport (by cars, motorcycles, buses and coaches) causes 45% of all GHG emissions entering the atmosphere each year (European Parliament, 2022). Road transport in the form of freight and cargo causes a negative anthropogenic impact on climate change by contributing 29% of GHG emissions. Another significant transport sector responsible for causing emissions is aviation. It is responsible for 11.6% of emissions from transport (2.5% of all global GHG emissions). The research on the carbon footprint levels among air and maritime transport conducted by the European Commission focuses on the sudden increase in emissivity driven by increased passenger and freight traffic (European Parliament, 2022). Maritime transport is responsible for 11% of overall global transport emissions. As a result of the statistical research and the measured emissivity of means of transport, it has been proved that the lowest carbon footprint results from transport processes carried out by rail transport mode. The share of GHG emissions of this type of transport is only 1% (Teraz Środowisko, 2023). However, when determining the carbon footprint level of transportation processes measured in km-tonnes, the perspective of the overall cargo volume should always be considered (Wong et al., 2018). Simultaneously, research conducted by the European Environment Agency confirm that road transport is responsible for most of the overall global emissions (71.7%), followed by aviation (13.9%) and maritime transport (13.3%) (Zawieska, 2020). The precise quantification of the carbon footprint of transport processes is a constant challenge due mainly to the nature of the transport process itself. The emissions caused by transporting goods depend on the amount of fuel combusted. The majority of currently known analysis and evaluations were conducted according to the mode-based method which focuses on a specific transport mode in order to accommodate intermodal transport specificity based on combining the methods of cargo transportation container, swap body or trailer—into one service carried out by an intermodal operator (Czermański et al., 2021). Hence it is a challenge to accurately evaluate GHG emissions across comprehensive intermodal supply chains. In the following part of this paper, an attempt was made to identify the individual factors determining the level of the carbon footprint of transport processes according to each stage of intermodal transport.
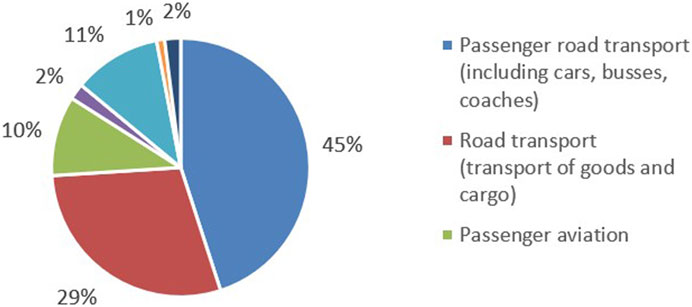
FIGURE 2. Global transport emissions by its source of generation. Source: Teraz Środowisko elaboration based on International Energy Agency (IEA) and International Council in Clean Transportation (ICCT) (Teraz Środowisko, 2023).
The transport sector possesses great potential for the reduction of greenhouse gas emissions, mainly due to the development of alternative fuels or alternative sources of energy (McDowall, 2014; Dhar et al., 2017; 2017; Andwari et al., 2017; Hill et al., 2019; Parra et al., 2019). As indicated in Figure 3 transport is the only sector of the economy that records steady growth (Farm Europe, 2019). This fact requires the creation of legal and organisational frameworks to limit the current trend. For better understanding of mutual dependencies between GHG emissions resulting from transport and various stages of intermodal transport, the following research questions have been outlined.
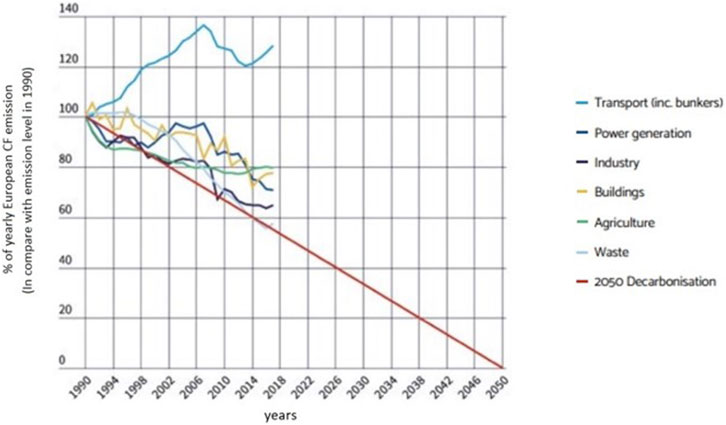
FIGURE 3. Indexed evolution of EU GHG emissions per sector. Source: Farm Europe, Do NECPS from the 28 member states meet EU transport decarbonisation targets? 2019, Brussels.
Research Question 1:. Do the available GHG emission measurement methods enable its full assessment within each stage of intermodal transport?
Research Question 2:. Can we compare the existing GHG emission measurement methods, and by which criteria?
Research methodology
To conduct solid research and obtain reliable answers to research questions 1 and 2, a two-way study was conducted. A review of the literature is aimed at identifying the factors determining emissions during the implementation of intermodal transport. Maritime shipments as well as the road stages of transport in China and Poland were analysed. Simultaneously, emission factors determining GHG emissions in ports, resulting from port operations, were verified. Considering the conclusions drawn during the literature review, a case study analysis was carried out. The carbon footprint was evaluated from the perspective of 1 TEU (Twenty-Foot Equivalent Unit) utilised within intermodal transport from China to Poland. During the study, reference was made to a set of rules for evaluation of the carbon footprint resulting from the international GHG Protocol while considering of the conditions in which the transport was carried out. Standardisation of the measurement and presentation of the results of the emssivity of individual logistics processes are among the advantages of this GHG Protocol CF evaluation method (Garcia and Freire, 2014). The method provides the ability to measure different components of greenhouse gases. These include carbon dioxide (CO2), methane (CH4), nitrous oxide (N2O) and others. This holistic approach ensures that all relevant emission contributors are considered. The methodology is freely available to the public, and its credibility is further enhanced by the transparency of its assumptions and the logic of its emissions assessments. The credibility of the methodology is also the result of collaboration with various organisations whose focus is the reduction of the anthropogenic impact on the environment. Its flexibility allows carbon performance to be measured for different logistics processes within a supply chain. In addition to measurement solutions, the methodology provides recommendations for setting targets to reduce emissions. The main disadvantages of the methodology include its complexity (Schmidt et al., 2022). Performing a carbon footprint assessment requires a lot of very detailed information. However the carbon footprint assessment is based on assumptions when data quality is poor or non-existent. The scope of the GHG Protocol is primarily focused on the direct and indirect emissions from an organisation’s operations (Scope 1 and Scope 2), with limited guidance on the assessment of emissions from the value chain (Scope 3). What is more it can be more difficult to quantify Scope 3 emissions. The obtained results were evaluated on this basis, and the emission factors adopted in the analyses were compared. Recommendations for further research were formulated in the last section of this paper. The adopted research logic is presented in Figure 4.
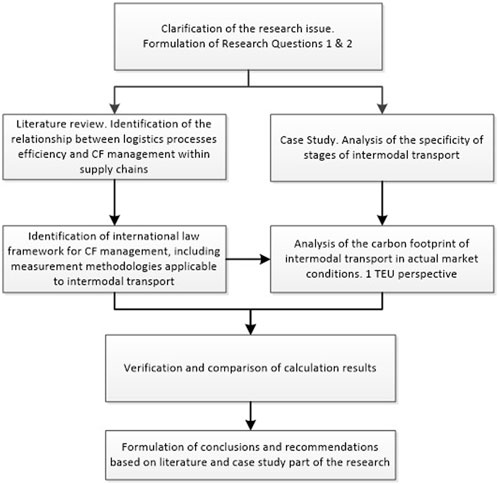
FIGURE 4. Research methodology. Source: own elaboration.
Literature review—international legal framework for CF management within intermodal supply chains
One of the major legal acts aimed at reducing emissions is the Paris Agreement. The provisions of the Paris Agreement initiated the EU’s efforts to achieve climate neutrality. The great challenge facing sustainable economies was identified during the 21st Conference of the Parties (COP21), where the climate policy goal of halting global warming at “well below 2°C” was set (UN, 2015). Based on theoretical considerations, the pathways to climate neutrality and the scope of efforts to decarbonise transport are widely described in the literature (Koh et al., 2013; Wesseling et al., 2017; ITF, 2018a; ITF, 2018b; Farm Europe, 2019). The proposed solutions can be divided into three groups: technological solutions, changes in the behaviour and preferences of transport system users, and regulatory changes (ITF, 2018a). The International Transport Forum announced that maritime transport emitted 938 milion tonnes of CO2 in 2012, which constitutes 2.6% of overall global carbon emissions. In addition, in 2018, the fourth and most recent IMO GHG Report showed a continuing increase on a global scale in the volume of CO2 emissions (up to 1,056 million tonnes), achieving a 2.89% share in global anthropogenic CO2 emissions. (IMO fourth GHG Study, 2020) Hence the goal of achieving climate neutrality includes the challenge of reducing emissions in the maritime sector. It is presumed that without immediate action, CO2 emissions by international maritime transport processes may increase between 50% and 250% by 2050 (ITF, 2018c). One of the most emissive modes of transport within the entire sector is road freight. Minimising its CF level may have a significant impact on overall transport decarbonisation. According to the International Transport Forum, as much as 50% of all global diesel production is consumed by the transport sector with its considerable share of the totality of GHG emissions, and the sector accounts for the 80% of the global net increase in diesel use (since 2000) (ITF, 2018c, pp. 6). Maritime transport is constantly increasing apace with the growth in global trade and in turn leads directly to increased GHG emissions. Shipping, especially in coastal areas, negatively impacts human health and the environment. Maritime transport is responsible for 15% of nitrogen oxide and 5%–8% of sulphur oxide emissions. It has been highlighted that around the year 2000, in Europe, ship emissions caused 50,000 premature deaths (Bergqvist and Monios, 2019). Research on the effectiveness of logistics processes in container terminals in Chile verified the degree by which the use of additional sound indicators increased the efficiency of the logistical processes. The impact of the changes was also analysed in terms of changes in the level of energy consumption. It has been shown that the emissivity of port operations in intermodal transport can be changed depending on the assumed degree of technological advancement of logistics processes (Spengler, 2016). Another study showed that introducing a set of indicators and recommendations in the intermodal supply chain aimed at implementing carbon-saving mechanisms can significantly contribute to improving the performance and competitiveness of the intermodal logistic unit service model. The essence of process transparency and the critical role of the correct flow of information and good-quality data has been outlined (Spengler and Wilmsmeier, 2019). Continuous efforts to improve the efficiency of port emissions management resulted in surveys at 41 container terminals in Latin America and the Caribbean. On this basis, the direct sources of emissions caused by electricity consumption were precisely indicated. The principal processes related to handling intermodal logistic units are focused on the physical relocation of TEUs in the terminal area and are related to offshore ship handling services and the unloading and loading of intermodal logistics units (Spengler and Wilmsmeier, 2015). Intermodal transport, known in Europe as combined transport, has been assigned as the cleanest transport technology merging high spatial flexibility of road transport from the first to last mile with high cargo capacity and fewer atmospheric emissions per transportation work unit (tonne-mile or tonne-kilometre). But due to the complexity of any given intermodal chain and thousands of possible intermodal services, no studies dedicated to the carbo footprint of intermodal transport have thus far been undertaken.
Transportation processes efficiency
The case study section refers to estimating the level of the carbon footprint of the intermodal transport process. The evaluation was carried out from the perspective of 1 TEU. Hence a literature background for better container shipment specificity has been introduced. According to Central Statistical Office a container ISO is “a container designed to carry goods repeatedly, without the need to reload them when changing modes of transport, equipped with facilities for easy transport and handling, resistant to the conditions of carriage and having the most ISO standardised dimensions possible: width and height 8 feet, length: 20 or 40 feet. A container-platform is a container with a platform base equipped with top and bottom container corner fittings but has neither a roof nor side walls. A TEU is a standard unit for calculating the containers of various capacity and for describing the capacity of ships and container terminals. One TEU = 1 container measuring 20—feet ISO” (Statistics Poland, 2023). According to Bielenia et al. (2020), the terms “intermodal loading unit” (ILU) and “intermodal transport unit” (ITU) are not fully defined, but as of 2003 they can be identified by unit types such as semi-trailer, trailer, swap body, container and road vehicle. The Commission proposed a directive in which ILUs were defined as either a container or a swap. The Directive proposed by the Commission was revoked at the end. Aforementioned authors Bielenia et al. (2020) pp.11 also mentioned that official glossaries such as United Nations Economic Commission for Europe (UNECE) and EUROSTAT, industry standards (i.e., CEN), and European projects (e.g., COSMOS) have compiled a complete set of definitions related to the equipment transported in combined transport (CT).
The digital maturity of logistics processes within the supply chain significantly impacts the quality of handling flows within international supply chains. As a result of the use of Bayesian statistics, the interdependence between market parameters and the course of the transport process was also noticed (Golinska-Dawson et al., 2023). The same conclusions can be applied to measuring and mitigating the carbon footprint resulting from the supported transport processes. The research focused on analysing the efficiency of transport processes also concerns the degree of their digitisation (Nowak et al., 2022). This approach makes it possible to guarantee the appropriate quality of data necessary for estimating the carbon footprint. The study by Li and Schmerer (2017) verified this approach for rail transport used to import goods via the new silk road, in which Poland plays a key role. As a result of the study, the market’s need to increase the degree of digitisation of supply chains was demonstrated as necessary to ensure further improvement of process efficiency. The digitisation of processes within supply chains is closely related to the possibility of estimating the level of the carbon footprint and evaluating the emissivity of transport processes. Due to the desire of company shareholders to minimise the costs associated with implementing primary transport processes, it is necessary to identify the factors affecting the level of emissions (Dubisz et al., 2022a). As a result of the research, the challenges faced by the supply chain management staff and the factors determining the increase in emissivity and energy consumption of transport processes have been demonstrated. In the example of the organisation of natural gas transmission in supply chains, it has been shown that the bullwhip effect and a relatively small number of participants in the process support the achievement of the scale effect (Dujak et al., 2019). In this context, proper mapping of the process, understanding its course and measuring the carbon footprint of the processes can support proper modelling of the process and significantly increase its efficiency. In this context, proper measurement of the carbon footprint of the transmission process is crucial to ensure proper process energetic efficiency. The issue of harmful emissions and operating costs were presented through the prism of electricity and fuels that are consumed by the combined terminal. These parameters are currently of key importance in assessing the operational efficiency of the terminal, and it seems that their role will steadily increase in the coming years (Bielenia et al., 2020). Researchers Spengler and Wilmsmeier (2019) noticed that the lack of proper tracking processes inside the port terminal results in severe difficulties in managing the port and assessing its efficiency of transhipment processes. Their study indicates that measuring the carbon footprint is crucial for the port manager to provide services at the level expected by service recipients. For this purpose, transparency of all logistic processes taking place inside the port must be ensured.
Terminal process emission factors
Based on the conducted research, several parameters determining the shape of terminal container emissions were identified and presented in Table 1. The key information necessary for a correct emissivity assessment is identifying the sub-processes while handling the TEU. Another element is to identify the energy sources required to power them. Based on Spengler (2016) studies, it was found that the infrastructure elements used to handle TEUs in ports utilise different types of fuels or energy sources. This condition can cause differences in emissions between various terminals in the world. Twelve main elements of the coastal infrastructure were identified. Most of them may use electricity. Most of the identified infrastructure elements use two or more fuels. The variety of fuel types can cause discrepancies when measuring the carbon footprint of ports due to limited data about the technical aspects of the utilised terminal infrastructure.
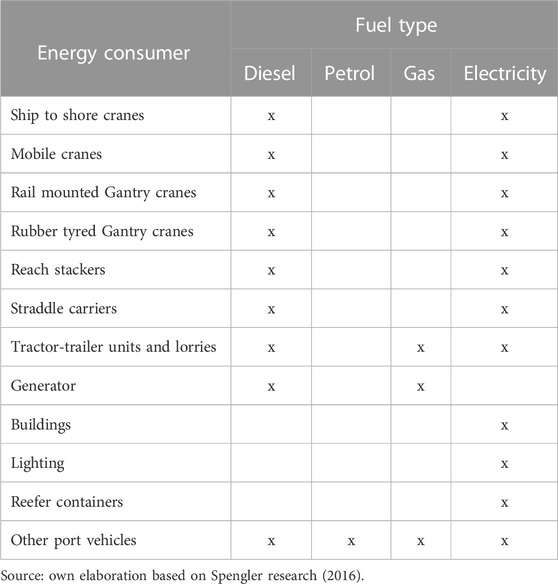
TABLE 1. Energy consumers within Container Terminal.
Road emission factors
Factors influencing the level of the carbon footprint in supply chains have been verified in the scientific research identified below. It was pointed out that the use of ‘low-costs’ simulation strategies supports proactive modelling of distribution chains in order to minimise fuel consumption by road vehicles (Silva et al., 2009). At the same time, the impact of vehicle speed on the emission level was verified. The tests were carried out using heavy trucks. It has been shown that appropriate control of the speed of vehicles, considering the terrain, positively reduces the mission intensity of road transport processes (Zamboni et al., 2015).
The division into groups of factors influencing the level of the carbon footprint resulting from the implemented distribution processes has been proposed by the research by Dubisz et al. (2022a) based on survey research among transport management representatives (Dubisz et al., 2022b). The research outlined the following factors.
• Vehicle type;
• GVM (gross vehicle mass);
• Engine type;
• Truck body type;
• Tyre type and size;
• Age of vehicle;
• Rate of wear and tear on the vehicle.
Shipping emission factors
The level of the carbon footprint resulting from the maritime transport processes is affected by several factors. With regard to the emissions of one means of transport and the weight of the carried goods, maritime transport is considered the least emission intensive. Therefore, aggregated transport in container ships shows a favourable carbon footprint indicator for transported goods.
The factors affecting maritime transport’s emissivity include the shipping route planning method. Proper route planning significantly impacts the overall carbon footprint of transport. Another critical factor is the types of fuel used by the ship. Thanks to the use of fuels based on components obtained from biomass, it is possible to reduce the carbon footprint of maritime transport by up to 90%. In addition to traditional fuels, it is possible to use hydrogen, but this involves incurring significant investment expenditures to modernise ship propulsion unit types. A study from Scandinavia shows alternative methods based on ferry routing corridors in order to minimise transport emission (Pizzol, 2019). The studies have also shown that limiting the speed of vessels also contributes to reducing the emissivity of sea freight. To lower the energy consumption of maritime transport, various energy-saving solutions are implemented to reduce energy consumption by devices on board.
Based on the study, a set of crucial criteria was developed that has a significant impact on the level of emissivity of the transport supply chain, depending on the means of transport used or the internal operations of the container terminal. Findings are presented in Table 2.
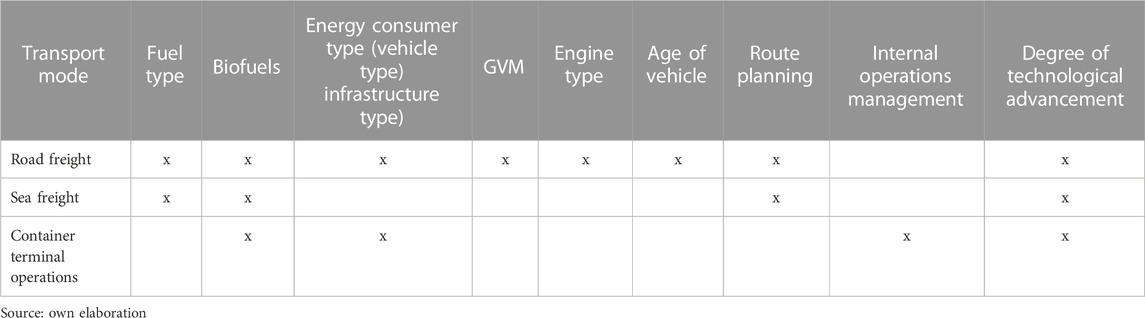
TABLE 2. Matrix of key factors influencing carbon footprint of transport on import relation by transport mode.
Case study
According to Bielenia et al. (2020) ‘Freight transport is responsible for around 25% of the European Union’s (EU) greenhouse gas emissions, making it the second largest emitting sector after energy. Significant reductions in emissions are needed to achieve long term climate goals in the EU with projections showing an increase in the total freight transport activity of about 58% (1.2% p. a.) between 2010 and 2050.’ Hence a need for proper verification of the actual emissivity of intermodal transport processes has been observed. It could be obtained by commencing accurate GHG emissivity assessment related to each stage of the intermodal transport processes. According to conducted literature review, the main emission factors within each stage of logistics operation were identified. Such an approach ensured the practical character of the presented case study part and allowed a valuable carbon footprint assessment to be delivered. Based on the evaluation, the main emission factors may be indicated and confronted with findings from the literature review.
The initial research stage of identifying emission factors for road, sea and rail transport was crucial for the conducting of further case studies. The overall carbon footprint of the presented intermodal transport scenario was evaluated to indicate accurate measurement methods, constraints resulting from the availability of emission factors and data quality used for CF assessment. The overall level of the carbon footprint resulting from the implemented intermodal transport was carried with a baseline calculations unit of 1 TEU. To ensure the appropriate logic of the calculations, reference was made to the assumptions of the GHG Protocol regarding Scope 3 emissions. Therefore, for a better understanding of further CF evaluation steps, the route of this intermodal shipment is presented in Figure 5.
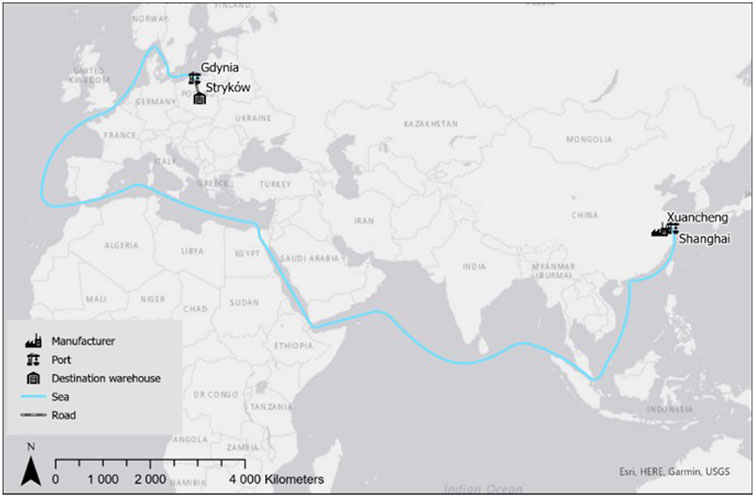
FIGURE 5. Map of the intermodal route evaluated within this case study. Source: own elaboration.
The data used in the study were taken from statistical sources to determine the energy intensity of terminal processes in ports. Simultaneously, the analysis tool ArcGIS Network was used to verify the distances for maritime and road transport. Thanks to this approach, it was possible to determine the actual shipping route for the maritime shipping stage and calculate the distance for the road transportation stages, taking into account the logistics network. A set of emission factors was used to assess the carbon footprint of each transportation stage. The exact emission factors used, are specified in the further description of the study. The study was conducted on a frequent intermodal connection for intermodal transport from China to Poland. The aim of the study is to understand the interdependencies between the supply chain parameters and to identify opportunities for reduction of its carbon footprint and consequent increase in efficiency.
Road freight carbon footprint assessment
While analysing the carbon footprint resulting from road transport, the TEU loading point in China and the ship loading port were identified. On this basis, it was indicated that the distance of the road section from Xuancheng to Shanghai is 134 km. The vehicle allocated for this transport operation was in the GVM class of up to 40 tons in the age range of 1–5 years. According to Dubisz et al. (2022b), the truck’s age parameter is a significant heterogeneous fleet parameter that impacts road freight emissivity. It is directly connected with increased fuel consumption compared to a new truck’s factory parameters (Dubisz et al., 2022b). In this case, it was possible to calculate the CF level based on two sets of carbon footprint emissions charts published by UK DEFRA (2022) and US EPA (2022).
The second road section of this intermodal chain commenced in Poland between the port of Gdynia and the recipient’s warehouse in Stryków. The calculated distance was 340 km. The allocated vehicle was a GVM class truck of up to 40 tons, aged 1–5 years.
It must be understood, that when using older vehicles or splitting the load due to palletising in port, it must be assumed that the parameters of the heterogeneous fleet affect the fuel consumption and CO2 emissivity accordingly. The results of road freight carbon footprint evaluation are presented in Table 3.
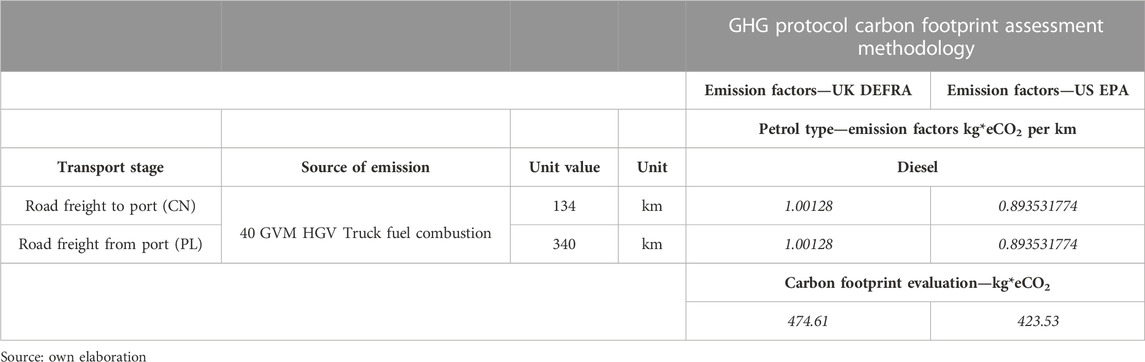
TABLE 3. Road freight carbon footprint evaluation per 1TEU.
Shipping carbon footprint assessment
Two sets of emission factors were used to determine the emissivity of maritime transport. The set of UK DEFRA indicators (2022) and factors published by the United Nations in the Greenhouse Gas (GHG) Emissions Calculator (2022) allows to evaluate accurate CF level, taking into account two key factors of distance and payload weight based on the tonne-kilometres unit. Both emission factor charts allow indicating ship type and capacity. Those factors are crucial and show an increased impact on the overall carbon footprint level. A hypothetical Maersk vessel with a 5,000–7,999 TEU capacity was adopted for the calculations. It was noted that the UK DEFRA method presents more precise coefficient values, while the coefficients published by the UN are rounded off.
Concerning the weight of the goods—16,000 kg—and the distance travelled by ship—7,996.83 km—the results indicate a difference of 16% of the calculated carbon footprint. To determine the ship’s capacity and shipping route, the calculations must accurately reflect the of the type of ship and its characteristics, as these factors significantly influence the overall emissivity level. All calculations were carried out under the logic of the GHG Protocol. In this case, reference was made to the parameters of weight and distance travelled of the specific means of transport used.
The US EPA emission factors set cannot be used due to the different units presented in this study’s approach. The US EPA supports CF calculation resulting from combusted fuel, whereas this information could not be obtained in terms of sea freight.
The results of the carbon footprint calculations resulting from the intermodal transport are presented in Table 4.
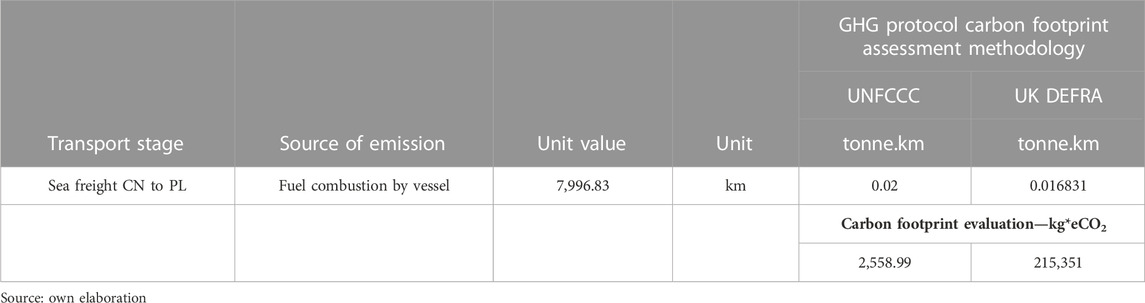
TABLE 4. Shipping carbon footprint evaluation per 1 TEU.
Terminal electricity consumption CF assessment
As a result of the literature review, many factors determining the level of the carbon footprint within intermodal transport have been identified. Of the many and diverse emissions resulting from the processes of various participants in port operations, the focus was on measuring the CO2 emissions resulting from electricity consumption. For this purpose, the annual TEU transhipment volume of the Port of Shanghai and the declared electricity consumption were determined (Ling, 2021; Statista, 2021). In this way, the average electricity consumption rate per 1 TEU was evaluated. To provide reliable calculations, the reference was made to emission factors resulting from the electricity production mix in China and Poland. Emission data related with electricity production emissivity published by Statista (2021) were used for the calculations of the Chinese part, while KOBiZE (2022) factors were used for emissivity calculations in the Polish context. Hence the carbon footprint evaluation considers the energy mix characterising the country of the sender of the goods as well as the recipient of the goods. The level of terminal energy consumption and its corresponding carbon footprint has been evaluated in Table 5.
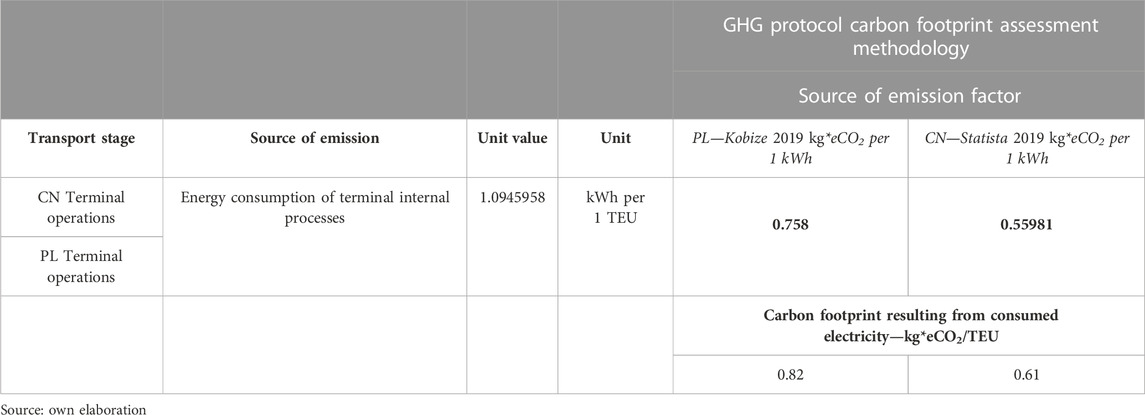
TABLE 5. Terminal electricity consumption and related carbon footprint evaluation per 1 TEU.
Conclusion and recommendations
Global trade causes global GHG emission from the transportation processes. Notwithstanding the fact that maritime transport accounts for the largest share of these processes, it generates the smallest carbon footprint compared to a unit of freight work. The literature review showed that the degree of technological advancement has a significant impact on the level of the carbon footprint of logistics processes. The results of the literature study were confirmed in the case study section. Based on the results, the following conclusions can be formulated.
• The obtained level of the carbon footprint of transport processes carried out by a heterogeneous road transport fleet and container ships and terminal operations differs depending on the types of vehicles used and the fuel type combustion. As a result, it can be concluded that the level of the estimated carbon footprint of these processes depends on the technological advancement of used vehicles or infrastructure elements.
• To determine the level of intermodal transport CF of complex types of intermodal transport data from multiple sources of emission factors are required, accordingly to the complexity of the intermodal transport chain.
• Not all sets of emission factors can help determine emissions from every stage of intermodal transport processes. Due to the data type specifying the 1 TEU route, it was not possible to calculate emissions expressed as kg*eCO2 for maritime transport using emission factors published by the US EPA. The difficulty originates from the lack of data on the amount of fuel the ship uses in the analysed direction.
• The GHG Protocol methodology is a reasonable basis for estimating the CF level in transport. However, due to the CF emission factors sets, their data are only suitable for some applications.
• Determining CF in intermodal transport requires a flexible approach and the selection of appropriate emission factors.
• To some extent it was observed that maritime transport, due to the long distance, was characterised by the highest level of carbon footprint, meanwhile the lowest level of the carbon footprint was related to the energy consumption of the terminal processes. While comparing the environmental efficiency of each transport mode, the lowest emission index per km is characteristic of maritime transport.
• For the maritime transport, the level of the carbon footprint emitted for 1 TEU weighing 16,000 kg is 0.32000055 kg*eCO2/km, while the emission index for the same payload transported by road was 1.00128692 kg*eCO2/km.
• Road transport over long distances is the least effective when implementing intermodal transport tasks.
• The greatest environmental efficiency from the perspective of a logistic unit is characterised by maritime transport.
Taking the above into consideration, it can be recommended that further research should verify the degree of emissivity of rail transport of containers. These may be focused on estimating CF levels based on the amount of used fuel. This approach may provide more reliable results with reference to actual ship route conditions. However, above all, it is necessary to constantly watch the adequacy of the comparison of different transport modes within one intermodal chain to another using the same evaluation units, like CO2 emission per 1 tonne-km or 1 TEU-km.
Data availability statement
The raw data supporting the conclusions of this article will be made available by the authors, without undue reservation.
Author contributions
All authors listed have made a substantial, direct, and intellectual contribution to the work and approved it for publication.
Acknowledgments
DD would like to thank for funding research under the Implementation Doctorate Program of the Ministry of Education and Science implemented in the years 2021–2025 (Agreement No. DWD/5/0015/2021 of 23/12/2021).
Conflict of interest
The authors declare that the research was conducted in the absence of any commercial or financial relationships that could be construed as a potential conflict of interest.
Publisher’s note
All claims expressed in this article are solely those of the authors and do not necessarily represent those of their affiliated organizations, or those of the publisher, the editors and the reviewers. Any product that may be evaluated in this article, or claim that may be made by its manufacturer, is not guaranteed or endorsed by the publisher.
References
Abioye, O. F., Dulebenets, M. A., Kavoosi, M., Pasha, J., and Theophilus, O. (2021). Vessel schedule recovery in liner shipping: modeling alternative recovery options. IEEE Trans. Intelligent Transp. Syst. 22, 6420–6434. doi:10.1109/TITS.2020.2992120
Ahmed Ali, K., Ahmad, M. I., and Yusup, Y. (2020). Issues, impacts, and mitigations of carbon dioxide emissions in the building sector. Sustainability 12, 7427. doi:10.3390/su12187427
Ampah, J. D., Yusuf, A. A., Afrane, S., Jin, C., and Liu, H. (2021). Reviewing two decades of cleaner alternative marine fuels: towards IMO’s decarbonization of the maritime transport sector. J. Clean. Prod. 320, 128871. doi:10.1016/j.jclepro.2021.128871
Andwari, A. M., Pesiridis, A., Rajoo, S., Martinez-Botas, R., and Esfahanian, V. (2017). A review of battery electric vehicle technology and readiness levels. Renew. Sustain. Energy Rev. 78, 414–430. doi:10.1016/j.rser.2017.03.138
R. Bergqvist, and J. Monios (Editors) (2019). Green ports: inland and seaside sustainable transportation strategies (Amsterdam, Netherlands ; Cambridge, MA, United States: Elsevier).
Bielenia, M., Borodo, A., Giuseppe, C., Czermański, E., Czuba, T., Jankiewicz, J., et al. (2020). Combined transport terminals benchmark analysis. COMBINE project, Available at: www.combine-project.com.
Chen, X., Yan, R., Wu, S., Liu, Z., Mo, H., and Wang, S. (2023). A fleet deployment model to minimise the covering time of maritime rescue missions. Marit. Policy and Manag. 50, 724–749. doi:10.1080/03088839.2021.2017042
Czermański, E., Bielenia, M., Bochynek, C., Borodo, A., Cailliaux, A., Giuseppe, C., et al. (2021). E-Book on combined transport in the baltic sea region. COMBINE project, Available at: www.combine-project.com (Accessed May 06, 2023).
Czermański, E., Pawłowska, B., Oniszczuk-Jastrząbek, A., and Cirella, G. T. (2020). Decarbonization of maritime transport: analysis of external costs. Front. Energy Res. 8, 28. doi:10.3389/fenrg.2020.00028
Dhar, S., Pathak, M., and Shukla, P. R. (2017). Electric vehicles and India’s low carbon passenger transport: a long-term co-benefits assessment. J. Clean. Prod. 146, 139–148. doi:10.1016/j.jclepro.2016.05.111
Dubisz, D., Golińska-Dawson, P., and Koliński, A. (2022a). Measuring CO2 emissions level for more sustainable distribution in a supply chain. Eng. Appl. Sci. Res. 49, 804810. doi:10.14456/EASR.2022.78
Dubisz, D., Golinska-Dawson, P., and Zawodny, P. (2022b). Measuring CO2 Emissions in e-commerce deliveries: from empirical studies to a new calculation approach. Sustainability 14, 16085. doi:10.3390/su142316085
Dujak, D., Šebalj, D., and Koliński, A. (2019). Towards exploring bullwhip effects in natural gas supply chain. Logforum 15, 557–569. doi:10.17270/J.LOG.2019.369
Dulebenets, M. A. (2023). A Diffused Memetic Optimizer for reactive berth allocation and scheduling at marine container terminals in response to disruptions. Swarm Evol. Comput. 80, 101334. doi:10.1016/j.swevo.2023.101334
Elmi, Z., Singh, P., Meriga, V. K., Goniewicz, K., Borowska-Stefańska, M., Wiśniewski, S., et al. (2022). Uncertainties in liner shipping and ship schedule recovery: a state-of-the-art review. J. Marit. Sci. Eng. 10, 563. doi:10.3390/jmse10050563
European Commission (2020). The European green deal. Available at: https://eur-lex.europa.eu/legal-content/EN/TXT/?uri=CELEX%3A52019DC0640 (Accessed May 06, 2023).
European Parliament (2022). Emissions from planes and ships: facts and figures. Available at: https://www.europarl.europa.eu/news/pl/headlines/society/20191129STO67756/emisje-z-samolotow-i-statkow-fakty-i-liczby-infografika (Accessed May 06, 2023).
Farm Europe (2019). Do NECPS from the 28 Member States meet transport decarbonisation targets? Available at: https://www.farm-europe.eu/travaux/do-necps-from-the-28-member-states-meet-eu-transport-decarbonisation-targets/(Accessed May 06, 2023).
Gambhir, A., Tse, L. K. C., Tong, D., and Martinez-Botas, R. (2015). Reducing China’s road transport sector CO2 emissions to 2050: technologies, costs and decomposition analysis. Appl. Energy 157, 905–917. doi:10.1016/j.apenergy.2015.01.018
Garcia, R., and Freire, F. (2014). Carbon footprint of particleboard: a comparison between ISO/TS 14067, GHG Protocol, PAS 2050 and Climate declaration. J. Clean. Prod. 66, 199–209. doi:10.1016/j.jclepro.2013.11.073
Golinska-Dawson, P., Werner-Lewandowska, K., Kolinska, K., and Kolinski, A. (2023). Impact of market drivers on the digital maturity of logistics processes in a supply chain. Sustainability 15, 3120. doi:10.3390/su15043120
Haywood, L., and Jakob, M. (2023). The role of the emissions trading scheme 2 in the policy mix to decarbonize road transport in the European Union. Transp. Policy 139, 99–108. doi:10.1016/j.tranpol.2023.06.003
Hill, G., Heidrich, O., Creutzig, F., and Blythe, P. (2019). The role of electric vehicles in near-term mitigation pathways and achieving the UK’s carbon budget. Appl. Energy 251, 113111. doi:10.1016/j.apenergy.2019.04.107
ITF (2018c). On course towards carbon-neutral shipping? Int. Transp. Forum Policy Pap. 2018, 250921. doi:10.1787/250921ec-en
ITF (2018a). Priority policies for decarbonising urban tranport. Int. Transp. Forum Policy Pap. 2018, 250921. doi:10.1787/250921ec-en
ITF (2018b). Towards road freight decarbonisation trends measures and policies. Int. Transp. Forum Policy Pap. 2018, 250921. doi:10.1787/250921ec-en
KOBiZE (2022). Polish electricity emission factors benchmarks. Available at: https://www.kobize.pl/pl/article/monitorowanie-raportowanie-weryfikacja-emisji/id/318/tabele-wo-i-we (Accessed May 06, 2023).
Koh, S. C. L., Genovese, A., Acquaye, A. A., Barratt, P., Rana, N., Kuylenstierna, J., et al. (2013). Decarbonising product supply chains: design and development of an integrated evidence-based decision support system – the supply chain environmental analysis tool (SCEnAT). Int. J. Prod. Res. 51, 2092–2109. doi:10.1080/00207543.2012.705042
Li, Y., and Schmerer, H.-J. (2017). Trade and the new silk road: opportunities, challenges, and solutions. J. Chin. Econ. Bus. Stud. 15, 205–213. doi:10.1080/14765284.2017.1347473
Ling, Z. (2021). Shanghai port carbon emission measurement study. Front. Bus. Econ. Manag. 2 (1), 21–29. doi:10.54097/fbem.v2i1.154
Lu, J., Wu, X., and Wu, Y. (2023). The construction and application of dual-objective optimal speed model of liners in a changing climate: taking yang ming route as an example. J. Mar. Sci. Eng. 11, 157. doi:10.3390/jmse11010157
McDowall, W. (2014). Exploring possible transition pathways for hydrogen energy: a hybrid approach using socio-technical scenarios and energy system modelling. Futures 63, 1–14. doi:10.1016/j.futures.2014.07.004
Nowak, P., Kirchner, M., and Koliński, A. (2022). Analysis of digitalisation needs improving the supply chain efficiency for new silk road transport corridor. Ekon. misao i praksa 31, 487–503. doi:10.17818/EMIP/2022/2.7
Parra, D., Valverde, L., Pino, F. J., and Patel, M. K. (2019). A review on the role, cost and value of hydrogen energy systems for deep decarbonisation. Renew. Sustain. Energy Rev. 101, 279–294. doi:10.1016/j.rser.2018.11.010
Pizzol, M. (2019). Deterministic and stochastic carbon footprint of intermodal ferry and truck freight transport across Scandinavian routes. J. Clean. Prod. 224, 626–636. doi:10.1016/j.jclepro.2019.03.270
Saifuddin, M. R. M., Wan Asma Diana, W. R., and Karim, M. R. (2019). Addressing GHG emissions from land transport in a developing country. IOP Conf. Ser. Earth Environ. Sci. 373, 012024. doi:10.1088/1755-1315/373/1/012024
Schmidt, M., Nill, M., and Scholz, J. (2022). Determining the Scope 3 emissions of companies. Chem. Eng. Technol. 45, 1218–1230. doi:10.1002/ceat.202200181
Silva, C., Ross, M., and Farias, T. (2009). Analysis and simulation of “low-cost” strategies to reduce fuel consumption and emissions in conventional gasoline light-duty vehicles. Energy Convers. Manag. 50, 215–222. doi:10.1016/j.enconman.2008.09.046
Spengler, T. (2016). “Energy consumption and energy efficiency indicators in container terminals - a national inventory, UN-ECLAC,” in IAME Conference Hamburg, Hamburg, August 2016.
Spengler, T., and Wilmsmeier, G. (2015). Report number: Maritime and Logistics Bulletin: Towards benchmarking energy consumption in container terminals. Santiago: ECLAC.
Spengler, T., and Wilmsmeier, G. (2019). “Sustainable performance and benchmarking in container terminals - the energy dimension,” in Green ports (Amsterdam: Elsevier), 125–154. doi:10.1016/B978-0-12-814054-3.00007-4
Statista (2021). Container throughput of Shanghai international port (group) company limited in China from 2013 to 2021. Available at: https://www.statista.com/statistics/1318138/container-throughput-shanghai-international-port/(Accessed May 06, 2023).
Statistics Poland (2023). Terms used in official statistics. Available at: https://stat.gov.pl/en/metainformation/glossary/terms-used-in-official-statistics/1665,term.html (Accessed May 06, 2023).
Teraz Środowisko (2023). Emisje transportu kolejowego drogowego i lotniczego. Available at: https://www.teraz-srodowisko.pl/images/illustrations/artykul/11142_encart.jpg (Accessed May 06, 2023).
UK DEFRA (2022). UK government GHG conversion factors for Company reporting. Available at: https://www.gov.uk/government/publications/greenhouse-gas-reporting-conversion-factors-2022 (Accessed May 06, 2023).
UN (2015). The Paris Agreement. UN Climate Change Conference COP21, Available at: https://unfccc.int/process-and-meetings/the-paris-agreement (Accessed May 06, 2023).
UNFCCC (1997). The kyoto Protocol. Available at: https://unfccc.int/documents/2409 (Accessed May 06, 2023).
UNFCCC (2022). United Nations climate change: greenhouse gas (GHG) emissions calculator. Available at: https://unfccc.int/documents/271269 (Accessed May 06, 2023).
US EPA (2022). United States environmental protection agency. Available at: https://www.epa.gov/climateleadership/ghg-emission-factors-hub (Accessed May 06, 2023).
Wang, Y., and Wang, S. (2021). Deploying, scheduling, and sequencing heterogeneous vessels in a liner container shipping route. Transp. Res. Part E Logist. Transp. Rev. 151, 102365. doi:10.1016/j.tre.2021.102365
Wesseling, J. H., Lechtenböhmer, S., Åhman, M., Nilsson, L. J., Worrell, E., and Coenen, L. (2017). The transition of energy intensive processing industries towards deep decarbonization: characteristics and implications for future research. Renew. Sustain. Energy Rev. 79, 1303–1313. doi:10.1016/j.rser.2017.05.156
Wong, E. Y. C., Tai, A. H., and Zhou, E. (2018). Optimising truckload operations in third-party logistics: a carbon footprint perspective in volatile supply chain. Transp. Res. Part D Transp. Environ. 63, 649–661. doi:10.1016/j.trd.2018.06.009
Woody, M., Vaishnav, P., Craig, M. T., Lewis, G. M., and Keoleian, G. A. (2021). Charging strategies to minimize greenhouse gas emissions of electrified delivery vehicles. Environ. Sci. Technol. 55, 10108–10120. doi:10.1021/acs.est.1c03483
Xiao, G., Qiongwen, L., Anning, N., and Zhang, C. (2023b). Research on carbon emissions of public bikes based on the life cycle theory. Transp. Lett. 15, 278–295. doi:10.1080/19427867.2022.2123142
Xiao, G., Wang, T., Luo, Y., and Yang, D. (2023a). Analysis of port pollutant emission characteristics in United States based on multiscale geographically weighted regression. Front. Mar. Sci. 10, 1131948. doi:10.3389/fmars.2023.1131948
Xu, L., Zou, Z., and Zhou, S. (2022). The influence of COVID-19 epidemic on BDI volatility: an evidence from GARCH-MIDAS model. Ocean Coast. Manag. 229, 106330. doi:10.1016/j.ocecoaman.2022.106330
Zamboni, G., André, M., Roveda, A., and Capobianco, M. (2015). Experimental evaluation of heavy duty vehicle speed patterns in urban and port areas and estimation of their fuel consumption and exhaust emissions. Transp. Res. Part D Transp. Environ. 35, 1–10. doi:10.1016/j.trd.2014.11.024
Zanobetti, F., Pio, G., Jafarzadeh, S., Muñoz Ortiz, M., and Cozzani, V. (2023). Decarbonization of maritime transport: sustainability assessment of alternative power systems. J. Clean. Prod. 417, 137989. doi:10.1016/j.jclepro.2023.137989
Zawieska, J. (2020). Auto 2.0: ewolucja modelu konsumpcji oraz miejsce samochodu osobowego w świetle wyzwań klimatycznych i zmian potrzeb mobilności mieszkańców europy. [In:] Polityka klimatyczna i jej realizacja w pierwszej połowie XXI wieku, 2020. Centrum Myśli Strategicznych, Sopot, Available at: www.efcongress.com (Accessed May 06, 2023).
Zhai, X., Sun, C., Zou, W., and Hao, S. (2023). Spatiotemporal characteristic and evolution of China’s marine economic resilience. Ocean Coast. Manag. 238, 106562. doi:10.1016/j.ocecoaman.2023.106562
Keywords: carbon footprint, intermodal transport, terminal operations footprint, UN GHG Protocol, Paris Agreement
Citation: Bielenia M, Dubisz D and Czermański E (2023) Methodological introduction to the carbon footprint evaluation of intermodal transport. Front. Environ. Sci. 11:1237763. doi: 10.3389/fenvs.2023.1237763
Received: 09 June 2023; Accepted: 14 August 2023;
Published: 24 August 2023.
Edited by:
Lang Xu, Shanghai Maritime University, ChinaReviewed by:
Maxim A. Dulebenets, Florida Agricultural and Mechanical University, United StatesGuangnian Xiao, Shanghai Maritime University, China
Copyright © 2023 Bielenia, Dubisz and Czermański. This is an open-access article distributed under the terms of the Creative Commons Attribution License (CC BY). The use, distribution or reproduction in other forums is permitted, provided the original author(s) and the copyright owner(s) are credited and that the original publication in this journal is cited, in accordance with accepted academic practice. No use, distribution or reproduction is permitted which does not comply with these terms.
*Correspondence: Małgorzata Bielenia, bWFsZ29yemF0YS5iaWVsZW5pYUB1Zy5lZHUucGw=