 Issa Sheibani Amin1
 Ali Naser Neysari2*Raed H. Althomali3Ebraheem Abdu Musad Saleh3Sayfiddin Baymakov4,5Ahmed Hussien Radie Alawady6,7,8Ali Hashiem Alsaalamy9Montather F. Ramadan10Ashima Juyal11
- 1Department of Urban Planning, Faculty of Social Sciences, Payame Noor University, Tehran, Iran
- 2Civil Engineering-Water Resources Engineering and Management, Sharif University of Technology, Tehran, Iran
- 3Department of Chemistry, College of Arts and Science, Prince Sattam Bin Abdulaziz University, Wadi Al-Dawasir, Saudi Arabia
- 4Department of General Surgery and Military-Field Surgery, Tashkent State Dental Institute, Tashkent, Uzbekistan
- 5Department of Scientific Affairs, Samarkand State Dental Institute, Samarkand, Uzbekistan
- 6College of Technical Engineering, The Islamic University of Najaf, Najaf, Iraq
- 7College of Technical Engineering, The Islamic University of Al Diwaniyah, Al Diwaniyah, Iraq
- 8College of Technical Engineering, The Islamic University of Babylon, Babylon, Iraq
- 9College of Technical Engineering, Imam Ja’afar Al-Sadiq University, Al-Muthanna, Iraq
- 10College of Dentistry, Al-Ayen University, Thi-Qar, Iraq
- 11Department of Electronics and Communication Engineering, Uttaranchal Institute of Technology, Uttaranchal University, Dehradun, India
This study aimed to preconcentration of sulfamethoxazole (SMX) in water and biological samples. Ultrasound-assisted dispersive liquid-liquid microextraction (UA-DLLME) and ultrasound-assisted dispersive solid-phase microextraction (UA-DSPME) methods paired with spectrophotometry were applied to extraction and preconcentration of SMX. ZnFe2O4 nanoparticles were prepared as adsorbent in UA-DSPME method by hydrothermal method. The scanning electron microscopy (SEM) technique showed that the adsorbent had symmetrical, bullet-shaped particles with uniform size. The results of the X-ray diffraction (XRD) showed the successful synthesis of the ZnFe2O4 nanoparticles. Effective parameters in extraction, including ultrasonication time, disperser solvent volume, adsorbent amount, extraction solvent volume, eluent volume, and pH were investigated and optimized. The practical and optimal conditions of the process were determined by the central composite design (CCD). The optimal conditions were 0.024 g of adsorbent, 535 µL of disperser solvent volume, 7.5 min of ultrasonication time, 235 µL of eluent volume, pH of 5, and 185 µL of extraction solvent volume. Linear ranges and detection limits were 20–1,200 μg L−1 and 6 μg L−1 for UA-DSPME and 10–800 μg L−1 and 3 μg L−1 for UA-DLLME. Relative standard deviation (RSD) of less than 4% were obtained for UA-DSPME and UA-DLLME methods. The reusability showed that the ZnFe2O4 adsorbent could extract SMX up to five cycles of adsorption/desorption without significant reduction in its efficiency. Also, interference studies showed that the presence of different cations and anions did not significantly interfere in the extraction of SMX. The outcomes of real-time samples analysis showed that the extraction of SMX for both methods was in the range of 92.44%–99.12%. The results showed the developed methods are simple, sensitive, and suitable for SMX preconcentration in environmental water and biological samples.
1 Introduction
The usage of medicinal products by humans for treating different types of infections and curing internal body issues has been growing tremendously (Li et al., 2020a; Tong et al., 2020; Krasucka et al., 2021; Yang et al., 2022). Nowadays, the presence of pharmaceutical contaminants in environmental water samples has become a global concern. The antibiotics enter the water through various pathways, such as human excrement, additional antibiotics discharge, and livestock and poultry treatment (Rowland et al., 2016; Kayode et al., 2021; Arabkhani and Asfaram, 2022; De Gauquier et al., 2022). Because small amounts of antibiotics are adsorbed into the body, a significant portion of them are excreted in the urine and enter the water environment through wastewater (Zahra et al., 2021; Imwene et al., 2022; Nemati et al., 2022).
Sulfonamides are highly effective antibiotics widely used in pharmacy due to their antibacterial and antiparasitic properties (Gomes et al., 2020). Sulfamethoxazole (SMX) is a sulfonamide antibiotic used to treat gastrointestinal infections, urinary tract infections, and respiratory infections. Consumption of SMX has side effects such as nausea, loss of appetite, vomiting, and itchy skin (Bhuvaneswari et al., 2021). Also, this antibiotic enters the water environment through the excreta and toilet wastewater. This antibiotic enters the human body through consumption of aquatic animals and contaminated water. Hence, this medicine enters a healthy human body and shows cause many side effects (Xiong et al., 2014; Ngqwala and Muchesa, 2020).
Therefore, it is essential to detect the pollutants in water and wastewater using an inexpensive, high-performance, and reliable system (Qu et al., 2013). Consequently, various methods such as densitometry, high-performance liquid chromatography (HPLC), colorimetry, thin-layer chromatography (TLC), spectrophotometry, and mass spectrometry (MS) have been applied to quantify antibiotics in waterbodies (Choi et al., 2015; Mondal et al., 2019; Taghizadeh et al., 2022; Khoubnasabjafari et al., 2023).
This study is aimed to meet two goals, namely, extraction steps on samples preconcentration and removal of interfering substances in the samples. In order to determination of antibiotics, the steps of preconcentration and extraction on wastewater samples should be analyzed (Ozdemir et al., 2020). This is because, the concentration of antibiotics excreted in wastewater is low. Also, the wastewater environment is one of the most complex water environments in terms of organic compounds. The improvement of extraction methods led to the emergence of new techniques, such as dispersive solid-phase microextraction (DSPME) and dispersive liquid-liquid microextraction (DLLME) (Mohebbi et al., 2022).
In the DLLME method, a water-insoluble solvent is injected with high pressure (as an extractor) through a syringe into the aqueous medium containing the sample, which turns into tiny droplets. This operation extracts the analyte from the aqueous solution and transfers it to the organic solution. In the DSPME method, the species are preconcentrated by adsorption on the adsorbent substrate by physical or chemical interactions. Solid-phase extraction is widely used to remove or preconcentration analytes from aqueous solutions. The advantages of DLLME and DSPME methods include the simplicity and availability of equipment, ease of the method, low cost, and low solvent consumption (Pérez-Rodríguez et al., 2018; Shojaei et al., 2021a; Nemati et al., 2022).
Nanoparticles play a significant role in water treatment (Nandhini et al., 2019; Zhang et al., 2020). The use of nanoparticles as adsorbents and catalysts involves numerous advantages. The key benefits of using nanoparticles in pollutant removal include: I) High efficiency: Thanks to their large surface area and nanoscale structure, nanoparticles possess a higher capability for adsorbing pollutants than other adsorbents. This high efficiency leads to more effective removal and a further reduction in pollutant quantities. II) Enhanced removal rate: Because of their nanoscale structure and large surface area, nanoparticles have a faster interaction and binding capacity with pollutants. This feature leads to an increased removal rate and improved speed of water treatment processes. III) Versatility: Nanoparticles can serve as adsorbents, catalysts, or oxidizing agents in water treatment processes. This versatility simplifies treatment procedures and reduces the number of required stages. IV) Reduced energy and chemical consumption: Nanoparticles can decrease energy and chemical consumption in water treatment processes, leading to cost savings and environmental protection. V) Stability and recyclability: Some nanoparticles can remain stable in water treatment processes and can be reused. This characteristic allows for reducing waste generation and promotes sustainability. Considering these advantages, using nanoparticles as adsorbent for pollutant removal in water treatment processes is of great interest (Kovo et al., 2023; Onu et al., 2023; Yahyaeian et al., 2023; Uko et al., 2022; Naseem and Durrani, 2021; Jamkhande et al., 2019).
Zinc ferrite (ZnFe2O4) is a group of magnetic materials of which iron oxide is a significant component. ZnFe2O4 could be used in wastewater treatment processes, and a magnet easily separates them after the process, and they could be used again (Rajini and Ferdinand, 2022). ZnFe2O4 has many applications in wastewater treatment owing to its non-toxicity, low cost, ability to absorb visible light, high phase resistance, and insoluble (Wu et al., 2019).
Li et al. (2020a) applied reduced graphene oxide/ZnFe2O4 (rGO/ZnFe2O4) composite in the solid-phase extraction (SPE) method to extract estrogens from soil, water, and fish samples. They observed a good linear range (0.05–500 ng mL-1) with the coefficient of determination (R2) between 0.9978 and 0.9993. They also obtained limits of detection and limits of quantification at 0.01–0.02 ng mL-1 and 0.05 ng mL-1, respectively. They obtained acceptable results in the extraction of the estrogens in complex samples (Li et al., 2020b).
Also, Chen et al. (2019) used ZnFe2O4 magnetic nanotubes (ZFONTs) as adsorbents for preconcentration of Pd (II), Au (III), and Pt (IV). According to the results, the analytes could be quantitatively absorbed by ZFONT in the pH range of 1.0–5.0. They obtained the detection limits of 0.17 pg mL-1, 0.35 pg mL-1, and 0.64 pg mL-1 for Pd, Au, and Pt, respectively. Moreover, they applied the developed method to determination of Pd, Au, and Pt in environmental and biological samples, and good results were obtained (Chen et al., 2019).
There are various methods, such as enzymatic extraction, soxhlet extraction, and ultrasonic-assisted extraction (UAE) to reduce extraction time and increase extraction performance, among which the UAE method is simple and effective (Roosta et al., 2015; Molino et al., 2020; Uwineza and Waśkiewicz, 2020). The increase in the extraction efficiency is attributed to the acoustic vibration created by passage of ultrasonic waves. The steps of the ultrasonic extraction process include the swelling of the tissue to adsorb the eluent, the exit of the samples from the tissue to the eluent by creating porosity and penetration into the cell wall (Xing et al., 2022).
The UAE method involves numerous advantages in water treatment (Kalra et al., 2021). Some of these advantages include: I) Reduction in chemical consumption: Using ultrasonic reduces the need for chemical disinfectants. II) Removal of small particles: Ultrasonic waves can remove small suspended particles in water, including suspended solids, microorganisms, and even viruses. III) Reduction in treatment time: Ultrasonics can decrease the required time for water treatment, thereby increasing the speed of water purification. IV) Reduction in sediment formation: Ultrasonic waves can reduce sediment formation in water treatment systems, decreasing the need for system cleaning and maintenance. V) No reliance on active chemical products: In specific water treatment processes (e.g., oxidation and elimination of organic matter), ultrasonic can be a suitable alternative to active chemical products. This advantage contributes to reducing environmental hazards and improving water quality. VI) Applicability in closed systems: The ultrasonic method can be employed in closed water treatment systems. Therefore, it can be applied to smaller locations and limited-space applications (e.g., households and compact settings). Considering these advantages, the UAE method is regarded as an advanced and effective technique in water treatment (Ahmad et al., 2022; Purabadeh et al., 2022).
Since the wastewater environment and the variety of pollutants in it are very complex, especially in hospital wastewater, their extraction, separation, and measurement require special skills and accuracy. Hence, to ensure the presence of this antibiotic in hospital wastewater, it is necessary to have an accurate and simple method to monitor and determination of SMX in hospital wastewater. In this study, SMX antibiotic is extracted from hospital water and wastewater samples by DLLME and DSPME methods. Then an accurate method with minimal complexity was identified and applied to determination of SMX in wastewater. Also, the optimization of the effect of parameters (pH of solution, extraction solvent volume, disperser solvent volume, ultrasonication time, adsorbent amount, and eluent volume) on SMX extraction efficiency was performed by RSM with CCD matrix.
2 Materials and methods
2.1 Chemicals and instrumentation
All the required materials, such as chloroform (≥99.0%), acetone (≥99.8%), carbon disulfide (≥99.90%), hydrochloric acid (≥37%), ethanol (≥99.9%), sodium hydroxide (≥97%), acetonitrile (≥99.9%), and methanol (≥99.9%) were purchased from Merck Company and sulfamethoxazole (≥98.0%), from Sigma-Aldrich. To adjust pH, solutions like HCl (0.1 M) and NaOH (0.1 M) were used. Also, the standard SMX solution with concentration of 100 mg L-1 was used to prepare working solutions for experiments. The chemical structure of SMX (Molecular weight: 253.3 g mol−1 and molecular formula: C10H11N3O3S) is shown in Figure 1. A UV-Vis spectrophotometer (Shimadzu UV-1900, Japan) was used to measure the concentration of SMX, and at each stage, spectroscopy was performed in the wavelength range of 200–400 nm. An ultrasonic device (LK-D31-1, China) was used for ultrasound-assisted extraction. Scanning electron microscope (SEM; KYKY-EM3200, China) and X-ray diffraction (XRD; Philips X’Pert Pro MPD, Netherlands) evaluated the adsorbent structure. The experiments were carried out at the Islamic University, Iraq.
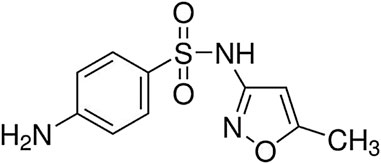
FIGURE 1. Chemical structures of SMX.
2.2 Synthesis of ZnFe2O4 adsorbent
ZnFe2O4 adsorbent were synthesized by the hydrothermal method.
For this purpose, 1,000 mL of solution was prepared by dissolving Zn(NO3)2.6H2O and FeSO4.7H2O with a molar ratio of 1/2 (Zn/Fe) in double distilled water. The pH of the solution was adjusted to 9 by HNO3 (0.1 N) and NaOH (0.1 N) solutions. The synthesis was continued at 80°C for 40 min under continuous air purification (flow rate = 4 L min-1). The prepared adsorbent was separated using a magnet and washed with double distilled water until the pH of the solution reached 7. Then the ZnFe2O4 adsorbent was dried in an oven at 60°C for 24 h and kept for further investigation. The formation equation of ZnFe2O4 nanoparticles can be expressed as Eq. (1).
2.3 Ultrasound-assisted dispersive liquid-liquid microextraction (UA-DLLME)
Initially, 10 mL of SMX solution with a concentration of 250 μg L-1 was transferred to a conical bottom test tube, and its pH was adjusted to 5. Then, 185 µL of chloroform and 535 µL of acetonitrile were injected into the aqueous solution using a glass syringe. At this stage, the test tube was placed in an ultrasonic bath for 7.5 min. The mixture was centrifuged at 5,500 rpm for 5 min. After centrifuging, solvent droplets containing the analyte were deposited in the tube. The precipitated phase was isolated entirely and in order to analyze the SMX value, it was transferred to a spectrometer, and measurements were made at 260 nm. The extraction recovery (ER) and the enrichment factor (EF) were calculated by Eqs 2, 3, respectively.
where C0 is the concentration of SMX in the aqueous solution. Csed is the concentration of SMX in the organic solution. Vaq is the volume of the aqueous solution. Vsed is the volume of the organic solution (Cruz-Vera et al., 2009; Nemati et al., 2023). A schematic of the UA-DLLME method is shown in Figure 2.
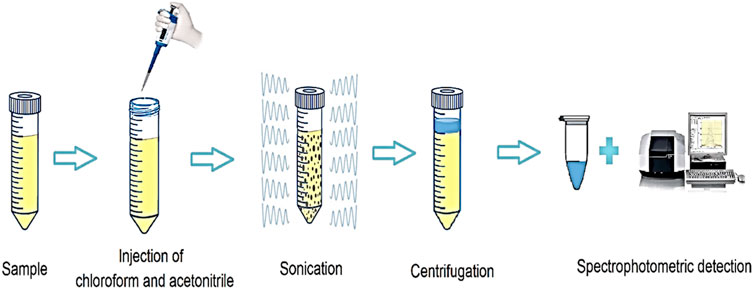
FIGURE 2. Schematic diagram of the UA-DLLME procedure.
2.4 Ultrasound-assisted dispersive solid-phase microextraction (UA-DSPME)
In order to preconcentration and extraction SMX from aqueous solutions, DSPME in optimal conditions was used. For this reason, 10 mL of SMX (concentration 250 μg L-1) was prepared at pH of 5. Then, 0.024 g of ZnFe2O4 nanoparticles were added to it. The dispersion was performed through an ultrasonic bath for 7.5 min and centrifuged at 5,500 rpm for 5 min. Then, the adsorbent was separated from the liquid phase using a magnet and washed with 235 µL of methanol. Finally, the solvent was transferred to the cell spectrometer, and SMX was determined by UV-Vis spectrophotometry. A schematic of the UA-DSPME method is shown in Figure 3.
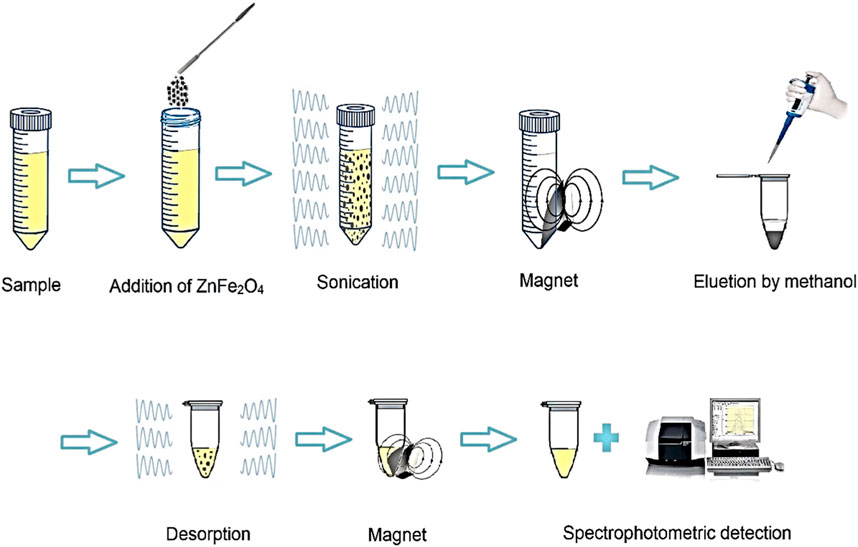
FIGURE 3. Schematic diagram of the UA-DSPME procedure.
2.5 Central composite design
The RSM is a method based on statistical and mathematical techniques that can be used to examine the relationships between variables and responses and analyze interaction effects (Xu et al., 2021). In addition, the RSM provides a mathematical model for the researcher to study the effects of independent variables (Tao et al., 2022). The central composite design (CCD) framework is used to design of matrix. This approach optimizes the number of experiments as well as provides a platform to statistically validate the range of independent process variables. This statistical design also provides a data-driven model based on the analysis of variance (ANOVA) method. The identified model can be a linear or quadratic or cubic regression model, which will be determined based on the interaction between the variables and their statistical significance. In many studies performed by RSM, the quadratic regression model was the most significant multivariate model (Shojaei et al., 2021b; Boublia et al., 2023). The multivariate model, which involves linear and non-linear terms, is given in Eq. (4).
This equation includes linear sentences (xi), interactions (xixj), and quadratic variables (xi2). Y is the extraction recovery and e is the random error. The coefficients β0, βi, βij, and βii also show the constant term, the linear, quadratic, and interactive coefficients, respectively (Pourabadeh et al., 2020).
CCD is a typical RSM experimental design framework. Each factor in CCD is examined at five levels (−α, −1, 0, +1, +α) and includes axial points, factorial points, and center points. Factorial points are named high and low levels and are marked with +1 codes for high and −1 for low levels. Axial points are at a distance from the center. Also, there is more than one central point for estimating experimental error and determining data reproducibility. This study evaluated the effect of parameters to investigate the increase in SMX extraction and process optimization at five levels and six replications at the central points of the design. Design-expert software v10 (trail) was used to design experiments and data processing. Table 1 shows the independent variables and their values.
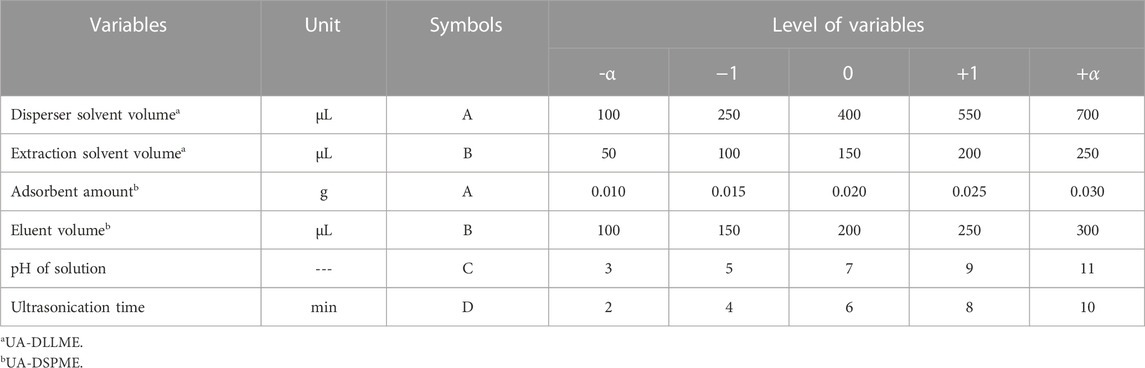
TABLE 1. Range and coded values of design of experimental matrix for extraction.
2.6 Real-time samples
SMX drug was measured to evaluate the UA-DLLME and UA-DSPME methods in studying real-time samples with different matrices of tap water, wastewater of hospital, and urine. For this reason, certain amounts of drugs to the samples were added, and the extraction was performed according to the proposed methods in optimal conditions. The results were reported for three replications. In order to evaluate urine samples from five healthy men (25–30 years old) with consent, urine samples were collected without medication and stored at −10°C. Urine samples were diluted to reduce the effect of matrix (5 mL of double distilled water was added to 5 mL of urine). Further, several compounds at lower pH may become insoluble for extraction from hospital wastewater and urine samples. As a result, it is necessary to separate the sediments from the solution using a centrifuge before adding the drug. For this reason, the hospital wastewater and urine samples were centrifuged (3,500 rpm) for 10 min.
3 Results
3.1 Characterization of adsorbent
SEM and X-ray diffraction were applied to evaluate the structure and size of synthesized ZnFe2O4 nanoparticles. An SEM image (see Figure 4) was taken to study the surface structure and size of ZnFe2O4 nanoparticles. As shown in Figure 4A, ZnFe2O4 nanoparticles are seen as granular and separate structures, and their size is less than 100 nm. The peak position and relative intensity observed in the XRD pattern of ZnFe2O4 nanoparticles are shown in Figure 4B. The XRD pattern of the ZnFe2O4 adsorbent corresponded to the standard card (JCPDS 22–1,012) related to the ferrite. The plates 220, 311, 400, 422, 511, and 440 in the diffraction pattern show the reason for the formation of spinel cubic phase with the space group Fd-3m (Navgare et al., 2020). In this study, the absence of additional plates indicated the formation of a pure phase of the zinc ferrite nanostructure. The crystal sizes of the ZnFe2O4 nanoparticles were calculated using Debye–Scherrer equation [Eq. (5)].
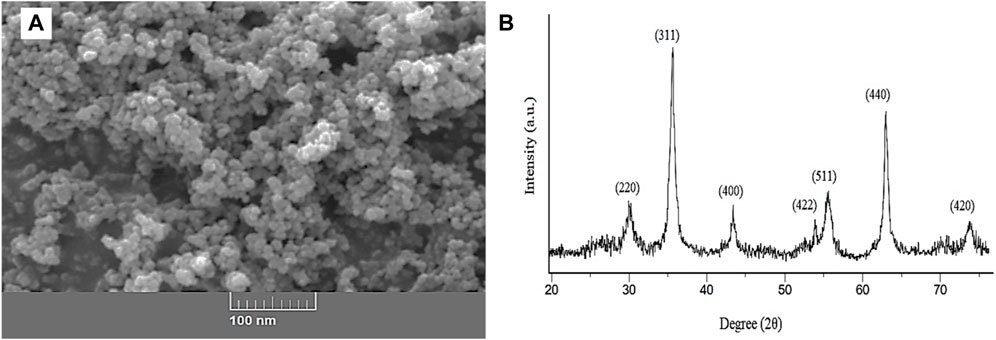
FIGURE 4. (A) SEM and (B) XRD patterns of ZnFe2O4 nanoparticles.
In this equation, θ (degree), D (nm), λ (nm), K, and β (radians) are the Bragg’s angle, the crystal size, the X-ray wavelength, the shape factor, and full width at half maximum (FWHM) respectively (Egbosiuba et al., 2021). The crystal size of the nanostructures was determined by the Debye–Scherrer equation and found to be 15 nm. The surface area is an important parameter in determining the morphology of the absorbent. The higher the surface area of the ZnFe2O4 adsorbent, the more active surfaces are available for the adsorption of pollutants on the adsorbent. Therefore, BET analysis of ZnFe2O4 nanoparticles was performed. The total pore volume, the surface area, and the mean pore diameter was 0.16 cm3 g−1, 80.06 m2 g−1, and 9.7 nm, respectively.
3.2 Data analysis and selection of appropriate model by response surface methodology
Relevant tests were performed according to the points defined in the RSM scheme. The results of SMX extraction efficiency tests are presented in Table 2. In the next step, the response surface methodology analyzed the data from different tests. Also, the regression coefficients were estimated, and the ANOVA Table was obtained for each of the answers shown in Table 3.
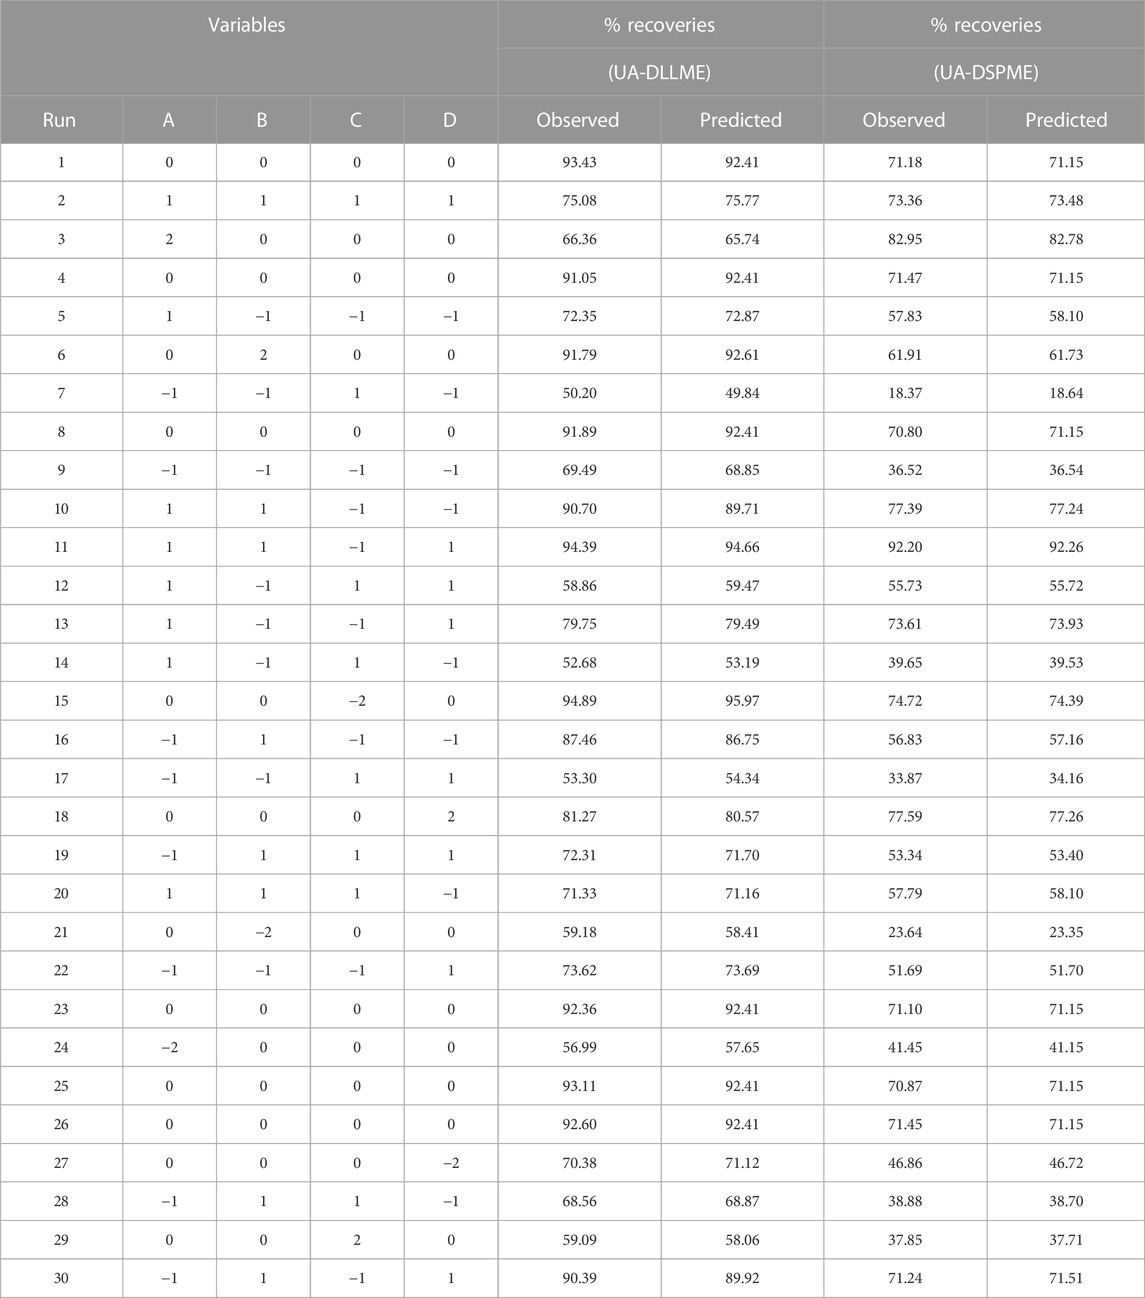
TABLE 2. Experimental matrix of variables (coded) with their corresponding extraction recoveries.
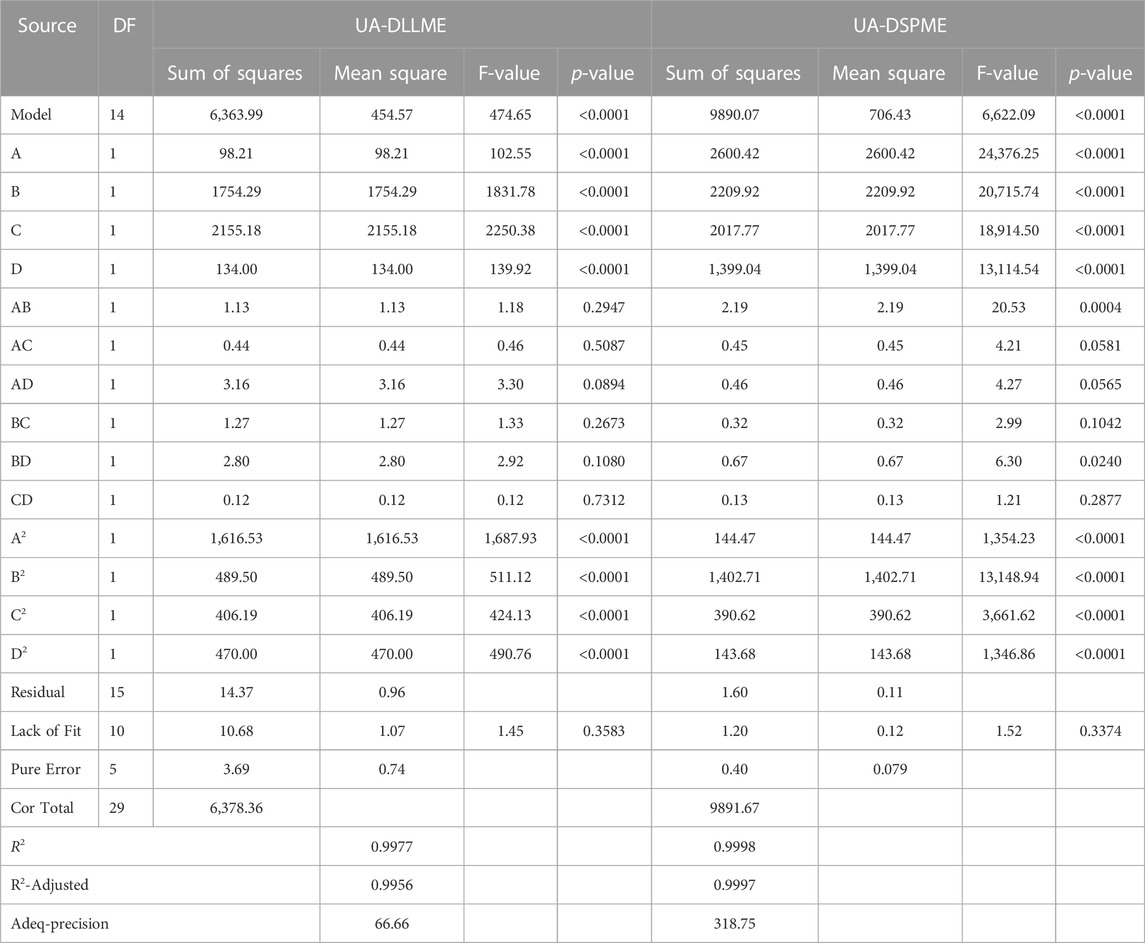
TABLE 3. ANOVA of the quadratic model to UA-DLLME and UA-DSPME.
ANOVA is a technique used to assess the significance of differences between groups or treatments in a study. In the context of the provided information, ANOVA can be applied to evaluate the relationship between variables and a response (Promoppatum and Yao, 2020). The coefficient of determination (R2) expresses the proportion of total changes in responses that can be determined by the variables. For the UA-DLLME method, R2 was calculated to be 0.9977, indicating that 99.77% of the changes in the response can be determined by the variables. In the UA-DSPME method, the R2 value was even higher at 0.9998, suggesting that the variables explain 99.98% of the response variation. The adjusted coefficient of determination (R2-adj) considers the number of parameters in the design. The R2-adj for the UA-DLLME method was reported as 0.9956, which considers the complexity of the model. The R2-adj for the UA-DSPME method was 0.9997, reflecting its high explanatory power. To evaluate the model fit, the lack-of-fit test was conducted. The lack-of-fit test examines whether the model successfully represents the data at points outside the regression model’s domain. It is used to detect any shortcomings in the model’s fit. The article mentions the lack-of-fit test as a means of identifying areas where the model fails to capture the data accurately (Almeida et al., 2017; Bhowmik et al., 2018). Regarding precision, adequacy precision values were provided for each method. The UA-DLLME method achieved an Adeq-precision of 66.66, while the UA-DSPME method had a value of 318.75. Higher Adeq-precision values indicate better reliability of the regression models. Therefore, the results showed that the model significantly predicts the extraction under different variable conditions. The quadratic model was performed on the test data, and Eqs 6, 7 were obtained as encoded representations for the predicted extraction recovery of UA-DLLME and UA-DSPME methods, respectively.
The experimental data versus predicted data plots and the normal plot of residuals demonstrate good agreement and normal distribution of the data (Figure 5). To assess the normal distribution of residuals, Figures 5A, B have been utilized. These plots show how well the predicted values align with the actual experimental data, indicating the model’s accuracy. The normal probability graphs in Figures 5C, D are used to check the normality of the data. The closeness of the data to the straight line in these graphs showed a normal distribution for errors with zero mean and constant variance.
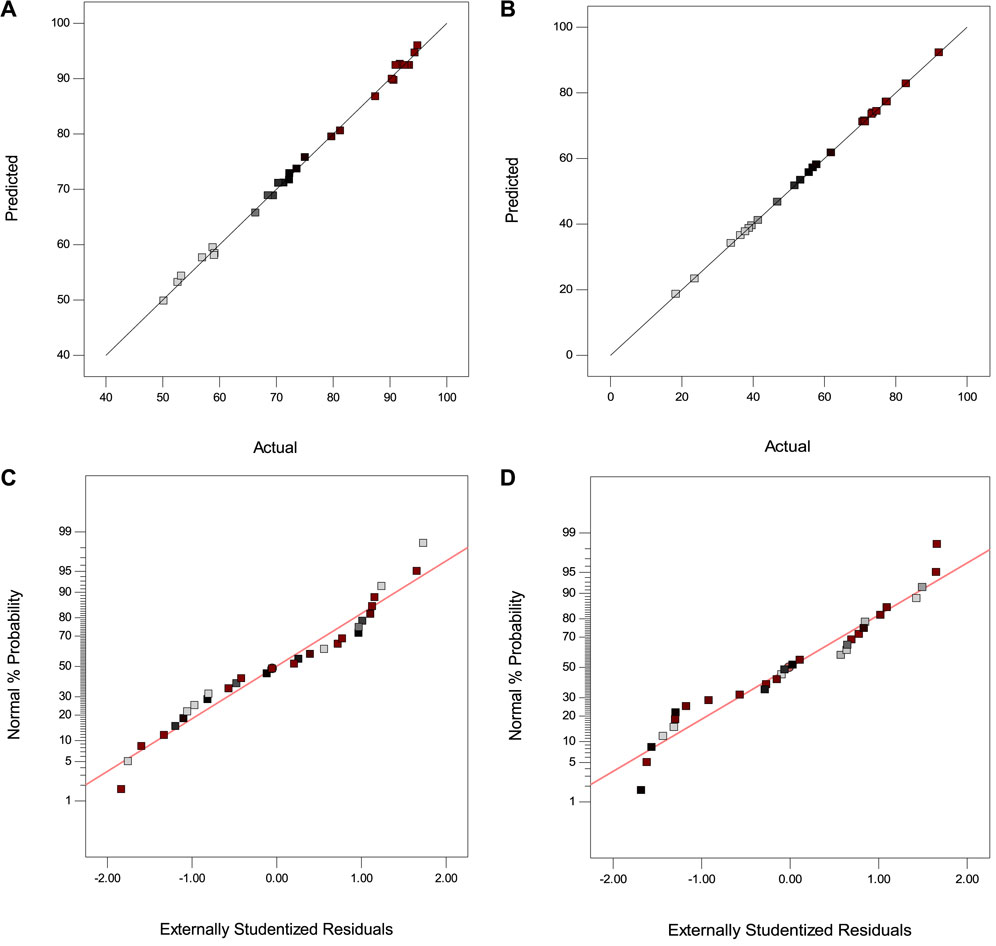
FIGURE 5. Actual data versus predicted data for (A) UA-DLLME and (B) UA-DSPME; Normal plot of residuals for (C) UA-DLLME and (D) UA-DSPME.
3.3 Selection of types of disperser solvent and extraction solvent
In the UA-DLLME process, the extraction solvent was selected from solvents that were insoluble in water and had a higher density than water. Also, they could extract the desired compound. In this regard, carbon tetrachloride (CCl4), carbon disulfide (CS2), and chloroform (CHCl3) were tested as extraction solvents. Based on the results, a clear cloud solution was not obtained using CS2 and CCl4 as extraction solvent. It indicates that these solvents cannot disperse appropriately in the aqueous phase and may not have a good extraction ability. However, with CHCl3, high extraction efficiencies were obtained for SMX. Therefore, CHCl3 was selected as the optimal extraction solvent in later stages.
For the sample preparation process in the UA-DLLME method, it should be noted that the type of disperser solvent is important for the preconcentration of the material. The basis for selecting the disperser solvent is its solubility in the organic phase and the aqueous phase. For this purpose, acetonitrile (ACN), methanol (ME), acetone (AC), and ethanol (ET) were selected as disperser solvents because of their chemical and physical properties. According to the results, the highest recovery rate was achieved while using acetonitrile as a disperser solvent. So, acetonitrile was selected as disperser solvent for further experiment analysis.
The eluent solvent plays an important role in the UA-DSPME method because the efficiency is affected by the proper dispersion of the ZnFe2O4 adsorbent in the solution. Various solvents such as ACN, ME, ET, and AC were tested. The results (Figure 6) show that methanol as an eluent increases extraction and adsorption efficiency. So, methanol was selected as the eluent in the UA-DSPME method.
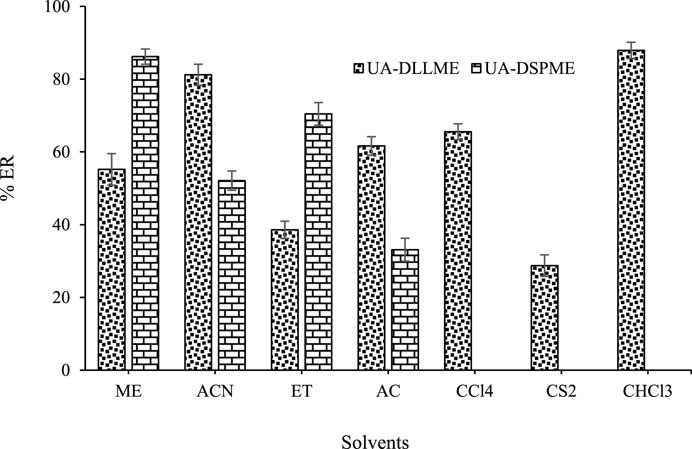
FIGURE 6. Effect of different solvents on extraction efficiency.
3.4 Centrifuge speed effect
In order to accelerate the process in this study, centrifugation is used. Also, centrifugation is essential as the precipitating force of the extracting solvent containing the analyte. Hence, the effect of centrifuge speed in the range of 1,000–4000 rpm was investigated. According to Figure 7, the extraction efficiency of SMX increases with increasing centrifuge speed and remains constant at 3,500 rpm for UA-DLLME and UA-DSPME. The low extraction efficiency at low velocities occurs because the phase separation in the UA-DLLME method and the adsorbent settling in the UA-DSPME method are not entirely done. Therefore, 3,500 rpm was chosen as the optimal centrifuge speed to complete the separation of phases.
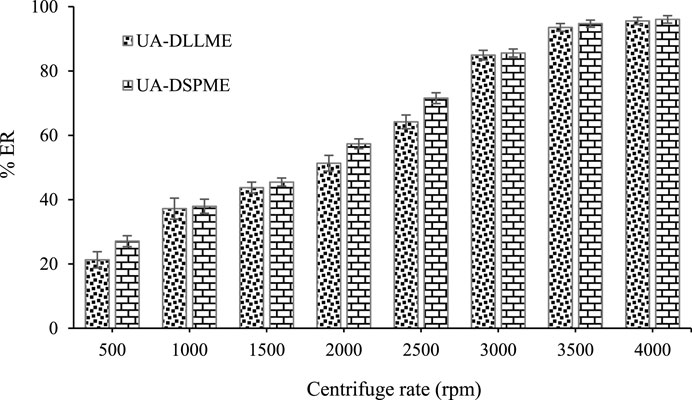
FIGURE 7. Effect of centrifuge speed on extraction rate.
3.5 pHpzc determination of ZnFe2O4 nanoparticles
The point of zero charges (pHpzc) of the ZnFe2O4 adsorbent was determined by charging 9 Erlenmeyer flasks (100 mL) with 50 mL of 0.01 M NaCl solution. In this process, their initial pH was adjusted to 2–10 using 0.1 M NaOH and 0.1 M HCl solutions. Then, 0.1 g of adsorbent was weighed and added to each Erlenmeyer. The mixture was stirred on a shaker at 100 rpm at 25°C for 24 h. Afterward, the pHf of the solutions was determined with a pH meter. The difference between the pHf and the pHi (∆pH = pHf-pHi) was plotted versus the pHi. The point where the graph intersected the X-axis was reported as the pHpzc. This point shows where the sum of the negative surface charge balances the sum of the positive surface charge. This value for the synthetic adsorbent was about 6.1 (Figure 8). Therefore, at pH < 6.1 and pH > 6.1, the ZnFe2O4 adsorbent surface has a positive charge and a negative charge, respectively.
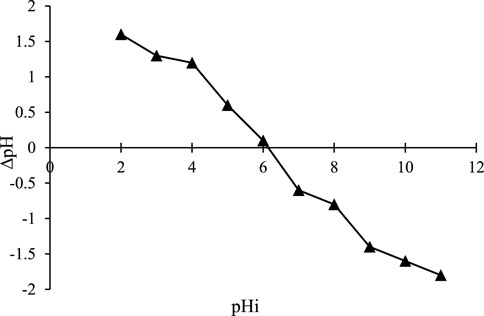
FIGURE 8. Variation of pHpzc of ZnFe2O4 nanoparticles.
3.6 Reusability studies
The reusability of ZnFe2O4 nanoparticles is an important aspect of operational and environmental objectives. The ability to reuse and regenerate the adsorbent is critical for economic feasibility. The reversible adsorption process allows for adsorbent regeneration. To study the reusability, the adsorbent was placed in 5 mL of methanol for 5 min after each extraction. After the desired time, the mixture was centrifuged (3,500 rpm) for 5 min. After that, the ZnFe2O4 nanoparticles was separated from the solution using a magnet and washed with double distilled water. The ZnFe2O4 nanoparticles was dried in an oven (90°C) for 1 h. The reusability experiments of ZnFe2O4 nanoparticles in this study showed that the adsorbent can be effectively used several times for the extraction of SMX (Figure 9).
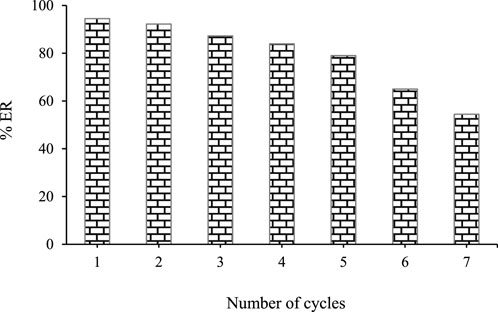
FIGURE 9. Regeneration studies of ZnFe2O4 nanoparticles.
3.7 Interference effect of other ions
Many cations and anions with different concentrations in natural water samples can affect the extraction of the pollutants and cause errors (negative or positive) in their measurement. Hence, it is highly significant to study the effect of various ions and their interference. In this research, SMX is extracted from aqueous samples containing 250 μg L-1 of SMX in the presence of various anions and cations, and determined the degree of interference of these ions. It should be noted that an interfering ion refers to an ion that causes a ±5% change in the absorption signal of the analyte. The results of interference effect are presented in Table 4. The results showed that most investigated anions and cations did not significantly interfere with SMX extraction and measurement.
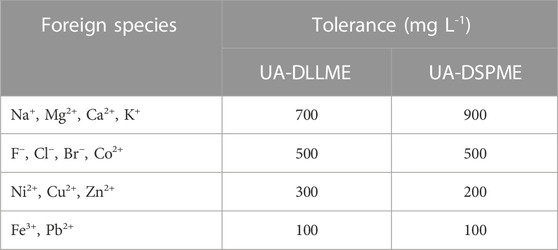
TABLE 4. Interference effect of other ions on the recoveries of SMX.
3.8 Optimization of SMX extraction conditions
Based on the above results, the optimal conditions for extracting of SMX from environmental water and biological samples using Design-expert software v10 were predicted (Table 5). The maximum extraction recovery under the optimal conditions (0.024 g of adsorbent, 7.5 min of ultrasonication time, 235 µL of eluent volume, pH = 5, 535 µL of disperser solvent volume, and 185 µL of extraction solvent volume) was estimated. The extraction recovery of SMX was determined as 94.11% for the UA-DLLME method and 93.63% for the UA-DSPME method. The RSD (N = 3) for the UA-DLLME and UA-DSPME methods were obtained as 1.6% and 2.2%, respectively, confirming the model’s high accuracy in predicting the results.
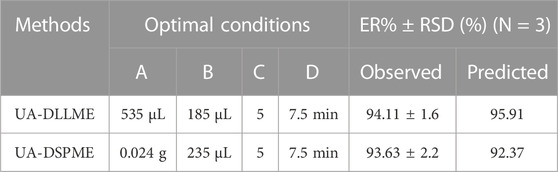
TABLE 5. Factors studied in the experimental design and their optimal levels.
3.9 Evaluation of UA-DLLME and UA-DSPME methods performance
Parameters such as preconcentration factor (PF), percent relative standard deviation (RSD%), enrichment factor (EF), limit of detection (LOD), and linear range (LR) were calculated to demonstrate the validity of the methods (Table 6). Under optimal conditions, the LR for the UA-DLLME and UA-DSPME methods were determined as 10–800 μg L-1 and 20–1,200 μg L-1, respectively. The LOD for the UA-DLLME and UA-DSPME methods were obtained as 3 μg L-1 and 6 μg L-1, respectively, indicating the high sensitivity of the measurement methods. The repeatability was also assessed by calculating the RSD (N = 5), resulting in 1.9% and 2.3% for the UA-DLLME and UA-DSPME methods, respectively. EF represents the ratio of analyte concentration in the organic solution to its initial concentration in the aqueous solution. EF values of 108 and 95 were obtained for the UA-DLLME and UA-DSPME methods, respectively. The PF, indicating the ratio of the analyte concentration in the analyzed solution to its concentration in the initial solution, was 54.05 for UA-DLLME and 42.55 for UA-DSPME. The LOD obtained when UA-DLLME was applied was lower than that obtained when UA-DSPME was used. The UA-DLLME has advantages, such as high enrichment factor, high preconcentration factor, and low LOD and low RSD values. The UA-DSPME and UA-DLLME methods represent inexpensive alternatives to conventional SPE and LLE extraction methods.
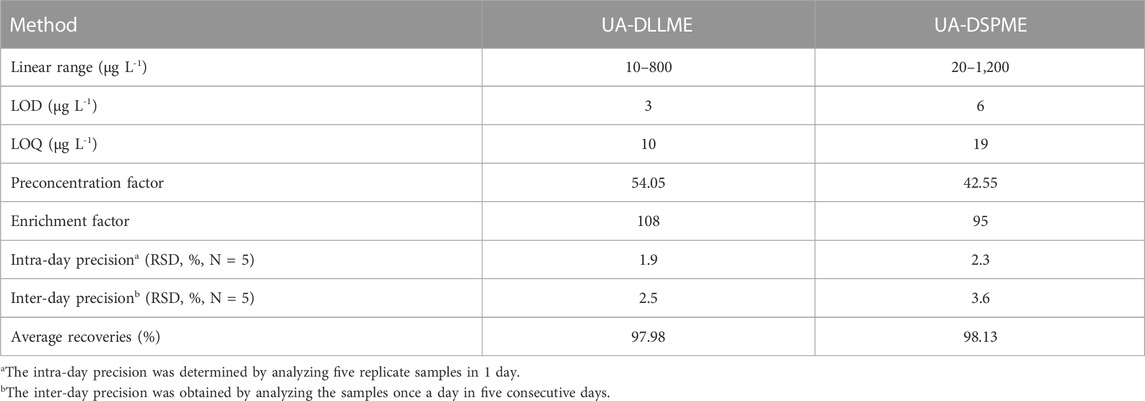
TABLE 6. Analytical characteristics of the UA-DLLME and UA-DSPME methods.
3.10 SMX measurement in real-time natural samples
To separate, preconcentration, and measure SMX from various samples, including deionized water, wastewater of hospital, tap water, and urine, experiments were conducted for UA-DLLME and UA-DSPME methods. The preconcentration and extraction of SMX from real samples were done by adding 250 μg L-1 of SMX to the samples in three repeated measurements according to the proposed methods (Section 2.3 and Section 2.4) in optimal conditions, and the amount of recovery SMX was determined. Table 7 presents the results of UA-DLLME and UA-DSPME methods for SMX extraction and measurement in real samples. The results of Table 7 showed that these methods were suitable for use in real samples.
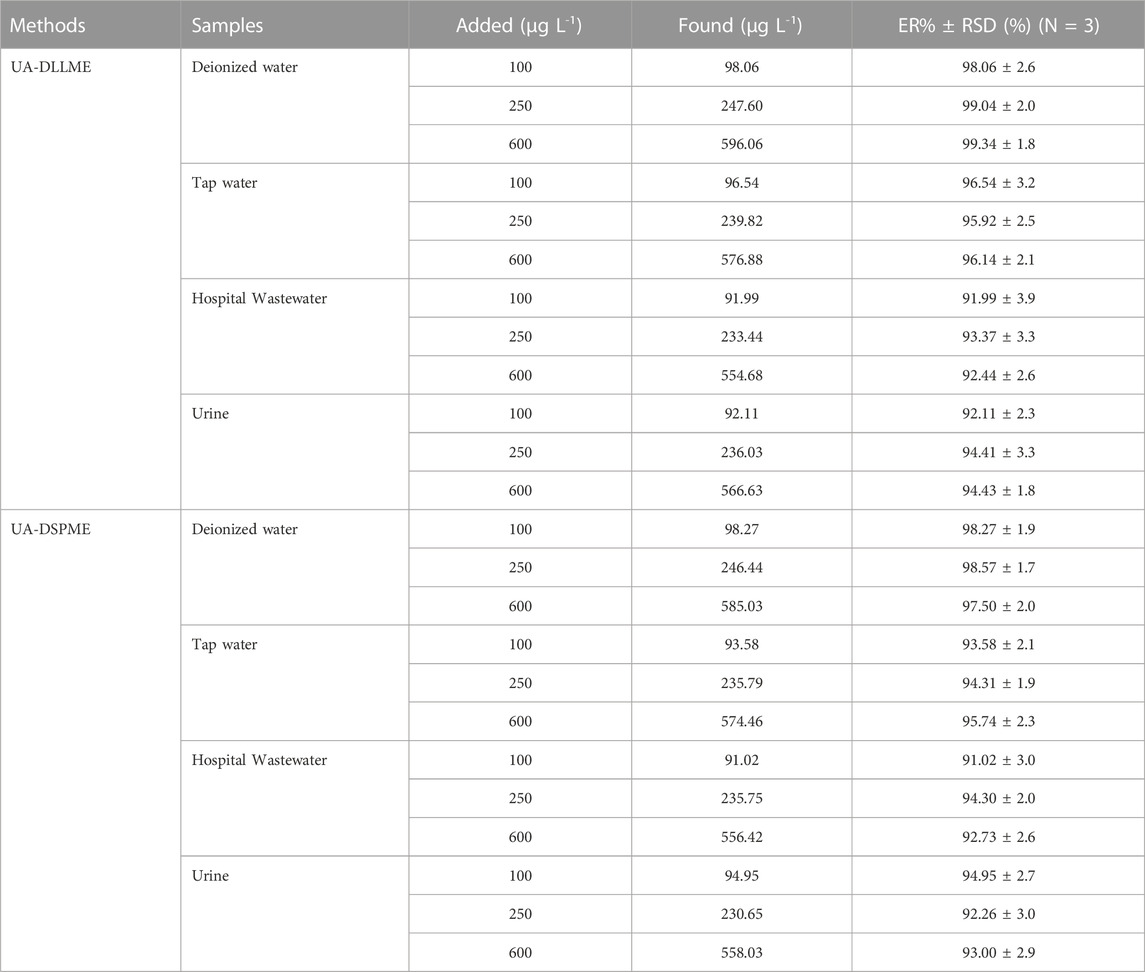
TABLE 7. Extraction recoveries in different samples by the UA-DLLME and UA-DSPME methods.
3.11 Study of effects of variables on the extraction of SMX
Each process parameter (keeping other parameters constant) has a different effect on the overall extraction of SMX. However, the interaction effect of the two parameters has a significant effect on the extraction. Therefore, surface response plots were drawn to study the contour trends and effects of different parameters on the overall extraction efficiency (Figure 10). The parameters are plotted on the x and y-axes in these three-dimensional diagrams, and the response is plotted on the z-axis.
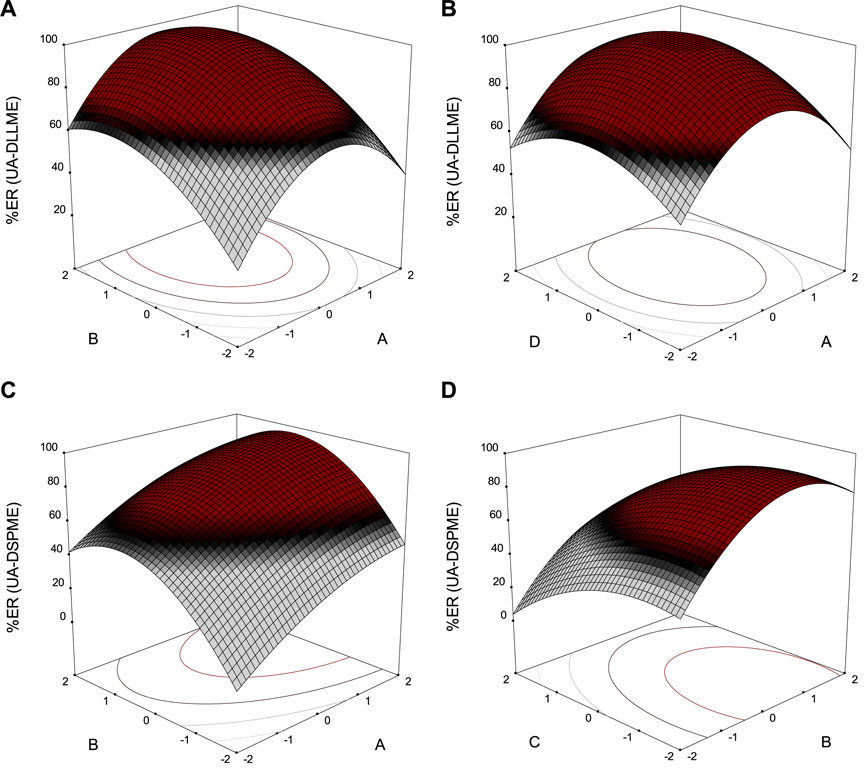
FIGURE 10. Response surface plots of extraction recovery (ER%) for (A) and (B) UA-DLLME; (C) and (D) UA-DSPME.
Figure 10A shows the effect of two parameters of extraction solvent volume and disperser solvent volume in the UA-DLLME method on SMX extraction. The volume of the disperser solvent is of high importance in the UA-DLLME method. Also, different volumes of acetonitrile (100–700 μL) were tested to determine the optimal disperser solvent volume. Initially, with increasing disperser solvent volume, the recycling efficiency also increased, but at volumes above 535 μL, the recycling efficiency decreased. The results showed that the highest recovery was observed in 535 μL of acetonitrile.
Different amounts of chloroform (50–250 μL) were investigated to determine the effect of extraction solvent volume on the SMX extraction. According to Figure 10A, the SMX extraction was maximum in the chloroform volume of 185 μL, and then the SMX extraction decreased with the increase of the chloroform volume. The reason is that the concentration factor drops since the volume of the precipitated phase increases. So, 185 μL of chloroform was chosen as the optimal volume in the UA-DLLME method.
Figure 10B presents the effect of disperser solvent volume and ultrasonication on the SMX extraction process in the UA-DLLME method. In the effect of ultrasonic duration (2–10 min), the highest amount of recovery was obtained when the solution of the cloudy was placed in an ultrasonic bath for 7.5 min, and as time increased, the amount of recovery decreased. Only quantities of analyte dissolved during extraction can be analyzed and quantified in the UA-DLLME sample preparation process. Therefore, the reason for the reduction in recycling, if the extraction time is increased, is that some of the analytes dissolved in the extraction solvent can be separated from it and dissolved in the disperser solvent.
Figure 10C illustrates the changes in SMX extraction due to changes in the adsorbent amount and eluent volume in the UA-DSPME method. Different volumes of methanol (100–300 μL) were investigated to determine the effect of eluent volume on SMX extraction in the UA-DSPME method. According to Figure 10C, the recycling efficiency increased when the eluent volume rose to 235 μL. However, at volumes above 235 μL, the recycling efficiency decreased. Therefore, 235 μL of methanol was chosen to obtain high efficiency in analyte extraction.
Figure 10 depicts the effect of pH and eluent volume on the SMX extraction. The pH changes the ions or molecules, which affects the extraction efficiency. For this reason, the amount of SMX extraction in the pH range of 3–11 was investigated. Based on the results, the maximum extraction was achieved at pH 5, and with increasing pH, the recycling efficiency decreased. The adsorbent surface is negatively charged because hydroxide ions in the solution at alkaline pH values go up, and SMX is expelled from the adsorbent surface with a negative charge. Therefore, it reduces the extraction rate.
3.12 Comparison of UA-DLLME and UA-DSPME methods with other methods for determination of SMX
The efficiency of UA-DLLME and UA-DSPME methods for SMX preconcentration was compared with other previous methods and the results are summarized in Table 8. As observed in Table 8, the proposed method was comparable or better than many previous methods in terms of various analytical parameters such as LR and LOD. Another important parameter is the extraction time. The extraction time was more than 7.5 min in previous studies on SMX extraction, and it shows the high speed of the methods in the present study. In many of the studied methods in the literature, devices such as HPLC or MS, which are selective analytical instruments with high sensitivity, have been utilized. On the other hand, the high cost of using these devices and the lack of accessibility in developing countries make their widespread adoption unfeasible. Hence, the current approach using spectrophotometry, which offers high sensitivity, repeatability, speed, and simplicity, is deemed suitable for preconcentration of SMX from aqueous and biological samples. Furthermore, the results showed that the use of the CCD matrix leads to a reduction in the number of experiments required. Additionally, this approach can reduce the associated time and costs involved in the investigation.
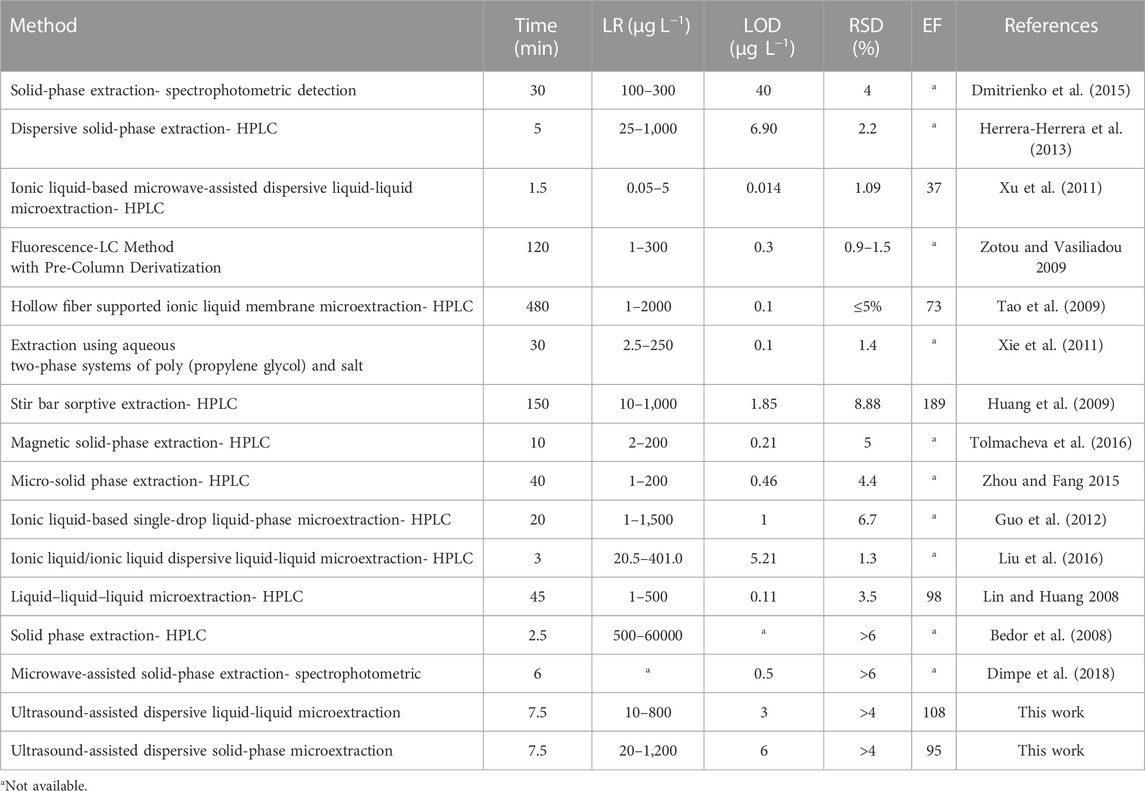
TABLE 8. Comparison of UA-DLLME and UA-DSPME with other methods for SMX preconcentration.
4 Conclusion
The UA-DLLME and UA-DSPME techniques were introduced to pre-concentrate SMX in water and biological samples. Measurement was performed using the spectrophotometry method. This research aimed to develop efficient, selective, cost-effective, and simple methods for determining SMX in water and biological samples. Therefore, the effect of various factors such as eluent volume, extraction solvent volume, ultrasonication time, adsorbent amount, disperser solvent volume, and pH were optimized using RSM coupled with CCD matrix to enhance the SMX extraction. The results showed that the methods were highly efficient, exhibited good reproducibility, and had a wide linear range (10–1,200 μg L−1) for SMX determination. The LOD for UA-DLLME and UA-DSPME methods were obtained as 3 μg L-1 and 6 μg L-1, respectively. The optimal conditions were 0.024 g of adsorbent, pH of 5, 235 µL of eluent volume, 185 µL of extraction solvent volume 7.5 min of ultrasonication time, and 535 µL of disperser solvent volume. The SMX extraction under the optimum conditions for water and biological samples was in the range of 92.44%–99.12% (RSD< 4). Also, the reusability showed that ZnFe2O4 nanoparticles can be effectively used up to 5 times to extract SMX. In addition, the interference effect showed that different cations and anions do not significantly interfere with the extraction of SMX. Therefore, UA-DLLME and UA-DSPME methods can be suggested as efficient methods for SMX extraction from water and biological samples.
Data availability statement
The original contributions presented in the study are included in the article/Supplementary Materials, further inquiries can be directed to the corresponding author.
Author contributions
Methodology, MR and SB; validation, AN; formal analysis, EM and RA; data curation, AR and AA; writing-original draft preparation, review and editing, AJ and AN; IA supervision. All authors contributed to the article and approved the submitted version.
Funding
This research was supported by funding from Prince Sattan bin Abdulaziz University project number (PSAU/2023/R/1444).
Conflict of interest
The authors declare that the research was conducted in the absence of any commercial or financial relationships that could be construed as a potential conflict of interest.
Publisher’s note
All claims expressed in this article are solely those of the authors and do not necessarily represent those of their affiliated organizations, or those of the publisher, the editors and the reviewers. Any product that may be evaluated in this article, or claim that may be made by its manufacturer, is not guaranteed or endorsed by the publisher.
References
Ahmad, A., Banat, F., Alsafar, H., and Hasan, S. W. (2022). Algae biotechnology for industrial wastewater treatment, bioenergy production, and high-value bioproducts. Sci. Total Environ. 806, 150585. doi:10.1016/j.scitotenv.2021.150585
Almeida, D. G., Soares da Silva, R. D. C. F., Luna, J. M., Rufino, R. D., Santos, V. A., and Sarubbo, L. A. (2017). Response surface methodology for optimizing the production of biosurfactant by Candida tropicalis on industrial waste substrates. Front." Microbiol. 8, 157. doi:10.3389/fmicb.2017.00157
Arabkhani, P., and Asfaram, A. (2022). The potential application of bio-based ceramic/organic xerogel derived from the plant sources: A new green adsorbent for removal of antibiotics from pharmaceutical wastewater. J. Hazard. Mater. 429, 128289. doi:10.1016/j.jhazmat.2022.128289
Bedor, D. C. G., Goncalves, T. M., Ferreira, M. L. L., De Sousa, C. E. M., Menezes, A. L., Oliveira, E. J., et al. (2008). Simultaneous determination of sulfamethoxazole and trimethoprim in biological fluids for high-throughput analysis: Comparison of HPLC with ultraviolet and tandem mass spectrometric detection. J. Chromatogr. B 863 (1), 46–54. doi:10.1016/j.jchromb.2007.12.027
Bhowmik, M., Deb, K., Debnath, A., and Saha, B. (2018). Mixed phase Fe2O3/Mn3O4 magnetic nanocomposite for enhanced adsorption of methyl orange dye: Neural network modeling and response surface methodology optimization. Appl. Organomet. Chem. 32 (3), e4186. doi:10.1002/aoc.4186
Bhuvaneswari, R., Nagarajan, V., and Chandiramouli, R. (2021). Red tricycle phosphorene nanoribbon as a removing medium of sulfadiazine and sulfamethoxazole molecules based on first-principles studies. J. Mol. Liq. 336, 116294. doi:10.1016/j.molliq.2021.116294
Boublia, A., Lebouachera, S. E. I., Haddaoui, N., Guezzout, Z., Ghriga, M. A., Hasanzadeh, M., et al. (2023). State-of-the-art review on recent advances in polymer engineering: Modeling and optimization through response surface methodology approach. Polym. Bull. 80 (6), 5999–6031. doi:10.1007/s00289-022-04398-6
Chen, S., Yan, J., Wang, C., and Lu, D. (2019). Preconcentration and determination of Au (III), Pd (II), and Pt (IV) using dispersive micro-solid phase extraction with multi-porous ZnFe2O4 nanotubes and ICP-MS. A. T. Spectrosc. 40 (6), 199–205. doi:10.46770/as.2019.06.001
Choi, I., Kim, D. E., Ahn, J. H., and Yeo, W. S. (2015). On-chip enzymatic assay for chloramphenicol acetyltransferase using matrix-assisted laser desorption/ionization time-of-flight mass spectrometry. Colloids Sur., B 136, 465–469. doi:10.1016/j.colsurfb.2015.09.052
Cruz-Vera, M., Lucena, R., Cárdenas, S., and Valcárcel, M. (2009). One-step in-syringe ionic liquid-based dispersive liquid–liquid microextraction. J. Chromatogr. A 1216 (37), 6459–6465. doi:10.1016/j.chroma.2009.07.040
De Gauquier, P., Vanommeslaeghe, K., Vander Heyden, Y., and Mangelings, D. (2022). Modelling approaches for chiral chromatography on polysaccharide-based and macrocyclic antibiotic chiral selectors: A review. Anal. Chim. Acta. 1198, 338861. doi:10.1016/j.aca.2021.338861
Dimpe, K. M., Mpupa, A., and Nomngongo, P. N. (2018). Microwave assisted solid phase extraction for separation preconcentration sulfamethoxazole in wastewater using tyre based activated carbon as solid phase material prior to spectrophotometric determination. Spectrochim. Acta, Part A. 188, 341–348. doi:10.1016/j.saa.2017.07.039
Dmitrienko, S. G., Kochuk, E. V., Tolmacheva, V. V., Apyari, V. V., and Zolotov, Y. A. (2015). Determination of the total content of some sulfonamides in milk using solid-phase extraction coupled with off-line derivatization and spectrophotometric detection. Food Chem. 188, 51–56. doi:10.1016/j.foodchem.2015.04.123
Egbosiuba, T. C., Abdulkareem, A. S., Tijani, J. O., Ani, J. I., Krikstolaityte, V., Srinivasan, M., et al. (2021). Taguchi optimization design of diameter-controlled synthesis of multi walled carbon nanotubes for the adsorption of Pb (II) and Ni (II) from chemical industry wastewater. Chemosphere 266, 128937. doi:10.1016/j.chemosphere.2020.128937
Gomes, I. B., Maillard, J. Y., Simões, L. C., and Simões, M. (2020). Emerging contaminants affect the microbiome of water systems—Strategies for their mitigation. NPJ Clean. Water 3 (1), 39. doi:10.1038/s41545-020-00086-y
Guo, X., Yin, D., Peng, J., and Hu, X. (2012). Ionic liquid-based single-drop liquid-phase microextraction combined with high-performance liquid chromatography for the determination of sulfonamides in environmental water. J. Sep. Sci. 35 (3), 452–458. doi:10.1002/jssc.201100777
Herrera-Herrera, A. V., Hernández-Borges, J., Afonso, M. M., Palenzuela, J. A., and Rodríguez-Delgado, M. Á. (2013). Comparison between magnetic and non magnetic multi-walled carbon nanotubes-dispersive solid-phase extraction combined with ultra-high performance liquid chromatography for the determination of sulfonamide antibiotics in water samples. Talanta 116, 695–703. doi:10.1016/j.talanta.2013.07.060
Huang, X., Qiu, N., and Yuan, D. (2009). Simple and sensitive monitoring of sulfonamide veterinary residues in milk by stir bar sorptive extraction based on monolithic material and high performance liquid chromatography analysis. J. Chromatogr. A 1216 (46), 8240–8245. doi:10.1016/j.chroma.2009.05.031
Imwene, K. O., Ngumba, E., and Kairigo, P. K. (2022). Emerging technologies for enhanced removal of residual antibiotics from source-separated urine and wastewaters: A review. J. Environ. Manage. 322, 116065. doi:10.1016/j.jenvman.2022.116065
Jamkhande, P. G., Ghule, N. W., Bamer, A. H., and Kalaskar, M. G. (2019). Metal nanoparticles synthesis: An overview on methods of preparation, advantages and disadvantages, and applications. J. Drug Deliv. Sci. Technol. 53, 101174. doi:10.1016/j.jddst.2019.101174
Kalra, R., Gaur, S., and Goel, M. (2021). Microalgae bioremediation: A perspective towards wastewater treatment along with industrial carotenoids production. J. Water Process Eng. 40, 101794. doi:10.1016/j.jwpe.2020.101794
Kayode, A. J., Semerjian, L., Osaili, T., Olapade, O., and Okoh, A. I. (2021). Occurrence of multidrug-resistant Listeria monocytogenes in environmental waters: A menace of environmental and public health concern. Front." Environ. Sci. 9, 737435. doi:10.3389/fenvs.2021.737435
Khoubnasabjafari, M., Altunay, N., Tuzen, M., Kaya, S., Katin, K. P., Farajzadeh, M. A., et al. (2023). Experimental and theoretical observations in a mixed mode dispersive solid phase extraction of exogenous surfactants from exhaled breath condensate prior to HPLC-MS/MS analysis. J. Mol. Struct. 1281, 135096. doi:10.1016/j.molstruc.2023.135096
Krasucka, P., Pan, B., Ok, Y. S., Mohan, D., Sarkar, B., and Oleszczuk, P. (2021). Engineered biochar–A sustainable solution for the removal of antibiotics from water. Chem. Eng. J. 405, 126926. doi:10.1016/j.cej.2020.126926
Li, J., Cai, X., Liu, Y., Gu, Y., Wang, H., Liu, S., et al. (2020a). Design and synthesis of a biochar-supported nano manganese dioxide composite for antibiotics removal from aqueous solution. Front." Environ. Sci. 8, 62. doi:10.3389/fenvs.2020.00062
Li, W., Zhang, J., Zhu, W., Qin, P., Zhou, Q., Lu, M., et al. (2020b). Facile preparation of reduced graphene oxide/ZnFe2O4 nanocomposite as magnetic sorbents for enrichment of estrogens. Talanta 208, 120440. doi:10.1016/j.talanta.2019.120440
Lin, C. Y., and Huang, S. D. (2008). Application of liquid–liquid–liquid microextraction and high-performance liquid-chromatography for the determination of sulfonamides in water. Anal. Chim. Acta. 612 (1), 37–43. doi:10.1016/j.aca.2008.02.008
Liu, Z., Yu, W., Zhang, H., Gu, F., and Jin, X. (2016). Salting-out homogenous extraction followed by ionic liquid/ionic liquid liquid–liquid micro-extraction for determination of sulfonamides in blood by high performance liquid chromatography. Talanta 161, 748–754. doi:10.1016/j.talanta.2016.09.006
Mohebbi, A., Jouyban, A., Farajzadeh, M. A., Nemati, M., Raha, S., Gharamaleki, Y. V., et al. (2022). Combination of mixed mode dispersive solid phase extraction with magnetic ionic liquids based dispersive liquid–liquid microextraction for the extraction of anticoagulant drugs from urine samples. Microchem. J. 183, 108065. doi:10.1016/j.microc.2022.108065
Molino, A., Mehariya, S., Di Sanzo, G., Larocca, V., Martino, M., Leone, G. P., et al. (2020). Recent developments in supercritical fluid extraction of bioactive compounds from microalgae: Role of key parameters, technological achievements and challenges. J. CO2 Util. 36, 196–209. doi:10.1016/j.jcou.2019.11.014
Mondal, S., Xu, J., Chen, G., Huang, S., Huang, C., Yin, L., et al. (2019). Solid-phase microextraction of antibiotics from fish muscle by using MIL-101 (Cr) NH2-polyacrylonitrile fiber and their identification by liquid chromatography-tandem mass spectrometry. Anal. Chim. Acta. 1047, 62–70. doi:10.1016/j.aca.2018.09.060
Nandhini, N. T., Rajeshkumar, S., and Mythili, S. (2019). The possible mechanism of eco-friendly synthesized nanoparticles on hazardous dyes degradation. Biocatal. Agric. Biotechnol. 19, 101138. doi:10.1016/j.bcab.2019.101138
Naseem, T., and Durrani, T. (2021). The role of some important metal oxide nanoparticles for wastewater and antibacterial applications: A review. Environ. Chem. Ecotoxicol. 3, 59–75. doi:10.1016/j.enceco.2020.12.001
Navgare, D. L., Kawade, V. B., Tumberphale, U. B., Jadhav, S. S., Mane, R. S., and Gore, S. K. (2020). Superparamagnetic cobalt-substituted copper zinc ferrialuminate: synthesis, morphological, magnetic and dielectric properties investigation. J. Sol-Gel Sci. Technol. 93, 633–642. doi:10.1007/s10971-019-05106-z
Nemati, M., Farajzadeh, M. A., Altunay, N., Tuzen, M., Kaya, S., Maslov, M. M., et al. (2023). Combination of doped amorphous carbon based dispersive solid phase extraction with ionic liquid-based DLLME for the extraction of aromatic amines from leather industries wastewater; Theoretical and experimental insights. J. Mol. Struct. 1281, 135172. doi:10.1016/j.molstruc.2023.135172
Nemati, M., Tuzen, M., Farazajdeh, M. A., Kaya, S., and Mogaddam, M. R. A. (2022). Development of dispersive solid-liquid extraction method based on organic polymers followed by deep eutectic solvents elution; application in extraction of some pesticides from milk samples prior to their determination by HPLC-MS/MS. Anal. Chim. Acta. 1199, 339570. doi:10.1016/j.aca.2022.339570
Ngqwala, N. P., and Muchesa, P. (2020). Occurrence of pharmaceuticals in aquatic environments: A review and potential impacts in South Africa. S. Afr. J. Sci. 116 (7-8), 1–7. doi:10.17159/sajs.2020/5730
Onu, D. C., Babayemi, A. K., Egbosiuba, T. C., Okafor, B. O., Ani, I. J., Mustapha, S., et al. (2023). Isotherm, kinetics, thermodynamics, recyclability and mechanism of ultrasonic assisted adsorption of methylene blue and lead (II) ions using green synthesized nickel oxide nanoparticles. Environ. Nanotechnol. Monit. Manage. 20, 100818. doi:10.1016/j.enmm.2023.100818
Ozdemir, S., Kılınc, E., Yalcin, M. S., Soylak, M., and Sen, F. (2020). A new magnetized thermophilic bacteria to preconcentrate uranium and thorium from environmental samples through magnetic solid-phase extraction. J. Pharm. Biomed. Anal. 186, 113315. doi:10.1016/j.jpba.2020.113315
Pérez-Rodríguez, M., Pellerano, R. G., Pezza, L., and Pezza, H. R. (2018). An overview of the main foodstuff sample preparation technologies for tetracycline residue determination. Talanta 182, 1–21. doi:10.1016/j.talanta.2018.01.058
Pourabadeh, A., Baharinikoo, L., Shojaei, S., Mehdizadeh, B., Davoodabadi Farahani, M., and Shojaei, S. (2020). Experimental design and modelling of removal of dyes using nano-zero-valent iron: A simultaneous model. Int. J. Environ. Anal. Chem. 100 (15), 1707–1719. doi:10.1080/03067319.2019.1657855
Promoppatum, P., and Yao, S. C. (2020). Influence of scanning length and energy input on residual stress reduction in metal additive manufacturing: Numerical and experimental studies. J. Manuf. Process. 49, 247–259. doi:10.1016/j.jmapro.2019.11.020
Purabadeh, A., Mehdizadeh, B., Shojaei, S., Farahani, M. D., and Shojaei, S. (2022). Synthesis of zero-valent iron nanoparticles for ultrasonic assisted dye removal: Modeling and optimization. Iran. J. Public Health. 51 (2), 471–472. doi:10.18502/ijph.v51i2.8703
Qu, X., Brame, J., Li, Q., and Alvarez, P. J. (2013). Nanotechnology for a safe and sustainable water supply: Enabling integrated water treatment and reuse. Acc. Chem. Res. 46 (3), 834–843. doi:10.1021/ar300029v
Rajini, R., and Ferdinand, A. C. (2022). Structural, morphological and magnetic properties of (c-ZnFe2O4 and t-CuFe2O4) ferrite nanoparticle synthesized by reactive ball milling. Chem. Data Collect. 38, 100825. doi:10.1016/j.cdc.2021.100825
Roosta, M., Ghaedi, M., and Asfaram, A. (2015). Simultaneous ultrasonic-assisted removal of malachite green and safranin O by copper nanowires loaded on activated carbon: Central composite design optimization. RSC Adv. 5 (70), 57021–57029. doi:10.1039/c5ra03519h
Rowland, C. E., Brown, C. W., Delehanty, J. B., and Medintz, I. L. (2016). Nanomaterial-based sensors for the detection of biological threat agents. Mater. Today. 19 (8), 464–477. doi:10.1016/j.mattod.2016.02.018
Shojaei, S., Nouri, A., Baharinikoo, L., Farahani, M. D., and Shojaei, S. (2021a). Removal of the hazardous dyes through adsorption over nanozeolite-X: Simultaneous model, design and analysis of experiments. Polyhedron 196, 114995. doi:10.1016/j.poly.2020.114995
Shojaei, S., Shojaei, S., Nouri, A., and Baharinikoo, L. (2021b). Application of chemometrics for modeling and optimization of ultrasound-assisted dispersive liquid–liquid microextraction for the simultaneous determination of dyes. NPJ Clean. Water 4 (1), 23. doi:10.1038/s41545-021-00113-6
Taghizadeh, M., Ebrahimi, M., Fooladi, E., and Yoosefian, M. (2022). Preconcentration and determination of five antidepressants from human milk and urine samples by stir bar filled magnetic ionic liquids using liquid–liquid–liquid microextraction-high-performance liquid chromatography. J. Sep. Sci. 45 (8), 1434–1444. doi:10.1002/jssc.202100617
Tao, L., Chen, Y., Wang, Y., Zhang, N., Li, S., Yang, Y., et al. (2022). Optimization of hydrophilic SiO2/SDS dispersions in decentralized system: Experiments and RSM/CCD. J. Nanopart. Res. 24 (7), 138. doi:10.1007/s11051-022-05521-4
Tao, Y., Liu, J. F., Hu, X. L., Li, H. C., Wang, T., and Jiang, G. B. (2009). Hollow fiber supported ionic liquid membrane microextraction for determination of sulfonamides in environmental water samples by high-performance liquid chromatography. J. Chromatogr. A 1216 (35), 6259–6266. doi:10.1016/j.chroma.2009.06.025
Tolmacheva, V. V., Apyari, V. V., Furletov, A. A., Dmitrienko, S. G., and Zolotov, Y. A. (2016). Facile synthesis of magnetic hypercrosslinked polystyrene and its application in the magnetic solid-phase extraction of sulfonamides from water and milk samples before their HPLC determination. Talanta 152, 203–210. doi:10.1016/j.talanta.2016.02.010
Tong, M., Li, X., Luo, Q., Yang, C., Lou, W., Liu, H., et al. (2020). Effects of humic acids on biotoxicity of tetracycline to microalgae Coelastrella sp. Algal Res. 50, 101962. doi:10.1016/j.algal.2020.101962
Uko, C. A., Tijani, J. O., Abdulkareem, S. A., Mustapha, S., Egbosiuba, T. C., and Muzenda, E. (2022). Adsorptive properties of MgO/WO3 nanoadsorbent for selected heavy metals removal from indigenous dyeing wastewater. Process Saf. Environ. Prot. 162, 775–794. doi:10.1016/j.psep.2022.04.057
Uwineza, P. A., and Waśkiewicz, A. (2020). Recent advances in supercritical fluid extraction of natural bioactive compounds from natural plant materials. Molecules 25 (17), 3847. doi:10.3390/molecules25173847
Wu, K., Li, J., and Zhang, C. (2019). Zinc ferrite based gas sensors: A review. Ceram. Int. 45 (9), 11143–11157. doi:10.1016/j.ceramint.2019.03.086
Xie, X., Wang, Y., Han, J., and Yan, Y. (2011). Extraction mechanism of sulfamethoxazole in water samples using aqueous two-phase systems of poly (propylene glycol) and salt. Anal. Chim. Acta. 687 (1), 61–66. doi:10.1016/j.aca.2010.12.012
Xing, H., Yang, F., Sun, S., Pan, P., Wang, H., Wang, Y., et al. (2022). Green efficient ultrasonic-assisted extraction of abalone nacre water-soluble organic matrix for bioinspired enamel remineralization. Colloids Sur., B 212, 112336. doi:10.1016/j.colsurfb.2022.112336
Xiong, W., Sun, Y., Ding, X., Zhang, Y., and Zeng, Z. (2014). Antibiotic resistance genes occurrence and bacterial community composition in the Liuxi River. Front." Environ. Sci. 2, 61. doi:10.3389/fenvs.2014.00061
Xu, S., Liang, M., Ding, Y., Wang, D., Zhu, Y., and Han, L. (2021). Synthesis, optical characterization, and adsorption of novel hexavalent chromium and total chromium sorbent: A fabrication of mulberry stem biochar/Mn-Fe binary oxide composite via response surface methodology. Front." Environ. Chem. 2, 692810. doi:10.3389/fenvc.2021.692810
Xu, X., Su, R., Zhao, X., Liu, Z., Zhang, Y., Li, D., et al. (2011). Ionic liquid-based microwave-assisted dispersive liquid–liquid microextraction and derivatization of sulfonamides in river water, honey, milk, and animal plasma. Anal. Chim. Acta. 707 (1-2), 92–99. doi:10.1016/j.aca.2011.09.018
Yahyaeian, M., Zeraatkar Moghaddam, A., and Fooladi, E. (2023). Use of efficient and low-cost trimetallic based on zero-valent iron, immobilized on bentonite surface to remove sunset yellow and tartrazine dyes using response surface optimization method. Water, Air, Soil Pollut. 234 (2), 79. doi:10.1007/s11270-022-06018-5
Yang, J., Shojaei, S., and Shojaei, S. (2022). Removal of drug and dye from aqueous solutions by graphene oxide: Adsorption studies and chemometrics methods. NPJ Clean. Water 5 (1), 5. doi:10.1038/s41545-022-00148-3
Zahra, Q. U. A., Luo, Z., Ali, R., Khan, M. I., Li, F., and Qiu, B. (2021). Advances in gold nanoparticles-based colorimetric aptasensors for the detection of antibiotics: An overview of the past decade. Nanomaterials 11 (4), 840. doi:10.3390/nano11040840
Zhang, Q., He, D., Li, X., Feng, W., Lyu, C., and Zhang, Y. (2020). Mechanism and performance of singlet oxygen dominated peroxymonosulfate activation on CoOOH nanoparticles for 2, 4-dichlorophenol degradation in water. J. Hazard. Mater. 384, 121350. doi:10.1016/j.jhazmat.2019.121350
Zhou, Q., and Fang, Z. (2015). Highly sensitive determination of sulfonamides in environmental water samples by sodium dodecylbenzene sulfonate enhanced micro-solid phase extraction combined with high performance liquid chromatography. Talanta 141, 170–174. doi:10.1016/j.talanta.2015.04.016
Keywords: dispersive liquid-liquid microextraction, dispersive solid-phase microextraction, response surface methodology, sulfamethoxazole, ultrasonic-assisted extraction (UAE)
Citation: Amin IS, Neysari AN, Althomali RH, Musad Saleh EA, Baymakov S, Radie Alawady AH, Hashiem Alsaalamy A, Ramadan MF and Juyal A (2023) Development of microextraction methods for the determination of sulfamethoxazole in water and biological samples: modelling, optimization and verification by central composite design. Front. Environ. Sci. 11:1242730. doi: 10.3389/fenvs.2023.1242730
Received: 19 June 2023; Accepted: 11 August 2023;
Published: 21 August 2023.
Edited by:
Fidelis O. Ajibade, Federal University of Technology, NigeriaReviewed by:
Titus Egbosiuba, Chukwuemeka Odumegwu Ojukwu University, NigeriaEbrahim Fooladi, Research Institute of Food Science and Technology (RIFST), Iran
Jogendra Singh, Gurukul Kangri University, India
Copyright © 2023 Amin, Neysari, Althomali, Musad Saleh, Baymakov, Radie Alawady, Hashiem Alsaalamy, Ramadan and Juyal. This is an open-access article distributed under the terms of the Creative Commons Attribution License (CC BY). The use, distribution or reproduction in other forums is permitted, provided the original author(s) and the copyright owner(s) are credited and that the original publication in this journal is cited, in accordance with accepted academic practice. No use, distribution or reproduction is permitted which does not comply with these terms.
*Correspondence: Ali Naser Neysari, bmV5c2FyaWFsaW5hc2VyQGdtYWlsLmNvbQ==