 Erdinc Balli
 Orhan Cengiz
 Ayse Ipek Koca Balli3
- 1Department of Tourism Management, School of Tourism and Hotel Management, Cukurova University, Adana, Türkiye
- 2Department of Accounting and Taxation, Pozanti Vocational School, Cukurova University, Adana, Türkiye
- 3Department of Business Administration, Faculty of Kozan Business Administration, Cukurova University, Adana, Türkiye
This study aims to investigate the relationship between tourism development, renewable energy consumption (REN), research and development (R&D) expenditure, and CO2 emissions in 12 emerging markets and middle-income Europe spanning 1999–2020. We applied the panel autoregressive distributed lag and the Driscoll–Kraay estimator to determine the relationship between variables. According to both estimators’ results, a U-shaped relationship exists between economic growth and CO2 emissions. This result indicates that the environmental Kuznets curve hypothesis is invalid in these countries. Furthermore, REN and R&D contribute to decreasing CO2 emissions and stimulating sustainable development. However, the impact of tourism development on CO2 emissions is found to be negative in panel autoregressive distributed lag but positive in the Driscoll and Kraay estimator for fixed and random effects. Moreover, the Dumitrescu and Hurlin panel causality test reveals a two-way causal relationship between R&D and CO2 emissions and a one-way causal linkage running from economic growth, the square of economic growth, and tourist arrival to CO2 emissions. Overall, our results prove the existence of a relationship between international tourism and CO2 emissions. Furthermore, our results suggest some policy recommendations for policymakers to reduce CO2 emissions through REN, R&D, green economic development, and establishing an ecologically friendly tourism policy.
1 Introduction
There is great attention to environmental degradation and climate change as global problems, and combating climate change has become a crucial target for global society (Olejnik and Sobiecka, 2017; Fernandez et al., 2018; Bilgili et al., 2021). Due to economic activities, different types of greenhouse gas (GHG) emissions, including CO2 emissions, are released into the atmosphere (Iqbal et al., 2022). Therefore, a consensus exists that CO2 emissions are one of the driving forces of climate change (Adebayo, 2020; Mlaskawa, 2022). In line with this issue, recent data show that global energy-related CO2 emissions were 31.5 Gt, approximately 50% higher than the industrial revolution in 2021. In addition, CO2 emissions caused by oil exceeded 650 Mt CO2 in 2021 (IEA, 2021). As the Intergovernmental Panel on Climate Change [IPCC] (2018) points out, global warming will reach 1.5°C during 2030–2052 if current global activities continue. Since the devastating impact of CO2 emissions on climate change and environmental degradation has reached a dramatic level, many countries have strived to improve policies regarding reducing CO2 emissions. As a result, global society has paid attention to overcoming this problem. For example, Kyoto Protocol and Paris Agreement initiatives have been adopted to achieve environmental quality and sustainable development by reducing dependency on non-renewable energy sources that cause environmental problems (Guo et al., 2023).
In the relevant literature, environmental degradation is investigated in the context of the environmental Kuznets curve (EKC) hypothesis, which represents that economic growth initially causes an increase in pollution and lately decreases environmental degradation. The EKC hypothesis originated in the work of Kuznets (1955). In his study, Kuznets focused on the relationship between income inequality and economic growth and provided that along with economic growth, as per capita income increases, income inequality increases in the early stages of development, but it declines after a certain threshold income level. This relationship is called the Kuznets (1955) hypothesis and indicates an inverted U-shaped relationship between economic development and income inequality. Furthermore, following the pioneer study of Grossman and Krueger (1991), the Kuznets (1955) hypothesis is adapted to the EKC hypothesis, and it is expected that as income level increases, environmental degradation increases in the early stages, but after the threshold level, environmental degradation decreases. As depicted in Figure 1, the EKC hypothesis displays an inverted U-shaped relationship between income level and environmental degradation (Shafik and Bandyopadhyay, 1992; Panayotou, 1993; Dinda, 2004; Yilanci and Pata, 2020; Onifade, 2022).
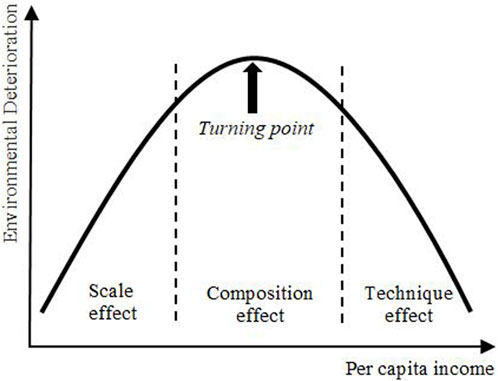
FIGURE 1. Graphical representation of the EKC hypothesis (Murshed and Dao, 2022).
As depicted in Figure 1, the inverted U-shaped portrayal of the EKC hypothesis consists of scale, composition, and technical effects (Beyene, 2023; Uche et al., 2023). The scale effect means that in the early stage of income growth, the economy’s production capacity increases, and primary energy consumption, including fossil fuels, increases. Hence, the environment is negatively affected by the increase in the scale of production (Pata, Kartal, Erdogan, and Sarkodie, 2023). The composition effect refers to the fact that during economic growth, the economy’s structure shifts from agricultural to industrial, increasing environmental degradation. Furthermore, the pollution level decreases since the economic structure moves from industry to the service sector (Adeel-Farooq et al., 2020). Finally, the technical effect characterizes replacing traditional production methods with technology-intensive ones. So, green technologies are used in production, and economic productivity increases with technological improvement. Hence, environmental pollution decreases (Sarkodie, 2018; Adeel-Farooq et al., 2020; Pata et al., 2023a).
Therefore, after the seminal work of Grossman and Krueger (1991), a vast body of literature has emerged investigating the validity of the EKC hypothesis. Researchers have studied the nexus between income and environmental pollution in different sectors. For instance, agriculture (Mahmood et al., 2019; Liu et al., 2021; Selcuk et al., 2021; Atasel et al., 2022; Ntim-Amo et al., 2022; Selvanathan et al., 2023), industry (Mahmood et al., 2020; Jadoon et al., 2021; Luan et al., 2022; Ullah et al., 2022), and the service sector (Hashmi et al., 2020; Murshed et al., 2020; Yassin and Aralas, 2020; Karthikeyan and Murugesan, 2022; Ali et al., 2023) are considered crucial factors influencing environmental pollution. In this context, economic activities are closely linked to an environmental issue. As one of the vital sectors for economic growth, the role of the tourism sector is crucial for many countries. Tourism contributes remarkably to economies and is one of the driving forces of economic development (De Vita et al., 2015; Danish, 2018). According to the World Travel and Tourism Council (2022), travel and tourism activities’ contribution to world economic growth was US$ 5.8 trillion in 2021, accounting for 6.1% of global GDP. Furthermore, the travel and tourism sector created 333 million jobs in 2019 worldwide. However, the employment effect of the travel and tourism sector declined to 271 million, resulting in a loss of 62 million jobs in 2020 due to the COVID-19 crisis. Nevertheless, the contribution to global employment increased to 289 million, representing 9% of global employment in 2021. As experienced in the post-COVID-19 pandemic period, the tourism sector should be handled within a new model prioritizing sustainability. Therefore, sustainability policies for tourism should be developed to reflect the objectives of all stakeholders, such as public authorities, the tourism sector, non-governmental organizations, regional and local unions, and international organizations.
The tourism sector profoundly influences economic growth by creating employment, increasing foreign exchange savings, accelerating the mobility of people, stimulating financial inflow, and expanding government revenue (Bekun et al., 2022; Hussain et al., 2022). Based on this background, there is a large body of empirical studies on the relationship between tourism and economic development (Ivanov and Webster, 2007; Manzoor et al., 2019; Brida et al., 2020; Fuinhas et al., 2020; Adedoyin et al., 2021; Rasool et al., 2021). While most countries realized economic growth due to development in the tourism sector (Khan et al., 2023), it is responsible for increasing environmental degradation by causing CO2 emissions. The tourism industry is forecasted to cause 11% of worldwide greenhouse gas (GHG) emissions, and it is expected to increase two-fold by the year 2050 (Peeters and Papp, 2023). There are several ways the tourism industry affects environmental quality. For example, the tourism sector requires places to use and construct hotels that can deploy natural resources. In addition, the increasing population with tourist arrivals exaggerates environmental problems (Destek and Aydın, 2022). Apart from the negative impact of tourism on environmental quality, there is also a positive effect on the environment. Development in tourism may encourage people to protect destination countries’ national heritages and legacies, increase social networks, and be aware of preserving the environment (Rahman et al., 2022a), and it also promotes infrastructure quality (Guan et al., 2022). Tourism allows for social and cultural exchange between different societies, which can lead to changes in the social network (Singgalen et al., 2023). This interaction enables local people to learn to become more environmentally conscious from tourists.
The United Nations’ Sustainable Development Goals (SDGs) are core factors in enhancing sustainable development and promoting responsible and sustainable tourism. In the scope of the 2030 Agenda of the United Nations for SDGs, the World Tourism Organization emphasizes the importance of tourism as “tourism that takes full account of its current and future economic, social and environmental impacts, addressing the needs of visitors, the industry, the environment and host communities” (World Tourism Organization, 2023). Thus, it is evident that tourism has a substantial effect on 17 SDGs, directly or indirectly (Tian et al., 2021). Tourism and sustainable development have a complementary relationship.
Investigating the relationship between environmental degradation and the tourism sector has been crucial in studies over the last decade. This relationship is analyzed in the EKC hypothesis framework. Based on the seminal work of Grossman and Krueger (1991), the EKC hypothesis states an inverted U-shaped relationship between economic growth and environmental degradation, indicating that as economic development increases, environmental degradation rises to a point. After the threshold level, it starts to decline (Alola and Ozturk, 2021; He et al., 2022a). Hence, a plethora of literature is available to check the validity of the EKC hypothesis for different countries (Dogan and Inglesi-Lotz, 2020; Pata and Caglar, 2021; Murshed and Dao, 2022; Onifade, 2022; Pata and Samour, 2022; Massagony and Budiono, 2023). Furthermore, R&D as one of the crucial determinants of environmental quality is less explored in the literature. However, R&D is closely linked with environmental quality (Han et al., 2023). Expanding R&D activities triggers technological innovation in the energy sector and improves energy efficiency. Moreover, along with R&D, improvement in technological innovation promotes REN instead of non-renewable energy (Erdogan, 2021). Hence, it is expected that R&D will positively affect environmental quality. Moreover, REN plays a crucial role in decreasing CO2 emissions (Awan et al., 2022). It offers an alternative to non-renewable energy sources, such as fossil fuels and coal, that cause environmental degradation (Akar, 2016; Yu et al., 2022). Therefore, the transition to renewable energy can improve environmental quality by reducing CO2 emissions (Jena et al., 2022; Shah et al., 2022). In addition to the direct links between tourism development and environmental degradation, this association still needs investigation by controlling other factors affecting CO2 emissions. In the research line, this work aims to analyze the impact of tourism development on CO2 emissions by controlling the influence of REN and R&D, focusing on 12 emerging markets and middle-income European countries, including Azerbaijan, Belarus, Bulgaria, Croatia, Hungary, Kazakhstan, North Macedonia, Poland, Romania, Russia, Turkey, and Ukraine, using annual data covering 1999–2020. The countries were chosen for two significant reasons. First, they have shown considerable economic growth over the past few decades. In 1995, they produced over $1.6 trillion in GDP, and their GDP level has since increased by approximately $4 trillion in 2021 (World Bank, 2023). Furthermore, these countries had adopted policies to liberalize their economies and integrate with the world economy, resulting in vulnerable geopolitics and external shocks. Hence, to preserve the adverse effects of integration, they require sufficient international reserves. Therefore, tourism becomes a vital way to obtain international reserves. Second, the International Monetary Fund (IMF) classifies emerging markets and middle-income countries by region. We chose emerging markets and middle-income countries in Europe as a sample because these countries have significant international tourist arrivals from other regions. For example, these countries hosted approximately 350 million tourists in 2019, representing approximately 15% of world international tourist arrivals (World Bank, 2023). In addition, these countries have remarkable potential for tourism revenue. According to the World Bank (2023), they received over $115 billion in 2019. Furthermore, these countries have tried to implement structural reform, but tourism is still a key sector in the development process. Thus, economic growth keeps its priority, and the environment is ignored on behalf of economic growth.
Figure 2 indicates the CO2 emissions per capita in the panel sample of our analyses. It shows us that trends in CO2 emissions per capita follow an identical and stable pattern in most countries. However, the trends in Kazakhstan, Russia, and Poland are different, and they released more CO2 emissions compared to other countries. Moreover, from Figure 3, it can be seen that Poland, Croatia, Hungary, Turkey, and Russia had an upward trend in tourist arrivals in the last decade, except in 2020. The rest of the countries have a stable trend. Due to the COVID-19 pandemic, the tourism sector has been negatively affected worldwide, but it has recovered progressively to catch up to a pre-pandemic level (World Tourism Organization, 2023).
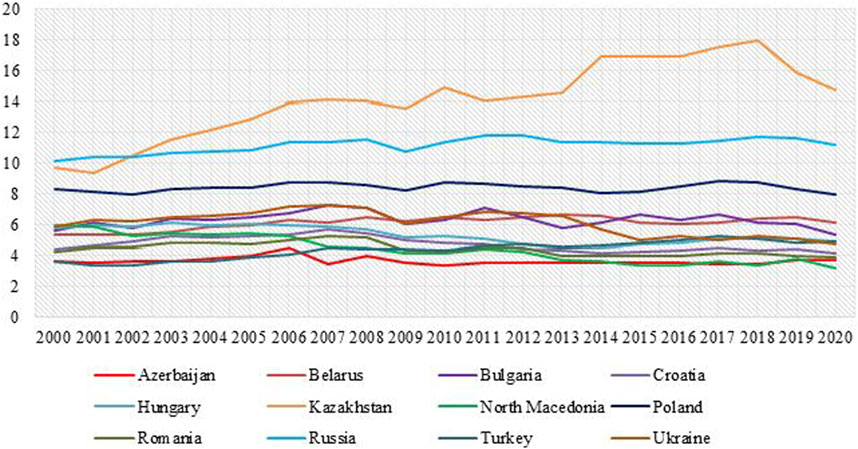
FIGURE 2. CO2 emissions per capita by country (Our World in Data, 2023).
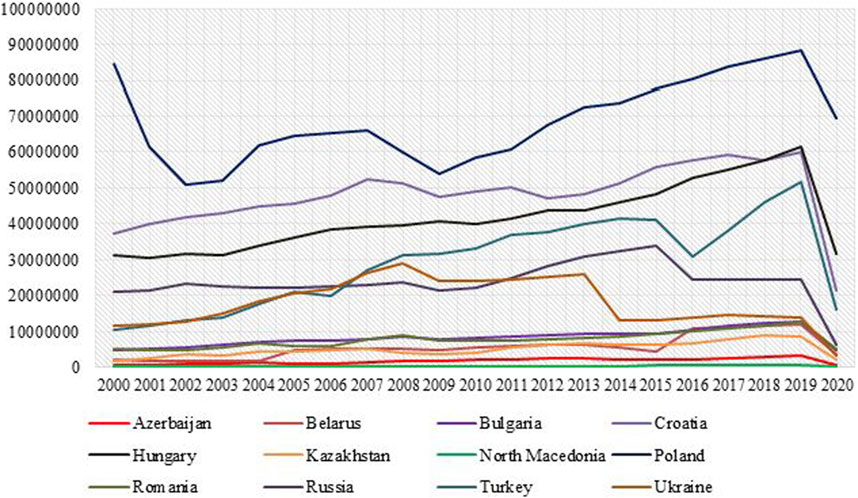
FIGURE 3. Number of international tourist arrivals (World Bank, 2023).
One of the most crucial tools to achieve sustainable development is innovation. Based on endogenous growth models, R&D activities contribute to economic growth by enhancing technological improvement and innovation (Fernandez et al., 2018). Figure 4 shows that R&D is remarkable in the panel sample countries. Remarkably, Hungary, Poland, Croatia, Russia, and Bulgaria have continuously increased their paths in R&D during 2000–2020. On the contrary, Azerbaijan and Kazakhstan have a relatively decreasing trend. Due to the global financial crisis, R&D has fluctuated in most countries. In addition to promoting economic growth, R&D also positively affects environmental quality by fostering technological advancement in the environmentally friendly energy sector (Kihombo et al., 2021). The increase in REN is essential to reducing CO2 emissions. The energy transition from traditional sources to renewables is important in combating environmental degradation. As shown in Figure 5, per capita energy consumption from renewables in panel sample countries has an increasing trend, except in Azerbaijan and Belarus. The highest REN belongs to Croatia, followed by Russia, Turkey, Romania, Bulgaria, and Poland. Furthermore, Belarus has the lowest value among these countries.
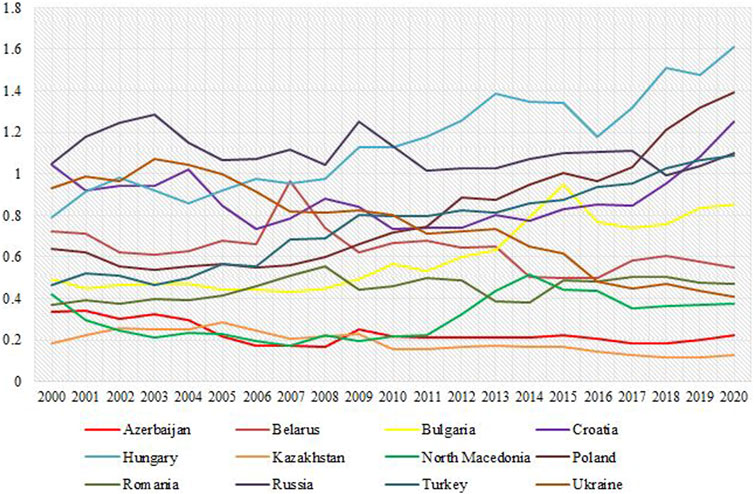
FIGURE 4. R&D expenditure (% of GDP) (World Bank, 2023).
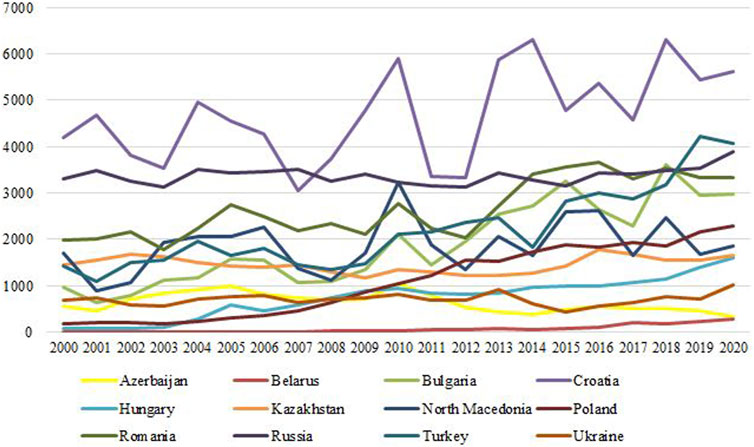
FIGURE 5. Per capita energy consumption from renewables (Our World in Data, 2023).
Relying on these aforementioned features, the key issue is whether there is a connection between tourism growth, R&D, REN, and CO2 emissions in emerging markets and middle-income Europe. One of the characteristic features of these countries is that they are shifting from low- to middle-income status by focusing on industrial activities. However, industrialization puts pressure on the environment in these nations (Hove and Tursoy, 2019). Hence, our study adds to the empirical literature in the following ways: 1) to the best of our knowledge, this is the first study that examines the relationship between tourism development and CO2 emissions for a panel sample of 12 emerging markets and middle-income European countries; 2) we observe the role of REN and R&D on CO2 emissions. The prior empirical studies that research the association between tourism development and environmental degradation ignore the potential role of R&D on CO2 emissions; and 3) in addition to panel ARDL methodology, we performed the Driscoll–Kraay estimator, which is robust to autocorrelation, heteroscedasticity, and cross-sectional dependence.
The remainder of this study is organized as follows: Section 2 briefly reviews the empirical literature on the relationship between CO2 emissions and independent variables. Section 3 offers data, model, and empirical methodology. Section 4 presents the empirical results and discussion, and Section 5 deals with the conclusion and policy recommendations.
2 Literature review
The relationship between economic growth and environmental degradation is complex. Thus, following the seminal work of Grossman and Kreuger (1991), environmental degradation has become a crucial topic, and a large body of literature has emerged that focuses on the determinants of environmental degradation by considering different indicators, samples, and methodology. Zeraibi et al. (2022) tested the EKC hypothesis using government expenditure and money supply in China from 1980 to 2018. The empirical results indicate that the EKC hypothesis does not hold and that an N-shaped relationship exists between economic growth and environmental degradation. Bandyopadhyay and Rej (2021) researched the validity of the EKC hypothesis in India with annual data for 1978–2019 by controlling the effect of FDI, nuclear energy consumption, and trade openness. The empirical results revealed an inverted N shape exists instead of an inverted U-shaped portrayal. Saqib et al. (2022) examined the validity of the EKC hypothesis for the panel sample of E−7 countries by considering the effect of human development, REN, and patents. They found that the EKC hypothesis exists in these countries. Al-Mulali et al. (2022) examined the EKC hypothesis for the panel group of 170 countries during 2010–2018 and concluded that the EKC hypothesis is valid. Pata and Kartal (2023) tested both the EKC and load capacity curve (LCC) hypotheses in South Korea by using data from 1977 to 2018 and investigating the role of renewable and nuclear energy consumption. They confirmed the validity of the EKC and LCC hypotheses. Another investigation conducted by Genç et al. (2022) studied the EKC hypothesis in Turkey over the period 1980–2015 and considered the effect of the volatility of economic growth and energy consumption. They demonstrated that the EKC hypothesis is valid, indicating an inverted U-shaped relationship between economic growth and environmental degradation. Aydin et al. (2023) analyzed the EKC hypothesis for the panel sample of G7 countries spanning 1990–2018 by considering the effects of nanotechnology and REN. The empirical outcomes pointed out that the EKC hypothesis holds only in the United States. In most studies, the validation of the EKC is confirmed for different countries/country groups (Ntim-Amo et al. (2022) for Ghana; Mahmood (2023) for Latin America; Voumik et al. (2023) for BRICS countries; Kostakis et al. (2023) for MENA countries; and Murshed et al. (2022) for South Asian countries).
In contrast, it must be noted that there is no consensus about the validity of the EKC hypothesis. For instance, Pata and Yurtkuran (2023) showed that the EKC hypothesis is valid only for Switzerland and Denmark but not for the Netherlands, Sweden, and Austria. In the case of the top 10 innovative economies, Gormus and Aydin (2020) documented that the EKC hypothesis exists only in Israel. Hossain et al. (2023) verified the N-shaped relationship for the case of CO2 emissions but did not confirm it for the case of ecological footprint in India. Pata and Tanriover (2023) tested the EKC and LCC hypotheses for the top ten tourism destinations and concluded that both are invalid in these countries. It is seen that the EKC hypothesis is researched with different indicators. The previously summarized studies show that the validity of the EKC hypothesis differs by sample, method, and variable. Thus, first, we propose Hypothesis 1 in terms of the validity of the EKC.
Hypothesis 1:. The EKC hypothesis is valid in our panel sample countries.
In order to examine the determining factors of environmental degradation, the tourism sector is nowadays one of the most crucial and controversial issues for countries. Hence, a large body of literature examines the validity of the EKC hypothesis and the impact of tourism development on environmental degradation. For instance, Villanthenkodath et al. (2022) reported that tourism development causes an increase in environmental degradation in India. Usman et al. (2022) documented that tourism development increases CO2 emissions in South Asian economies. Destek and Aydın (2022) found that although tourism contributes to economic growth, it also damages environmental quality in the 10 top visited countries. Fethi and Senyucel (2021) investigated the impact of tourism on CO2 emissions using panel data from the top 50 tourism destination nations. They concluded that tourism exaggerates environmental degradation. Kumail et al. (2020) studied the relationship between CO2 emissions, tourism, technological improvement, and economic growth with time series data for Pakistan from 1990 to 2017. The empirical findings indicate that tourism harms environmental quality. Isik et al. (2020) tested the tourism-induced EKC hypothesis for G-7 countries from 1995 to 2015. The augmented mean group (AMG) estimator results show that the EKC hypothesis is valid in France. Furthermore, tourism positively affects CO2 emissions in Italy and negatively in Canada. Alola et al. (2020) investigated the effect of energy imports by considering the role of international tourism development in coastline Mediterranean countries (CMCs) spanning 1995–2013. They reported that although tourism receipts are negatively associated with CO2 emissions, international tourist arrivals are positively related to CO2 emissions. Zha et al. (2020) experimented with the connection between tourism and environmental quality in Chinese provinces during 2005–2016 using a decomposition technique. They reported that the scale effect of tourism is the main contributing factor to CO2 emissions. However, the technical effect has a remarkable impact on reducing CO2 emissions. Similar outcomes are also documented by Rahman et al. (2022b) for Malaysia, Salahodjaev et al. (2022) for Europe and Central Asia, Cevik (2023) for 15 Caribbean countries, Guan et al. (2022) for G-10 countries, Balsalobre-Lorente et al. (2023) for 36 OECD countries, and Satrovic and Adedoyin (2023) for Southeastern Europe countries. The positive impact of tourism on environmental degradation verifies that as the tourism sector develops, usage of energy consumption, natural resources, and depletion of biocapacity increases (Guan et al., 2022). On the other hand, another perspective on the relationship between tourism development and environmental degradation points out that tourism contributes to developing environmental quality. In this framework, Ghosh et al. (2022) researched the effect of economic complexity and tourism development on environmental degradation in G7 countries and showed that tourism development decreases environmental degradation. Ohajionu et al. (2022) observed that tourism development is negatively associated with CO2 emissions in Mediterranean countries. Wei and Lihua (2023) concluded that tourism arrivals reduce CO2 emissions in ASEAN countries. Wei and Ullah (2022) demonstrated that tourism development has a negative impact on CO2 emissions in Asian economies. Furthermore, Isaeva et al. (2022) assessed a one-way causal relationship running from tourism to CO2 emissions in post-communist countries. Empirical studies show no consensus on the impact of tourism development on environmental degradation. Thus, we propose Hypothesis 2.
Hypothesis 2:. Tourism increases CO2 emissions in our panel sample countries.
REN is the primary aim of the SDGs. In order to achieve the increasing utilization of REN, most countries struggle to develop new policies. Furthermore, the relevant literature clearly defines and verifies that REN is negatively associated with environmental degradation. In this context, Magazzino et al. (2022) studied the relationship between REN, CO2 emissions, and GDP in Scandinavian countries and revealed that REN has a negative impact on CO2 emissions. Dagar et al. (2022) investigated the determinants of the ecological footprint in 38 OECD countries and concluded that REN negatively affects the ecological footprint. Suki et al. (2022) scrutinized the effect of REN and technological innovation on environmental degradation in Malaysia. The authors’ results show that both variables have a negative impact on environmental degradation. Another study conducted by Miao et al. (2022) examined the effect of REN and globalization on the ecological footprint in newly industrialized countries and approved that REN reduces the ecological footprint. In a recent study, Shah et al. (2023) researched the determinants of pollution in Japan with quarterly data covering the period 1970Q1–2019Q4. They found that the impact of FDI, economic growth, REN, economic complexity, and trade differs by quantiles. Economic complexity, economic growth, FDI, and trade positively affect CO2 emissions. REN has a negative effect on CO2 emissions in the 0.60–0.90 quantiles and a positive impact in the 0.95 quantile. In addition, some studies [Chien (2022) for N-11 economies; He et al. (2022b) for China; Shang et al. (2022) for ASEAN countries; Wang et al. (2022) for G-7; Awosusi et al. (2022) for Colombia; and Raihan et al. (2023) for Indonesia] explored the negative impact of REN on environmental degradation. In line with empirical approaches, we expected the negative effect of REN on CO2 emissions and proposed Hypothesis 3.
Hypothesis 3:. REN decreases CO2 emissions in our panel sample countries.
As previously discussed, R&D is an essential component of economic growth and technological improvement and is closely associated with REN. Since R&D activities develop in the economy, specifically in the energy-related sector, energy efficiency and opportunities for REN sources also increase. Hence, R&D does not only promote economic growth but also contributes to environmental quality. Several studies have reported that R&D positively impacts environmental quality. Mehmood et al. (2022) examined the association between renewable and non-renewable energy, R&D, economic growth, and environmental degradation in ASEAN countries spanning 1990–2016. The FMOLS and DOLS results indicate that R&D contributes to a decreased ecological footprint. Shahzadi et al. (2022) investigated the causal relationship between R&D, REN, forest area, and GHG emissions for 17 developed and 23 developing economies over 1995–2018. The causality test results verify the feedback causality between total patents and GHG emissions and one-way relationship between GHG emissions and R&D in developed countries. In addition, a one-way causal relationship exists between GHG emissions and total patents in developing countries. Kihombo et al. (2021) analyzed the effect of R&D, financial development, and environmental deterioration in West Asia and Middle East countries between 1990 and 2017. The empirical outcomes confirm that R&D lowers CO2 emissions. Another study conducted by Koçak and Ulucak (2019) revealed that there is no meaningful relationship between energy-related R&D and CO2 emissions in the 19 high-income economies of the OECD. Cheng et al. (2021) applied the panel quantile regression method to observe the role of technological innovation on CO2 emissions for the panel sample of the 35 OECD member countries from 1996 to 2015. The authors used patent development as a proxy for technological innovation. The empirical findings show that overall technological innovation negatively affects CO2 emissions, but the impacts differ across quantiles. Alam et al. (2019) examined the effects of corporate R&D investment on environmental deterioration in G-6 countries through firm-level data covering 2004–2016. The authors’ empirical findings suggest that R&D investment positively affects environmental quality. Godil et al. (2021) utilized the QARDL method to analyze the effect of R&D, globalization, institutional governance, financial development, and energy consumption on energy utilization in the case of India. The quarterly data analysis is performed, and the results show that R&D negatively affects energy utilization. Sinha et al. (2020) used the technological progress index and R&D indicators as proxies for technological innovation to reveal the potential long-run relationship between technological innovation and environmental quality in N-11 countries. The empirical results indicate that technological development harms environmental quality by causing pollution. According to empirical analysis results studied by Ullah et al. (2021), patents and trademarks do not significantly affect CO2 emissions in the long run, but negative shocks in patents cause a decrease in environmental quality in Pakistan. The important part of the empirical studies demonstrates that R&D has a negative impact on environmental degradation. Therefore, we propose Hypothesis 4 on the impact of R&D on CO2 emissions.
Hypothesis 4:. R&D decreases CO2 emissions in our panel sample countries.
The summary of the validity of the EKC hypothesis and how tourism development, R&D, and REN influence environmental degradation is provided in Table 1. As shown in Table 1, it is clear that the relationship between tourism development and environmental degradation is not clearly defined. Hence, it requires more empirical findings regarding the relationship between tourism development and environmental degradation. Moreover, tourism is a dynamic sector, and well-developed tourism destinations are needed for more energy consumption and technology usage. Based on these, to the best of our knowledge, the studies on the nexus between tourism development and environmental degradation ignore the role of R&D and REN simultaneously. Hence, to fill this gap, this study aims to investigate the relationship between tourism development and environmental degradation by controlling the role of R&D and REN in 12 emerging markets and middle-income Europe.
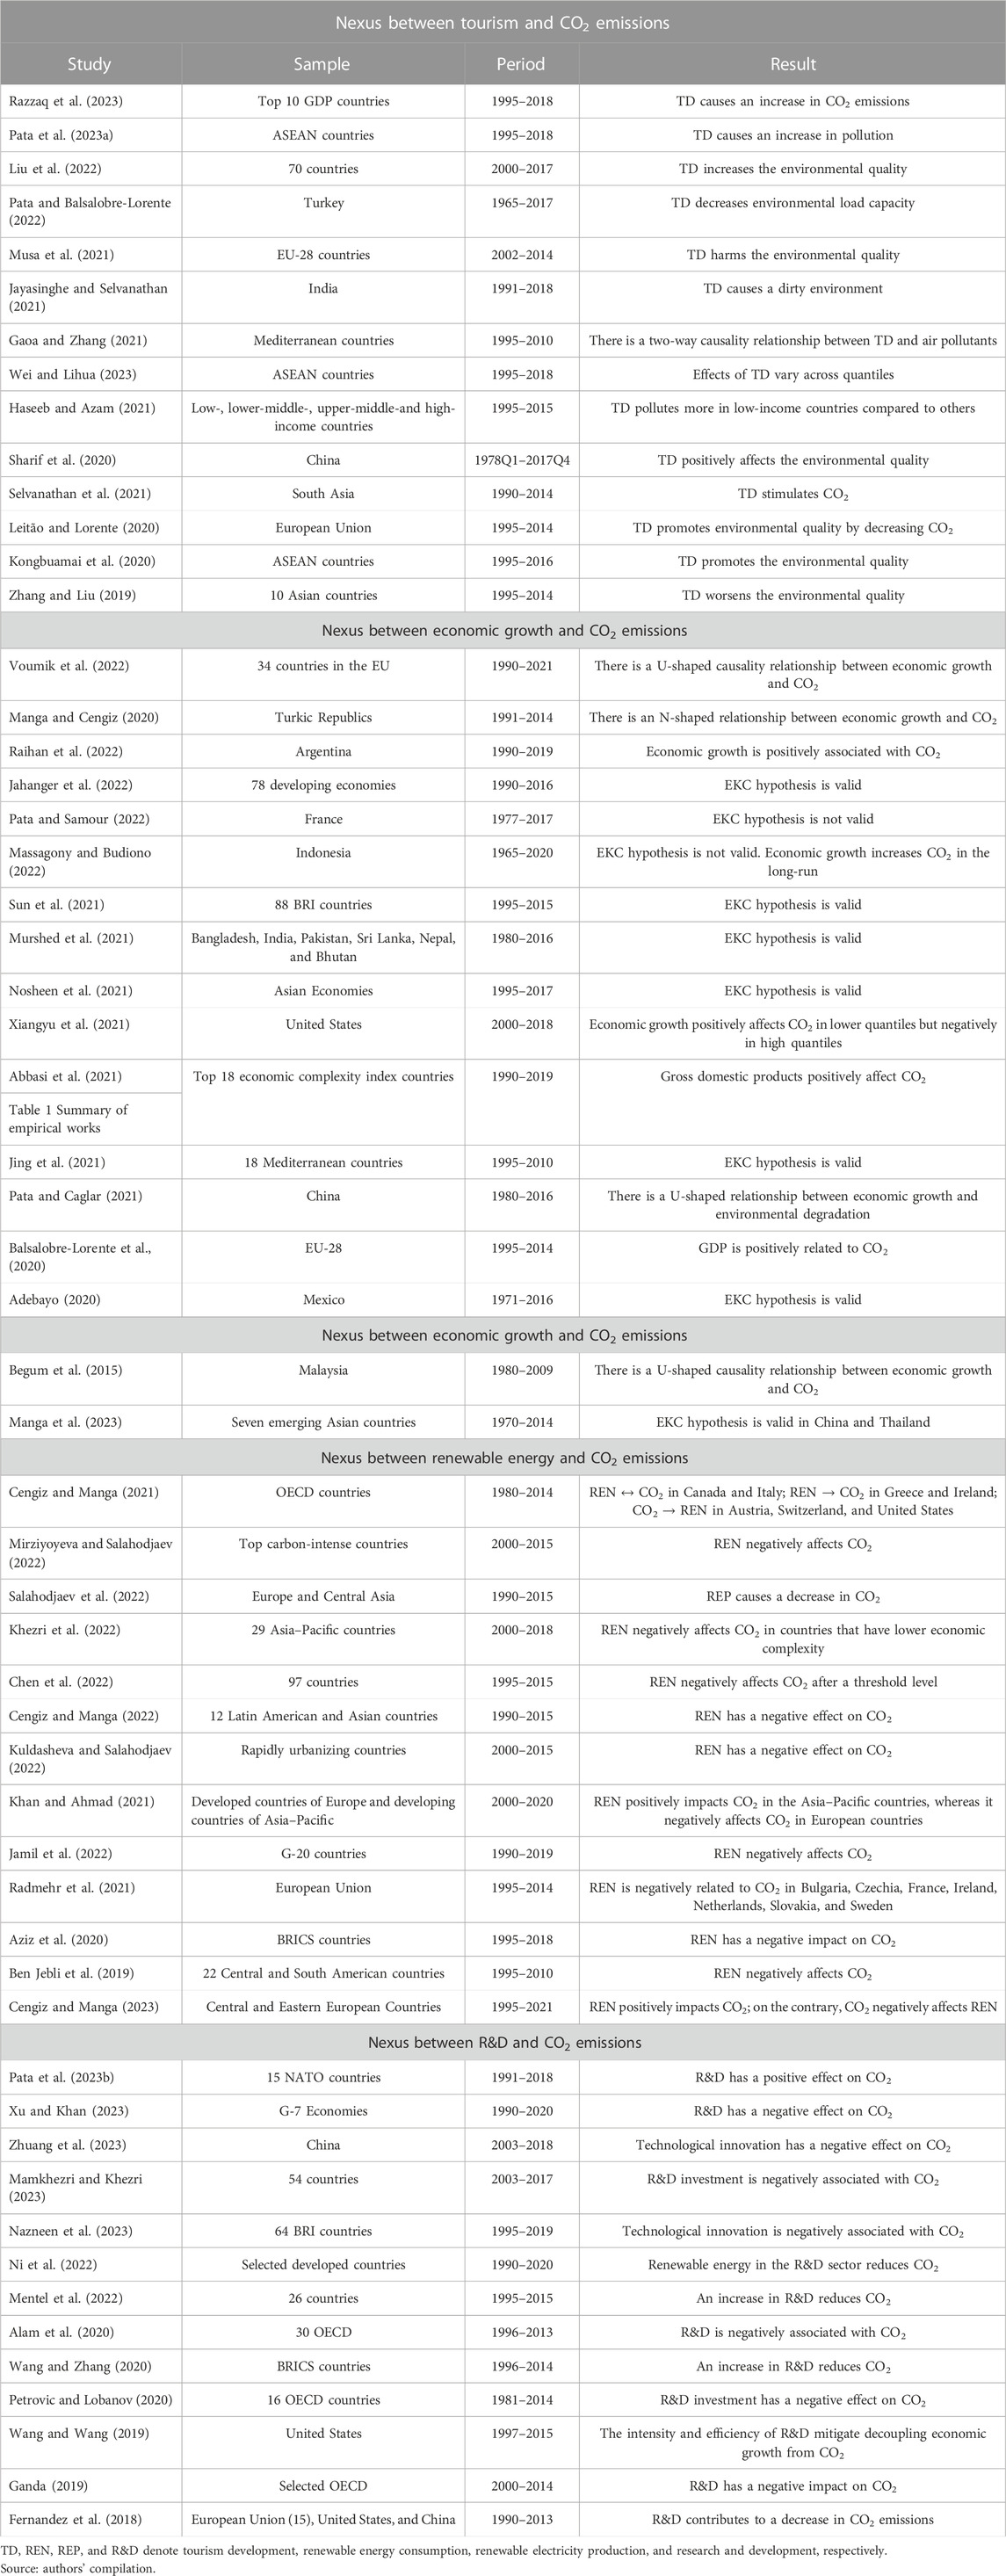
TABLE 1. Empirical literature review.
3 Data, model, and empirical methodology
This study focuses on the impact of tourism development on CO2 emissions in 12 emerging markets and middle-income European countries, including Azerbaijan, Belarus, Bulgaria, Croatia, Hungary, Kazakhstan, North Macedonia, Poland, Romania, Russia, Turkey, and Ukraine, using annual data covering 1999–2020. In order to find out the relationship between tourism arrival development and CO2 emissions, gross domestic per capita, REN, and R&D are control variables influencing CO2 emissions. Furthermore, we included the gross domestic per capita square to check the validity of the EKC hypothesis in these countries. Table 2 identifies the data, variables, unit of measurement, and their sources.
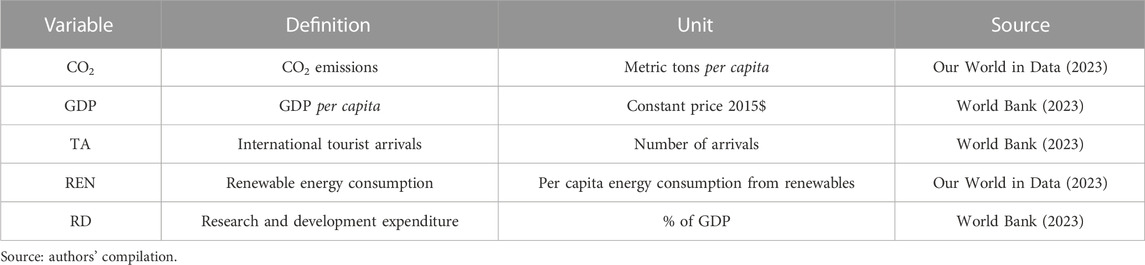
TABLE 2. Detailed description of variables.
Following the study of Rahaman et al. (2022a) to examine the relationship between tourism development and CO2 emissions, we construct an econometric model as follows:
In Eq. 1,
The logarithmic function of Eq. 1 can be rewritten as follows:
where
3.1 Econometric methodology
This study employed different estimators and causality tests to obtain more reliable and consistent findings.
3.1.1 Cross-sectional dependence test
There are four crucial econometric steps in our study. In the first step, we check the possible cross-sectional dependency among variables. In doing so, Breusch and Pagan’s (1980) LM test, Pesaran’s (2004) scaled LM and CD tests, and Baltagi et al.’s (2012) bias-corrected scaled LM are performed as the cross-sectional dependence (CSD) tests. The results of the CSD tests determine which unit root tests should be used.
3.1.2 CIPS unit root test
After validating the CSD test, it requires a second-generation unit root. Therefore, we perform a cross-sectional augmented Im, Pesaran, and Shin (CIPS) panel unit root test proposed by Pesaran (2007). The CIPS statistics can be computed through the cross-sectional augmented Dickey–Fuller (CADF) test statistic. The CADF test statistics can be written as follows (Murshed and Dao, 2022):
The T-statistics obtained from the CADF statistics can be used in the CIPS statistics as follows:
3.1.3 Panel ARDL estimation technique
In order to estimate the long-run relationship between CO2 emissions, GDP, GDP2, TA, REN, and RD, we utilize the panel ARDL estimation technique proposed by Pesaran et al. (2001). The panel ARDL approach has some advantages. First, the panel ARDL method offers an advantage in econometric analyses in that series are not required to be integrated in the same order. However, the series in the model should be I(0), I(1), or a combination of both (Darsono et al., 2022); second order cannot be used in the model (Massagony and Budiono, 2023). Hence, it can be performed in cases of no co-integration (Simionescu et al., 2021). Second, it provides reliable and robust results in small samples and simultaneously allows short- and long-run estimation (Wang and Huang, 2022). Third, it considers the cross-sectional heterogeneity in the model (Tenaw and Beyene, 2021; Pata et al., 2023b). The ARDL format of Eq. 1 can be expressed as follows:
where
3.1.4 Fixed- and random-effects model
In order to obtain a clear association between variables, we also employ fixed- and random-effects estimators. In order to choose between fixed- and random-effects results, the Hausman test is considered. Hence, the Hausman test is used to decide the appropriate estimator, and the hypothesis is as follows (Sheytanova, 2014):
H0:. Random effects are appropriate.
H1:. Fixed effects are appropriate.
3.1.5 Dumitrescu–Hurlin causality test
Following the long-run estimation, the Dumitrescu–Hurlin (D–H) causality test is employed to reveal the causality relationship between CO2 emissions, GDP, GDP2, TA, REN, and RD for selected panel groups. Dumitrescu and Hurlin’s (2012) test depends on Wald test statistics and can be formulated as follows (Razzaq et al., 2023):
where K is the lag orders and
4 Empirical results and discussion
Before providing empirical analyses, descriptive statistics can show the general properties of the variables. All variables’ descriptive statistics are summarized in Table 3.
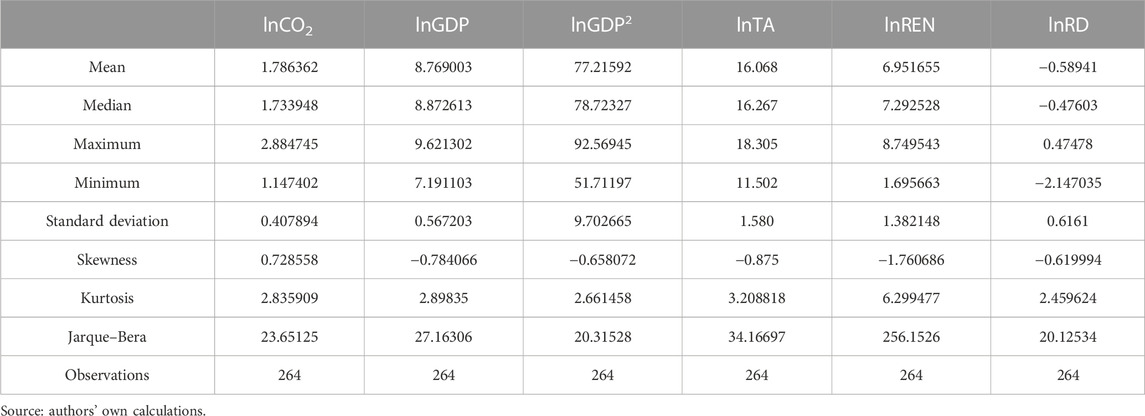
TABLE 3. Descriptive statistics.
Table 3 presents descriptive statistics of variables for the period 1999–2020. The variable set comprises CO2, GDP, GDP2, TA, REN, and RD for selected panel groups. GDP2 has the highest standard deviation; it is followed by tourist arrivals (TAs), REN, R&D expenditure, gross domestic product (GDP), and CO2 emissions.
In panel data econometrics, CSD is crucial. In the era of globalization, interdependency is high across countries, and any development in one country can quickly spread to others. According to the findings from Table 4, the null hypothesis of no CSD among countries for all variables is rejected. Thus, we obtained CSD, indicating that a shock in a country affects the rest of the world. Moreover, we performed Pesaran and Yamagata’s (2008) delta (Δ) and delta (Δ)adj to test the slope homogeneity. The results show that the slope coefficients are heterogeneous. Therefore, after obtaining CSD, it is required to apply the second-generation panel unit root test, which concerns CSD. For this, we employ the CIPS unit root test, and the findings are documented in Table 5.
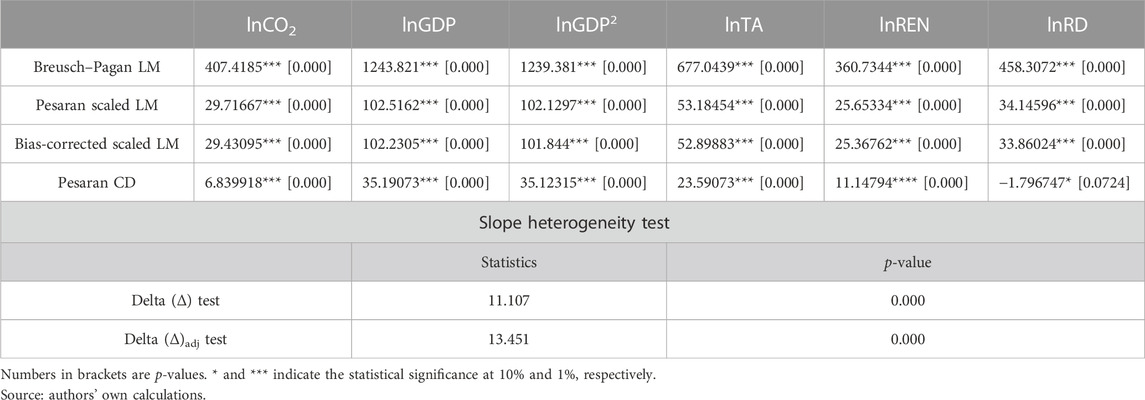
TABLE 4. CSD test results.
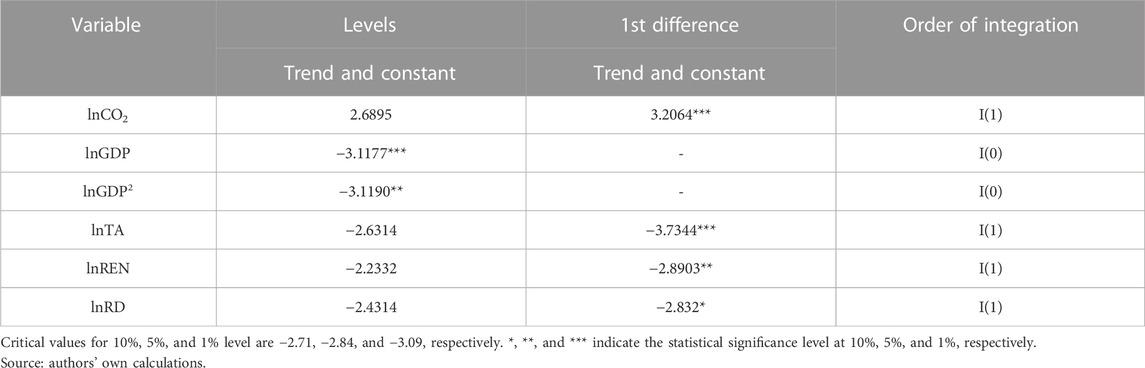
TABLE 5. CIPS unit root test results.
The CIPS unit root test results indicate that lnGDP and lnGDP2 are stationary at the first level, while lnCO2, lnTA, lnREN, and lnRD are stationary at the first difference. In other words, lnGDP and lnGDP2 are integrated at I(0), whereas lnCO2, lnREN, lnRD, and TO are integrated at I(1). The mixed order of integration allows employing the panel ARDL estimation technique to investigate the long-run relationship between variables. The panel ARDL technique includes two estimators: a mean group (MG) and a pooled mean group (PMG). The Hausman test results determine the choice of MG or PMG as an efficient estimator. The Hausman test results are documented in Table 6.

TABLE 6. Hausman test results.
The Hausman test results indicate that PMG is more efficient than MG. Thus, we concentrate on the results of the PMG estimator. Therefore, the panel ARDL/PMG long-run results are offered in Table 7.
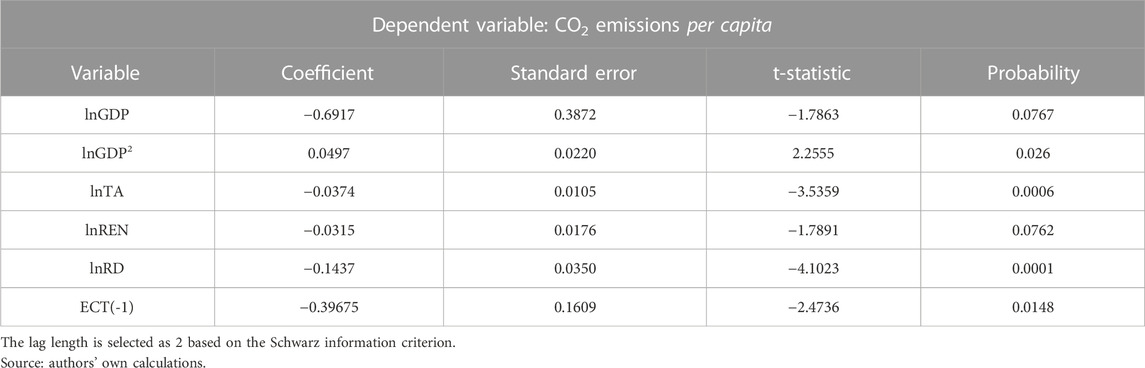
TABLE 7. Panel ARDL/PMG long-run results.
In addition to panel ARDL, the Driscoll and Kraay (1998) estimator (both for fixed and random effects) is employed to obtain further evidence in terms of the relationship between variables. The main advantage of the Driscoll–Kraay estimator is that it considers autocorrelation, heteroscedasticity, and CSD (Beylik et al., 2022; Haseeb et al., 2023). The fixed- and random-effects results based on the Driscoll–Kraay estimators are documented in Table 8.
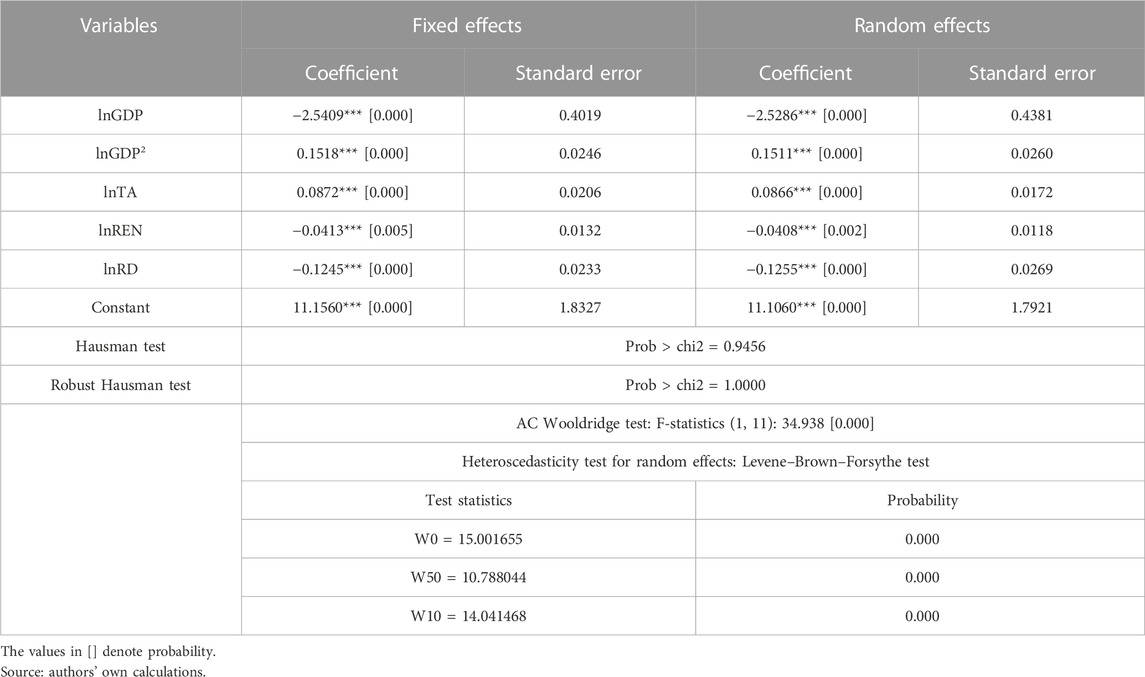
TABLE 8. Driscoll–Kraay estimator results for fixed and random effects.
The Hausman test results from Table 8 indicate that the null hypothesis of random effects is adequate and cannot be rejected at a 1% significance level. Hence, it represents that the random-effects results must be considered.
The panel ARDL results indicate that economic growth has a long-term negative and substantial impact on CO2 emissions per capita. An increase of 1% in economic growth causes a 0.691% decrease in CO2 emissions. To check the validity of the EKC hypothesis, we included GDP2 in the model. The result shows a positive and significant coefficient of GDP2 on CO2 emissions per capita. It implies that the EKC hypothesis is invalid in our panel sample and that there is a U-shaped relationship between economic growth and CO2 emissions per capita. Our result for checking the validity of the EKC hypothesis is consistent with studies of Begum et al. (2015), Balsalobre-Lorente et al. (2023), Voumik et al. (2022), Abbasi et al. (2021), Pata and Caglar (2021), and Massagony and Budiono (2023). The U-shaped relationship between economic growth and CO2 emissions can be caused by increasing green technologies at the beginning of the production process; however, in the later stage of economic growth, non-renewable energy sources are used, and environmental degradation increases (Voumik et al., 2022). In addition, tourist arrivals negatively affect CO2 emissions per capita in the long run. For example, an increase of 1% in tourist arrivals causes a 0.037% decrease in CO2 emissions per capita. The negative parameter of tourist arrivals on CO2 emissions is in line with Leitão and Lorente (2020), Pata and Balsalobre-Lorente (2022), Sharif et al. (2020), and Kongbuamai et al. (2020).
REN also negatively affects CO2 emissions per capita in the long run, as expected. An increase of 1% in REN reduces CO2 emissions per capita by 0.031%. The negative result of REN on CO2 emissions per capita is in line with Mirziyoyeva and Salahodjaev (2022), Aziz et al. (2020), Salahodjaev et al. (2022), Jamil et al. (2022), and Kuldasheva and Salahodjaev (2022). REN plays an important role in sustainable development, which is crucial for combating environmental degradation. Using REN such as hydro, wind, and solar sources instead of non-renewable energy preserves environmental quality. Hence, REN becomes a key factor in a cleaner environment (Aziz et al., 2020). Likewise, R&D has a decreasing effect on CO2 emissions per capita. An increase of 1% in R&D corresponds to a decrease of 0.143% in CO2 emissions. Our finding supports the results of Alam et al. (2020), Wang and Zhang (2020), Mentel et al. (2022), Xu and Khan (2023), and Mamkhezri and Khezri (2023). The negative impact of R&D on CO2 emissions is related to improving energy efficiency and energy-saving technologies, which require less energy consumption (Wang and Wang, 2019). Thus, R&D not only facilitates the installation and utilization of REN (Alam et al., 2020) but also provides technological innovation incentives to use environmentally friendly technology. Furthermore, the finding indicates that the coefficient of the error correction term (ECT) is negative and statistically significant. It proves a speed of adjustment from the short-run to the long-run equilibrium path among variables.
Furthermore, the Driscoll–Kraay estimators’ results (for fixed and random effects) regarding parameters’ signs are consistent with panel ARDL except TA. Since we have determined that random effects are appropriate for our model, the coefficients of the random effects should be interpreted. For this purpose, the random-effects model shows that an increase of 1% in GDP causes a 2.52% decrease in CO2 emissions. However, the impact of the GDP2 positively affects CO2 emissions. An increase of 1% in the GDP2 increases CO2 emissions by 0.15%. When considered together with the signs of the lnGDP and lnGDP2, it is approved that the EKC hypothesis is invalid in these countries, and a U-shaped association exists between economic growth and CO2 emissions. Therefore, the U-shaped association between economic growth and CO2 emissions rejects our first hypothesis that the EKC hypothesis is valid in our panel sample countries. Moreover, an increase of 1% in REN and RD reduces CO2 emissions by 0.04% and 0.12%, respectively. Most importantly, the impact of TA is positive on CO2 emissions. A 1% increase in international tourism arrivals causes a 0.086% increase in CO2 emissions. Furthermore, the fixed-effects results support the random-effects results. Our result is consistent with the studies of Pata et al. (2023c), Salahodjaev et al. (2022), Sun et al. (2021), Musa et al. (2021), Fethi and Senyucel (2021), Kumail et al. (2020), Isik et al. (2020), Villanthenkodath et al. (2022), Usman et al. (2022), and Destek and Aydın (2022). Different results can cause the positive impact of international tourism on CO2 emissions. For example, it indicates that these countries are not able to invest in eco-friendly tourism. Although the tourism receipts of these countries are remarkable, they cannot improve the tourism sector with well-developed technologies. In addition, as international tourism arrivals increase, energy consumption in hotels, restaurants, and cities also increases, thereby damaging the environment (Musa et al., 2021). Moreover, tourism infrastructure is closely linked to the environment. Modernizing transportation and roads is crucial to energy efficiency (Salahodjaev et al., 2022). Additionally, by estimating parameters, we research the causality paths between variables. The results from the Dumitrescu and Hurlin (2012) causality test are provided in Table 9.
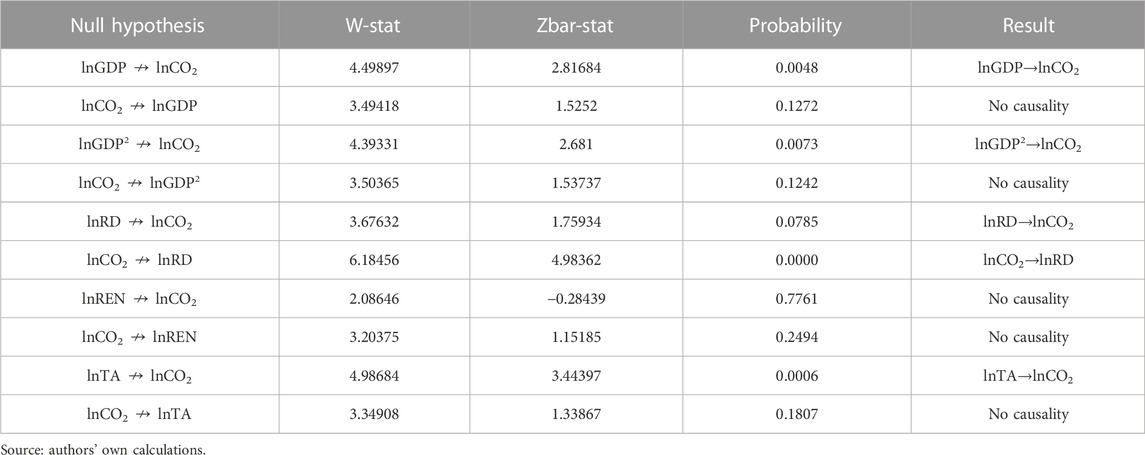
TABLE 9. D–H causality test results.
It is evident that the causal linkages from Table 9 support the panel ARDL and the Driscoll and Kraay estimator’s results. It is observed that there is a one-way causality running from lnGDP, lnGDP2, and lnTA to CO2 emissions. Furthermore, a bidirectional causality relationship exists between RD and CO2 (see Figure 6).
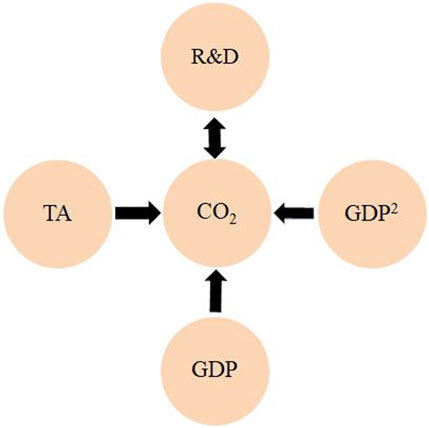
FIGURE 6. Causality relationship (authors’ compilation).
5 Conclusion and policy recommendations
Our study works on the impact of tourism development on CO2 emissions by investigating the roles of REN and R&D in 12 emerging markets and middle-income European countries, including Azerbaijan, Belarus, Bulgaria, Croatia, Hungary, Kazakhstan, North Macedonia, Poland, Romania, Russia, Turkey, and Ukraine, using annual data covering 1999–2020. We employ the panel ARDL and the Driscoll–Kraay estimator to determine the associations between variables. Moreover, we performed the D–H causality test to reveal potential causality linkages between variables. The findings from panel ARDL indicate that the EKC hypothesis is invalid in these countries and that there is a U-shaped relationship between economic growth and CO2 emissions. In addition, international tourist arrivals, REN, and R&D negatively affect CO2 emissions. Consequently, a 1% growth in TA, REN, and R&D led to a 0.037%, 0.031%, and 0.143% decrease in CO2 emissions, respectively. Moreover, the Driscoll–Kraay estimator results confirm the panel ARDL results, except for the impact of tourism development. According to the Driscoll and Kraay estimator results, an increase of 1% in international tourist arrivals causes CO2 emissions to reduce by 0.086%. These results indicate that international tourism has an inverse effect on environmental degradation. There can be several results in this regard. For instance, international tourist arrivals cause an increase in energy consumption. Furthermore, increasing transportation usage with international tourist arrivals contributes to CO2 emissions. In addition, in the case of tourism, infrastructure is far from modern technological tools, causing more energy consumption and reducing energy efficiency. Finally, even if developing countries receive significant tourism revenue, they cannot use it to establish environmentally friendly technologies for the tourism sector.
In addition, REN decreases CO2 emissions. An increase in REN mitigates the adverse effect of fossil fuels on CO2 emissions. Furthermore, R&D expenditure increases environmental quality by decreasing CO2 emissions. R&D is associated with renewable energy policies. R&D contributes to the installation of energy saving technologies, increasing energy efficiency, and the availability of REN sources. Moreover, the D–H panel causality test reveals a two-way causal relationship between R&D and CO2 emissions and a one-way causal linkage running from economic growth, the square of economic growth, and tourist arrival to CO2 emissions. Overall, our results prove the existence of a relationship between international tourism and CO2 emissions.
The findings of our study have several significant policy implications: First, economic growth decreases CO2 emissions. It indicates that as economic growth increases, the usage of pollutant energy sources also decreases. In other words, economic growth stimulates green energy sources. Hence, policymakers of these countries should consider improving green energy sources along with economic growth. However, economic growth has a negative impact on CO2 emissions. The square of economic growth caused an increase in CO2 emissions. This can be caused by increasing non-renewable energy consumption, which causes severe environmental deterioration in the later stages of economic development. These findings indicate that the scale + composition effect is bigger than the technological effect in the long term. Economic concerns are given priority over environmental quality by the people. Policymakers must urge firms to avoid using environmentally harmful energy sources like petrol, coal, and natural gas. Second, tourist arrivals cause CO2 emissions. For this purpose, policymakers should promote the use of environmentally friendly vehicles for transportation in the tourism sector. In addition, they can offer adaptable incentives for foreign visitors regarding keeping their interest alive in a clean environment. Furthermore, tourist destinations incorporating smart city technologies can play a vital role in promoting sustainable development and protecting the environment because smart cities provide incentives and facilitate sustainable development goals. Using new and developed technologies can reduce waste and increase energy efficiency. Third, as REN negatively impacts CO2 emissions, policymakers of these countries can adopt policies regarding the spread of REN. This can decrease the dependency on non-renewable energy consumption and increase environmental quality and sustainable development. To promote the use of REN, policymakers should incentivize companies to include it in employee benefits and subsidize the expenses of installing REN systems. Finally, R&D stimulates environmental quality. Policymakers should provide incentives for firms to develop R&D activities. For example, cheap and selective credit can be a viable option to disseminate innovation and technology facilities. Improvements in innovation and technology also facilitate the installation of REN sources. Fourth, firms play a crucial role in reducing CO2 emissions and protecting the environment. They can accomplish some policies in terms of a sustainable environment. For example, using REN sources, adopting eco-friendly production processes, and investing in new technologies and R&D are crucial measures. It is essential to prioritize environmentally conscious business and management models. Additionally, increasing employee awareness is an important way to challenge environmental destruction. Green human resource practices may encourage employees to protect the environment.
This study has some limitations that can be investigated in future research. First, we used R&D as a proxy for technological innovation. Other technological innovation indicators, such as patent applications, can be considered together with R&D. Second, we focused on only 12 countries. Future studies can investigate the relationship between tourism and environmental degradation for a larger group of emerging and developing countries. Third, we were able to use the overall CO2 emissions as a proxy for environmental degradation. Future studies can use tourism-induced CO2 emissions as an indicator of environmental degradation.
Data availability statement
The raw data supporting the conclusion of this article will be made available by the authors, without undue reservation.
Author contributions
EB: writing–original draft, data curation, and methodology. OC: writing–original draft, conceptualization, formal analysis, and software. AK: data curation, resources, and writing–review and editing. BA: supervision and writing–review and editing.
Funding
The authors declare that no financial support was received for the research, authorship, and/or publication of this article.
Conflict of interest
The authors declare that the research was conducted in the absence of any commercial or financial relationships that could be construed as a potential conflict of interest.
Publisher’s note
All claims expressed in this article are solely those of the authors and do not necessarily represent those of their affiliated organizations, or those of the publisher, the editors, and the reviewers. Any product that may be evaluated in this article, or claim that may be made by its manufacturer, is not guaranteed or endorsed by the publisher.
References
Abbasi, K. R., Kangjuan, Lv., Radulescu, M., and Shaikh, P. A. (2021). Economic complexity, tourism, energy prices, and environmental degradation in the top economic complexity countries: fresh panel evidence. Environ. Sci. Pollut. Res. 28, 68717–68731. doi:10.1007/s11356-021-15312-4
Adebayo, T. S. (2020). Revisiting the EKC hypothesis in an emerging market: an application of ARDL-based bounds and Wavelet Coherence Approaches. SN Appl. Sci. 2 (12), 1945. doi:10.1007/s42452-020-03705-y
Adedoyin, F. F., Nathaniel, S., and Adeleye, N. (2021). An investigation into the anthropogenic nexus among consumption of energy, tourism, and economic growth: do economic policy uncertainties matter?. Environ. Sci. Pollut. Res. 28, 2835–2847. doi:10.1007/s11356-020-10638-x
Adeel-Farooq, R. M., Raji, J. O., and Adeleye, B. N. (2021). Economic growth and methane emission: testing the EKC hypothesis in ASEAN economies. Manag. Environ. Qual. An Int. J. 32 (2), 277–289. doi:10.1108/MEQ-07-2020-0149
Akar, B. G. (2016). The determinants of renewable energy consumption: an empirical analysis for the Balkans. Eur. Sci. J. 12 (11), 594–607. doi:10.19044/esj.2016.v12n11p594
Al-Mulali, U., Gholipour, H. F., and Solarin, S. A. (2022). Investigating the environmental Kuznets curve (EKC) hypothesis: does government effectiveness matter? Evidence from 170 countries. Environ. Dev. Sustain. 24, 12740–12755. doi:10.1007/s10668-021-01962-4
Alam, M. S., Apergis, N., Paramati, S. R., and Fang, J. (2021). The impacts of R&D investment and stock markets on clean-energy consumption and CO2 emissions in OECD economies. Int. J. Finance Econ. 26 (4), 4979–4992. doi:10.1002/ijfe.2049
Alam, M. S., Atif, M., Chien-Chi, C., and Soytaş, U. (2019). Does corporate R&D investment affect firm environmental performance? Evidence from G-6 countries. Energy Econ. 78, 401–411. doi:10.1016/j.eneco.2018.11.031
Ali, S., Hamid, A. B. B. A., Ya’akub, N. I. B., and Iqbal, S. (2023). Environmental impacts of international tourism: examining the role of policy uncertainty, renewable energy, and service sector output. Environ. Sci. Pollut. Res., 1–14. doi:10.1007/s11356-023-28377-0
Alola, A. A., Eluwole, K. K., Alola, U. V., Lasisi, T. T., and Avci, T. (2020). Environmental quality and energy import dynamics: the tourism perspective of the coastline Mediterranean countries (CMCs). Manag. Environ. Qual. An Int. J. 31 (3), 665–682. doi:10.1108/MEQ-05-2019-0101
Alola, A. A., and Ozturk, I. (2021). Mirroring risk to investment within the EKC hypothesis in the United States. J. Environ. Manag. 293, 112890. doi:10.1016/j.jenvman.2021.112890
Atasel, O. Y., Guneysu, Y., and Pata, U. K. (2022). Testing the agricultural induced EKC hypothesis: fresh empirical evidence from the top ten agricultural countries. AGRIS on-line Pap. Econ. Inf. 14 (1), 19–31. doi:10.22004/ag.econ.320336
Awan, A., Abbasi, K. R., Rej, S., Bandyopadhyay, A., and Lv, K. (2022). The impact of renewable energy, internet use and foreign direct investment on carbon dioxide emissions: a method of moments quantile analysis. Renew. Energy 189, 454–466. doi:10.1016/j.renene.2022.03.017
Awosusi, A. A., Mata, M. N., Ahmed, Z., Coelho, M. F., Altuntaş, M., Martins, J. M., et al. (2022). How do renewable energy, economic growth and natural resources rent affect environmental sustainability in a globalized economy? Evidence from Colombia based on the gradual shift causality approach. Front. Energy Res. 9, 905. doi:10.3389/fenrg.2021.739721
Aydin, M., Koc, P., and Sahpaz, K. I. (2023). Investigating the EKC hypothesis with nanotechnology, renewable energy consumption, economic growth and ecological footprint in G7 countries: panel data analyses with structural breaks. Energy Sources, Part B Econ. Plan. Policy 18 (1), 2163724. doi:10.1080/15567249.2022.2163724
Aziz, N., Mihardjo, L. W., Sharif, A., and Jermsittiparsert, K. (2020). The role of tourism and renewable energy in testing the environmental Kuznets curve in the BRICS countries: fresh evidence from methods of moments quantile regression. Environ. Sci. Pollut. Res. 27, 39427–39441. doi:10.1007/s11356-020-10011-y
Balsalobre-Lorente, D., Abbas, J., He, C., Pilař, L., and Shah, S. A. R. (2023). Tourism, urbanization and natural resources rents matter for environmental sustainability: the leading role of AI and ICT on sustainable development goals in the digital era. Resour. Policy 82, 103445. doi:10.1016/j.resourpol.2023.103445
Baltagi, B. H., Feng, Q., and Kao, C. (2012). A Lagrange Multiplier test for cross-sectional dependence in a fixed effects panel data model. J. Econ. 170 (1), 164–177. doi:10.1016/j.jeconom.2012.04.004
Bandyopadhyay, A., and Rej, S. (2021). Can nuclear energy fuel an environmentally sustainable economic growth? Revisiting the EKC hypothesis for India. Environ. Sci. Pollut. Res. 28, 63065–63086. doi:10.1007/s11356-021-15220-7
Begum, R. A., Sohag, K., Abdullah, S. M. S., and Jaafar, M. (2015). CO2 emissions, energy consumption, economic and population growth in Malaysia. Renew. Sustain. Energy Rev. 41, 594–601. doi:10.1016/j.rser.2014.07.205
Bekun, F. V., Adedoyin, F. F., Etokakpan, M. U., and Gyamfi, B. A. (2022). Exploring the tourism-CO2 emissions-real income nexus in E7 countries: accounting for the role of institutional quality. J. Policy Res. Tour. Leis. Events 14 (1), 1–19. doi:10.1080/19407963.2021.2017725
Ben Jebli, M., Ben Youssef, S., and Apergis, N. (2019). The dynamic linkage between renewable energy, tourism, CO2 emissions, economic growth, foreign direct investment, and trade. Lat. Am. Econ. Rev. 28 (1), 1–19. doi:10.1186/s40503-019-0063-7
Beyene, D. S. (2023). Going beyond the traditional EKC hypothesis: a panel quantile approach. Int. J. Environ. Stud. 80 (1), 93–112. doi:10.1080/00207233.2022.2037327
Beylik, U., Cirakli, U., Cetin, M., Ecevit, E., and Senol, O. (2022). The relationship between health expenditure indicators and economic growth in OECD countries: a Driscoll-Kraay approach. Front. Public Health 10, 1050550. doi:10.3389/fpubh.2022.1050550
Bilgili, F., Kuşkaya, S., Khan, M., Awan, A., and Türker, O. (2021). The roles of economic growth and health expenditure on CO2 emissions in selected Asian countries: a quantile regression model approach. Environ. Sci. Pollut. Res. 28, 44949–44972. doi:10.1007/s11356-021-13639-6
Breusch, T. S., and Pagan, A. R. (1980). The Lagrange multiplier test and its applications to model specification in econometrics. Rev. Econ. Stud. 47 (1), 239–253. doi:10.2307/2297111
Brida, J. G., Gómez, D. M., and Segarra, V. (2020). On the empirical relationship between tourism and economic growth. Tour. Manag. 81, 104131. doi:10.1016/j.tourman.2020.104131
Cengiz, O., and Manga, M. (2022). Is there any relationship between geopolitical risk and climate change?. Ekonomski vjesnik/Econviews-Review Contemp. Bus. Entrepreneursh. Econ. Issues 35 (1), 99–112. doi:10.51680/ev.35.1.8
Cengiz, O., and Manga, M. (2021). The causal linkages between renewable energy consumption, economic growth, oil prices and CO2 emissions in selected OECD countries. J. Prod. 3, 165–183. doi:10.51551/verimlilik.707804
Cengiz, O., and Manga, M. (2023). Towards a political economy of renewable energy: does democracy and globalization matter for central and eastern European countries (CEECs). Problemy Ekorozwoju/Problems Sustain. Dev. 18 (2), 86–101. doi:10.35784/preko.3947
Cevik, S. (2023). Dirty dance: tourism and environment. Int. Rev. Appl. Econ. 37 (1), 168–185. doi:10.1080/02692171.2022.2117282
Chen, C., Pinar, M., and Stengos, T. (2022). Renewable energy and CO2 emissions: new evidence with the panel threshold model. Renew. Energy 194, 117–128. doi:10.1016/j.renene.2022.05.095
Cheng, C., Ren, X., Dong, K., Dong, X., and Wang, Z. (2021). How does technological innovation mitigate CO2 emissions in OECD countries? Heterogeneous analysis using panel quantile regression. J. Environ. Manag. 280, 111818. doi:10.1016/j.jenvman.2020.111818
Chien, F. (2022). How renewable energy and non-renewable energy affect environmental excellence in N-11 economies?. Renew. Energy 196, 526–534. doi:10.1016/j.renene.2022.07.013
Dagar, V., Khan, M. K., Alvarado, R., Rehman, A., Irfan, M., Adekoya, O. B., et al. (2022). Impact of renewable energy consumption, financial development and natural resources on environmental degradation in OECD countries with dynamic panel data. Environ. Sci. Pollut. Res. 29 (12), 18202–18212. doi:10.1007/s11356-021-16861-4
Danish, W. Z. (2018). Dynamic relationship between tourism, economic growth, and environmental quality. J. Sustain. Tour. 26 (11), 1928–1943. doi:10.1080/09669582.2018.1526293
Darsono, S. N. A. C., Wong, W. K., Nguyen, T. T. H., and Wardani, D. T. K. (2022). The economic policy uncertainty and its effect on sustainable investment: a panel ARDL approach. J. Risk Financial Manag. 15 (6), 254. doi:10.3390/jrfm15060254
De Vita, G., Katircioglu, S., Altinay, L., Fethi, S., and Mercan, M. (2015). Revisiting the environmental Kuznets curve hypothesis in a tourism development context. Environ. Sci. Pollut. Res. 22, 16652–16663. doi:10.1007/s11356-015-4861-4
Demir, Ö. (2022). The contribution of ICT capital investment to economic growth in digital economies: theory and evidence from OECD countries. Düzce Econ. J. 3 (2), 119–134.
Destek, M. A., and Aydin, S. (2022). An empirical note on tourism and sustainable development nexus. Environ. Sci. Pollut. Res. 29, 34515–34527. doi:10.1007/s11356-021-18371-9
Dinda, S. (2004). Environmental Kuznets curve hypothesis: a survey. Ecol. Econ. 49 (4), 431–455. doi:10.1016/j.ecole.con.2004.02.011
Dogan, E., and Inglesi-Lotz, R. (2020). The impact of economic structure to the environmental Kuznets curve (EKC) hypothesis: evidence from European countries. Environ. Sci. Pollut. Res. 27, 12717–12724. doi:10.1007/s11356-020-07878-2
Driscoll, J. C., and Kraay, A. C. (1998). Consistent covariance matrix estimation with spatially dependent panel data. Rev. Econ. Stat. 80, 549–560. doi:10.1162/003465398557825
Dumitrescu, E. I., and Hurlin, C. (2012). Testing for Granger non-causality in heterogeneous panels. Econ. Model. 29 (4), 1450–1460. doi:10.1016/j.econmod.2012.02.014
Erdogan, S. (2021). Dynamic nexus between technological innovation and building sector carbon emissions in the BRICS countries. J. Environ. Manag. 293, 112780. doi:10.1016/j.jenvman.2021.112780
Fernández, Y. F., López, M. F., and Blanco, B. O. (2018). Innovation for sustainability: the impact of R&D spending on CO2 emissions. J. Clean. Prod. 172, 3459–3467. doi:10.1016/j.jclepro.2017.11.001
Fethi, S., and Senyucel, E. (2021). The role of tourism development on CO 2 emission reduction in an extended version of the environmental Kuznets curve: evidence from top 50 tourist destination countries. Environ. Dev. Sustain. 23, 1499–1524. doi:10.1007/s10668-020-00633-0
Fuinhas, J. A., Belucio, M., Castilho, D., Mateus, J., and Caetano, R. (2020). Tourism and economic growth nexus in Latin America and Caribbean countries: evidence from an autoregressive distributed lag panel. Acad. Turistica-Tourism Innovation J. 13 (1), 21–34.
Ganda, F. (2019). The impact of innovation and technology investments on carbon emissions in selected organisation for economic co-operation and development countries. J. Clean. Prod. 217, 469–483. doi:10.1016/j.jclepro.2019.01.235
Gao, J., and Zhang, L. (2021). Exploring the dynamic linkages between tourism growth and environmental pollution: new evidence from the Mediterranean countries. Curr. Issues Tour. 24 (1), 49–65. doi:10.1080/13683500.2019.1688767
Genç, M. C., Ekinci, A., and Sakarya, B. (2022). The impact of output volatility on CO2 emissions in Turkey: testing EKC hypothesis with Fourier stationarity test. Environ. Sci. Pollut. Res. 29 (2), 3008–3021. doi:10.1007/s11356-021-15448-3
Ghosh, S., Balsalobre-Lorente, D., Doğan, B., Paiano, A., and Talbi, B. (2022). Modelling an empirical framework of the implications of tourism and economic complexity on environmental sustainability in G7 economies. J. Clean. Prod. 376, 134281. doi:10.1016/j.jclepro.2022.134281
Godil, D. I., Sharif, A., Ali, M. I., Ozturk, I., and Usman, R. (2021). The role of financial development, R&D expenditure, globalization and institutional quality in energy consumption in India: new evidence from the QARDL approach. J. Environ. Manag. 285, 112208. doi:10.1016/j.jenvman.2021.112208
Gormus, S., and Aydin, M. (2020). Revisiting the environmental Kuznets curve hypothesis using innovation: new evidence from the top 10 innovative economies. Environ. Sci. Pollut. Res. 27, 27904–27913. doi:10.1007/s11356-020-09110-7
Grossman, G. M., and Krueger, A. B. (1991). Environmental impacts of a North American free trade agreement (No. W3914). National Bureau of Economic Research. doi:10.3386/w3914
Guan, C., Rani, T., Yueqiang, Z., Ajaz, T., and Haseki, M. I. (2022). Impact of tourism industry, globalization, and technology innovation on ecological footprints in G-10 countries. Econ. Research-Ekonomska Istraživanja 35 (1), 6688–6704. doi:10.1080/1331677X.2022.2052337
Guo, Y., Zhao, L., and Zhang, C. (2023). Energy resources, tourism development and growth-emission nexus in developing countries. Resour. Policy 81, 103407. doi:10.1016/j.resourpol.2023.103407
Han, L. M., You, J. Q., Meng, J. N., Fu, Y. L., and Wu, S. L. (2023). Empirical analysis of R&D spending, transport infrastructure development and CO2 emissions in China. Front. Environ. Sci. 11, 1138876. doi:10.3389/fenvs.2023.1138876
Haseeb, A., Xia, E., Saud, S., Usman, M., and Quddoos, M. U. (2023). Unveiling the liaison between human capital, trade openness, and environmental sustainability for BRICS economies: robust panel-data estimation. Nat. Resour. Forum 47 (2), 229–256. doi:10.1111/1477-8947.12277
Haseeb, M., and Azam, M. (2021). Dynamic nexus among tourism, corruption, democracy and environmental degradation: a panel data investigation. Environ. Dev. Sustain. 23 (4), 5557–5575. doi:10.1007/s10668-020-00832-9
Hashmi, S. H., Hongzhong, F., Fareed, Z., and Bannya, R. (2020). Testing non-linear nexus between service sector and CO2 emissions in Pakistan. Energies 13 (3), 526. doi:10.3390/en13030526
He, B., Li, L., Wang, J., Li, J., and Zhu, L. (2022a). Investigating the influence of tourism on economic growth and carbon emissions: evidence from Hainan Island, China. J. Qual. Assur. Hosp. Tour. 24 (3), 237–252. doi:10.1080/1528008X.2022.2029666
He, Y., Li, X., Huang, P., and Wang, J. (2022b). Exploring the road toward environmental sustainability: natural resources, renewable energy consumption, economic growth, and greenhouse gas emissions. Sustainability 14, 1579. doi:10.3390/su14031579
Hossain, M. R., Rej, S., Awan, A., Bandyopadhyay, A., Islam, M. S., Das, N., et al. (2023). Natural resource dependency and environmental sustainability under N-shaped EKC: the curious case of India. Resour. Policy 80, 103150. doi:10.1016/j.resourpol.2022.103150
Hove, S., and Tursoy, T. (2019). An investigation of the environmental Kuznets curve in emerging economies. J. Clean. Prod. 236, 117628. doi:10.1016/j.jclepro.2019.117628
Hussain, M. N., Li, Z., Sattar, A., and Ilyas, M. (2022). Dynamic linkage between tourism, corruption and CO2 emission on economic growth in BRI Countries. Leis. Sci., 1–19. doi:10.1080/01490400.2022.2126909
Isik, C., Ahmad, M., Pata, U. K., Ongan, S., Radulescu, M., Adedoyin, F. F., et al. (2020). An evaluation of the tourism-induced environmental Kuznets curve (T-EKC) hypothesis: evidence from G7 Countries. Sustainability 12, 9150. doi:10.3390/su12219150
Intergovernmental Panel On Climate Change [IPCC] (2018). Global warming of 1.5°C. An IPCC Special Report on the impacts of global warming of 1.5°C above pre-industrial levels and related global greenhouse gas emission pathways, in the context of strengthening the global response to the threat of climate change, sustainable development, and efforts to eradicate poverty. https://www.ipcc.ch/site/assets/uploads/sites/2/2019/06/SR15_Full_Report_High_Res.pdf.
International Energy Agency [IEA] (2021). Global Energy Review 2021: assessing the effects of economic recoveries on global energy demand and CO2 emissions in 2021. https://www.iea.org/reports/global-energy-review-2021.
Iqbal, K., Hassan, S. T., Wang, Y., Shah, M. H., Syed, M., and Khurshaid, K. (2022). To achieve carbon neutrality targets in Pakistan: new insights of information and communication technology and economic globalization. Front. Environ. Sci. 9, 805360. doi:10.3389/fenvs.2021.805360
Isaeva, A., Salahodjaev, R., Khachaturov, A., and Tosheva, S. (2022). The impact of tourism and financial development on energy consumption and carbon dioxide emission: evidence from post-communist countries. J. Knowl. Econ. 13 (1), 773–786. doi:10.1007/s13132-021-00732-x
Ivanov, S., and Webster, C. (2007). Measuring the impact of tourism on economic growth. Tour. Econ. 13 (3), 379–388. doi:10.5367/000000007781497773
Jadoon, A. K., Akhtar, S., Sarwar, A., Batool, S. A., Chatrath, S. K., and Liaqat, S. (2021). Is economic growth and industrial growth the reason for environmental degradation in SAARC countries. Int. J. Energy Econ. Policy 11 (6), 418–426. doi:10.32479/ijeep.11769
Jahanger, A., Yu, Y., Hossain, M. R., Murshed, M., Balsalobre-Lorente, D., and Khan, U. (2022). Going away or going green in NAFTA nations? Linking natural resources, energy utilization, and environmental sustainability through the lens of the EKC hypothesis. Resour. Policy 79, 103091. doi:10.1016/j.resourpol.2022.103091
Jamil, K., Liu, D., Gul, R. F., Hussain, Z., Mohsin, M., Qin, G., et al. (2022). Do remittance and renewable energy affect CO2 emissions? An empirical evidence from selected G-20 countries. Energy & Environ. 33 (5), 916–932. doi:10.1177/0958305X211029636
Jayasinghe, M., and Selvanathan, E. A. (2021). Energy consumption, tourism, economic growth and CO2 emissions nexus in India. J. Asia Pac. Econ. 26 (2), 361–380. doi:10.1080/13547860.2021.1923240
Jena, P. K., Mujtaba, A., Joshi, D. P. P., Satrovic, E., and Adeleye, B. N. (2022). Exploring the nature of EKC hypothesis in Asia’s top emitters: role of human capital, renewable and non-renewable energy consumption. Environ. Sci. Pollut. Res. 29, 88557–88576. doi:10.1007/s11356-022-21551-w
Karthikeyan, C., and Murugesan, R. (2022). A cross-country analysis of the role of service sector in the relationship between CO2 emissions and economic growth using machine learning techniques. Int. J. Sustain. Econ. 14 (4), 399–410. doi:10.1504/IJSE.2022.125979
Khan, A., Bibi, S., Li, H., Fubing, X., Jiang, S., and Hussain, S. (2023). Does the tourism and travel industry really matter to economic growth and environmental degradation in the US: a sustainable policy development approach. Front. Environ. Sci. 11, 1147504. doi:10.3389/fenvs.2023.1147504
Khan, Y. A., and Ahmad, M. (2021). Investigating the impact of renewable energy, international trade, tourism, and foreign direct investment on carbon emission in developing as well as developed countries. Environ. Sci. Pollut. Res. 28, 31246–31255. doi:10.1007/s11356-021-12937-3
Khezri, M., Heshmati, A., and Khodaei, M. (2022). Environmental implications of economic complexity and its role in determining how renewable energies affect CO2 emissions. Appl. Energy 306, 117948. doi:10.1016/j.apenergy.2021.117948
Kihombo, S., Saud, S., Ahmed, Z., and Chen, S. (2021). The effects of research and development and financial development on CO2 emissions: evidence from selected WAME economies. Environ. Sci. Pollut. Res. 28, 51149–51159. doi:10.1007/s11356-021-14288-5
Koçak, E., and Ulucak, Z. Ş. (2019). The effect of energy R&D expenditures on CO 2 emission reduction: estimation of the STIRPAT model for OECD countries. Environ. Sci. Pollut. Res. 26, 14328–14338. doi:10.1007/s11356-019-04712-2
Kongbuamai, N., Bui, Q., Yousaf, H. M. A. U., and Liu, Y. (2020). The impact of tourism and natural resources on the ecological footprint: a case study of ASEAN countries. Environ. Sci. Pollut. Res. 27, 19251–19264. doi:10.1007/s11356-020-08582-x
Kostakis, I., Armaos, S., Abeliotis, K., and Theodoropoulou, E. (2023). The investigation of EKC within CO2 emissions framework: empirical evidence from selected cross-correlated countries. Sustain. Anal. Model. 3, 100015. doi:10.1016/j.samod.2023.100015
Kuldasheva, Z., and Salahodjaev, R. (2022). Renewable energy and CO2 emissions: evidence from rapidly urbanizing countries. J. Knowl. Econ., 1–6. doi:10.1007/s13132-022-00971-6
Kumail, T., Ali, W., Sadiq, F., Wu, D., and Aburumman, A. (2020). Dynamic linkages between tourism, technology and CO2 emissions in Pakistan. Anatolia 31 (3), 436–448. doi:10.1080/13032917.2020.1742169
Leitão, N. C., and Lorente, D. B. (2020). The linkage between economic growth, renewable energy, tourism, CO2 emissions, and international trade: the evidence for the European Union. Energies 13 (18), 4838. doi:10.1016/j.cesys.2021.100050
Liu, Y., Mabee, W., and Zhang, H. (2021). Conserving fertilizer in China's rural-agricultural development: the reversal shifts and the county-specific EKC evidence from Hubei. Clean. Environ. Syst. 3, 100050. doi:10.1016/J.CESYS.2021.100050
Liu, Z., Lan, J., Chien, F., Sadiq, M., and Nawaz, M. A. (2022). Role of tourism development in environmental degradation: a step towards emission reduction. J. Environ. Manag. 303, 114078. doi:10.1016/j.jenvman.2021.114078
Luan, S., Hussain, M., Ali, S., and Rahim, S. (2022). China’s investment in energy industry to neutralize carbon emissions: evidence from provincial data. Environ. Sci. Pollut. Res. 29 (26), 39375–39383. doi:10.1007/s11356-021-18141-7
Magazzino, C., Toma, P., Fusco, G., Valente, D., and Petrosillo, I. (2022). Renewable energy consumption, environmental degradation and economic growth: the greener the richer?. Ecol. Indic. 139, 108912. doi:10.1016/j.ecolind.2022.108912
Mahmood, H., Alkhateeb, T. T. Y., Al-Qahtani, M. M. Z., Allam, Z., Ahmad, N., and Furqan, M. (2019). Agriculture development and CO2 emissions nexus in Saudi Arabia. PloS one 14 (12), e0225865. doi:10.1371/journal.pone.0225865
Mahmood, H. (2023). Trade, FDI, and CO2 emissions nexus in Latin America: the spatial analysis in testing the pollution haven and the EKC hypotheses. Environ. Sci. Pollut. Res. 30, 14439–14454. doi:10.1007/s11356-022-23154-x
Mahmood, M. T., Shahab, S., and Hafeez, M. (2020). Energy capacity, industrial production, and the environment: an empirical analysis from Pakistan. Environ. Sci. Pollut. Res. 27 (5), 4830–4839. doi:10.1007/s11356-019-07161-z
Mamkhezri, J., and Khezri, M. (2023). Assessing the spillover effects of research and development and renewable energy on CO2 emissions: international evidence. Environ. Dev. Sustain., 1–30. doi:10.1007/s10668-023-03026-1
Manga, M., Cengiz, O., and Destek, M. A. (2023). Is export quality a viable option for sustainable development paths of Asian countries?. Environ. Sci. Pollut. Res. 30, 50022–50045. doi:10.1007/s11356-023-25784-1
Manga, M., and Cengiz, O. (2020). Globalization based approach to environmental Kuznets hypothesis: the case of Turkic republics. Süleyman Demirel Univ. Vision. J. 11 (28), 738–752. doi:10.21076/vizyoner.674546
Manzoor, F., Wei, L., Asif, M., Haq, M. Z. U., and Rehman, H. U. (2019). The contribution of sustainable tourism to economic growth and employment in Pakistan. Int. J. Environ. Res. Public Health 16 (19), 3785. doi:10.3390/ijerph16193785
Massagony, A., and Budiono, B. (2022). Is the environmental Kuznets curve (EKC) hypothesis valid on CO2 emissions in Indonesia?. Int. J. Environ. Stud., 1–12. doi:10.1080/00207233.2022.2029097
Mehmood, U., Askari, M. U., and Saleem, M. (2022). The assessment of environmental sustainability: the role of research and development in ASEAN countries. Integr. Environ. Assess. Manag. 18 (5), 1313–1320. doi:10.1002/ieam.4569
Mentel, G., Tarczyński, W., Azadi, H., Abdurakmanov, K., Zakirova, E., and Salahodjaev, R. (2022). R&D human capital, renewable energy and CO2 emissions: evidence from 26 Countries. Energies 15 (23), 9205. doi:10.3390/en15239205
Miao, Y., Razzaq, A., Adebayo, T. S., and Awosusi, A. A. (2022). Do renewable energy consumption and financial globalisation contribute to ecological sustainability in newly industrialized countries?. Renew. Energy 187, 688–697. doi:10.1016/j.renene.2022.01.073
Mirziyoyeva, Z., and Salahodjae, V. R. (2022). Renewable energy and CO2 emissions intensity in the top carbon intense countries. Renew. Energy 192, 507–512. doi:10.1016/j.renene.2022.04.137
Mlaskawa, J. (2022). Renewable energy and poverty in sustainable development of the European union. Problemy Ekorozwoju-Problems Sustain. Dev. 17 (2), 110–123. doi:10.35784/pe.2022.2.12
Murshed, M., Ali, S. R., and Banerjee, S. (2021). Consumption of liquefied petroleum gas and the EKC hypothesis in South Asia: evidence from cross-sectionally dependent heterogeneous panel data with structural breaks. Energy, Ecol. Environ. 6 (4), 353–377. doi:10.1007/s40974-020-00185-z
Murshed, M., and Dao, N. T. T. (2022). Revisiting the CO2 emission-induced EKC hypothesis in South Asia: the role of export quality improvement. GeoJournal 87 (2), 535–563. doi:10.1007/s10708-020-10270-9
Murshed, M., Haseeb, M., and Alam, M. S. (2022). The environmental Kuznets curve hypothesis for carbon and ecological footprints in South Asia: the role of renewable energy. GeoJournal 87, 2345–2372. doi:10.1007/s10708-020-10370-6
Murshed, M., Nurmakhanova, M., Elheddad, M., and Ahmed, R. (2020). Value addition in the services sector and its heterogeneous impacts on CO 2 emissions: revisiting the EKC hypothesis for the OPEC using panel spatial estimation techniques. Environ. Sci. Pollut. Res. 27, 38951–38973. doi:10.1007/s11356-020-09593-4
Musa, K. S., Maijama’a, R., and Yakubu, M. (2021). The causality between urbanization, industrialization and CO2 emissions in Nigeria: evidence from Toda and Yamamoto Approach. Energy Econ. Lett. 8 (1), 1–14. doi:10.18488/journal.82.2021.81.1.14
Nazneen, S., Hong, X., Ud Din, N., Jamil, B., and Hussain, K. (2023). The moderating role of technological innovation between tourism and carbon emission: short and long-run panel analysis. Environ. Sci. Pollut. Res., 1–12. doi:10.1007/s11356-023-25892-y
Ni, X., Wang, Z., Akbar, A., and Ali, S. (2022). Natural resources volatility, renewable energy, R&D resources and environment: evidence from selected developed countries. Resour. Policy 77, 102655. doi:10.1016/j.resourpol.2022.102655
Nosheen, M., Iqbal, J., and Khan, H. U. (2021). Analyzing the linkage among CO2 emissions, economic growth, tourism, and energy consumption in the Asian economies. Environ. Sci. Pollut. Res. 28, 16707–16719. doi:10.1007/s11356-020-11759-z
Ntim-Amo, G., Qi, Y., Ankrah-Kwarko, E., Ankrah Twumasi, M., Ansah, S., Boateng Kissiwa, L., et al. (2022). Investigating the validity of the agricultural-induced environmental Kuznets curve (EKC) hypothesis for Ghana: evidence from an autoregressive distributed lag (ARDL) approach with a structural break. Manag. Environ. Qual. An Int. J. 33 (2), 494–526. doi:10.1108/MEQ-05-2021-0109
Ohajionu, U. C., Gyamfi, B. A., Haseki, M. I., and Bekun, F. V. (2022). Assessing the linkage between energy consumption, financial development, tourism and environment: evidence from method of moments quantile regression. Environ. Sci. Pollut. Res., 1–15. doi:10.1007/s11356-021-17920-6
Olejnik, T. P., and Sobiecka, E. (2017). Utilitarian technological solutions to reduce CO2 emission in the aspect of sustainable development. Problemy Ekorozwoju-Problems Sustain. Dev. 12 (2), 173–179. doi:10.35784/pe
Onifade, S. T. (2022). Retrospecting on resource abundance in leading oil-producing African countries: how valid is the environmental Kuznets curve (EKC) hypothesis in a sectoral composition framework?. Environ. Sci. Pollut. Res. 29 (35), 52761–52774. doi:10.1007/s11356-022-19575-3
Our World in Data (2023). Our world in data. https://ourworldindata.org/.
Panayotou, T. (1993). Empirical tests and policy analysis of environmental degradation at different stages of economic development. Geneva: International Labour Organization.
Pata, U. K., and Balsalobre-Lorente, D. (2022). Exploring the impact of tourism and energy consumption on the load capacity factor in Turkey: a novel dynamic ARDL approach. Environ. Sci. Pollut. Res. 29 (9), 13491–13503. doi:10.1007/s11356-021-16675-4
Pata, U. K., and Caglar, A. E. (2021). Investigating the EKC hypothesis with renewable energy consumption, human capital, globalization and trade openness for China: evidence from augmented ARDL approach with a structural break. Energy 216, 119220. doi:10.1016/j.energy.2020.119220
Pata, U. K., Dam, M. M., and Kaya, F. (2023a). How effective are renewable energy, tourism, trade openness, and foreign direct investment on CO2 emissions? An EKC analysis for ASEAN countries. Environ. Sci. Pollut. Res. 30, 14821–14837. doi:10.1007/s11356-022-23160-z
Pata, U. K., Destek, M. A., Manga, M., and Cengiz, O. (2023b). Militarization of NATO countries sparks climate change? Investigating the moderating role of technological progress and financial development. J. Clean. Prod. 409, 137241. doi:10.1016/j.jclepro.2023.137241
Pata, U. K., Kartal, M. T., Erdogan, S., and Sarkodie, S. A. (2023c). The role of renewable and nuclear energy R&D expenditures and income on environmental quality in Germany: scrutinizing the EKC and LCC hypotheses with smooth structural changes. Appl. Energy 342, 121138. doi:10.1016/j.apenergy.2023.121138
Pata, U. K., and Kartal, M. T. (2023). Impact of nuclear and renewable energy sources on environment quality: testing the EKC and LCC hypotheses for South Korea. Nucl. Eng. Technol. 55 (2), 587–594. doi:10.1016/j.net.2022.10.027
Pata, U. K., and Samour, A. (2022). Do renewable and nuclear energy enhance environmental quality in France? A new EKC approach with the load capacity factor. Prog. Nucl. Energy 149, 104249. doi:10.1016/j.pnucene.2022.104249
Pata, U. K., and Tanriover, B. (2023). Is the load capacity curve hypothesis valid for the top ten tourism destinations?. Sustainability 15, 960. doi:10.3390/su15020960
Pata, U. K., and Yurtkuran, S. (2023). Is the EKC hypothesis valid in the five highly globalized countries of the European Union? An empirical investigation with smooth structural shifts. Environ. Monit. Assess. 195 (1), 17–33. doi:10.1007/s10661-022-10660-1
Peeters, P., and Papp, B. (2023) Envisioning Tourism in 2030 and Beyond. The changing shape of tourism in a decarbonising world Bristol, England: The Travel Foundation.
Pesaran, M. H. (2007). A simple panel unit root test in the presence of cross-section dependence. J. Appl. Econ. 22, 265–312. doi:10.1002/jae.951
Pesaran, M. H. (2004). General diagnostic tests for cross section dependence in panels. IZA Discussion Paper No. 1240. Institute for the Study of Labor (IZA). doi:10.2139/ssrn.572504
Pesaran, M. H., Shin, Y., and Smith, R. J. (2001). Bounds testing approaches to the analysis of level relationships. J. Appl. Econom. 16 (3), 289–326. doi:10.1002/jae.616
Pesaran, M. H., and Yamaga, T. (2008). Testing slope homogeneity in large panels. J. Econ. 142, 50–93. doi:10.1016/j.jeconom.2007.05.010
Petrović, P., and Lobanov, M. M. (2020). The impact of R&D expenditures on CO2 emissions: evidence from sixteen OECD countries. J. Clean. Prod. 248, 119187. doi:10.1016/j.jclepro.2019.119187
Radmehr, R., Henneberry, S. R., and Shayanmehr, S. (2021). Renewable energy consumption, CO2 emissions, and economic growth nexus: a simultaneity spatial modeling analysis of EU countries. Struct. Change Econ. Dyn. 57, 13–27. doi:10.1016/J.STRUECO.2021.01.006
Rahman, A. R. A., Shaari, M. S., Masnan, F., and Esquivias, M. A. (2022a). The impacts of energy use, tourism and foreign workers on CO2 emissions in Malaysia. Sustainability 14 (4), 2461. doi:10.3390/su14042461
Rahman, M. H., Voumik, L. C., Islam, M. J., Halim, M. A., and Esquivias, M. A. (2022b). Economic growth, energy mix, and tourism-induced EKC hypothesis: evidence from top ten tourist destinations. Sustainability 14 (24), 16328. doi:10.3390/su142416328
Raihan, A., Muhtasim, D. A., Pavel, M. I., Faruk, O., and Rahman, M. (2022). Dynamic impacts of economic growth, renewable energy use, urbanization, and tourism on carbon dioxide emissions in Argentina. Environ. Process. 9 (2), 38. doi:10.1007/s40710-022-00590-y
Raihan, A., Pavel, M. I., Muhtasim, D. A., Farhana, S., Faruk, O., and Paul, A. (2023). The role of renewable energy use, technological innovation, and forest cover toward green development: evidence from Indonesia. Innovation Green Dev. 2 (1), 100035. doi:10.1016/j.igd.2023.100035
Rasool, H., Maqbool, S., and Tarique, M. (2021). The relationship between tourism and economic growth among BRICS countries: a panel cointegration analysis. Future Bus. J. 7 (1), 1–11. doi:10.1186/s43093-020-00048-3
Razzaq, A., Fatima, T., and Murshed, M. (2023). Asymmetric effects of tourism development and green innovation on economic growth and carbon emissions in Top 10 GDP Countries. J. Environ. Plan. Manag. 66 (3), 471–500. doi:10.1080/09640568.2021.1990029
Salahodjaev, R., Sharipov, K., Rakhmanov, N., and Khabirov, D. (2022). Tourism, renewable energy and CO2 emissions: evidence from Europe and Central Asia. Environ. Dev. Sustain. 24 (11), 13282–13293. doi:10.1007/s10668-021-01993-x
Saqib, N., Usman, M., Radulescu, M., Sinisi, C. I., Secara, C. G., and Tolea, C. (2022). Revisiting EKC hypothesis in context of renewable energy, human development and moderating role of technological innovations in E-7 countries?. Front. Environ. Sci. 10, 1077658. doi:10.3389/fenvs.2022.1077658
Sarkodie, S. A. (2018). The invisible hand and EKC hypothesis: what are the drivers of environmental degradation and pollution in Africa?. Environ. Sci. Pollut. Res. 25 (22), 21993–22022. doi:10.1007/s11356-018-2347-x
Satrovic, E., and Adedoyin, F. F. (2023). The role of energy transition and international tourism in mitigating environmental degradation: evidence from SEE countries. Energies 16 (2), 1002. doi:10.3390/en16021002
Selcuk, M., Gormus, S., and Guven, M. (2021). Do agriculture activities matter for environmental Kuznets curve in the Next Eleven countries?. Environ. Sci. Pollut. Res. 28 (39), 55623–55633. doi:10.1007/s11356-021-14825-2
Selvanathan, E. A., Jayasinghe, M., and Selvanathan, S. (2021). Dynamic modelling of inter-relationship between tourism, energy consumption, CO2 emissions and economic growth in South Asia. Int. J. Tour. Res. 23 (4), 597–610. doi:10.1002/jtr.2429
Selvanathan, S., Jayasinghe, M. S., Selvanathan, E. A., Abbas, S. A., and Iftekhar, M. S. (2023). Energy consumption, agriculture, forestation and CO2 emission nexus: an application to OECD countries. Appl. Econ. 55 (37), 4359–4376. doi:10.1080/00036846.2022.2128296
Shafik, N., and Bandyopadhyay, S. (1992). Economic growth and environmental quality: time-series and cross-country evidence. Washington, D C, USA: World Bank Publications.
Shah, M. H., De Chun, H., Wang, Y., Ullah, I., Hassan, S. T., and Fareed, Z. (2023). Analyzing nexus between economic complexity, renewable energy, and environmental quality in Japan: a new evidence from QARDL approach. Int. J. Energy Res., 1683231. doi:10.1155/2023/1683231
Shah, S. A. R., Balsalobre-Lorente, D., Radulescu, M., Zhang, Q., and Hussain, B. (2022). Revising the tourism-induced environment Kuznets curve hypothesis in top 8 Asian economies: the role of ICT and renewable energy consumption. J. Hosp. Tour. Technol. 14 (3), 1–14. doi:10.1108/JHTT-02-2022-0064
Shahzadi, I., Yaseen, M. R., Khan, M. T. I., Makhdum, M. S. A., and Ali, Q. (2022). The nexus between research and development, renewable energy and environmental quality: evidence from developed and developing countries. Renew. Energy 190, 1089–1099. doi:10.1016/j.renene.2021.10.050
Shang, Y., Razzaq, A., Chupradit, S., An, N. B., and Abdul-Samad, Z. (2022). The role of renewable energy consumption and health expenditures in improving load capacity factor in ASEAN countries: exploring new paradigm using advance panel models. Renew. Energy 191, 715–722. doi:10.1016/j.renene.2022.04.013
Sharif, A., Godil, D. I., Xu, B., Sinha, A., Khan, S. A. R., and Jermsittiparsert, K. (2020). Revisiting the role of tourism and globalization in environmental degradation in China: fresh insights from the quantile ARDL approach. J. Clean. Prod. 272, 122906. doi:10.1016/j.jclepro.2020.122906
Sheytanova, T. (2014). The accuracy of the Hausman test in panel data: a Monte Carlo study Master Thesis. Sweden: Örebro University School of Business.
Simionescu, M., Păuna, C. B., and Niculescu, M. D. V. (2021). The relationship between economic growth and pollution in some new European Union member states: a dynamic panel ARDL approach. Energies 14 (9), 2363. doi:10.3390/en14092363
Singgalen, Y. A., Laturiuw, A. K., Puspitarini, T., and Insani, Z. A. P. (2023). Community participation in tourism development in the village: examining from subang district, Indonesia. J. Studi Sosial. Dan. Polit. 7 (1), 105–118. doi:10.19109/jssp.v7i1.14737
Sinha, A., Sengupta, T., and Alvarado, R. (2020). Interplay between technological innovation and environmental quality: formulating the SDG policies for next 11 economies. J. Clean. Prod. 242, 118549. doi:10.1016/j.jclepro.2019.118549
Suki, N. M., Suki, N. M., Sharif, A., Afshan, S., and Jermsittiparsert, K. (2022). The role of technology innovation and renewable energy in reducing environmental degradation in Malaysia: a step towards sustainable environment. Renew. Energy 182, 245–253. doi:10.1016/j.renene.2021.10.007
Sun, X., Chenggang, Y., Khan, A., Hussain, J., and Bano, S. (2021). The role of tourism, and natural resources in the energy-pollution-growth nexus: an analysis of belt and road initiative countries. J. Environ. Plan. Manag. 64 (6), 999–1020. doi:10.1080/09640568.2020.1796607
Tenaw, D., and Beyene, A. D. (2021). Environmental sustainability and economic development in sub-Saharan Africa: a modified EKC hypothesis. Renew. Sustain. Energy Rev. 143, 110897. doi:10.1016/j.rser.2021.110897
Tian, X. L., Bélaïd, F., and Ahmad, N. (2021). Exploring the nexus between tourism development and environmental quality: role of Renewable energy consumption and Income. Struct. Change Econ. Dyn. 56, 53–63. doi:10.1016/j.strueco.2020.10.003
Uche, E., Das, N., and Bera, P. (2023). Re-examining the environmental Kuznets curve (EKC) for India via the multiple threshold NARDL procedure. Environ. Sci. Pollut. Res. 30 (5), 11913–11925. doi:10.1007/s11356-022-22912-1
Ullah, S., Nadeem, M., Ali, K., and Abbas, Q. (2022). Fossil fuel, industrial growth and inward FDI impact on CO2 emissions in Vietnam: testing the EKC hypothesis. Manag. Environ. Qual. An Int. J. 33 (2), 222–240. doi:10.1108/MEQ-03-2021-0051
Ullah, S., Ozturk, I., Majeed, M. T., and Ahmad, W. (2021). Do technological innovations have symmetric or asymmetric effects on environmental quality? Evidence from Pakistan. J. Clean. Prod. 316, 128239. doi:10.1016/j.jclepro.2021.128239
Usman, M., Anwar, S., Yaseen, M. R., Makhdum, M. S. A., Kousar, R., and Jahanger, A. (2022). Unveiling the dynamic relationship between agriculture value addition, energy utilization, tourism and environmental degradation in South Asia. J. Public Aff. 22 (4), e2712. doi:10.1002/pa.2712
Villanthenkodath, M. A., Mahalik, M. K., and Arafath, K. M. I. Y. (2022). The role of tourism development in India's environmental degradation: evidence from ARDL and wavelet coherence approaches. Manag. Environ. Qual. An Int. J. 33 (6), 1421–1438. doi:10.1108/MEQ-10-2021-0248
Voumik, L. C., Rahman, M., and Akter, S. (2022). Investigating the EKC hypothesis with renewable energy, nuclear energy, and R&D for EU: fresh panel evidence. Heliyon 8, 12447. doi:10.1016/j.heliyon.2022.e12447
Voumik, L. C., Sultana, R., and Dey, R. (2023). Going away or getting green in BRICS: investigating the EKC hypothesis with human capital index, nuclear energy, urbanization, and service sectors on the environment. World Dev. Sustain. 2, 100060. doi:10.1016/j.wds.2023.100060
Wang, Q., and Wang, S. (2019). Decoupling economic growth from carbon emissions growth in the United States: the role of research and development. J. Clean. Prod. 234, 702–713. doi:10.1016/j.jclepro.2019.06.174
Wang, Q., and Zhang, F. (2020). Does increasing investment in research and development promote economic growth decoupling from carbon emission growth? An empirical analysis of BRICS countries. J. Clean. Prod. 252, 119853. doi:10.1016/j.jclepro.2019.119853
Wang, W., Rehman, M. A., and Fahad, S. (2022). The dynamic influence of renewable energy, trade openness, and industrialization on the sustainable environment in G-7 economies. Renew. Energy 198, 484–491. doi:10.1016/j.renene.2022.08.067
Wang, Y., and Huang, Y. (2022). Impact of foreign direct investment on the carbon dioxide emissions of East Asian Countries based on a panel ARDL method. Front. Environ. Sci. 10, 937837. doi:10.3389/fenvs.2022.937837
Wei, L., and Ullah, S. (2022). International tourism, digital infrastructure, and CO2 emissions: fresh evidence from panel quantile regression approach. Environ. Sci. Pollut. Res. 29 (24), 36273–36280. doi:10.1007/s11356-021-18138-2
Wei, Z., and Lihua, H. (2023). Effects of tourism and eco-innovation on environmental quality in selected ASEAN countries. Environ. Sci. Pollut. Res. 30, 42889–42903. doi:10.1007/s11356-021-17541-z
World Bank (2023). World development indicators. https://data.worldbank.org/.
World Tourism Organization (UNWTO) (2023). EU Guidebook on sustainable tourism for development. https://www.unwto.org.
World Travel & Tourism Council (2022). Travel & tourism economic impact global trends 2022. https://wttc.org/Portals/0/Documents/Reports/2022/EIR2022-Global%20Trends.pdf.
Xiangyu, S., Jammazi, R., Aloui, C., Ahmad, P., and Sharif, A. (2021). On the nonlinear effects of energy consumption, economic growth, and tourism on carbon footprints in the USA. Environ. Sci. Pollut. Res. 28, 20128–20139. doi:10.1007/s11356-020-12242-5
Xu, Q., and Khan, S. (2023). How do R&D and renewable energy consumption lead to carbon neutrality? Evidence from G-7 Economies. Int. J. Environ. Res. Public Health 20 (5), 4604. doi:10.3390/ijerph20054604
Yassin, J., and Aralas, S. (2020). The service sector and carbon emission nexus: revisiting environmental Kuznets curve. J. Ekon. Malays. 54 (2), 113–124. doi:10.17576/JEM-2020-5402-10
Yilanci, V., and Pata, U. K. (2020). Investigating the EKC hypothesis for China: the role of economic complexity on ecological footprint. Environ. Sci. Pollut. Res. 27 (26), 32683–32694. doi:10.1007/s11356-020-09434-4
Yu, J., Tang, Y. M., Chau, K. Y., Nazar, R., Ali, S., and Iqbal, W. (2022). Role of solar-based renewable energy in mitigating CO2 emissions: evidence from quantile-on-quantile estimation. Renew. Energy 182, 216–226. doi:10.1016/j.renene.2021.10.002
Zeraibi, A., Ahmed, Z., Shehzad, K., Murshed, M., Nathaniel, S. P., and Mahmood, H. (2022). Revisiting the EKC hypothesis by assessing the complementarities between fiscal, monetary, and environmental development policies in China. Environ. Sci. Pollut. Res., 1–16. doi:10.1007/s11356-021-17288-7
Zha, J., Tan, T., Yuan, W., Yang, X., and Zhu, Y. (2020). Decomposition analysis of tourism CO2 emissions for sustainable development: a case study of China. Sustain. Dev. 28 (1), 169–186. doi:10.1002/sd.1980
Zhan, Z., Ali, L., Sarwat, S., Godil, D. I., Dinca, G., and Anser, M. K. (2021). A step towards environmental mitigation: do tourism, renewable energy and institutions really matter? A QARDL approach. Sci. Total Environ. 778, 146209. doi:10.1016/j.scitotenv.2021.146209
Zhang, S., and Liu, X. (2019). The roles of international tourism and renewable energy in environment: new evidence from Asian countries. Renew. Energy 139, 385–394. doi:10.1016/J.RENENE.2019.02.046
Zhang, T., Yin, J., Li, Z., Jin, Y., Ali, A., and Jiang, B. (2023). A dynamic relationship between renewable energy consumption, nonrenewable energy consumption, economic growth and CO2 emissions: evidence from Asian emerging economies. Front. Environ. Sci. 10, 1092196. doi:10.3389/fenvs.2022.1092196
Keywords: environmental degradation, CO2 emissions, tourism, renewable energy, research and development, sustainable development
Citation: Balli E, Cengiz O, Koca Balli AI and Akar BG (2023) Analyzing the nexus between tourism and CO2 emissions: the role of renewable energy and R&D. Front. Environ. Sci. 11:1257013. doi: 10.3389/fenvs.2023.1257013
Received: 11 July 2023; Accepted: 09 October 2023;
Published: 26 October 2023.
Edited by:
Mobeen Ur Rehman, Shaheed Zulfikar Ali Bhutto Institute of Science and Technology (SZABIST), United Arab EmiratesCopyright © 2023 Balli, Cengiz, Koca Balli and Akar. This is an open-access article distributed under the terms of the Creative Commons Attribution License (CC BY). The use, distribution or reproduction in other forums is permitted, provided the original author(s) and the copyright owner(s) are credited and that the original publication in this journal is cited, in accordance with accepted academic practice. No use, distribution or reproduction is permitted which does not comply with these terms.
*Correspondence: Orhan Cengiz, b2NlbmdpekBjdS5lZHUudHI=