 Tim Wilkinson1
 Ida Järlskog2
 Juliana Aristéia de Lima1
 Mats Gustafsson2
 Karin Mattsson1
 Yvonne Andersson Sköld2
 Martin Hassellöv1*
- 1Department of Marine Sciences, Kristineberg Marine Research Station, University of Gothenburg, Fiskebäckskil, Sweden
- 2Department of Society, Environment, and Transport, Swedish National Road and Transport Research Institute (VTI), Linköping, Sweden
There is mounting evidence that tire wear particles can harm natural systems, but worldwide trends in car weight and car usage, mean emissions are set to increase. To control tire wear emissions and help understand fate and transport, detailed characterisation of the particles, and the relationship between road surface properties and emission profiles is needed. This study deployed a suite of experiments utilising the advanced road simulator of the Swedish National Road and Transport Research Institute to compare seasonal tire types from three brands. An extraction method was developed for a coarse (>30 µm) fraction of tire and road wear particles (TRWP), and a comprehensive physicochemical characterisation scheme applied to both TRWP and tire-tread, including microscopy, energy-dispersive X-ray spectroscopy and pyrolysis-GC/MS. Road simulator dusts and hand-picked TRWP showed differences in shape, numbers, and mass between tire types and brands, and between asphalt and cement concrete road surfaces. Contrary to accepted perceptions, tactile analyses revealed that firm-elastic TRWP comprised only a minor proportion of TRWP. Fragile and chemically distinct tire-road-derived particles, termed here sub-elastic TRWP, comprised 39–100% of TRWP. This finding raises urgent questions about overall TRWP classification and identification features, resistance to weathering, and environmental fate. At the same time, differences in TRWP generation between tire formulations, and road surfaces, show potential for controlling emissions to reduce global impacts.
1 Introduction
Estimates suggest tire wear comprises 50–75% of microplastic emissions (Schwarz et al., 2023), equivelent to 0.6–5.5 kg/capita of tire wear per year (Baensch-Baltruschat et al., 2020), resulting in global emissions of approximately 3.4‒6 million tonnes/year (Kole et al., 2017). Staggering as these theoretical estimates are, the scale of TRWP emissions seems only set to grow in coming decades, with a forecasted increase of 1% annually in driven person-kilometres, and 1.9% annually in ton-kilometres driven by goods vehicles, up to 2040, coupled with a trend for increasing private car weight (Andersson-Sköld et al., 2020; Beddows and Harrison, 2021).
Tire and road wear particles (TRWP), formed by amalgamation of tire and road-derived constituents during interaction between tire and road surface, have a higher density than most microplastics. This is expected to affect their behaviour during air- or water-borne dispersal in the environment. An airborne fraction, normally considered in terms of its contribution to airborne particulate matter (PM), comprise only a small mass proportion of total tread emissions. For example, Panko et al. (2013) estimated 0.3%–0.7% of tread mass is released in the PM10 size fraction. Dispersal of the coarse fraction depends partly on the design of stormwater runoff and treatment infrastructure, and potential agricultural application of sewage digestates (Öling-Wärnå et al., 2023). However, on rural roads, a substantial proportion of TRWP may be deposited in roadside soil by vehicle-generated turbulence or water spray (Baensch-Baltruschat et al., 2020). For initiation of transport via runoff, Unice et al. (2019) found that rainfall events of 5 mm/d were required to mobilise the bulk of road-surface TRWP, suggesting that accumulated TRWP loads have the potential to arrive at wastewater treatment plants, or surface waters, in bursts. Where current velocities decrease, sedimentation may occur quickly, restricting TRWP dispersal through lentic or marine systems. Recently, Mattsson et al. (2023) showed TRWP accumulations in sea fjord sediments adjacent to an industrial town, but with a steeply declining concentration gradient, over several km, away from the source.
The potential for TRWP, or associated leachates, to affect mortality in aquatic organisms including salmonids and Daphnia has been demonstrated in Brinkmann et al. (2022), Siddiqui et al. (2022), Tian et al. (2020), Halle et al. (2021), Gualtieri et al. (2005a and c), while DNA damage and reactive oxygen species (ROS) formation in human airway cells was shown in Gualtieri et al. (2005b and c) and Gualtieri et al. (2008). Affects on mortality of soil meiofauna were demonstrated in Kim et al. (2021). Their potential toxicity has been further debated in, e.g., Kreider et al. (2020) and Panko et al. (2013). Despite a growing knowledgebase, consensus about TRWP as an environmental and health risk is still lacking. Given their predicted scale as a pollutant, comprehensive knowledge on their generation, chemical composition, form, ecotoxicology, and environmental fate, are clearly needed to understand, model, and mitigate potential impacts.
Tire formulations vary between brands and intended use. The tread can be around 40%–60% rubber, typically including plant-based polyisoprene rubber (PIP) with synthetic rubbers; mainly polybutadiene (PBD), and a styrene-butadiene copolymer (SBR) in binary (e.g., PIP/PBD, PIP/SBR) or ternary (e.g., PIP/SBR/PBD) blends (Kaliyathan et al., 2019). Tread physical and mechanical properties are sensitive to small variations in polymer proportions (Motiee et al., 2013). The remaining mass is comprised of organic or inorganic reinforcing fillers, such as carbon black (C), silica (SiO2), zinc oxide (ZnO), sulphur (S), as well as oils and diverse additives (Sundt et al., 2014; Sommer et al., 2018; Wagner et al., 2018).
Asphalt road surface derived TRWP constituents, assumed by Sommer et al. (2018), to originate partly from the stone aggregate of the road surface, have been found to include minerals (quartz, plagioclase, orthoclase, ferromagnesian silicates, calcite, gypsum, and barite) and metals (Fe, Fe alloy, and Cu). Additionally, the elements Zn, Ti, Mg, Mo, W, S, and Cl, have been measured in TRWP encrustations (Sommer et al., 2018). Bitumen, a viscoelastic binding agent used in asphalt road surfaces, has been suggested as a constituent (binder) of road-wear particles (RWP) generated from the road surface (Sommer et al., 2018).
Tire material can be released into the environment from the mechanical abrasion of tires with the road surfaces, or by volatilization, shown to result in the generation of nano-particle condensates (Park et al., 2017). In addition to driving behaviour, TRWP generation is influenced by factors such as tire characteristics, the size and weight of the vehicle, the road surface conditions, the vehicle/wheel conditions (e.g., wheel settings and tire pressure) and whether studded tires are in use or not, e.g., Pohrt (2019). Data on parameters such as size distribution and form, in relation to different vehicle and tire types, road surfaces and driving speeds, are needed to assess the impact of TRWP on natural systems (Wagner et al., 2018).
Individual TRWP are hard to measure in environmental samples, either visually or spectroscopically, due to their black colour and complex composition (Rødland et al., 2023). Marker-based analytical methods (e.g., Unice et al., 2012; Klöckner et al., 2019) have been used to quantify cryogenically generated tire particles. Zn has been proposed, but it’s specificity to tire wear is in question, since Zn can be emitted from other traffic-related sources (e.g., de-icing salts, road barriers, galvanized metal in cars, brake wear and road markings) (Unice et al., 2013; Wagner et al., 2018), buildings (Folkeson, 2005; Ma et al., 2021), and industry (Padoan et al., 2017). Benzothiazoles, such as 2-(4-morpholinyl) benzothiazole (24MoBT) and N-cyclohexyl-2-benzothiazolamine (NCBA), both components of vulcanization accelerators, have also been used as markers, with the qualifiers that NCBA appears to be less stable than 24MoBT, benzothiazoles are biologically transformed under aerobic conditions, and leakage of antifreeze in car radiators is another possible source of both substances (Kumata et al., 2002). Marker-based methods are also limited by variation in the marker content of different tire treads, the potential for conventional markers to be washed out during weathering, and the commercial availability of standards for recently developed markers (Ding et al., 2023). Due to the analytical difficulties, several previously published microplastics studies have explicitly stated that TRWP were excluded from their analyses, e.g., Liu et al. (2019), while differences in sampling techniques, sample preparations and analytical methods, have reduced the comparability of studies utilising tire particles generated in different ways (Knight et al., 2020; Mattonai et al., 2022).
A challenge for analytical method development and validation has been the difficulty of obtaining quantities of realistic simulated tire wear particles, i.e., with characteristics close to those released to the environment. Previously, methods such as abrasion with sandpaper, chopping with a blade, or cryo-fragmentation have been employed to obtain test material (Kreider et al., 2009; Knight et al., 2020). The current study utilises a large, state-of-the-art road simulator, modified for particle collection (Figure 1), to generate TRWP under reproducible conditions.
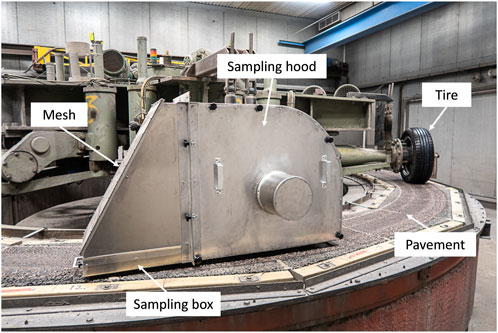
FIGURE 1. The VTI road simulator with the sampling hood mounted on one of the wheels. Photo: Mats Gustafsson, VTI, in (Mattsson et al., 2023).
In a previous article, we related black elastomers in marine sediments to road simulator TRWP, and compared the chemical formulation, and rubber hardness of a selection of tires of different types as well as aspects of their wear profiles (Mattsson et al., 2023). Here we expand on that study with a detailed comparison of TRWP generation and physicochemical characteristics between tire formulations and road surfaces, aiming to bridge knowledge gaps in: 1) variation in TRWP generation and physicochemical properties between tire brands and seasonal types 2) the relationship between tire tread chemical composition and TRWP properties, generation, and numbers, 3) chemical differences between tread and associated TRWP, 4) the influence of road surface type on TRWP generation and properties.
2 Materials and methods
A suite of complementary identification and physicochemical characterization methods and associated sample preparation schemes have been explored and optimized for the tread and TRWP analysis. Detailed method descriptions are given in the Supplementary Material.
2.1 Sampling (materials and conditions)
The Swedish National Road and Transport Research Institute (VTI) road simulator consists of four wheels that run on a 15 m long circular track (Figure 1) (Gustafsson et al., 2009). An aluminium sampling hood, mounted over one of the wheels, directs an airflow over the region of contact between tire and road surface, and out of the hood through a mesh in the back, that carries particles into a box behind the hood (Figure 1).
The nine tire types evaluated were premium models from among the most common in Sweden (Table 1). For all three brands, the studless winter tires were of the soft and siped Nordic type. All nine tire types were driven on a simulated road surface of typical Nordic stone mastic asphalt (SMA) with granite and quartzite as main aggregates. For comparison, one of the studless-winter tire brands, and two of the summer tire brands, were also driven on a mixed-cement concrete surface with two different granites as main aggregates.
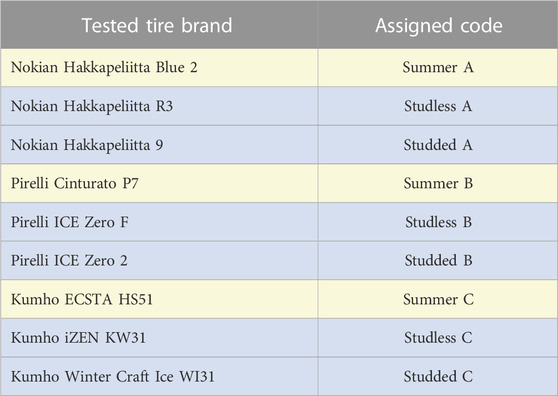
TABLE 1. To compare tire formulation, and TRWP generation and physicochemical properties, sets of four summer, studded-winter and studless-winter tires were chosen from three large manufacturers. Summer tires are indicated by yellow, and winter tires by blue fill. The assigned codes are hereon used in place of the brand name.
Tires were run at 50 km/h for 4 h, amounting to approximately 200 km per test (apart from a test drive with summer tire A on a concrete surface at 60 km/h for 7 h), at a start ambient temperature of 10°C, which was considered a realistic temperature that both summer and winter tires can be exposed to during usage. After each test-drive, particulate material from the collection hood was weighed and subsampled.
2.2 Sample preparation and analyses
Table 2 gives an overview of how different samples were analysed.
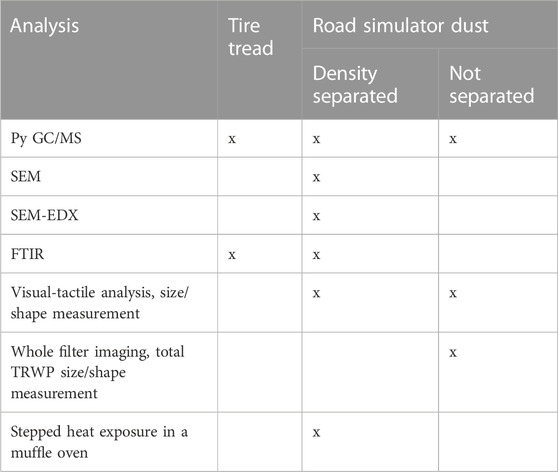
TABLE 2. Sample material and analysis summary.
2.2.1 Solvent cleaning
To prevent non-tire-derived black particles, such as bitumen and grease, from interfering with sample analyses, six degreasing agents and ten solvents were trialled under various conditions to optimise a sample cleaning step. Relative effectiveness was assessed by scoring post-treatment abundances of interfering black particles against an ACFOR scale (Supplementary Table S5). Subsequently, aliquots of road simulator dust were pre-cleaned with xylenes, as a first step, prior to all types of analysis.
2.2.2 Preliminary density separation tests
Recovery of a lower density TRWP fraction from aliquots of mixed summer and studless winter tire road simulator dust was optimised using zinc chloride solution densities of 1.3–1.6 g/mL (Supplementary Table S8; Supplementary Figure S1). Total TRWP silhouette area from the floating and sinking fractions of 50 mg summer tire A aliquots, in zinc chloride solution densities of 1.8 and 2.0 g/mL, was measured with the open-source software (Fiji Is Just) ImageJ 2.9.0.
2.2.3 Visual-tactile analysis
Following a comparative trial of visual-only and visual-tactile analysis (Supplementary Material, Section 2.5), a visual-tactile approach (Karlsson et al., 2020) was adopted to distinguish tire-derived from non-tire-derived black particles, and to explore tactile differences between TRWP in eight of the asphalt-surface, and three of the cement concrete-surface, road simulator dust samples. Dust aliquots for visual-tactile TRWP analysis, were prepared by density separation in zinc chloride solution, optimised at 1.55 g/cm3 to extract a lower density TRWP fraction (Supplementary Table S8). TRWP were collected on 47 mm Anodisks, which were subsampled using randomly assigned 5 mm grid squares until ≥50 target particles per aliquot were recorded. All black particles within the subsampled proportion of the filters were probed manually under a Leica M205 C dissection microscope, with Dumont No. 5 steel tweezers. Individual black particles were classified into two categories (Section 3.1) based on observed differences in the way they responded to tweezer pressure: 1) appearing soft and malleable with weak or no elasticity, for example, smearing without resistance into a smooth unbroken layer, or retaining a deep clear imprint of the tweezers, or alternatively appearing brittle or friable, for example, by breaking into angular pieces or crumbling into irregularly shaped dust, versus 2) appearing firm and springy or, as sometimes the case at the smaller end of the size range, being reluctantly rubbed into a network of attached strands, or many little rolls. Individual particle silhouettes were measured in ImageJ.
2.2.4 Whole-filter image segmentation analysis
Subsamples for whole-filter image analysis were solvent cleaned on stacked 26 and 100 µm steel meshes. Each size fraction was collected on one or more 25 or 47 mm Anodisks, permitting use of magnification appropriate to the particle size range (×5 objective for the 100 µm mesh-fraction, 10x for the 26 µm mesh-fraction). Whole-filter z-stacked circular image mosaics were captured using a Zeiss Axio Imager M2M light microscope. Prior to image analysis, ImageJ was used to manually paint over dark-coloured particles not considered TRWP (primarily fibres and mica-like crystals). Greyscale thresholding was applied to identify particle boundaries, and multiple size and shape parameters were measured for each particle silhouette, using a simple macro (Supplementary Material, Section 2.11) to increase speed and repeatability.
2.2.5 Estimation of particle volume and the tire-derived volume fraction
Estimation of particle volume using measurements obtained by light microscopy is a common approach, for example, to determine phytoplankton biovolume (Roselli et al., 2012). Here, the 3D ellipse-based formula (Eq. 1) of Mattsson et al. (2023) was applied, which to some extent takes into account the irregularity in TRWP form by incorporating measured TRWP Feret’s diameter and Feret’s minimum, silhouette area, and a mean relationship between TRWP height and minimum Feret’s (0.72, SD 0.24, n = 40) (Supplementary Material, Section 2.12).
where rx is particle Feret’s diameter/2, ry is particle silhouette-area/[π∙(particle Feret’s diameter/2)], rz is (0.72∙particle Feret’s minimum)/2.
Recognising that the calculated TRWP volume includes a substantial proportion of road-derived particles, an attempt was made to estimate the tire-derived volume fraction:
Where Vol ftire is the volume fraction of tire-derived material within the total TRWP volume, ρtotal is the assumed mean density of TRWP (here, 1.9 g/mL was used based on density separation tests in this study and the estimates of Unice et al. (2019); Vogelsang et al. (2019); Kayhanian et al. (2012); Kreider et al. (2009)). ρroad is the assumed mean density of the road-derived fraction (here, 2.5 g/mL was selected, since in this case it is assumed to largely derive from the granite aggregate, with relatively small assumed contributions from internal air-pockets and organic particulate material), and ρtire is an assumed mean density of tire tread (here 1.2 g/mL after Degaffe and Turner (2011)). Solved with these assumptions, equation 2 gave a tire-derived volume fraction of 0.46.
2.2.6 Pyrolysis gas chromatography/mass spectrometry (Py-GC/MS)
Py-GC/MS has been used for TRWP analysis in environmental samples, e.g., (Goßmann et al., 2021; Miller et al., 2022; Rødland et al., 2022; More et al., 2023; Rosso et al., 2023). In the present study, PIP and PBD were quantified in tire tread, road simulator dust samples, and collections of TRWP hand-picked from 47 mm filter disks, at Eurofins, Bergen (SM 2.13). Tread samples weighing 113–679 µg were cut from all nine tire types (excluding previously exposed tread surfaces). Tread samples from studless winter tire C, were submitted in triplicate. Two kinds of particulate sample were submitted: 1) discrete 450–860 µg hand-picked TRWP collections, from asphalt-generated summer and studless tire B road simulator dusts enriched by density separation in 1.55 g/cm3 zinc chloride solution, and 2) two studded and two summer tire (tires A and B) road simulator dust samples, prepared by size fractionation on 26, 63 and 125 µm steel meshes. Of these, studless winter tire B was submitted for Py-GC/MS, in triplicate. The remaining three (summer tires B and A, and studless tire A) were prepared in triplicate, but the triplicates within each sample were pooled before analysis. The limits of polymer quantification (LOQ) were 5 µg (pure polymer mass) for the particulate samples, and 1 µg for the cut tread samples.
2.2.7 Scanning electron microscopy (SEM) and energy-dispersive X-ray spectroscopy (SEM-EDX)
Firm- and sub-elastic TRWP from four road simulator dust samples (Summer A, Studded B, Studded C, and Studless C) were imaged using secondary and backscattered electron detectors (SM, Section 2.14). SEM-EDX line scans were measured across eleven sub-elastic and eleven firm-elastic TRWP, and mean (n = between 9 and 75 point measurements per line scan) values calculated for each of the 28 included elements. Averaging multiple point measurements reduced the influence of individual embedded mineral grains. SIMCA 17 (Sartorius, Göttingen, Germany) was used to perform principal component analysis (PCA-X) of the means and, based on the second principal component of the PCA-X score plot, a (2 class) orthogonal projections to latent structures-discriminant analysis (OPLS-DA) with non-contributing elements excluded. Additional firm- and sub-elastic TRWP were cryo-sectioned for elemental mapping.
2.2.8 FTIR
TRWP cryo-sections were analysed with a Thermo Scientific Nicolet iN10 infrared microscope, using transmission mode in a compression cell (SM, Section 2.14).
2.2.9 Tire hardness measurement
Tread hardness (Shore scale) was measured with a Bareiss HP II handheld hardness tester at 20°C.
2.2.10 TRWP heat exposure test
Six TRWP were photographed before and between a series of stepped 10-min heat exposures in a muffle oven. Between each exposure the temperature was increased by 50°C, starting at 150°C and finishing with 550°C.
3 Results and discussion
The results are discussed in four main sections to sequentially introduce the diverse and, in some cases, unexpected findings. During preliminary tests of the road simulator dust samples from the nine tested tire types, two different classes of suspected TRWP were distinguished by their visual-tactile characteristics and are introduced in Section 3.1. Rubber polymer composition, measured both in cut tire tread samples and in TRWP, revealed high variability between tire types, and unexpected differences between tires and their associated TRWP. Rubber polymer content not only confirmed the two classes of suspected TRWP to be tire-derived but highlighted compositional differences between them (Section 3.2). To further characterise the two TRWP classes, surface topography, elemental composition, density, aspect ratio and their relative generation on different road surfaces, were compared (Section 3.3). Two different methods (py-GC/MS and image segmentation analysis) were tested in parallel to estimate TRWP generation per vehicle km. Comparison between different types of tires and road surface revealed a substantial difference in TRWP mass per vehicle km between asphalt and cement concrete surfaces. Differences in TRWP quantity, form and size were apparent between tires designed for different seasons, and between brands, (Section 3.4), and are discussed in relation to the preceding results.
3.1 TRWP elasto-plasticity
Based on their visual-tactile response to manual probing, TRWP could be divided into two categories (Figure 2). When probed with tweezers, the most abundant type, in asphalt-generated road simulator dusts, were either brittle or friable, or could be smeared into an unbroken or broken film, which might slowly pull back towards its original form (Section 2.2.3, category 1). Such particles had little or no elasticity. Consequently, they are referred to here as sub-elastic TRWP. In road simulator dusts untreated with xylenes, sub-elastic TRWP could not reliably be distinguished from suspected bitumen-based particles, due to visual similarities in their response to probing. In contrast, a tiny minority of asphalt-generated TRWP felt firm and springy, rapidly regaining their original shape after probing (Section 2.2.3, category 2). This second category is hereon termed firm-elastic TRWP.
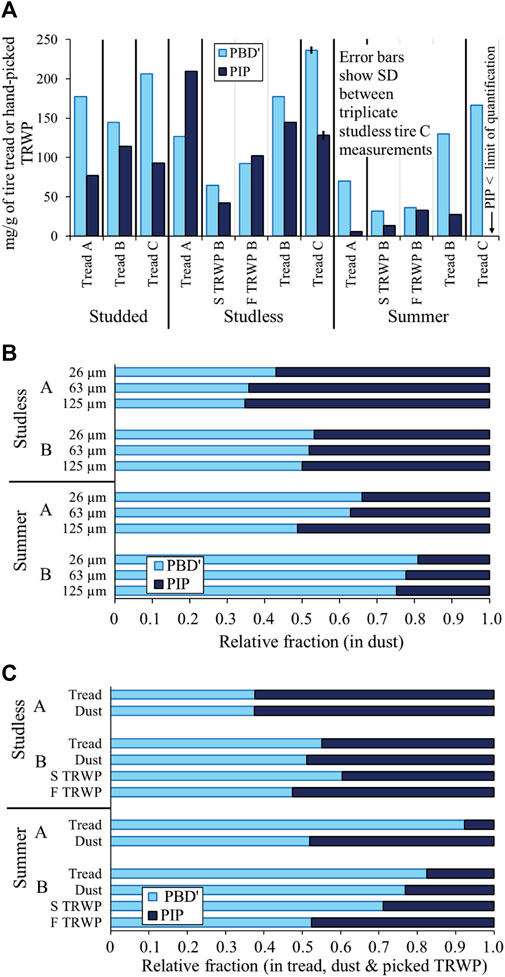
FIGURE 2. (A) Mass of PBD’ and PIP measured by py-GC/MS in cut-tire-tread samples, and in hand-picked firm-elastic TRWP (denoted F TRWP) and sub-elastic TRWP (denoted S TRWP) generated by Studless B and Summer B tires. Error bars show triplicate tread Studless C PBD’ and PIP measurement SD of 4.6 and 5.8 mg/g, respectively. (B) Relative fractions of PBD’:PIP in size-fractionated road simulator dust samples from two studless and two summer tire types (studless B PIP:PBD’ was measured in triplicate for each size fraction. Triplicate SDs were 0.022 for the 26 μm, 0.002 for the 63 μm, and 0.005 for the 125 µm fractions). (C) Relative fractions of PBD’:PIP in the tread of two studless and two summer tire types, compared to those measured in the associated road simulator dusts (triplicate studless B PIP:PBD’ relative fraction SD 0.0016), and to those in hand-picked collections of sub-elastic TRWP (denoted S TRWP) and firm-elastic TRWP (denoted F TRWP) from two tire types (error unmeasured).
3.2 Polymer composition
3.2.1 Tire tread polymer composition
Rubber polymer quantification in hand-cut tread samples from the tested tire types provided a framework for interpretation of polymer proportions measured in the associated road simulator dusts, or hand-picked TRWP samples. Based on qualitative detection of the SBR-specific marker 4-phenylcyclohexene, the presence of the synthetic polymer SBR was indicated in all three summer tires, as well as studded tires A and C. Since the marker (4-vinylcyclohexene) used to quantify PBD is also a pyrolysate of SBR, it was not possible to determine the extent to which measured butadiene mass derived from SBR copolymer, as opposed to pure PBD. Given this uncertainty, PBD’ is hereon used to denote butadiene mass quantified using 4-vinylcyclohexene calibrated against a pure PBD standard. PIP was quantified using dipentene. Mattsson et al. (2023) present results for FTIR-coupled thermogravimetric analysis (TGA) of the same tire types: the six winter tires were associated with higher proportions of carbon black, and the three summer tires with higher post-pyrolytic residuals, likely including inorganic fillers. TGA peak deconvolution estimates of the relative fraction of synthetic rubber (equivalent to PBD + SBR) generally mirrored, or were slightly lower than, py GC/MS PBD’ relative fractions. However, for the three summer tires, TGA-based estimates of both natural and synthetic rubber mass per gram of tread were substantially higher than PIP and PBD’ py GC/MS masses. At the subsample weights used for py-GC/MS analysis, PIP concentrations for the summer tire tread samples proved close to the 1 µg limit of quantification. In summer tire C, PIP (Figure 2A) was unquantifiable, but its presence (at <8.8 mg/g tread) was indicated in the analysed subsample. Overall polymer (PBD’ + PIP) concentrations (Figure 2A) in the summer tires were also relatively low, suggesting a high mass-proportion from fillers or other additives. PIP concentrations were noticeably higher in the six winter tires. In studless tire A, it was the dominant measured polymer. Overall (PBD’ + PIP) concentrations were highest in the three studless winter tires.
3.2.2 TRWP polymer composition
Relative to their parent tires, overall polymer (PBD’ + PIP) concentrations in TRWP were lower (Figure 2A). For sub-elastic TRWP, they ranged from 28% to 33% of overall concentrations in their parent tires. This probably reflects road-mineral intermixture, estimated to comprise 54% of TRWP volume (equation 2), equivalent (assuming a mineral density of 2.5 g/mL) to 71% of TRWP mass. For the sub-elastic TRWP collections, the balance of the two measured polymers in relation to their parent tires showed different tendencies; the studless winter tire TRWP had a lower relative fraction of PIP, while for the summer tire TRWP, it was higher. In contrast, the firm-elastic TRWP collections both had elevated relative fractions of PIP compared to their parent tires, to the extent that, in the studless tire TRWP, PIP had become the dominant measured polymer, while in the summer tire TRWP, PIP was measured at a higher concentration than that of the parent tread (Figure 2C). A related finding was reported by Chae and Choi (2022), who measured elevated PBD concentrations in a proportion of smaller (<212 µm mesh fraction) wear particles, compared to the original rubber blend, in this case, a PBD phase dispersed in a PIP matrix. They attributed these results to inhomogeneity of the blended rubber phases.
Between sub- and firm-elastic TRWP collections, overall (PBD’ + PIP) concentrations were lower in sub-elastic than in firm-elastic TRWP within the same tire type (Figure 2A). Again, this may at least partly reflect observed dilution by higher internal road-mineral intermixture (Figure 3C). Notably, the relative proportion of the two polymers differed between the two particle types. PIP concentrations in sub-elastic TRWP were only 39%–41% of those in firm-elastic TRWP from the same tire type, while PBD’ concentrations in sub-elastic TRWP were 70%–88% of those from firm-elastic TRWP within the same tire type (Figure 2A). Given the relatively poor phase morphology of PIP (Kaliyathan et al., 2019), it seems plausible that the relatively high measured concentration, or relative fraction (Figure 2C), of PIP in the rare firm-elastic TRWP, could point towards a formation mechanism associated with inhomogeneity of the dispersed phase (i.e., PIP) in the parent tread.
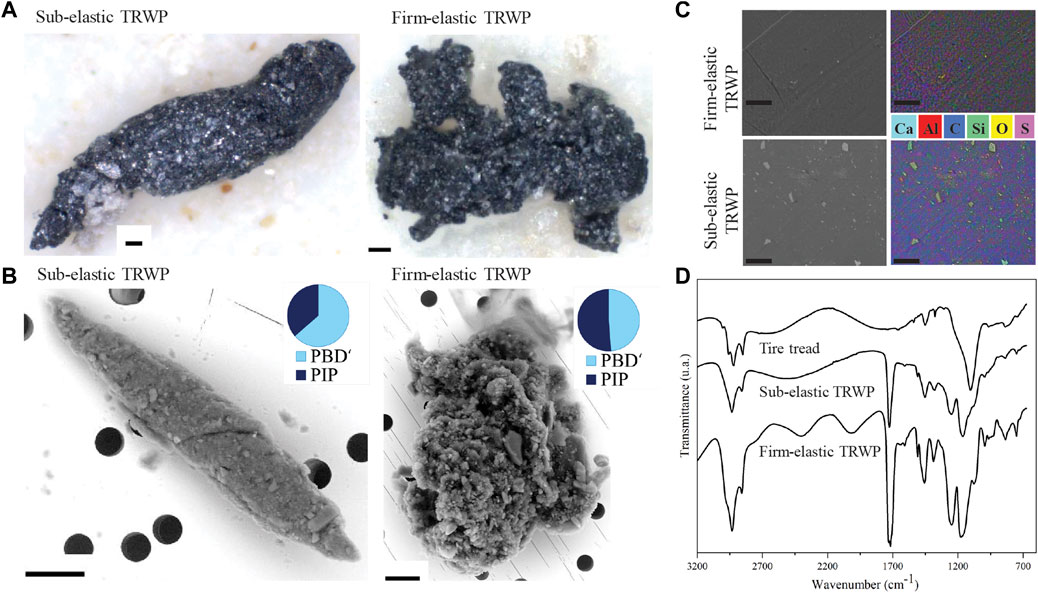
FIGURE 3. Sub-elastic and firm-elastic TRWP physicochemical properties (scale bars are 20 µm). (A) Light microscopy. (B) SEM-BSE images and measured polymer proportions (py-GC/MS). (C) SEM-BSE (left) and SEM-EDX (right) of sliced TRWP sections. (D) FTIR spectra of ultrathin TRWP slices.
Quantification of PIP and PBD’ in size-fractionated road simulator dusts (Figure 2B) revealed a consistent tendency; an increasing relative fraction of PIP:PBD’, with increasing size fraction, for all four tested tire brands, but the mechanism was unclear. In the literature, PIP is considered to have excellent tensile properties and good crack growth resistance, derived from its tendency to crystallise under tensile deformation (Toki et al., 2000; Fang et al., 2014). If so, PIP-rich particles might simply better resist thermo-mechanical friction at the tire-road interface, and thereby be better represented in the larger TRWP size fractions. If this led to greater retention of PIP-rich particles on the 26 µm retaining mesh, it would also help to explain the measured reduction in PBD’ relative fraction in each of the four tested road simulator dust samples (from just 0.01 for studless tire A to 0.39 for summer tire A) relative to its parent tire (Figure 2C). Alternatively, the apparent deficit of PBD’ in the road simulator dusts could stem from chemical changes in organic tread surface constituents, recently shown to occur during tire use (Halle et al., 2021), or loss through heat mediated volatilisation, as measured by Park et al. (2017).
These first measurements of the difference in rubber polymer content between TRWP and their parent tires highlight a need for caution when using tire polymer concentrations to extrapolate TRWP mass in environmental samples. Though not within the scope of this study, more extensive measurements of TRWP polymer concentrations would provide a calibration standard for realistic estimation of TRWP mass in environmental samples.
3.3 Firm-elastic and sub-elastic TRWP
Occasionally, firm- and sub-elastic TRWP could be distinguished visually under a light microscope (LM) since the characteristic bobbly or knobbly outline or surface texture (Figure 3A right-hand image) was visible in a small proportion of the <300 µm firm-elastic TRWP fraction. Larger (300–2,000 µm) firm-elastic TRWP were sometimes knobbly too, but more often had a smooth, mat texture (Supplementary Figure 2J). FTIR spectra of both sub- and firm-elastic TRWP share absorbance bands of comparable intensity at 1,537 cm−1 (attributable to stretching vibration of a methyl-assisted conjugated double bond from natural/synthetic rubber) and 1,376 cm−1 (attributable to deformation from natural rubber) (Garcia et al., 2015) with virgin tire tread (Figure 3D), corroborating py-GC/MS evidence (Figure 2A) that both TRWP types are tire-derived. In contrast to virgin tire tread, the TRWP spectra show absorbance around 1,700 cm−1, possibly associated with oxidation or thermal degradation of the original constituents. SEM provided additional information on surface topography and composition, rendering smaller firm- and sub-elastic TRWP more frequently distinguishable. With the secondary electron detector, the surface topography of <300 µm firm-elastic TRWP, resembled the puffy form of a cumulus cloud (Figure 3B right-hand image, Supplementary Figure S2K, L). The often-smoother surface of very large (>300 µm) firm-elastic TRWP was more obvious under SEM (Supplementary Figure S2J). Subtle differences in mineral coatings between sub- and firm-elastic TRWP were also more clearly resolved with SEM; firm-elastic TRWP carried superficial mineral encrustations ranging from a light scattering (Supplementary Figure S2J) to a dense coverage (Supplementary Figure S2H). In contrast, the surface topography of sub-elastic TRWP (Figure 3B left-hand image, Supplementary Figures 2A, C, F), generally appeared smoother under SEM, although there were exceptions with more rugged surfaces (Supplementary Figure S2B). Visible mineral grains associated with sub-elastic TRWP were generally embedded in the surface (Supplementary Figure S2A, F) or incorporated into the particle body (Supplementary Figures S2B, C), rather than merely encrusted on the surface. Under the LM it was clear that a substantial proportion of the <300 µm sub-elastic TRWP took an elongated or “cigar-shaped” form with tapered extremities (Figure 3A left-hand image), while larger specimens (300–2,000 µm) were occasionally elongated, but more often irregularly shaped.
Where backscattered electrons (BSE) from sub- and firm-elastic TRWP are captured within the same field of view, the sausage- or cigar-shaped sub-elastic TRWP return a relatively bright and uniform signal, with little difference in contrast between the particle substance and embedded mineral grains, compared to firm-elastic TRWP in the same image (Supplementary Figures S2E, H, I). The uniform brightness of sub-elastic TRWP probably reflects their high intermixed mineral dust (and conversely low tire-derived organic) content, relative to firm-elastic TRWP.
This premise is supported by SEM/EDX mean (n = between 9 and 75) line scan measurements of firm-elastic (n = 11) versus sub-elastic (n = 11) TRWP (Figure 4). Principle component analysis of elemental values divides sub- and firm-elastic TRWP into two groups above and below the origin of the second principle component axis, driven by 13 of the 28 measured elements. In this model, 7 elements (O, K, Al, Ca, Na, Mg, and Fe) typically associated with road-surface minerals, drive separation into the sub-elastic group, while, 5 elements (C, Se, Br, S, and Zn) typically associated with tire rubber, drive separation into the firm-elastic group. These results are consistent with the lower rubber polymer concentration (Figure 2A) measured in sub-elastic compared to firm-elastic TRWP by py-GC/MS, and with observed sub-elastic TRWP internal mineral intermixture (Figure 3C). Using the same data, but with non-contributing elements removed, orthogonal projections to latent structures-discriminant analysis (OPLS-DA) based on the second principal component of the PCA-X model, discriminates firm elastic TRWP with a t[2] range of −2.4 to −0.3 from sub-elastic TRWP with a t[2] range of 0.1–2.6 (Supplementary Figure S3).
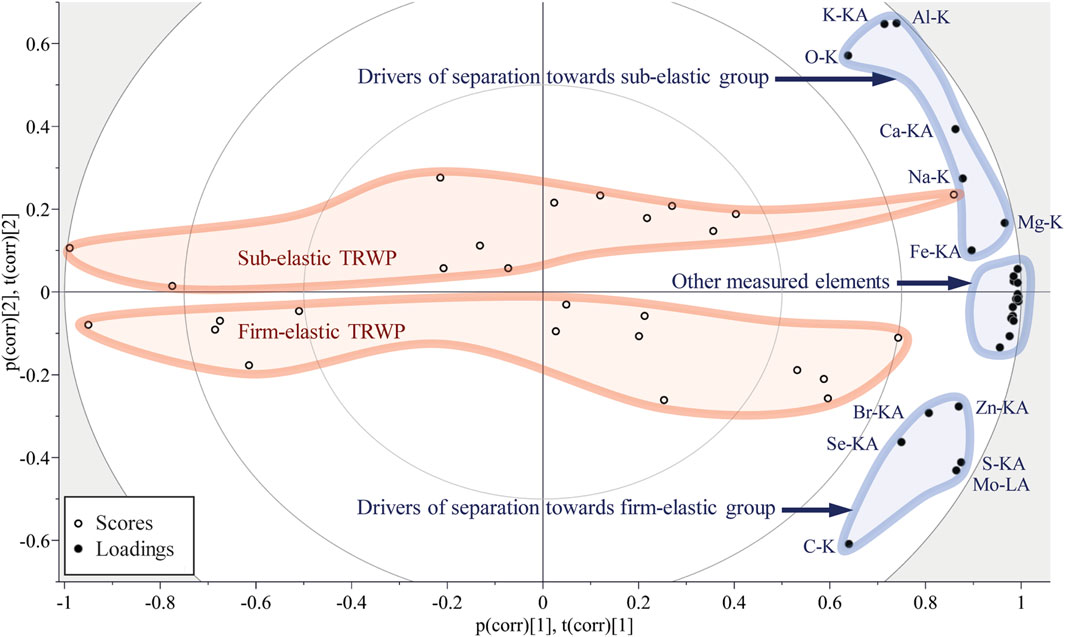
FIGURE 4. PCA-X model of mean SEM-EDX line scan measurements from 11x sub-elastic and 11x firm-elastic TRWP. Scores and loadings are combined after rescaling into a −1 to +1 numerical range. Observations situated near variables are high in these variables and low in variables situated opposite. R2x (component 1) = 0.832; R2x (component 2) = 0.0861.
SEM images of the sub-elastic road simulator TRWP, showing the elongate, smooth overall form, deeply embedded with minerals, closely resemble images published by Kovochich et al. (2021) of particles generated in a road simulator in the USA, by (Gao et al., 2022; Järlskog et al., 2022; Rausch et al., 2022) of urban TRWP collected in the USA, Sweden, and Switzerland, or by Kreider et al. (2009), of road simulator particles generated in Germany and of particles collected in a vehicle-mounted aspiration device on asphalt roads in France. The latter device especially, is likely to have sampled a comparable particle fraction to the airflow driven sampling hood of the circular track road simulator in this study.
To conclusively distinguish the majority of firm-from sub-elastic TRWP under the LM, it was necessary to manually probe them with tweezers. While the sub-elastic TRWP always failed to return quickly or completely to their original form, their tactile properties were by no means uniform. They ranged from soft and smeary to hard, brittle or crumbly. As reported by Rausch et al. (2022) for urban PM10 (airborne) TRWP, when smeared or crushed, sub-elastic TRWP were invariably internally intermixed with mineral grains throughout the body of the particle. Road simulator dusts from three tested summer tires (A, B and, to a lesser extent, C) contained a prominent fraction of large brittle sub-elastic TRWP. These large summer-tire-associated particles commonly had “fluid” forms (Supplementary Figures S2D, G), suggesting that they were not brittle at the time of particle formation. Large sub-elastic particles were also characteristic of studless tire B road simulator dust, but these were not brittle.
Preliminary density separation tests, focused on firm-elastic TRWP extraction, highlighted a density difference between firm-elastic TRWP and sub-elastic TRWP. Roughly equal numbers of firm-elastic TRWPs were found in the buoyant and sinking fractions in saturated brine (1.20 g/mL), and 1.30 g/mL zinc chloride solutions, indicating that a proportion of firm-elastic TRWP occupy the low end of the theoretical TRWP density spectrum, being instead closer to the density of shredded tire tread (around 1.2 g/mL (Degaffe and Turner, 2011), and carry lower mineral loads than the 50% average TRWP mass proposed by (Unice et al., 2019). An increase in solution density to 1.5 g/mL resulted in flotation of 94% of firm-elastic TRWP. Those firm-elastic TRWP remaining in the sinking fraction tended to be smaller particles, whose large surface-area:volume ratio could have resulted in higher proportional mineral encrustation. A further increase in solution density to 1.6 g/mL led to a visually estimated 20% increase in the proportion of TRWP, with no measured increase in firm-elastic TRWP, suggesting this density was above the range of firm-elastic TRWP, but matched that of a substantial proportion of sub-elastic TRWP. However, even with a solution density of 1.8 g/mL, extraction efficiency for overall (firm-elastic + sub-elastic) summer tire A TRWP was still only 14% (by 2D particle silhouette area) of the total. Raising the solution density to 2.0 g/mL saw a dramatic increase in extraction efficiency to 79%, suggesting that the majority of summer tire A TRWP generated in this study fell within this density range. These results suggest an even higher particle density thanestimated by Klöckner et al. (2019), who measured a >90% extraction of environmental TRWP, with a solution density 1.9 g/mL, based on SBR sediment concentrations. In light of these results, a solution density >2 g/mL, such as 2.1 g/mL (Vogelsang et al., 2019; Rasmussen et al., 2023) or 2.2 g/mL Kovochich et al. (2021), should be considered.
A difference in aspect ratio was evident between measured sub-elastic TRWP (n = 170, mean 2.48, SD 1.03) and firm-elastic TRWP (n = 111, mean 1.68, SD 0.48) from two studless winter tire road simulator dust samples, although the clusters overlap (Figure 5).
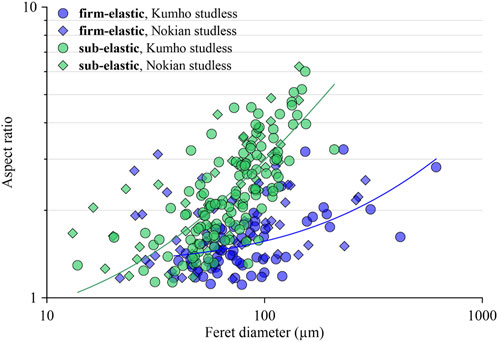
FIGURE 5. Aspect ratio:Feret’s diameter of firm-elastic TRWP compared to sub-elastic TRWP from two studless winter tire brands on asphalt.
Py-GC/MS analysis of the hand-picked sub-elastic TRWP collections, confirmed that they are, at least in part, tire derived. Concurrently, the dramatic reduction in the relative fraction of sub-elastic TRWP from three tire types when driven on cement concrete compared to asphalt surfaces indicated that road surface type may influence TRWP properties (Table 3).
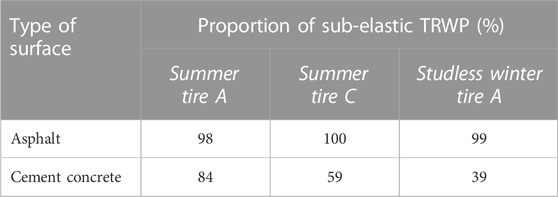
TABLE 3. Proportions of the total TRWP classified as sub-elastic by visual-tactile probing, generated by the three tire types tested on asphalt and cement concrete surfaces.
However, sub-elastic TRWP (which comprised the overwhelmingly dominant type on asphalt) do not appear to be dependent on bitumen as a binding agent, as postulated by Sommer et al. (2018). All particles were cleaned with xylenes, a fast-acting solvent of bitumen, prior to analyses (Section 2.2.1), while stepped heat exposure tests across the bitumen softening temperature range (Supplementary Figure S4) revealed no visible loss of TRWP form. Crucially, the presence of sub-elastic TRWP in tests with virgin tires on a cement concrete substrate confirmed that sub-elastic TRWP were generated in the absence of bitumen. It is likely that road surface texture, especially micro texture, influences TRWP generation, as it is a prerequisite for friction between the surfaces. Micro-texture is mainly a property of the aggregates of the pavement and its propensity for polishing, irrespective of whether it is bound by cement or bitumen, and will vary both with aggregate-type and season. In Nordic countries, wintertime usage of studded tires and traction sand increases micro-texture, while summer tire usage results in lower values, i.e., polishing, during summer.
The presence of TRWP with tactile characteristics falling along a continuous spectrum of elasto-plasticity, from firm rubbery elastomer to slightly elastic and non-elastic, greasy, crumbly, or brittle particles, was unexpected. In the road simulator dusts generated on asphalt; sub-elastic particles comprised 98.7–99.9% of TRWP. This contradicts conventional perceptions that tire wear particles can be detected in environmental material by their firm elastic tactile characteristics.
The mechanisms contributing to sub-elastic TRWP formation are unclear. Their fluid or rolled forms coupled with their soft or brittle consistency suggest they have undergone greater structural reformation compared to firm-elastic TRWP, while their internal mineral intermixture points towards recombination of mixed road- and tire-derived fine-micro or nano particles into larger hetero-agglomerations. The degree of slip between tire and road surface may be influential in accomplishing such reformation through kneading forces, coupled with higher temperatures, compared to little or no slip. Since the road simulator is constantly turning, slip is likely to be higher than that associated with real-world driving, potentially resulting in over-representation of sub-elastic TRWP.
Sub-elastic TRWP, as defined in this study, probably include a range of physicochemical compositions. The stepped heat exposure tests indicated up to three colours of oxidised residue at 550°C: grey, cream and orange (suggestive of iron-rich examples) (Supplementary Figure S4), indicative of differences even between four tested particles. None the less, it is a useful working classification given their distinctive common characteristics of relatively high density, fragility, and elongation.
3.4 TRWP variation between tire types and road surfaces
The open-source image segmentation analysis software, ImageJ, has previously been used for TRWP measurement in SEM images by Sommer et al. (2018). In the current study, it proved effective for batch measurement of multiple size and shape parameters from both individual particle LM images and >1,000-tile mosaics covering whole 47 mm Anodisk membranes. Multiparametric measurement, of tens of thousands of particles, could be accomplished in minutes, but the investment of time to acquire whole-filter multiple-focal-plane mosaics, and to paint over interfering dark particles was substantial, and a drawback of this approach.
A proportion of the black non-minerogenic particle selections defined by the software, consisted of black material engrained onto the surface, or embedded in crevices, of mineral crystals resulting in multiple small particle selections. TRWP heteroagglomerations of this kind, (which would not have been recovered by density separation) made it difficult to define individual TRWP and therefore introduced uncertainty into the quantification of TRWP numbers.
The greatest variation in the numbers of TRWP generated was between the three summer tire types and six winter tire types (Figure 6A). In the tested particle size range, there was no clear difference between numbers generated by studded or studless winter tires. Likewise, there was no overall tendency in numbers generated on asphalt versus cement concrete; the two tested summer tires generated 1.6 x and 7.5 x higher TRWP numbers on cement concrete, while the tested studless tire generated 3.6 x fewer TRWP per vehicle km on cement concrete, compared to the same tire types on asphalt.
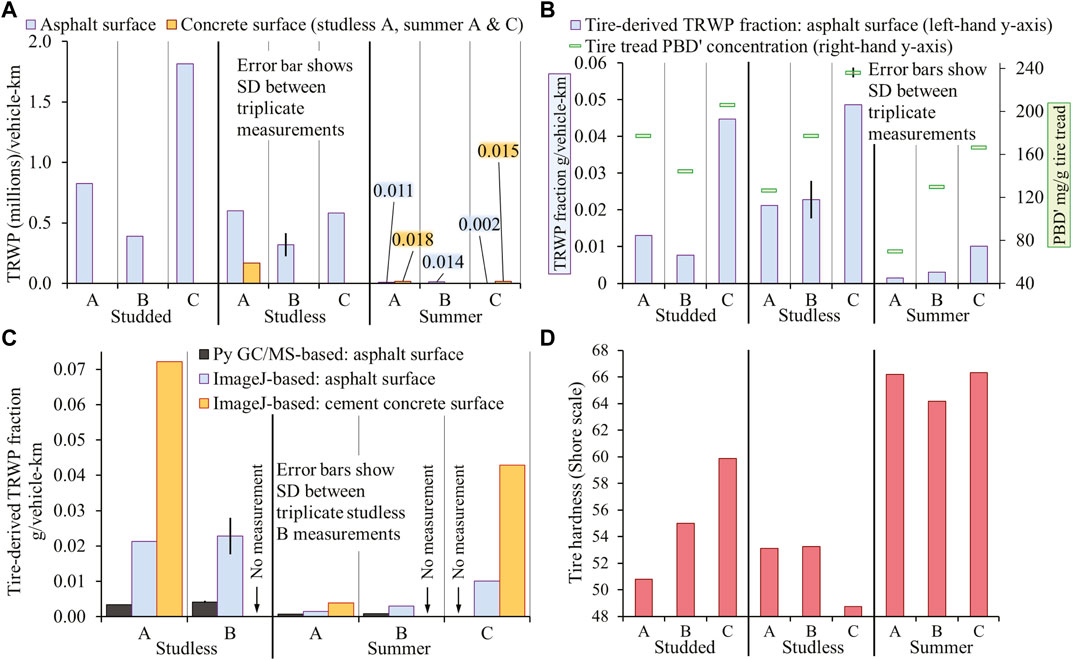
FIGURE 6. (A) Blue (asphalt surface) and orange (concrete surface) bars show TRWP (millions) per vehicle-km measured using ImageJ. (B) Tire-derived TRWP mass fraction per vehicle-km on asphalt (left-hand y-axis) with tire tread PBD’ concentration (right-hand y-axis) for each of the nine tested tire types. (C) Tire-derived TRWP mass fraction (g) per vehicle-km; blue (asphalt surface) and orange (cement concrete surface) bars show estimates calculated from ImageJ measurements. Black bars show parallel wear estimates calculated from rubber polymer (PBD’) concentrations, measured with py-GC/MS, in tire treads, and dusts generated on asphalt. (D) Measured tire tread hardness (Shore scale).
For the studded winter tires, the pattern in TRWP numbers mirrors estimated TRWP masses per vehicle-km (Figure 6B), but numbers and mass values generated on asphalt during the studless winter or summer tire drives do not follow the same pattern. This disparity highlights differences in TRWP size between the studless and summer tire types, for example, the drive on asphalt with summer tire C is associated with the lowest TRWP numbers (Figure 6A), but the highest mass (Figure 6B) of the three summer tire types, due to its exceptionally high mean particle size.
For validation, and comparison with, the asphalt ImageJ-based results, particle mass per vehicle-km on asphalt was calculated for four tire types using the measured PBD’ content in their associated road simulator dust samples, calibrated against PBD’ concentration in their treads (Figure 6C). The image-based estimates follow the same overall pattern as the py-GC/MS-based estimates, but are two to six times greater, indicating error/s introduced by one or both methods. The accuracy of the image-based volume estimation is affected by its underlying assumptions; assumed densities of 1.2 g/cm3 for tire tread, 2.5 g/cm3 for the road-derived fraction, 1.9 g/cm3 for TRWP, and that TRWP form is adequately represented by the ellipse-based model, including a mean TRWP height of 0.72 x Feret’s minimum. Given the disproportionate contribution of the largest TRWP in a sample to the overall TRWP volume, the presence of large particles with a height to width factor < the unweighted sampled mean of 0.72 (n = 40) is likely to have contributed to overestimation by the image-based method. As this study aimed to measure tire-derived black particles, removal of bitumen components of TRWP and bitumen-based particles was accomplished using xylenes. It should be emphasized that the degree to which removal of bitumen, in addition to incidental removal of other soluble fractions, such as tire-derived oils, affected TRWP volume, e.g., due to swelling or leaching, was not quantitatively assessed, but is also likely to have influenced TRWP mass estimates.
Comparable tests of three tire types were conducted on both asphalt and cement concrete surfaces (Figure 6C). Here, in particular, the presence of several large flat TRWP noted in the >100 µm fraction of the summer C cement concrete sample may have led to TRWP mass overestimation due to the poor model fit of flat particles, and more tests are needed to confirm the relationship shown by these first results. That said, the substantial difference between TRWP generation clearly warrants further investigation; TRWP masses per vehicle km measured from the cement concrete surface were three to four times greater than those from the asphalt surface.
Relatively high (Shore scale 66.2–66.3) measured tire hardness (Figure 6D) in all three of the summer tire types reflected the low mass values (Figure 6B) per vehicle-km, compared to those generated by the winter tires. Following the same trend, studless tire C, which had the lowest measured hardness, was associated with a relatively high TRWP mass per vehicle-km. However, hardness did not explain variation between studded and studless winter tire groups, or between studded tire brands, with studded tire C having the highest measured hardness among the winter tires, but relatively high TRWP mass and numbers per vehicle-km. Given the complexity of rubber compounding, including changes in both the relative fractions of natural to synthetic rubber as well as the polymer concentrations, together with diverse chemical fillers, softeners, protectants and other additives, the physical and mechanical properties of the rubber blend are unlikely to be fully explained by a single set of variables. It is also conceivable that tread pattern design influences TRWP characteristics. Nonetheless, Motiee et al. (2013) showed the rheological properties of tire rubber blends to be broadly predicted by the relative proportion of natural to synthetic rubber, and the results of this study show, for the first time, a correlation between TRWP generation (mass per vehicle-km) and tread butadiene rubber concentration (mg/g) (Pearson’s, r = 0.82, p = 0.004) (Figure 6B). These results are contrary to those of Malinova et al. (2022) who reported better abrasion resistance (lower weight loss following abrasion with sandpaper) with higher relative PBD proportion, but corroborate those of Sae-oui et al. (2017), who reported poorer abrasion resistance (greater volume loss using an Akron-type abrasion tester) with increasing PBD proportion.
Frequency distributions of particle size and form, combined with information on particle density, can provide useful information for predicting and modelling environmental dispersal and fate. It is important to emphasise that TRWP numbers per vehicle km recorded in this study represent only the coarse (>30 µm Feret’s diameter) fraction, putatively associated with initial deposition on, or adjacent to, the road surface and mobilisation in drainage systems during rainfall events (Unice et al., 2019). In terms of particle numbers, the majority of TRWP are thought to be generated in the low micro or nano size ranges, evidenced, for example, by Park et al. (2018) who measured a peak in size frequency distribution around 2 μm at 80 km/h, but with a notable increase in the generation of <100 nm tire particles when tire slip was increased to 3° under controlled conditions in a road simulator. In the current study, the test drives on asphalt revealed little difference, with one notable exception, in cumulative TRWP size (Feret’s diameter) frequency between brands (Figure 7A); summer tire C is clearly an outlier among the nine tested tires, associated with an exceptionally low frequency of small (30–80 µm) or medium (80–150 µm) TRWP and a substantial fraction of large (150–2,000 µm) TRWP, reaching 100% cumulative size frequency at the 4,330 µm bin. Excluding Summer tire C, a pattern in cumulative size frequency is evident between seasonal tire types. The three studded winter tire types track close to one another with a high frequency of smaller (30–80 µm) TRWP and reach 100% between the 570 and 1,150 µm bins. When interpreting these results, it should be considered that a proportion of values within the smallest (30–80 µm) size range derive from TRWP-mineral heteroagglomerations (described early in this section), which were abundant in the studded tire road simulator dusts. Compared to the three studded tire types, summer tires A and B are associated with a lower frequency of small (30–80 µm) and medium (80–150 µm) TRWP, with a higher frequency of TRWP extending into the large (150–2000 µm) size range, reaching 100% between the 1840 and 2,280 µm bins. The studless winter tire group is associated with a relatively low frequency of small 30–80 µm TRWP. However, in the 80–150 µm range, the cumulative gradient of the studless winter tire TRWP group is greater than that of the studded tire group or summer tires A and B, and the group reaches 100% between the 840 and 3,090 µm bins.
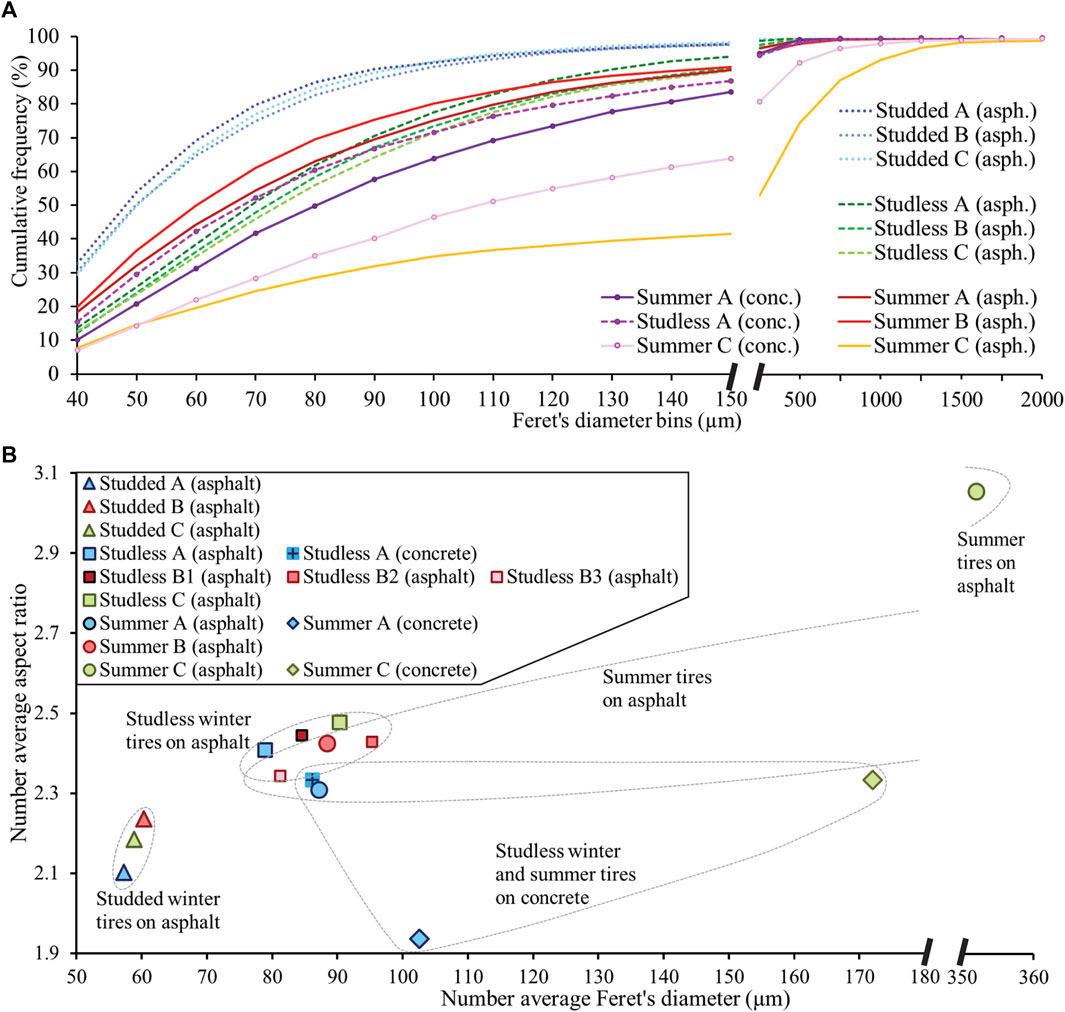
FIGURE 7. (A) Cumulative TRWP size frequency distribution for the nine tested tire types, with an applied lower Feret’s diameter cutoff of 30 µm (x-axis labels before the axis break denote the upper limit of 10 µm size bins), measured using ImageJ. The road surface used is shown in brackets in the key. Studless B1-B3 are triplicate subsamples. (B) Relationship between mean TRWP Feret’s diameter and TRWP aspect ratio.
The three tests on a cement concrete surface, using summer tires A and C, and studless tire A, followed slightly different cumulative gradients to the asphalt results; summer tires A and C presented a relatively weak cumulative gradient in the 30–80 μm and 80–150 µm ranges, while studless tire A presented a steeper cumulative gradient in the 30–80 µm range, which weakened in the 80–150 µm range. Like the summer tires on asphalt, all three maintained a substantial frequency into the 150–2,000 µm range, reaching 100% between the 1800 and 5,030 µm bins. Although a relatively coarse fraction was measured in this study, it has been reported that studded winter tires consistently generate more road-wear particles to the airborne fraction (Gustafsson et al., 2009). The results presented here show that summer tires can generate some of the largest TRWP, but also a higher frequency of finer TRWP than studless winter tires. The three cement concrete surface tests generated more TRWP at the top end of the size range than the same tires on asphalt. TRWP size differences must be considered in the context of substantial differences both in overall numbers and mass generated between tire brands and road surface types (Figures 6A–C).
Aspect ratio is a commonly used TRWP shape descriptor. Kovochich et al. (2021) reported that 65% of their road simulator TRWP had an aspect ratio >1.5, and 17% had an aspect ratio >2.5. In contrast, 82% of TRWP generated in this study had an aspect ratio >1.5, and 34% had an aspect ratio >2.5. This difference could stem from differences in road simulator operation and design between the two studies. Kovochich et al. (2021) added a third body (chalk or stone dust) to promote TRWP wear, while the road simulator was based on a standing inner drum, that would be expected to introduce little or no turn slip effect, compared to the horizontal track employed in the current study. Apart from summer tire C associated TRWP, there was little difference in aspect ratio between brands during test drives on an asphalt surface (Figure 7B). Summer tire C was again an outlier, with a mean TRWP aspect ratio of 3.1. There was a difference in TRWP aspect ratio between tire types. The range of mean TRWP aspect ratios associated with the three studded winter tire types was 2.1–2.2, while the summer and studless winter tire TRWP mean aspect ratios (excluding summer tire C) fell within a range of 2.3–2.5.
The three test drives on a concrete surface, using studless tire A and summer tires A and C, each yielded TRWP with lower number average aspect ratios compared to the same tire types on asphalt, although for studless tire A, the difference in aspect ratio between concrete and asphalt was negligeable (Figure 7B). There was no clear relationship between the number average Feret diameter of TRWP generated on asphalt or concrete surfaces.
Following the same overall pattern as aspect ratio, the TRWP generated on asphalt could be divided into two non-overlapping groups based on particle size (Figure 7B). Excluding summer tire C, the mean Feret’s diameter for the tested summer and studless winter tire drives on asphalt ranged from 79 to 95 µm. The number average TRWP Feret’s diameter of the outlier, summer tire-C drive, was 352 µm.
4 Conclusion
Given the global scale of tire use, the implications of even subtle reductions in the impacts of TRWP pollution could have wide reaching benefits. The state-of-the-art circular-track road simulator enabled direct comparison of realistic TRWP generated by different tires and road surfaces. Application of a multi-method analytical strategy provided complementary insights into TRWP physicochemical properties and abundance. The image analysis-based TRWP mass estimates showed that TRWP generation is far from uniform across tire brands, while py-GC/MS revealed striking differences in chemical composition. The results of this study, show correlation between TRWP generation and tread butadiene rubber concentration (Pearson’s, r = 0.82, p = 0.004). While not evidence of causal relationships, these results strongly suggest potential for adjustment towards lower emission tire formulations. Recent tests by Europe’s largest motoring organisation (ADAC, 2022) demonstrated the potential to achieve low TRWP emissions with no trade-off in safety performance. Against this background, the results presented here suggest that technical solutions to effect reduced tire wear emissions and even influence TRWP size and form, are within reach. The latter could be applied, for example, to reduce air- and water-borne spread of TRWP, optimise TRWP re-capture system efficiency, or minimise physical TRWP impacts on natural systems. The first evidence that different road surfaces (concrete and asphalt) influence TRWP generation is presented. It is likely that these differences are more related to surface micro-texture than if the binder is bitumen or cement, but the findings are pertinent to future infrastructure planning and point to the importance of aggregate choice and the influence of surface texture on tire wear. The conventional picture of TRWP; tough, elastic pieces of abraded tire-tread, superficially embedded with mineral grains, is put into question by observations of fragile, soft, or brittle particles, internally intermixed with road material, and further questions are raised. Do they persist in environmental matrices, or are they rapidly fragmented by mechanical weathering? What implications might this have for the formation of finer size fractions, bioavailability, or release of leachates? These questions recommend targeted studies in the road environment, transport and fate, and the ecotoxicology of realistic test materials.
Data availability statement
The raw data supporting the conclusion of this article will be made available by the authors, without undue reservation.
Author contributions
TW: Conceptualization, Data curation, Methodology, Visualization, Writing–original draft, Writing–review and editing, Formal Analysis. IJ: Investigation, Visualization, Writing–review and editing, Writing–original draft. JAL: Writing–review and editing, Conceptualization, Methodology, Formal analysis. MG: Resources, Supervision, Conceptualization, Writing–review and editing, Methodology, Project administration, Investigation. KM: Formal Analysis, Methodology, Writing–review and editing, Supervision. YA: Conceptualization, Funding acquisition, Project administration, Resources, Supervision, Writing–review and editing. MH: Conceptualization, Funding acquisition, Project administration, Resources, Supervision, Writing–review and editing.
Funding
The author(s) declare financial support was received for the research, authorship, and/or publication of this article. The work was funded by the Government offices of Sweden the Ministry of Enterprise (Näringsdepartementet) N2017/07856/SUBT, Formas 2017-00720, VTI 2019/0013-7.2, and the Joint Programme Initiative: Healthy and Productive Seas and Oceans (JPI Oceans) projects ANDROMEDA (2019-02166_Formas) and FACTS (2019-02169_Formas).
Acknowledgments
The authors would like to thank technical staff, Dennis Hydén and Tomas Halldin for running and maintaining the road simulator, Arne Johansson in the workshop at VTI for constructing and building the sampling hood, and Eurofins, Bergen, for py GC/MS analysis and their expert and friendly advice.
Conflict of interest
The authors declare that the research was conducted in the absence of any commercial or financial relationships that could be construed as a potential conflict of interest.
Publisher’s note
All claims expressed in this article are solely those of the authors and do not necessarily represent those of their affiliated organizations, or those of the publisher, the editors and the reviewers. Any product that may be evaluated in this article, or claim that may be made by its manufacturer, is not guaranteed or endorsed by the publisher.
Supplementary material
The Supplementary Material for this article can be found online at: https://www.frontiersin.org/articles/10.3389/fenvs.2023.1258922/full#supplementary-material
References
ADAC (2022). Tyre wear particles in the environment. https://assets.adac.de/image/upload/v1639663105/ADAC-eV/KOR/Text/PDF/Tyre_wear_particles_in_the_environment_zkmd3a.pdf.
Andersson-Sköld, Y., Johannesson, M., Gustafsson, M., Järlskog, I., Lithner, D., Polukarova, M., et al. (2020). Microplastics from tyre and road wear: a literature review. Swedish National Road and Transport Research Institute. Linköping, Sweden. VTI-Report 1028A http://urn.kb.se/resolve?urn=urn:nbn:se:vti:diva-15243.
Baensch-Baltruschat, B., Kocher, B., Stock, F., and Reifferscheid, G. (2020). Tyre and road wear particles (TRWP) - a review of generation, properties, emissions, human health risk, ecotoxicity, and fate in the environment. Sci. Total Environ. 733, 137823. doi:10.1016/j.scitotenv.2020.137823
Beddows, D. C. S., and Harrison, R. M. (2021). PM10 and PM2.5 emission factors for non-exhaust particles from road vehicles: dependence upon vehicle mass and implications for battery electric vehicles. Atmos. Environ. 244, 117886. doi:10.1016/j.atmosenv.2020.117886
Brinkmann, M., Montgomery, D., Selinger, S., Miller, J. G. P., Stock, E., Alcaraz, A. J., et al. (2022). Acute toxicity of the tire rubber-derived chemical 6PPD-quinone to four fishes of commercial, cultural, and ecological importance. Environ. Sci. Technol. Lett. 9, 333–338. doi:10.1021/acs.estlett.2c00050
Chae, E., and Choi, S. S. (2022). Influence of particle size on inhomogeneity in rubber compositions of NR/BR blend wear particles by single particle analysis. Polym. Adv. Technol. 33 (3), 897–903. doi:10.1002/pat.5565
Degaffe, F. S., and Turner, A. (2011). Leaching of zinc from tire wear particles under simulated estuarine conditions. Chemosphere 85, 738–743. doi:10.1016/j.chemosphere.2011.06.047
Ding, J., Lv, M., Zhu, D., Leifheit, E. F., Chen, Q. L., Wang, Y. Q., et al. (2023). Tire wear particles: an emerging threat to soil health. Crit. Rev. Environ. Sci. Technol. 53 (2), 239–257. doi:10.1080/10643389.2022.2047581
Fang, Q., Song, B., Tee, T.-T., Sin, L. T., Hui, D., and Bee, S.-T. (2014). Investigation of dynamic characteristics of nano-size calcium carbonate added in natural rubber vulcanizate. Compos. Part B Eng. 60, 561–567. doi:10.1016/j.compositesb.2014.01.010
Folkeson, L. (2005). Literature survey. Linköping, Sweden: Swedish National Road and Transport Research Institute. VTI-Report 512.Dispersal and effects of heavy metals from roads and road traffic
Gao, Z., Cizdziel, J. V., Wontor, K., Clisham, C., Focia, K., Rausch, J., et al. (2022). On airborne tire wear particles along roads with different traffic characteristics using passive sampling and optical microscopy, single particle SEM/EDX, and µ-ATR-FTIR analyses. Front. Environ. Sci. 10. doi:10.3389/fenvs.2022.1022697
Garcia, P. S., de Sousa, F. D. B., de Lima, J. A., Cruz, S. A., and Scuracchio, C. H. (2015). Devulcanization of ground tire rubber: physical and chemical changes after different microwave exposure times. Express Polym. Lett. 9 (11), 1015–1026. doi:10.3144/expresspolymlett.2015.91
Goßmann, I., Halbach, M., and Scholz-Böttcher, B. M. (2021). Car and truck tire wear particles in complex environmental samples – a quantitative comparison with “traditional” microplastic polymer mass loads. Sci. Total Environ. 773, 145667. doi:10.1016/j.scitotenv.2021.145667
Gualtieri, M., Andrioletti, M., Mantecca, P., Vismara, C., and Camatini, M. (2005c). Impact of tire debris on in vitro and in vivo systems. Part. Fibre Toxicol. 2, 1. doi:10.1186/1743-8977-2-1
Gualtieri, M., Andrioletti, M., Vismara, C., Milani, M., and Camatini, M. (2005a). Toxicity of tire debris leachates. Environ. Int. 31, 723–730. doi:10.1016/j.envint.2005.02.001
Gualtieri, M., Mantecca, P., Cetta, F., and Camatini, M. (2008). Organic compounds in tire particle induce reactive oxygen species and heat-shock proteins in the human alveolar cell line A549. Environ. Int. 34, 437–442. doi:10.1016/j.envint.2007.09.010
Gualtieri, M., Rigamonti, L., Galeotti, V., and Camatini, M. (2005b). Toxicity of tire debris extracts on human lung cell line A549. Toxicol. Vitro 19, 1001–1008. doi:10.1016/j.tiv.2005.06.038
Gustafsson, M., Blomqvist, G., Gudmundsson, A., Dahl, A., Jonsson, P., and Swietlicki, E. (2009). Factors influencing PM10 emissions from road pavement wear. Atmos. Environ. 43, 4699–4702. doi:10.1016/j.atmosenv.2008.04.028
Halle, L. L., Palmqvist, A., Kampmann, K., Jensen, A., Hansen, T., and Khan, F. R. (2021). Tire wear particle and leachate exposures from a pristine and road-worn tire to Hyalella azteca: comparison of chemical content and biological effects. Aquat. Toxicol. 232, 105769. doi:10.1016/j.aquatox.2021.105769
Järlskog, I., Jaramillo-Vogel, D., Rausch, J., Gustafsson, M., Strömvall, A.-M., and Andersson-Sköld, Y. (2022). Concentrations of tire wear microplastics and other traffic-derived non-exhaust particles in the road environment. Environ. Int. 170, 107618. doi:10.1016/j.envint.2022.107618
Kaliyathan, A. V., Varghese, K. M., Nair, A. S., and Thomas, S. (2019). Rubber–rubber blends: a critical review. Prog. Rubber, Plastics Recycl. Technol. 36 (3), 196–242. doi:10.1177/1477760619895002
Karlsson, T. M., Kärrman, A., Rotander, A., and Hassellöv, M. (2020). Comparison between manta trawl and in situ pump filtration methods, and guidance for visual identification of microplastics in surface waters. Environ. Sci. Pollut. Res. 27, 5559–5571. doi:10.1007/s11356-019-07274-5
Kayhanian, M., McKenzie, E. R., Leatherbarrow, J. E., and Young, T. M. (2012). Characteristics of road sediment fractionated particles captured from paved surfaces, surface run-off and detention basins. Sci. Total Environ. 439, 172–186. doi:10.1016/j.scitotenv.2012.08.077
Kim, S. W., Leifheit, E. F., Maaß, S., and Rillig, M. C. (2021). Time-dependent toxicity of tire particles on soil nematodes. Front. Environ. Sci. 9. doi:10.3389/fenvs.2021.744668
Klöckner, P., Reemtsma, T., Eisentraut, P., Braun, U., Ruhl, A. S., and Wagner, S. (2019). Tire and road wear particles in road environment – quantification and assessment of particle dynamics by Zn determination after density separation. Chemosphere 222, 714–721. doi:10.1016/j.chemosphere.2019.01.176
Knight, L. J., Parker-Jurd, F. N. F., Al-Sid-Cheikh, M., and Thompson, R. C. (2020). Tyre wear particles: an abundant yet widely unreported microplastic? Environ. Sci. Pollut. Res. 27, 18345–18354. doi:10.1007/s11356-020-08187-4
Kole, P. J., Löhr, A. J., Van Belleghem, F. G. A. J., and Ragas, A. M. J. (2017). Wear and tear of tyres: a stealthy source of microplastics in the environment. Int. J. Environ. Res. Public Health 14, 1265. doi:10.3390/ijerph14101265
Kovochich, M., Liong, M., Parker, J. A., Oh, S. C., Lee, J. P., Xi, L., et al. (2021). Chemical mapping of tire and road wear particles for single particle analysis. Sci. Total Environ. 757, 144085. doi:10.1016/j.scitotenv.2020.144085
Kreider, M. L., Panko, J. M., McAtee, B. L., Sweet, L. I., and Finley, B. L. (2009). Physical and chemical characterization of tire-related particles: comparison of particles generated using different methodologies. Sci. Total Environ. 408, 652–659. doi:10.1016/j.scitotenv.2009.10.016
Kreider, M. L., Unice, K. M., and Panko, J. M. (2020). Human health risk assessment of tire and road wear particles (TRWP) in air. Hum. Ecol. Risk Assess. Int. J. 26, 2567–2585. doi:10.1080/10807039.2019.1674633
Kumata, H., Yamada, J., Masuda, K., Takada, H., Sato, Y., Sakurai, T., et al. (2002). Benzothiazolamines as tire-derived molecular markers: sorptive behavior in street runoff and application to source apportioning. Environ. Sci. Technol. 36, 702–708. doi:10.1021/es0155229
Liu, F., Olesen, K. B., Borregaard, A. R., and Vollertsen, J. (2019). Microplastics in urban and highway stormwater retention ponds. Sci. Total Environ. 671, 992–1000. doi:10.1016/j.scitotenv.2019.03.416
Ma, Y., Mummullage, S., Wijesiri, B., Egodawatta, P., McGree, J., Ayoko, G. A., et al. (2021). Source quantification and risk assessment as a foundation for risk management of metals in urban road deposited solids. J. Hazard. Mater. 408, 124912. doi:10.1016/j.jhazmat.2020.124912
Malinova, P., Ilieva, N., and Metodiev, V. (2022). Investigation of elastomers ratio influence in the composites for truck TiresTreads production. J. Chem. Technol. Metallurgy 57, 232–240.
Mattonai, M., Nacci, T., and Modugno, F. (2022). Analytical strategies for the quali-quantitation of tire and road wear particles – a critical review. Trends Anal. Chem. 154, 116650. doi:10.1016/j.trac.2022.116650
Mattsson, K., Aristéia de Lima, J., Wilkinson, T., Järlskog, I., Ekstrand, E., Andersson Sköld, Y., et al. (2023). Tyre and road wear particles from source to sea. Microplastics Nanoplastics 3, 14. doi:10.1186/s43591-023-00060-8
Miller, J. V., Maskrey, J. R., Chan, K., and Unice, K. M. (2022). Pyrolysis-Gas chromatography-mass spectrometry (Py-GC-MS) quantification of tire and road wear particles (TRWP) in environmental matrices: assessing the importance of microstructure in instrument calibration protocols. Anal. Lett. 55, 1004–1016. doi:10.1080/00032719.2021.1979994
More, S. L., Miller, J. V., Thornton, S. A., Chan, K., Barber, T. R., and Unice, K. M. (2023). Refinement of a microfurnace pyrolysis-GC–MS method for quantification of tire and road wear particles (TRWP) in sediment and solid matrices. Sci. Total Environ. 874, 162305. doi:10.1016/j.scitotenv.2023.162305
Motiee, F., Taghvaei-Ganjali, S., and Malekzadeh, M. (2013). Investigation of correlation between rheological properties of rubber compounds based on natural rubber/styrene-butadiene rubber with their thermal behaviors. Int. J. Industrial Chem. 4, 16. doi:10.1186/2228-5547-4-16
Öling-Wärnå, V., Åkerback, N., and Engblom, S. (2023). Digestate from biowaste and sewage sludge as carriers of microplastic into the environment: case study of a thermophilic biogas plant in ostrobothnia, Finland. Soil Pollut. 234, 432–512. doi:10.1007/s11270-023-06436-z
Padoan, E., Romè, C., and Ajmone-Marsan, F. (2017). Bioaccessibility and size distribution of metals in road dust and roadside soils along a peri-urban transect. Sci. Total Environ. 601-602, 89–98. doi:10.1016/j.scitotenv.2017.05.180
Panko, J. M., Chu, J., Kreider, M. L., and Unice, K. M. (2013). Measurement of airborne concentrations of tire and road wear particles in urban and rural areas of France, Japan, and the United States. Atmospheric Environment 72, 192–199. doi:10.1016/j.atmosenv.2013.01.040
Park, I., Kim, H., and Lee, S. (2018). Characteristics of tire wear particles generated in a laboratory simulation of tire/road contact conditions. J. Aerosol Sci. 124, 30–40. doi:10.1016/j.jaerosci.2018.07.005
Park, I., Lee, J., and Lee, S. (2017). Laboratory study of the generation of nanoparticles from tire tread. Aerosol Sci. Technol. 51, 188–197. doi:10.1080/02786826.2016.1248757
Pohrt, R. (2019). Tire wear particle hot spots – review of influencing factors. Facta Univ. Ser. Mech. Eng. 17, 17–27. doi:10.22190/FUME190104013P
Rasmussen, L. A., Lykkemark, J., Andersen, T. R., and Vollertsen, J. (2023). Permeable pavements: a possible sink for tyre wear particles and other microplastics? Sci. Total Environ. 869, 161770. doi:10.1016/j.scitotenv.2023.161770
Rausch, J., Jaramillo-Vogel, D., Perseguers, S., Schnidrig, N., Grobéty, B., and Yajan, P. (2022). Automated identification and quantification of tire wear particles (TWP) in airborne dust: SEM/EDX single particle analysis coupled to a machine learning classifier. Sci. Total Environ. 803, 149832. doi:10.1016/j.scitotenv.2021.149832
Rødland, E. S., Gustafsson, M., Jaramillo-Vogel, D., Järlskog, I., Müller, K., Rauert, C., et al. (2023). Analytical challenges and possibilities for the quantification of tire-road wear particles. Trends Anal. Chem. 165, 117121. doi:10.1016/j.trac.2023.117121
Rødland, E. S., Samanipour, S., Rauert, C., Okoffo, E. D., Reid, M. J., Heier, L. S., et al. (2022). A novel method for the quantification of tire and polymer-modified bitumen particles in environmental samples by pyrolysis gas chromatography mass spectroscopy. J. Hazard. Mater. 423, 127092. doi:10.1016/j.jhazmat.2021.127092
Roselli, L., Stanca, E., Paparella, F., Mastrolia, A., and Basset, A. (2012). Determination of Coscinodiscus cf. granii biovolume by confocal microscopy: comparison of calculation models. J. Plankton Res. 35, 135–145. doi:10.1093/plankt/fbs069
Rosso, B., Gregoris, E., Litti, L., Zorzi, F., Fiorini, M., Bravo, B., et al. (2023). Identification and quantification of tire wear particles by employing different cross-validation techniques: FTIR-ATR Micro-FTIR, Pyr-GC/MS, and SEM. Environ. Pollut. 326, 121511. doi:10.1016/j.envpol.2023.121511
Sae-Oui, P., Suchiva, K., Sirisinha, C., Intiya, W., Yodjun, P., and Thepsuwan, U. (2017). Effects of blend ratio and SBR type on properties of carbon black-filled and silica-filled SBR/BR tire tread compounds. Adv. Mater. Sci. Eng. 2017, 1–8. doi:10.1155/2017/2476101
Siddiqui, S., Dickens, J. M., Cunningham, B. E., Hutton, S. J., Pedersen, E. I., Harper, B., et al. (2022). Internalization, reduced growth, and behavioral effects following exposure to micro and nano tire particles in two estuarine indicator species. Chemosphere 296, 133934. doi:10.1016/j.chemosphere.2022.133934
Sommer, F., Dietze, V., Baum, A., Sauer, J., Gilge, S., Maschowski, C., et al. (2018). Tire abrasion as a major source of microplastics in the environment. Aerosol Air Qual. Res. 18, 2014–2028. doi:10.4209/aaqr.2018.03.0099
Sundt, P., Schulze, P.-E., and Syversen, F. (2014). Sources of microplastic pollution to the marine environment. Mepex report: M-321 2015. https://www.miljodirektoratet.no/globalassets/publikasjoner/M321/M321.pdf.
Schwarz, A. E., Lensen, S. M. C, Langeveld, E., Parker, L. A., and Urbanus, J. H. (2023). Plastics in the global environment assessed through material flow analysis, degradation and environmental transportation. Science of the Total Environment 875, 162644. doi:10.1016/j.scitotenv.2023.162644
Tian, Z., Zhao, H., Peter, K. T., Gonzalez, M., Wetzel, J., Wu, C., et al. (2020). A ubiquitous tire rubber–derived chemical induces acute mortality in coho salmon. Science 371, 185–189. doi:10.1126/science.abd6951
Toki, S., Fujimaki, T., and Okuyama, M. (2000). Strain-induced crystallization of natural rubber as detected real-time by wide-angle X-ray diffraction technique. Polymer 41, 5423–5429. doi:10.1016/S0032-3861(99)00724-7
Unice, K. M., Kreider, M. L., and Panko, J. M. (2013). Comparison of tire and road wear particle concentrations in sediment for watersheds in France, Japan, and the United States by quantitative pyrolysis GC/MS analysis. Environ. Sci. Technol. 47, 8138–8147. doi:10.1021/es400871j
Unice, K. M., Kreider, M. L., and Panko, J. M. (2012). Use of a deuterated internal standard with pyrolysis-GC/MS dimeric marker analysis to quantify tire tread particles in the environment. Int. J. Environ. Res. public health 9, 4033–4055. doi:10.3390/ijerph9114033
Unice, K. M., Weeber, M. P., Abramson, M. M., Reida, R. C. D., van Gils, J. A. G., Markus, J. A. G., et al. (2019). Characterizing export of land-based microplastics to the estuary - Part I: application of integrated geospatial microplastic transport models to assess tire and road wear particles in the Seine watershed. Sci. Total Environ. 646, 1639–1649. doi:10.1016/j.scitotenv.2018.07.368
Vogelsang, C., Lusher, A. L., Dadkhah, M. E., Sundvor, I., Umar, M., Ranneklev, S. B., et al. (2019). Microplastics in road dust – characteristics, pathways and measures. Norwegian Institute for Water Res1earch. NIVA. Report M-959 http://hdl.handle.net/11250/2493537.
Keywords: microplastics, tyre wear, tire wear emissions, multi-analytical approach, sub-elastic TRWP, visual-tactile analysis, density, elasto-plasticity
Citation: Wilkinson T, Järlskog I, de Lima JA, Gustafsson M, Mattsson K, Andersson Sköld Y and Hassellöv M (2023) Shades of grey—tire characteristics and road surface influence tire and road wear particle (TRWP) abundance and physicochemical properties. Front. Environ. Sci. 11:1258922. doi: 10.3389/fenvs.2023.1258922
Received: 14 July 2023; Accepted: 09 October 2023;
Published: 07 November 2023.
Edited by:
Farhan R. Khan, Norwegian Research Institute (NORCE), NorwayReviewed by:
Oluniyi Olatunji Fadare, Texas A&M University Corpus Christi, United StatesPieter-Jan Kole, Open University of the Netherlands, Netherlands
Copyright © 2023 Wilkinson, Järlskog, de Lima, Gustafsson, Mattsson, Andersson Sköld and Hassellöv. This is an open-access article distributed under the terms of the Creative Commons Attribution License (CC BY). The use, distribution or reproduction in other forums is permitted, provided the original author(s) and the copyright owner(s) are credited and that the original publication in this journal is cited, in accordance with accepted academic practice. No use, distribution or reproduction is permitted which does not comply with these terms.
*Correspondence: Martin Hassellöv, bWFydGluLmhhc3NlbGxvdkBndS5zZQ==