 Zeyu Dong
 Shu Gui
 Ruowen Yang
 Jinxin Cheng1,4
 Huan Yang
- 1Yunnan Key Laboratory of Meteorological Disasters and Climate Resources in the Greater Mekong Subregion, Yunnan University, Kunming, China
- 2Kunming Meteorological Bureau, Kunming, China
- 3Collaborative Innovation Center on Forecast and Evaluation of Meteorological Disasters (CIC-FEMD), Nanjing University of Information Science and Technology, Nanjing, China
- 4Yunnan Climate Center, Kunming, China
In recent decades, severe drought conditions have become increasingly frequent in Yunnan, Southwest China. The extreme drought events cause huge losses to agricultural economy, ecological security and human health. To uncover the reasons behind the worsening drought conditions, this study investigates the interdecadal variability (IDV) of summer precipitation in Yunnan during 1961–2019 and its association with the Indo-Pacific Sea surface temperature (SST) configuration based on gauge observation and reanalysis data. The dominant mode of summer precipitation IDV in Yunnan shows a uniform pattern characterizing the alternations of flood and drought. Specifically, a relatively wet period persists from the early 1990s to the early 2000s, followed by a relatively dry period from the early 2000s to the late 2010s. The IDV of precipitation is consistent with the IDV of the column-integrated water vapor flux divergence, where the wind anomalies play a major role in modulating the moisture supply. The main SST forcings of the IDV of precipitation include the sea surface temperature anomalies (SSTAs) over the Bay of Bengal (BOB), the Western Pacific Warm Pool (WPWP), and the western North Pacific (WNP). The negative SSTAs over the BOB and the WPWP trigger a Gill-Matsuno-type response that enhances the cyclonic curvature over Yunnan. The SSTAs over the WNP show a tripole pattern that weakens the WNP subtropical high and further enhances the cyclonic anomaly over Yunnan. The above SST configuration also favors moisture transport to Yunnan. Numerical experiments verify the key physical processes.
1 Introduction
Yunnan is the main part of the low-latitude highland of China, encompassing the confluence zone of the East Asian summer monsoon (EASM) and Indian summer monsoon (ISM). The interaction between the EASM and the ISM superimposes onto the complex terrain of Yunnan, making a unique plateau-mountain monsoon climate (Cao et al., 2012; Cao et al., 2016; Guo et al., 2016; Tao et al., 2016). The moisture source of Yunnan originates from the Bay of Bengal (BOB) and the Arabian Sea to the Southwest, and tropical Western North Pacific (WNP) the Southeast. The rainy season of Yunnan lasts from May to October, when the cumulative rainfall accounts for more than 83% of the total annual precipitation regionwide. The rainfall variation in Yunnan is independent from other parts of China, primarily because of the combined modulation of the EASM–ISM interaction and the complex terrain of Yunnan (Qin, 1998; Cheng et al., 2009; Yan et al., 2018; He et al., 2021).
The IDV of precipitation in Yunnan has been a hot topic since the 2009 megadrought (Duan et al., 2000; Huang et al., 2012; Lü et al., 2012; Pradhan et al., 2017; Zheng et al., 2017; Zheng et al., 2017; Liu et al., 2018a; Han and Jiang, 2018; Wang et al., 2018; Li et al., 2019a; Wang et al., 2023). From 2009 to 2012, Yunnan encountered a severe drought for four consecutive years, not only in the dry season (from October to April of the following year), but also in the wet season (from May to September). The persistent drought in Yunnan directly caused major economic losses over 40 billion Chinese Yuan (CNY) and reduced the terrestrial ecosystem Gross Primary Productivity (GPP) by 8.6%, 17.48% and 13.85% in 2009, 2010, and 2011 (Tao et al., 2014; Li et al., 2022). Since then, Yunnan has been experiencing recurrent drought conditions especially in spring and early summer (Wang et al., 2021; Liu et al., 2022; Gao et al., 2023). The IDV of precipitation also manifests as the interdecadal variations of the daytime and nighttime precipitation amount and the number of rainy days (Zhu et al., 2022). Given the severity of summer drought, many studies investigated the IDV of summer precipitation around Yunnan and revealed the possible causes.
Previous studies so far suggest that the IDV of summer precipitation in the neighborhood of Yunnan is attributed to multiple SST forcings (SSTAs) over tropical Indian Ocean (IO) and the tropical Pacific (Nitta and Hu, 1996; Hu, 1997; Xie et al., 2009; Park and An, 2014). For instance, the tropical IO affects the IDV of summer rainfall in Southwestern China by the interdecadal IO basin mode (the main driver) and the interdecadal IO dipole (the secondary driver) (Liu et al., 2018b). The tropical Pacific modulates the IDV of summer precipitation in the Greater Mekong Subregion by the SSTAs over the western Pacific warm pool (Wen et al., 2021). The configuration of SSTAs over tropical IO and tropical Pacific is identified as the primary cause of the summer precipitation IDV around Yunnan. The tropical IO and the tropical eastern Pacific modulate the IDV of summer precipitation over Eastern China by altering the western Pacific subtropical high (Gong and Ho, 2002). The SSTAs over the western Pacific warm pool and the eastern IO warm pool are the main driver of the IDV of heavy precipitation events during the wet-season over the low-latitude highland of China (Liu et al., 2011). The anomalous warming of western Pacific and western IO suppresses summer precipitation over the Hengduan Mountains through inducing anomalous moisture divergence and downward motions over the area (Dong et al., 2019). The IDV of summer precipitation around Yunnan is also related to the extratropical SST modes such as the PDO (Lü et al., 2014), and the combined effect of the tropical IO SST and the Tibetan Plateau snow cover (Wu et al., 2010).
Most previous studies put Yunnan and the surrounding areas together for investigation (for example, Southwestern China or Eastern China), which weakens the representability of precipitation pattern in Yunnan and potentially underplays the impact of tropical SST patterns on the IDV of summer precipitation in Yunnan. Since the correlation between the summer precipitation variability in Yunnan and the surrounding areas is statistically insignificant, we need to isolate Yunnan from the surrounding areas for investigation. If only Yunnan is considered, the IDV of summer precipitation and its main driver could be different from the previous findings. Since the IDV of precipitation in the neighborhood of Yunnan is affected by the SSTAs over different oceans, we could assume that the IDV of summer precipitation in Yunnan is also attributed to the coordinated influence of multiple SSTAs. To reveal the main reason of the increasing drought in recent decades, a detailed analysis on the IDV of summer precipitation in Yunnan is urgently needed. This study aims to reveal the main characteristics of the IDV of summer precipitation in Yunnan and elucidates its association with the SSTAs over the ocean areas surrounding Yunnan.
The remainder of this paper is as follows. Section 2 introduces the reanalysis data, methodology, and the atmospheric model. Section 3 presents the main characteristics of the IDV of summer precipitation in Yunnan. Section 4 investigates the physical processes of the IDV of summer precipitation and clarifies the impact mechanism of tropical SSTA configuration. Section 5 presents the model results to verify the causal link between the IDV of summer precipitation in Yunnan and the tropical SSTA configuration. Section 6 presents a discussion and our conclusion.
2 Data, method, and AGCM
2.1 Data
This study employs the observed precipitation data from 124 observation stations in Yunnan provided by Yunnan Climate Center. The 5th generation European Centre for Medium-range Weather Forecasts atmospheric reanalysis (ERA5) is used for the atmospheric variables including horizontal wind, vertical velocity, and specific humidity. The ERA5 data has a horizontal resolution of 0.25° and 37 pressure levels from 1,000 to 1 hPa. The Hadley Centre Sea Ice and Sea Surface Temperature (HadISST) dataset version 1.1 is used for monthly SST with a horizontal resolution of 1°. The time span of the above data is 1961–2019.
2.2 Method
This study adopts the empirical orthogonal function (EOF) analysis to extract the leading mode of summer rainfall variation in Yunnan (von Storch and Zwiers, 2002). A 7-year low-pass filtering is used to extract the interdecadal component of the research data. The investigation uses the least squares regression and the composite method to identify key physical processes. The significance test uses the two-tailed Student’s t-test with the effective degree of freedom
To unveil the primary cause of moisture transport anomalies, we decomposed the column-integrated water vapor flux divergence (CIWVFD) as follows:
where
2.3 Model
This study uses the simplified parameterizations primitive equation dynamics (SPEEDY) model (the latest version 41) to verify the proposed mechanism (Kucharski et al., 2013). The SPEEDY model is a hydrostatic spectral-transform model developed at the Abdus Salam International Centre for Theoretical Physics. The SPEEDY model has simplified physical parameterizations of radiation, convection, large-scale condensation, clouds, surface fluxes, etc., which resemble those in operational weather forecast models (Molteni, 2003). The spatial resolution of SPEEDY model is T30L8, corresponding to a horizontal resolution of approximately 3.75° × 3.75° on a Gaussian grid with 8 vertical levels on the terrain-following σ-coordinate. The model output is interpolated on 8 pressure levels at 30, 100, 200, 300, 500, 700, 850, and 925 hPa.
3 Interdecadal variation of summer precipitation in Yunnan
We used the EOF analysis to reveal the spatiotemporal characteristics of precipitation in Yunnan during summer (June–July–August: JJA). The leading EOF mode (EOF1) characterizes a uniform pattern with positive centers over the southern and central-eastern Yunnan (Figure 1A). The spatial pattern of EOF1 suggests a region-wide uniform increase or decrease of precipitation in Yunnan. The variation contribution rate of the EOF1 is 32.4%. The first principal component (PC1) shows an intense interannual-to-interdecadal variability (Figure 1B). The power spectral analysis of the first principal component (PC1) shows a significant IDV period of 9–11 years (Figure 1C). To determine the IDV phase change, we performed a 11-year sliding t-test on the PC1. Results show three interdecadal dry-wet transitions during 1961–2019, including a relatively wet period before 1974, a relatively dry period of 1983–1992, a relatively wet period of 1993–2002, and a relatively dry period of 2003–2019 (Figure 1D). The mean value of the PC1 is 0.71 for the relatively wet period and −0.70 for the relatively dry period. The mean value change of PC1 is significant at 99% confidence level. Thus, the summer precipitation in Yunnan has undergone significant IDV. Given the significant period of the IDV (9–11 years), we adopted the nine-year binomial smoothing method to extract the interdecadal component of PC1 (ID-PC1).
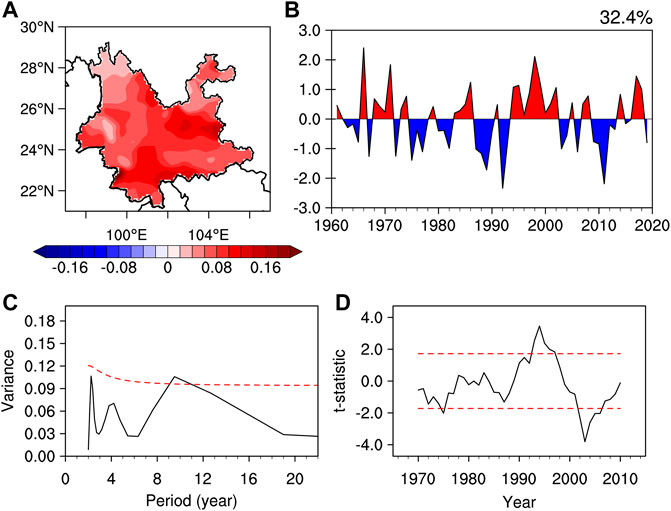
FIGURE 1. (A) Spatial distribution of the first EOF mode (EOF1) of summer rainfall over the Yunnan, (B) normalized detrended principal component (PC1) of the EOF1, (C) continuous power spectra of the detrended PC1, (D) the sliding t-test of the PC1 with window length of 7 years. The red dashed lines in (C,D) represent the 95% confidence level.
The magnitude of the IDV of precipitation is investigated and cross-validated with regression and composite methods. The observed summer rainfall data is regressed against the ID-PC1. The regression result shows positive anomalies regionwide, with significant changes over the southern and central-eastern Yunnan. The composite of summer precipitation between wet and dry periods shows a similar pattern (Figure 2B). The precipitation increases for all observation stations, with significant changes mainly over central-eastern and Southern Yunnan. The regressed anomalies of precipitation are significant at 98 weather stations, and the composites of precipitation are significant at 71 weather stations. The composite analysis only accounts the IDV anomaly years, making the precipitation variation larger than the regression result. The maximum of precipitation anomalies is around 30 mm for the regression result, and around 60 mm for the composite result. The spatial pattern of EOF1, the regression and composite results are consistent with each other. Thus, the IDV of summer rainfall in Yunnan is associated with a robust change in the precipitation amount over most parts of Yunnan.
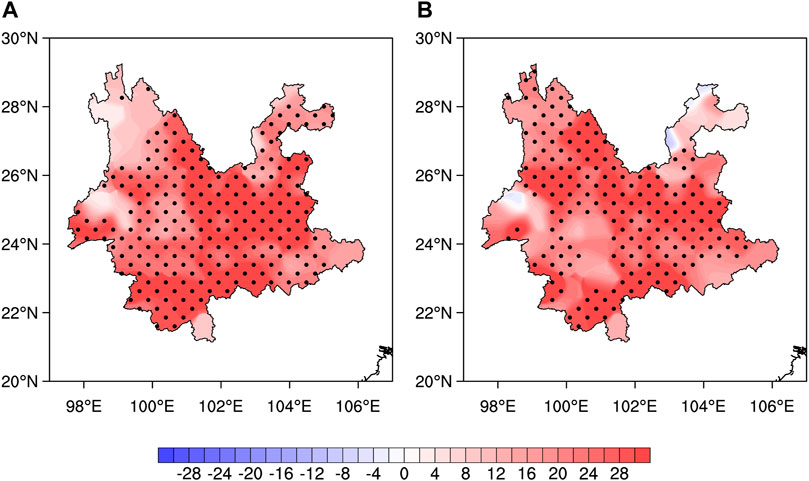
FIGURE 2. The anomalies of JJA mean precipitation calculated by (A) regression against the standardized ID-PC1, (B) composite between the wet and dry periods (units: mm). The stippling denotes significance at the 95% confidence levels.
4 Possible mechanism
4.1 Large-scale circulation
To reveal the large-scale circulation pattern, we regressed the 7-year low-pass filtered horizontal wind against the ID-PC1. The 200 hPa horizontal wind field characterizes a significant cyclonic anomaly to the north of Yunnan (Figure 3A). This cyclonic anomaly indicates a weakened South Asian high associated with enhanced low-level easterly anomalies over the North of Yunnan (Figure 3B). The 700 hPa horizontal wind field characterizes two anomalous anticyclones over the Indo-Pacific warm pool, one over the BOB (point A) and the other over the WPWP (point C). The anomalous anticyclone over the BOB enhances westerly anomalies over the Southern Yunnan, and the anomalous anticyclone over the WPWP intensifies the Southwesterly over the Southeastern Yunnan. The joint effect of these two anomalous anticyclones induces an anomalous cyclonic curvature over Yunnan (point B). This cyclonic curvature is enhanced by the easterly anomalies over the North of Yunnan. The cyclonic anomaly over Yunnan stretches to subtropical WNP, suggesting a weakened Western North Pacific subtropical high (WNPSH). The composite of horizontal wind field between wet and dry periods shows a similar pattern as the regression results (Figures 3C, D). The consistency between the regression and composite results confirms the horizontal wind pattern of the IDV of summer precipitation.
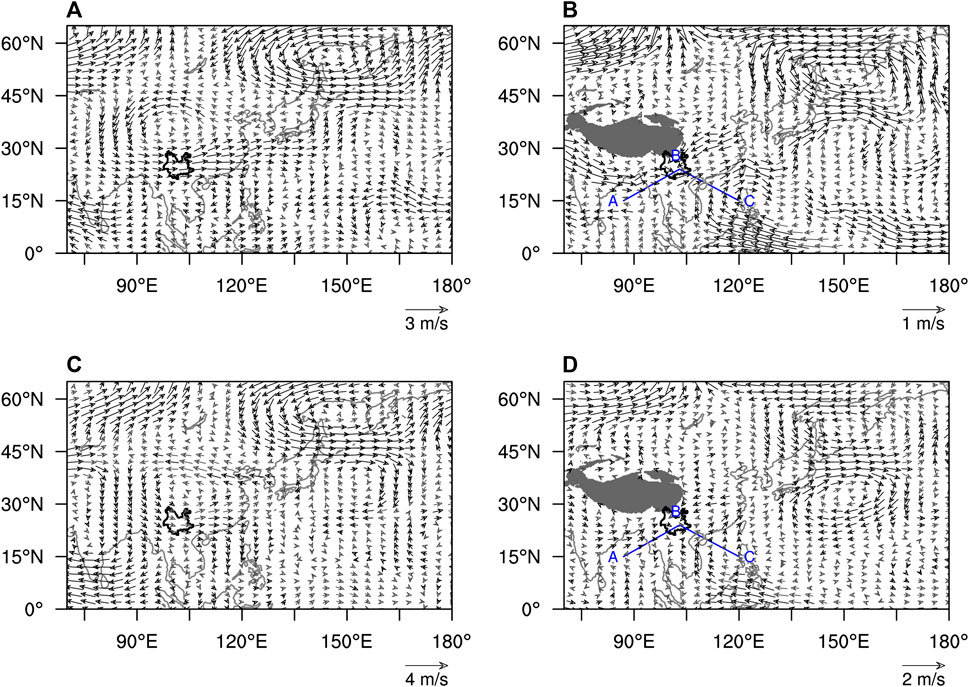
FIGURE 3. Regression of the interdecadal component of the JJA mean (A) 200 hPa horizontal winds (vector, units: ms−1), (B) 700 hPa horizontal winds (vector, units: ms−1) against the ID-PC1. Panels (C,D) are the same as (A,B), except for the composite of the JJA mean variables between the wet and dry periods. The black vectors denote significance at the 95% confidence level. The letters (A–C) stand for three anomaly centers. The black solid line marks the boundary of Yunnan. The gray shadings in (B,D) represent the topography.
The link between the anomalous anticyclones over the Indo-Pacific warm pool and the anomalous cyclone over Yunnan is evident on the regression map of vertical circulation (Figure 4A). The anomalous descent over the BOB (point A) is associated with anomalous ascent to the southwest of Yunnan, which further enhances the ascending motion over Yunnan (point B). The anomalous ascent over Yunnan and the anomalous descent over the WPWP (point C) forms an anomalous anticlockwise circulation. Thus, the enhanced descending motion associated with anomalous anticyclones over the BOB and the WPWP would simultaneously intensify the rising motion over Yunnan. The composite result resembles the regression pattern (Figure 4B). The anomalous ascent over Yunnan is associated with an anomalous ascent over the East Asia coastal areas and an anomalous descent over the WNP (Figure 4C). The composite vertical circulation resembles the regression pattern (Figure 4D). Thus, the anomalous anticyclones over the BOB and the WPWP, and the anomalous descent over the WNP are main boosters of the rising motion over Yunnan. The enhanced convection over Yunnan provides the dynamical condition for precipitation.
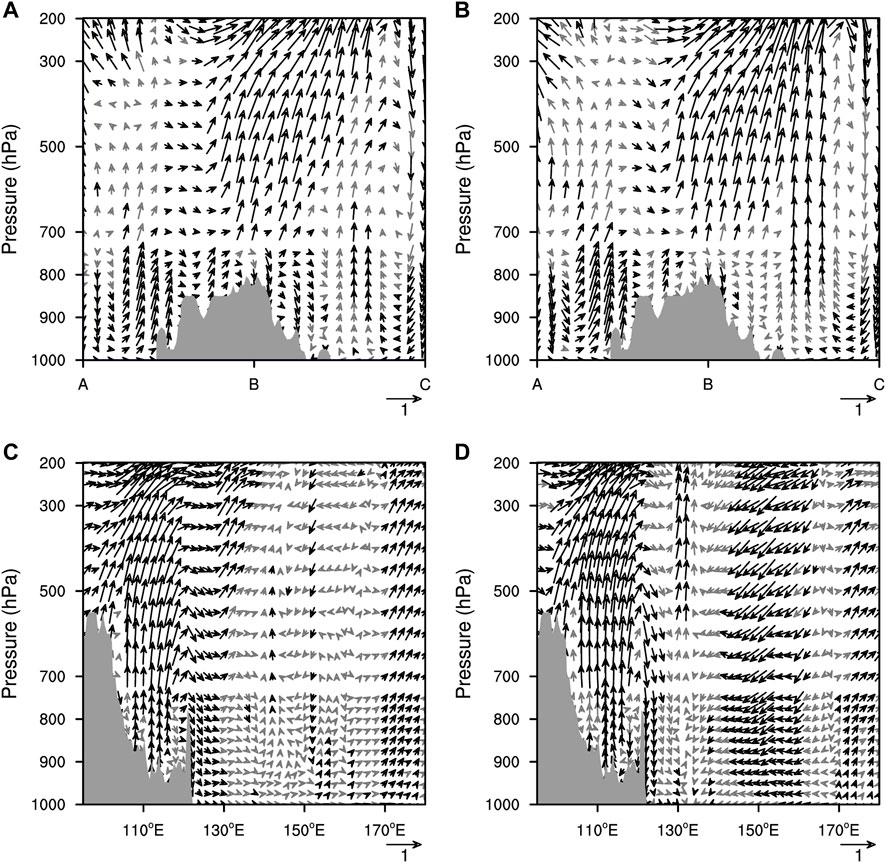
FIGURE 4. The anomalous vertical circulation derived from (A) regression against the ID-PC1 and (B) composite between the wet and dry periods along the line ABC of Figure 3A, and the anomalous vertical circulation averaged between 20°N and 30°N for (C) regression against the ID-PC1 and (D) composite between the wet and dry periods (unit: ms−1 for horizontal wind and 10–2 Pa s−1 for vertical velocity). The black vectors denote significance at the 95% confidence level. The gray shading represents the topography.
4.2 Decomposition of moisture transport
The column-integrated water vapor flux (CIWVF) shows an anomalous pattern basically consistent with the 700 hPa horizontal wind pattern (Figures 3B, D). Specifically, the anomalous anticyclone over the BOB facilitates the moisture transport from northern BOB to Yunnan (Figure 5A). The anomalous anticyclone over the WPWP also pushes the water vapor from the WPWP to southeastern Yunnan. The anomalous cyclone over Yunnan reinforces the water vapor supply from the BOB and the WPWP. The divergence of CIWVF (CIWVFD) shows significant negative anomalies over Yunnan, suggesting a strengthened moisture convergence favoring precipitation (Figure 5B). The composite results resemble the regression patterns of both the CIWVF and the CIWVFD (Figures 5C, D). Compared with the regression pattern, the composite pattern shows larger variation magnitude and more areas passing the significance test.
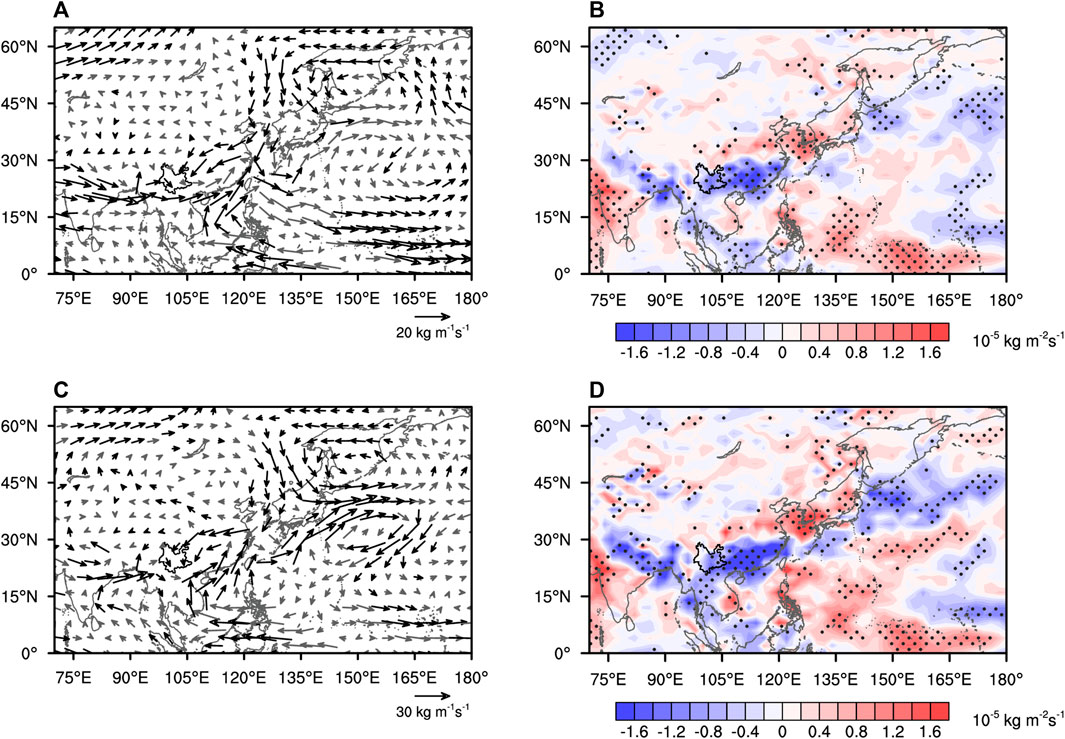
FIGURE 5. The anomalous CIWVF in summer derived from (A) regression against the ID-PC1 and (C) composite between the wet and dry periods (units: kg m−1 s−1). Panels (B,D) are the same as (A,C) except for the CIWVFD (units: 10−5 kg m−2 s−1). The black vectors denote significance at the 95% confidence level. The stippling in (B,D) denotes significance at the 95% confidence level. The black solid line marks the boundary of Yunnan.
The CIWVFD can be decomposed into three terms that represent the dynamical effect of wind anomalies, the thermodynamical effect of specific humidity anomalies, and the perturbation effect of both wind anomalies and specific humidity anomalies (Eq. 1). The regressed anomalies of dynamical term
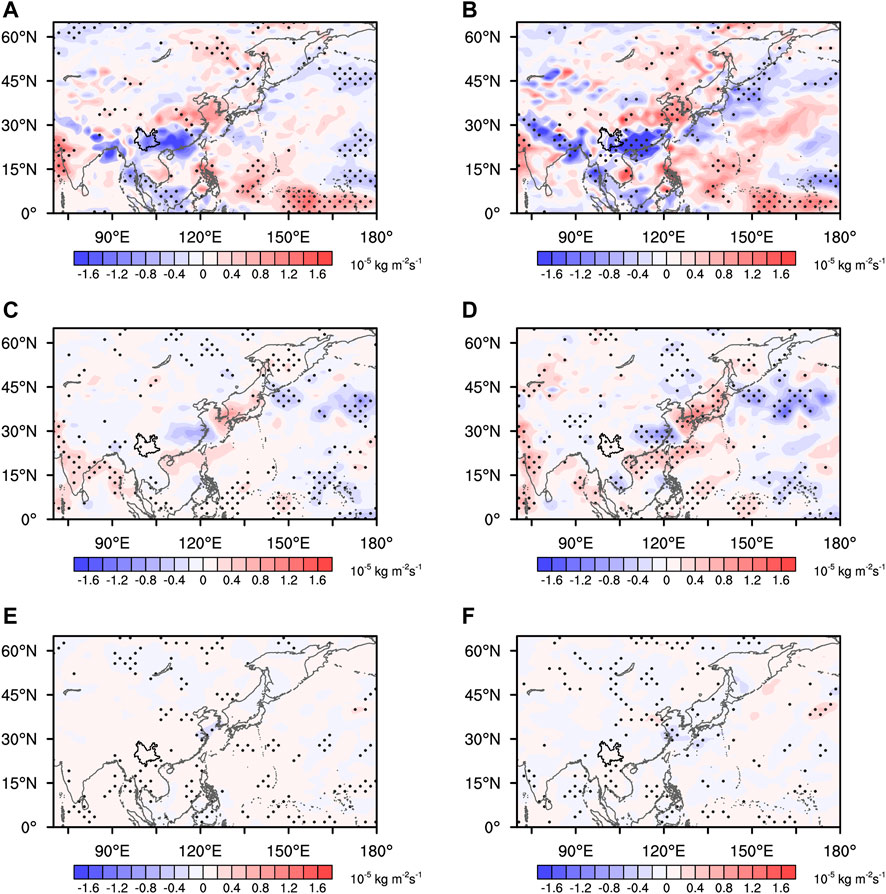
FIGURE 6. Regression coefficient of (A) dynamical term
4.3 SST configuration
To identify the SST drivers for the IDV of summer rainfall in Yunnan, we regressed the JJA mean SST against the ID-PC1. The JJA mean SST was detrended and 7-year low-pass filtered before regression. Results show a uniform decrease in the SST over the BOB and the WPWP regions, and a tripole SSTA pattern over the WNP (Figure 7A). The significant SST decrease over the BOB and the WPWP is mainly over the equatorial parts of these two regions. Whereas the tripole SSTA pattern characterizes a significant SST decrease over the tropical WNP and the northern WNP, with a significant SST increase in between the two regions. The composite SSTAs have a similar pattern to the correlation pattern (Figure 7B). We defined three SST indices to describe the IDV of the SSTAs over the BOB, the WPWP, and the WNP regions. The SST index for the BOB region is defined as the area average SST over (2.5°N–22.5°N, 80°E–105°E), and the SST index for the WPWP region is defined as the area average SST over (2.5°N–22.5°N, 105°E–130°E). Since the WNP tripole (WNPT) pattern resembles the North Atlantic tripole (NAT) but positioned at the WNP, we referred to Wu’s definition of the NAT index to define the index of the WNPT pattern (Wu et al., 2011). The WNPT index is defined as (S* + N*)/2 − M*, where S*, N*, and M* refer to the normalized SST anomalies averaged over (2.5°N–17.5°N, 130°E–150°E), (25°N–40°N, 140°E–160°E), and (45°N–60°N, 140°E–160°E), respectively.
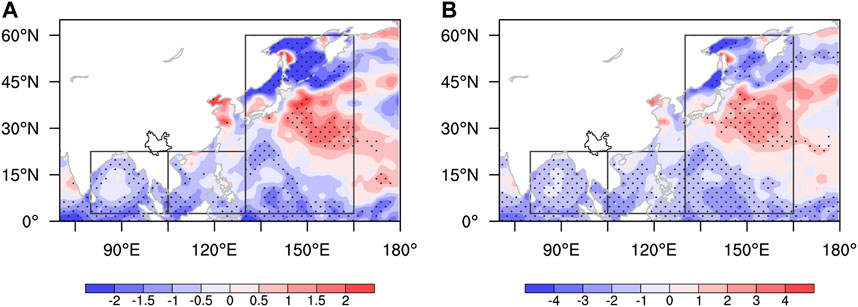
FIGURE 7. Regression coefficient of the JJA mean SST (units: K 10 years−1), (B) are the same as (A), except for composite differences of the JJA mean variables between the relatively wet period and the relatively dry period. The stippling denotes the differences significant at the 95% confidence levels. The region bounded by the black solid line indicates the Yunnan. Black boxes are SST key zones of the BOB, the WPWP, and the WNPT.
The IDV of summer precipitation in Yunnan is forced by the combined effect of the SSTAs over the BOB, the WPWP, and the WNP regions. To determine their relative contribution to the IDV of summer precipitation, we adopted the relative weights analysis to calculate the contribution rate of each SSTA (Johnson, 2000; Tonidandel and LeBreton, 2011). Specifically, the SST indices defined above represent the SSTAs over respective regions. The 7-year low-pass filtered average summer precipitation in Yunnan represents the IDV of summer precipitation. Results indicate that the contribution rate is 34% for the SSTA over the BOB, 20% for the SSTA over the WPWP, and 46% for the SST tripole over the WNP. Since the BOB and the WPWP regions constitute a major part of the northern Indo-Pacific warm pool, the combined effect of the BOB and the WPWP (54%) approximately equals to that of the WNP. Thus, we could assume that the northern Indo-Pacific warm pool and the WNP share an equal contribution to the IDV of summer precipitation in Yunnan.
5 Modelling results
We used the SPEEDY model to verify the effect of the SSTAs over the BOB and the WPWP on the IDV of summer precipitation in Yunnan. The SST forcing is set to the composite SSTA in Figure 7 over respective regions. Specifically, the negative SSTA over the BOB (BOB-) is used in the experiment No. 1 (EXP1, Figure 8A), the reversed SSTA over the BOB (BOB+) is used in the experiment No. 2 (EXP2, Figure 8B), the negative SSTA over the WPWP (WPWP-) is used in the experiment No. 3 (EXP3, Figure 8C), the reversed SSTA (WPWP+) is used in the experiment No. 4 (EXP4, Figure 8D), the WNP tripole (WNPT-) is used in the experiment No. 5 (EXP5, Figure 8E), the reversed SSTA (WNPT+) is used in the experiment No. 6 (EXP6, Figure 8F), the negative SSTAs over the BOB and the WPWP regions (BOB-&WPWP-) are used in the experiment No. 7 (EXP7, Figure 8G), and the reversed SSTAs (BOB+&WPWP+) are used in the experiment NO. 8 (EXP6, Figure 8H), the SSTAs over three regions (BOB-&WPWP-&WNPT-) are used in the experiment No. 9 (EXP9, Figure 8I), and the reversed SSTAs (BOB+&WPWP+&WNPT+) are used in the experiment No. 10 (EXP10, Figure 8J). In each experiment, the SSTAs are superimposed onto the climatological monthly mean SST in summer. For other seasons, the SSTAs are set to zero. The air-sea coupling is activated outside the prescribed SSTA regions. The model is integrated for 31 years in each experiment, and the first year of model integration is treated as the spin-up period. The model output of the last 30 years is used for analysis.
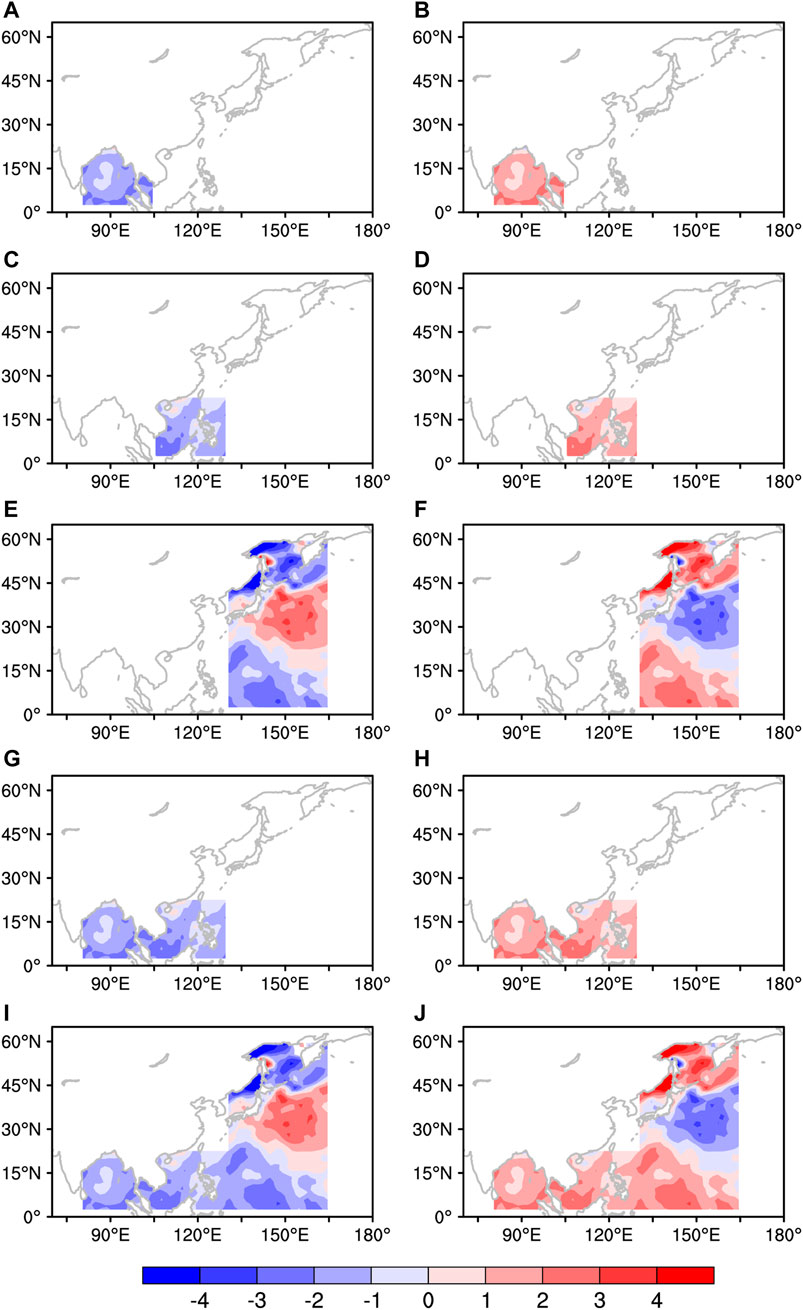
FIGURE 8. The SSTAs superimposed onto the SPEEDY model for (A) the BOB−, (B) the BOB+, (C) WPWP−, (D) WPWP+, (E) WNPT−, (F) WNPT+, (G) BOB−&WPWP−, (H) BOB+&WPWP+, (I) BOB−&WPWP−&WNPT−, (J) BOB+&WPWP+&WNPT+ experiments (units: K 10 years−1).
The negative SSTA over the BOB induces a significant low-level anticyclonic anomaly over the Indian subcontinent and the BOB (Figure 9A). This anomalous anticyclone is centered to the northwest of the SSTA, suggesting a Gill-Matsuno-type response. The westerly anomalies over the northern flank of the anticyclone favor the water vapor transport from the BOB to Yunnan. The westerly anomalies also conduce to the formation of an anomalous convergence over Yunnan. Consequently, the precipitation increases over Yunnan, but the significant changes are located to the South of Yunnan (Figure 9B). The negative SSTA over the WPWP induces an anomalous anticyclone stretching from tropical Northern IO to tropical WNP (Figure 9C). This elongated anticyclone also resembles the Gill-Matsuno-type response to the SSTA over the WPWP. The anomalous anticyclone enhances the anomalous convergence over Yunnan, causing a significant increase in precipitation (Figure 9D). Compared with the atmospheric response to the SSTA over the BOB, the SSTA over the WPWP further strengthens the Southwesterly anomalies over southeastern Yunnan. The WNPT induces an anticyclonic anomaly over the northern WNP and a cyclonic anomaly over the central WNP (Figure 9E). This anomalous anticyclone–cyclone pair resembles the atmospheric response to the North Atlantic tripole. The cyclonic anomaly over the central WNP weakens the WNPSH that further strengthens the anomalous convergence over Yunnan. The negative SSTA over the tropical WNP induces an anomalous anticyclone that also strengthens the cyclonic curvature over Yunnan. Consequently, the precipitation increases in Yunnan (Figure 9F).
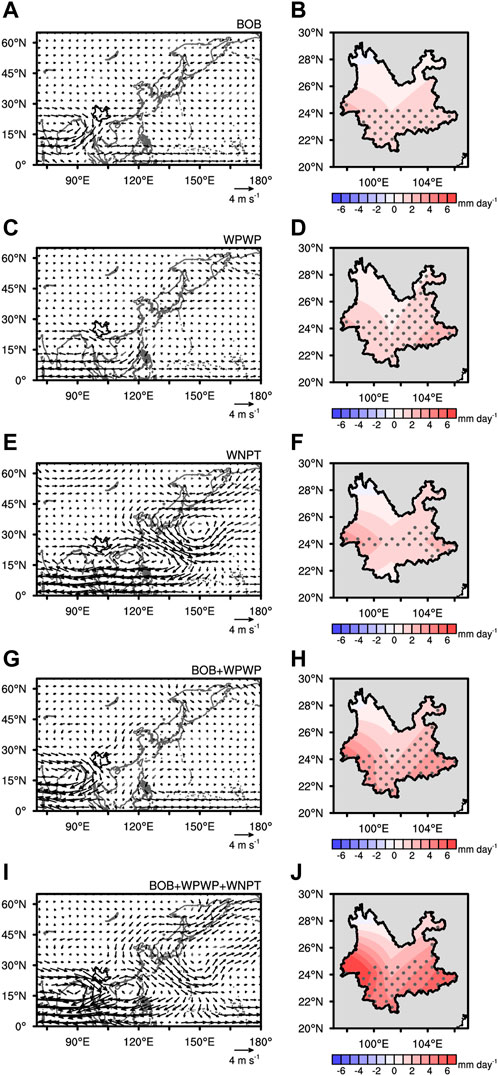
FIGURE 9. Difference in (A) 700 hPa horizontal wind and (B) precipitation between the BOB− and the BOB+ experiments. Panels (C,D) are the same as (A,B) except for the difference between the WPWP− and the WPWP+ experiments. Panels (E,F) are the same as (A,B) except for the difference between the WNPT− and the WNPT+ experiments. Panels (G,H) are the same as (A,B) except for the difference between the BOB−&WPWP− and the BOB+&WPWP+ experiments. Panels (I,J) are the same as (A,B) except for the difference between the BOB−&WPWP−&WNPT− and the BOB+&WPWP+&WNPT+ experiments. The black vectors in (A), (C), (E), (G), (I) denote the difference is significant at the 95% confidence level, and the stippling in (B), (D), (F), (H), (J) denote significant difference at the 95% confidence level.
The combined SSTAs over the BOB and the WPWP induce a stronger anticyclonic anomaly over the tropical IO and tropical WNP, making a stronger cyclonic anomaly over Yunnan (Figure 9G). The precipitation increases more than that in the single SSTA forcing experiments (Figure 9H). The WNPT reinforces the cyclonic anomaly over Yunnan by inducing a stronger anticyclonic anomaly over the Indo-Pacific warm pool and a stronger cyclonic over the WNP (Figure 9I). The horizontal wind pattern suggests an intensified cyclonic curvature over southern Yunnan, associated with a weakened WNPSH. Consequently, the combined SSTAs over the three regions induces the largest increase in precipitation (Figure 9J). The anticyclonic anomaly over the central WNP (Figures 3B, D) is located to the east of 150°E in the model results, suggesting that the local air-sea coupling (not applicable in the prescribed SST forcing) also matters to the horizontal wind patterns.
The CIWVF resembles the 700 hPa horizontal wind pattern in each experiment (Figures 10A, D, G, J, 10 m). The SSTA over the BOB mainly enhances the moisture transport from tropical IO to Yunnan (Figure 10B). Likewise, the SSTA over the WPWP intensifies the moisture transport from the WPWP to Yunnan (Figure 10E). The WNPT induces the water vapor divergence over the tropical BOB, the WPWP, and the tropical WNP, which favors the moisture transport to Yunnan from the three regions (Figure 10H). The combined SSTAs over the BOB and the WPWP intensifies the water vapor divergence to the South of Yunnan, causing more moisture supply to Yunnan than under the single SSTA forcing (Figure 10K). The presence of WNPT reinforces the water vapor divergence over the tropical WNP and the WPWP (Figure 10J). Consequently, the moisture convergence over Yunnan is the strongest among all cases. The major contributor to the CIWVF, the dynamical term
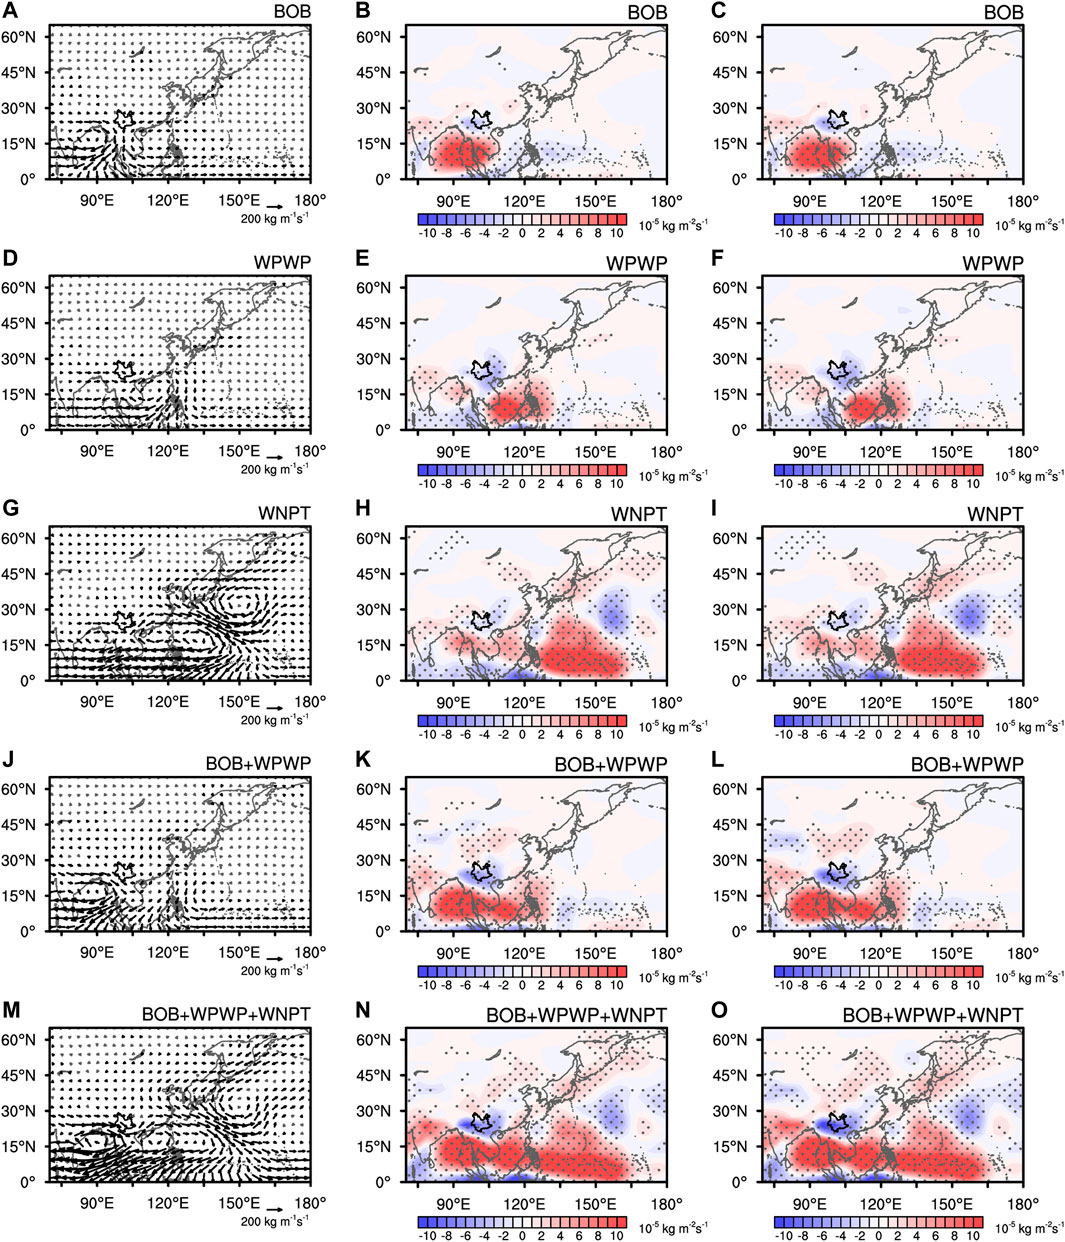
FIGURE 10. Difference in (A) the CIWVF, (B) the CIWVFD, and (C) the divergence of the dynamical term
6 Discussion and conclusion
In this study, the IDV of summer precipitation in Yunnan and its possible causes were investigated with the ground-observation data, the ERA5 and the HadISST reanalysis data during 1961–2019. Results suggest that the IDV of summer precipitation in Yunnan has a significant period of 9–11 years. The IDV pattern characterizes consistent changes regionwide, with large amplitude over the Southern and central-eastern Yunnan. The IDV of summer precipitation has undergone three dry-wet transitions since 1961. The phase change of the IDV characterizes a relatively wet period before 1974, a relatively dry period of 1983–1992, a relatively wet period of 1993–2002, and a relatively dry period of 2003–2019. The IDV of moisture transport is essential to the IDV of summer precipitation. The IDV of moisture supply over Yunnan is ascribed mainly to the dynamical term
The IDV of summer precipitation in Yunnan is attributed mainly to the SSTAs over the BOB, the WPWP, and the WNP regions. The negative SSTA over the BOB induces a Gill-Matsuno-type response that manifests as an anticyclonic anomaly over the Indian subcontinent—BOB region. This anomalous anticyclone intensifies westerly anomalies over the northern BOB that facilitates the moisture transport to Yunnan and strengthens the cyclonic anomaly over Yunnan. Likewise, the negative SSTA over the WPWP induces an elongated anticyclonic anomaly over the Northern Indo-Pacific warm pool. The anomalous anticyclone enhances the water vapor transport from the WPWP to Yunnan, and also strengthens the cyclonic anomaly over Yunnan. The SSTAs over the WNP characterizes a tripole pattern (WNPT) that favors the moisture transport from the BOB, the WPWP, and the WNP to Yunnan. The joint effect of SSTAs over the BOB and the WPWP intensifies the cyclonic anomaly over Yunnan and enhances the moisture transport from the BOB and the WPWP to Yunnan. The WNPT reinforces the moisture convergence over Yunnan by intensifying the anticyclonic anomaly over the Indo-Pacific warm pool and weakening the WNPSH. Consequently, Yunnan experienced a relatively wet period. The positive SSTAs over the BOB and the WPWP would induce the opposite atmospheric response that further reduces the precipitation in Yunnan. Numerical experiments confirm the modulating effect of the SSTAs over the three regions, and the primary contribution of the dynamical term
The main characteristics of anomalous circulation patterns associated with the IDV of summer precipitation in Yunnan still remain unchanged using the JRA55 dataset (Kobayashi et al., 2015) (Supplementary Figures S1, S2). The horizontal wind pattern characterizes an elongated anticyclonic anomaly over the Indo-Pacific warm pool associated with a weakened WNPSH. When the WNPSH is strengthened, the western ridge point shifts west and South that would form a high-pressure barrier from the WNP to the Indian subcontinent. This high-pressure barrier would impede the moisture transport to Yunnan and hence reduce the precipitation. When the WNPSH is weakened, the opposite condition occurs that conduces to summer precipitation in Yunnan. Note that the anomalous patterns also resemble the EAP teleconnection. For instance, the 850 hPa wind field characterizes an anticyclonic anomaly over the Western Pacific warm pool and a cyclonic anomaly over Northeast Asia. This dipole structure resembles the 850 hPa wind pattern during the EAP positive phase (Huang and Sun, 1992; Wu et al., 2016). The IDV of moisture flux and the SST pattern also resemble the EAP-related changes in the water vapor flux and the SST (Li et al., 2019b; Yin et al., 2021). Thus, the EAP pattern could be a primary factor of the IDV of summer precipitation in Yunnan. Since the EAP-related changes in precipitation are statistically insignificant over many parts of Yunnan, the EAP could indirectly affect the IDV of summer precipitation in Yunnan by reinforcing the anomalous wind patterns over Eastern China.
The IDV of summer precipitation in Yunnan could also link to the interdecadal oceanic modes in the Northern Indian Ocean and the Northern Pacific, such as the Pacific Decadal Oscillation (PDO), North Pacific Gyre Oscillation (NPGO) and the Indian Ocean Dipole (IOD). We calculated the correlation coefficient between the ID-PC1 of summer precipitation in Yunnan and the indices of oceanic decadal modes. The oceanic indices include the PDO index provided by the National Centers for Environmental Information (NCEI) (Deser and Trenberth, 2022), the NPGO index provided by Dr. Di Lorenzo (Di et al., 2008), and the IOD index provided by NOAA Physical Sciences Laboratory. The correlation coefficient is −0.10 between the ID-PC1 and the IOD index, −0.59 between the ID-PC1 and the NPGO index, and 0.15 between the ID-PC1 and the PDO index. Thus, only the NPGO is a potential driver of the IDV of summer precipitation in Yunnan. We further regressed the horizontal wind against the NPGO index normalized by its standard deviation. To facilitate comparison with the manuscript, a negative sign is added to the NPGO index before regression. Results show significant increases in precipitation over some parts of Yunnan (Supplementary Figure S3).
The regressed wind anomalies against the NPGO index characterize an anticyclonic anomaly over central Asia at 200 hPa (Supplementary Figure S4A). This anticyclonic anomaly resembles the regression pattern against the ID-PC1, but the anomalous anticyclone is centered to the North of 40°N. For the regression pattern against the ID-PC1, the anticyclonic anomaly is centered to the South of 40°N. The anomalous wind pattern at 850 hPa characterizes a cyclonic anomaly over western Pacific warm pool (to the East of point C), a weak cyclonic anomaly over subtropical Western Pacific, and an anticyclonic anomaly to the east of Japan (Supplementary Figure S4B). The anomalous cyclone over the western Pacific warm pool is opposite to the regression pattern against the ID-PC1. The regressed wind anomalies are statistically insignificant over the BOB (point A). The above wind anomalies resemble the regression pattern against the ID-PC1 over the Western North Pacific, but nearly opposite to the regression pattern against the ID-PC1 over the tropical Indian Ocean and the Western Pacific warm pool. This circulation pattern weakens the cyclonic curvature over Yunnan (point B). Consequently, the variation in precipitation is statistically insignificant over many parts of Yunnan. The above results suggest that the NPGO could affect the IDV of summer precipitation in Yunnan by inducing a wind anomaly pattern over the western North Pacific.
This study indicates that the IDV of summer precipitation in Yunnan is affected mainly by the WNP rather than the IO. Nevertheless, previous studies suggest that the interannual variation of summer precipitation in Yunnan is attributed mainly to the IO (Cao et al., 2014; Wang et al., 2018). Thus, the major contributor to the summer precipitation in Yunnan varies with the timescales of variability. The SST configuration involves the SSTAs over three regions, i.e., the BOB, the WPWP, and the WNP regions. To reveal the potential linkage among the SSTAs, we calculated the correlation coefficients between each pair of the SST indices (Supplementary Figure S5). Only the SST indices of the BOB and the WPWP are significantly correlated with each other (Supplementary Table S1). We further calculated the correlation coefficient between each SST index and the interdecadal SST data (Supplementary Figure S6). The correlation maps also show significant SSTAs over the BOB and the WPWP regions using the SST indices of the BOB and the WPWP (Supplementary Figures S6A, B), whereas the WNPT has little connection with the SSTA patterns over the BOB and the WPWP (Supplementary Figure S6C). Thus, there is a high possibility that the SSTAs over the BOB join forces with the SSTAs over the WPWP, but a low possibility for them to synergize with the WNPT pattern. There is a high possibility that the SSTAs over the BOB join forces with the SSTAs over the WPWP, but a slight lower possibility for them to synergize with the WNPT pattern. Given the coordinated variation in the SSTAs over different ocean areas, the impact of tropical Eastern Pacific and tropical North Atlantic still needs clarification. Other external forcings such as the snow cover and soil moisture, and the land-atmosphere interaction could also affect the IDV of summer precipitation in Yunnan. A further investigation from the above angles would greatly deepen the understanding of the IDV of summer precipitation in Yunnan.
Data availability statement
The ERA5 dataset for this study can be found at the Copernicus Climate Data Store [https://www.ecmwf.int/en/forecasts/dataset/ecmwf-reanalysis-v5]. The HadISST data can be found at the Met Office Hadley Centre [https://www.metoffice.gov.uk/hadobs/hadisst].
Author contributions
ZD: Data curation, Formal Analysis, Investigation, Writing–review and editing. SG: Formal Analysis, Investigation, Writing–original draft. RY: Conceptualization, Funding acquisition, Project administration, Resources, Supervision, Writing–review and editing. JC: Methodology, Visualization, Writing–review and editing. HY: Methodology, Visualization, Writing–review and editing. JM: Writing–review and editing.
Funding
National Natural Science Foundation of China, grant numbers 41975093, 42022035, and 42375050, the Natural Science Foundation of Yunnan Province, grant number 202302AN360006 and 202301AV070001.
Acknowledgments
The authors are thankful to Prof. Jie Cao from Yunnan University, Prof. Chuanfeng Zhao from Peking University, and Prof. Lin Wang from the Institute of Atmospheric Physics, Chinese Academy of Science, for their constructive comments of research analysis.
Conflict of interest
The authors declare that the research was conducted in the absence of any commercial or financial relationships that could be construed as a potential conflict of interest.
Publisher’s note
All claims expressed in this article are solely those of the authors and do not necessarily represent those of their affiliated organizations, or those of the publisher, the editors and the reviewers. Any product that may be evaluated in this article, or claim that may be made by its manufacturer, is not guaranteed or endorsed by the publisher.
Supplementary material
The Supplementary Material for this article can be found online at: https://www.frontiersin.org/articles/10.3389/fenvs.2023.1281202/full#supplementary-material
References
Afyouni, S., Smith, S. M., and Nichols, T. E. (2019). Effective degrees of freedom of the Pearson's correlation coefficient under autocorrelation. NeuroImage 199, 609–625. doi:10.1016/j.neuroimage.2019.05.011
Cao, J., Gui, S., Su, Q., and Yang, Y. (2016). The variability of the Indian–East Asian summer monsoon interface in relation to the spring seesaw mode between the Indian Ocean and the central-western pacific. J. Clim. 29, 5027–5040. doi:10.1175/JCLI-D-15-0839.1
Cao, J., Hu, J., and Tao, Y. (2012). An index for the interface between the Indian summer monsoon and the East Asian summer monsoon. J. Geophys. Res. Atmos. 117. doi:10.1029/2012JD017841
Cao, J., Yao, P., Wang, L., and Liu, K. (2014). Summer rainfall variability in low-latitude highlands of China and subtropical Indian Ocean Dipole. J. Clim. 27 (2), 880–892. doi:10.1175/JCLI-D-13-00121.1
Chen, Y., Guo, S., Liu, Y., Ju, J., and Ren, J. (2017). Interannual variation of the onset of yunnan’s rainy season and its relationships with the arctic oscillation of the preceding winter. Atmos. Clim. Sci. 7, 210–222. doi:10.4236/acs.2017.72015
Cheng, J. G., Yan, H. M., and Yan, H. S. (2009). Characteristics and causes of major climate disasters in Yunnan. Beijing: Meteorological Publishing House.
Deser, C., and Trenberth, K. (2022). “Atmospheric research staff,” in Last modified 2022-09-09 "the climate data guide: Pacific decadal oscillation (PDO): Definition and indices. Available at: https://climatedataguide.ucar.edu/climate-data/pacific-decadal-oscillation-pdo-definition-and-indices on 2023-09-04.
Di, L. E., Schneider, N., Cobb, K. M., Chhak, K., Franks, P. J. S., Miller, A. J., et al. (2008). North Pacific Gyre Oscillation links ocean climate and ecosystem change. Geophys. Resarch Lett. 35, L08607. doi:10.1029/2007GL032838
Dong, D. H., Tao, W. C., Lau, L., Li, Z. Q., Huang, G., and Wan, P. F. (2019). Interdecadal variation of precipitation over the hengduan mountains during rainy seasons. J. Clim. 32, 3743–3760. doi:10.1175/JCLI-D-18-0670.1
Duan, X., Ju, J. H., and Xiao, Z. N. (2000). Research on physical processes and prediction signals of climate anomalies in Yunnan. Beijing: Meteorological Press, 1–154.
Gao, L., Han, X., Chen, X. L., Liu, B. Q., and Li, Y. (2023). The spring drought in yunnan province of China: Variation characteristics, leading impact factors, and physical mechanisms. Atmosphere 14, 294. doi:10.3390/atmos14020294
Gong, D. Y., and Ho, C. H. (2002). Shift in the summer rainfall over the Yangtze River valley in the late 1970s. Geophys. Res. Lett. 29, 78-1–78-4. doi:10.1029/2001GL014523
Guo, Y. R., Cao, J., Li, H., Wang, J., and Ding, Y. C. (2016). Simulation of the interface between the Indian summer monsoon and the East Asian summer monsoon: Intercomparison between MPI-ESM and ECHAM5/MPI-OM. Adv. Atmos. Sci. 33, 294–308. doi:10.1007/s00376-015-5073-z
Han, Y., Jiang, X. J., He, T., Wang, D., Guo, N., Zhang, X., et al. (2018). PD-1/PD-L1 inhibitor screening of caffeoylquinic acid compounds using surface plasmon resonance spectroscopy. Water Resour. Dev. Manag. 2, 52–56. doi:10.1016/j.ab.2018.02.003
He, Y., Zhou, C., and Ahmed, T. (2021). Vulnerability assessment of rural social-ecological system to climate change: A case study of yunnan province, China. Int. J. Clim. Change Strategies Manag. 13, 162–180. doi:10.1108/IJCCSM-08-2020-0094
Hu, Z. Z. (1997). Interdecadal variability of summer climate over East Asia and its association with 500 hPa height and global sea surface temperature. J. Geophys. Res. Atmos. 102, 19403–19412. doi:10.1029/97JD01052
Huang, R. H., Liu, Y., Wang, L., and Wang, L. (2012). Analyses of the causes of severe drought occurring in southwest China from the fall of 2009 to the spring of 2010. Atmos. Sci. 36, 443–457. doi:10.3878/j.issn.1006-9895.2011.11101
Huang, R., and Sun, F. (1992). Impacts of the tropical western Pacific on the East Asian summer monsoon. J. Meteorological Soc. Jpn. 70, 243–256. doi:10.2151/jmsj1965.70.1B_243
Johnson, J. W. (2000). A heuristic method for estimating the relative weight of predictor variables in multiple regression. Multivar. Behav. Res. 35, 1–19. doi:10.1207/S15327906MBR3501_1
Kobayashi, S., Ota, Y., Harada, Y., Ebita, A., Moriya, M., Onoda, H., et al. (2015). The JRA-55 Reanalysis: General specifications and basic characteristics. J. Meteorological Soc. Jpn. 93, 5–48. doi:10.2151/jmsj.2015-001
Kucharski, F., Molteni, F., King, M. P., Farneti, R., Kang, I.-S., and Feudale, L. (2013). On the need of intermediate complexity general circulation models: A “SPEEDY” example. Bull. Am. Meteorological Soc. 94, 25–30. doi:10.1175/BAMS-D-11-00238.1
Li, C., Peng, L., Zhou, M., Wei, Y., Liu, L., Li, L., et al. (2022). SIF-based GPP is a useful index for assessing impacts of drought on vegetation: An example of a mega-drought in yunnan province, China. Remote Sens. 14, 1509. doi:10.3390/rs14061509
Li, S., Feng, G., Hou, W., and Cheng, J. (2019a). Characteristics of atmospheric circulation patterns over East Asia and their impacts on precipitation in summer. Clim. Res. 78, 117–133. doi:10.3354/cr01544
Li, Y. J., Wang, Z. X., Zhang, Y. Y., Li, X., and Huang, W. (2019b). Drought variability at various timescales over yunnan province, China: 1961-2015. Theor. Appl. Climatol. 138, 743–757. doi:10.1007/s00704-019-02859-z
Liu, F., Ouyang, Y., Wang, B., Yang, J., Li, J., and Hsu, P. C. (2020). Seasonal evolution of the intraseasonal variability of China summer precipitation. Clim. Dyn. 54, 4641–4655. doi:10.1007/s00382-020-05251-0
Liu, J. P., Ren, H. L., Li, W. J., and Zuo, J. (2018b). Remarkable impacts of Indian Ocean sea surface temperature on interdecadalvariability of summer rainfall in Southwestern China. Atmosphere 9, 103. doi:10.3390/atmos9030103
Liu, L., Cao, J., and He, D. (2011). Interdecadal variation of heavy precipitation events and their causes in the low latitude plateau of China. Atmos. Sci. 35, 435–443.
Liu, S. G., Leng, X. X., Sun, G. Z., Peng, Y. L., Huang, Y. F., and Yang, Q. L. (2018a). Assessment of drought characteristics in Yunnan Province based on SPI and SPEI from 1961-2100. J. Agric. Mach. 49, 236–245+299. doi:10.6041/j.issn.1000-1298.2018.12.029
Liu, Y. Y., Hu, Z. Z., Wu, R. G., and Yuan, X. (2022). Causes and predictability of the 2021 spring southwestern China severe drought. Adv. Atmos. Sci. 39, 1766–1776. doi:10.1007/s00376-022-1428-4
Lü, J. M., Ju, J. H., Ren, J. Z., and Gan, W. W. (2012). The influence of the Madden-Julian Oscillation activity anomalies on Yunnan’s extreme drought of 2009-2010. Sci. Sin. Terrae 42, 98–112. doi:10.1007/s11430-011-4348-1
Lü, J. M., Zhu, C. W., Ju, J. H., and Lin, X. (2014). Interdecadal variability in summer precipitation over east China during the past 100 Years and its possible causes. Chin. J. Atmos. Sci. 38, 782–794. doi:10.3878/j.issn.1006-9895.1401.13227
Molteni, F. (2003). Atmospheric simulations using a gcm with simplified physical parametrizations. I: Model climatology and variability in multi-decadal experiments. Clim. Dyn. 20, 175–191. doi:10.1007/s00382-002-0268-2
Nitta, T., and Hu, Z. Z. (1996). Summer climate variability in China and its association with 500 hPa height and tropical convection. J. Meteorological Soc. Jpn. 74, 425–445. doi:10.2151/jmsj1965.74.4_425
Park, J. H., and An, S. I. (2014). The impact of tropical western Pacific convection on the North Pacific atmospheric circulation during the boreal winter. Clim. Dyn. 43, 2227–2238. doi:10.1007/s00382-013-2047-7
Pradhan, N. S., Fu, Y., Zhang, L., and Yang, Y. (2017). Farmers’ perception of effective drought policy implementation: A case study of 2009–2010 drought in yunnan province, China. Land Use Policy 67, 48–56. doi:10.1016/j.landusepol.2017.04.051
Qin, J. (1998). Climate change and analysis of agrometeorological hazards in Yunnan. Meteorology 24, 45–51.
Shi, Z., Sha, Y., and Liu, X. (2017). Effect of yunnan–guizhou topography at the southeastern Tibetan plateau on the Indian monsoon. J. Clim. 30, 1259–1272. doi:10.1175/JCLI-D-16-0105.1
Tao, Y., Cao, J., Lan, G., and Su, Q. (2016). The zonal movement of the Indian-East Asian summer monsoon interface in relation to the land-sea thermal contrast anomaly over East Asia. Clim. Dyn. 46, 2759–2771. doi:10.1007/s00382-015-2729-4
Tao, Y., Zhang, W. C., Duan, C. C., Chen, Y., Ren, J. Z., Xing, D., et al. (2014). Climatic causes of continuous drought over Yunnan Province from 2009 to 2012. J. Yunnan Univ. Nat. Sci. Ed. 36, 866–874. doi:10.7540/j.ynu.20140312
Tonidandel, S., and LeBreton, J. M. (2011). Relative importance analysis: A useful supplement to regression analysis. J. Bus. Psychol. 26, 1–9. doi:10.1007/s10869-010-9204-3
von Storch, H., and Zwiers, F. W. (2002). Statistical analysis in climate research. Cambridge: Cambridge University Press.
Wang, L., Gui, S., Cao, J., and Yan, H. (2018). Summer precipitation anomalies in the low-latitude highlands of China coupled with the subtropical Indian Ocean dipole-like sea surface temperature. Clim. Dyn. 51 (7), 2773–2791. doi:10.1007/s00382-017-4044-8
Wang, L., Huang, G., Chen, W., Zhou, W., and Wang, W. Q. (2018). Wet-to-dry shift over Southwest China in 1994 tied to the warming of tropical warm pool. Clim. Dyn. 51, 3111–3123. doi:10.1007/s00382-018-4068-8
Wang, S. S., Huang, J. P., and Yuan, X. (2021). Attribution of 2019 extreme spring-early summer hot drought over yunnan in southwestern China. Bull. Am. Meteorological Soc. 102, S91–S96. doi:10.1175/bams-d-20-0121.1
Wang, Y., Wang, Y., Chen, Y., Chen, H., Li, X., Ding, Z., et al. (2023). Spatial and temporal characteristics of drought events in southwest China over the past 120 years. Remote Sens. 15, 3008. doi:10.3390/rs15123008
Wen, D. Y., Cao, J., Zhao, C. X., Masiri, I., and Buntoung, S. (2021). Interdecadal variation of summer rainfall in the Greater Mekong Subregion and its possible causes. Environ. Res. Lett. 6, 084064–084069. doi:10.1088/1748-9326/ac188b
Wu, B., Zhou, T., and Li, T. (2016). Impacts of the pacific–Japan and circumglobal teleconnection patterns on the interdecadal variability of the East asian summer monsoon. J. Clim. 29, 3253–3271. doi:10.1175/JCLI-D-15-0105.1
Wu, R. G., Wen, Z. P., Yang, S., and Li, Y. Q. (2010). An interdecadal change in Southern China Summer Rainfall around 1992/93. J. Clim. 23, 2389–2403. doi:10.1175/2009JCLI3336.1
Wu, R., Yang, S., Liu, S., Sun, L., Lian, Y., and Gao, Z. (2011). Northeast China summer temperature and North Atlantic SST. J. Geophys. Res. Atmos. 116 (16), D16116. doi:10.1029/2011JD015779
Xie, S. P., Hu, K. M., Hafner, J., Tokinaga, H., Du, Y., Huang, G., et al. (2009). Indian ocean capacitor effect on indo-western pacific climate during the summer following el niño. J. Clim. 22, 730–747. doi:10.1175/2008JCLI2544.1
Yan, H. M., Li, Q. Q., and Wang, D. Q. (2018). Spatial and temporal characteristics of the rainy season in Yunnan and the relationship with atmospheric circulation changes. J. Trop. Meteorology 34, 12–22. doi:10.16032/j.issn.1004-4965.2018.01.002
Yin, X. X., Zhou, L. T., and Huang, J. F. (2021). Weakened connection between east China summer rainfall and the East asia-pacific teleconnection pattern. Atmosphere 12, 704. doi:10.3390/atmos12060704
Zheng, J., Huang, W., Chen, Y., and Zhou, J. (2017). Study on meteorological extreme-drought index for yunnan province. Plateau Meteorol. 36, 1039–1051. doi:10.7522/j.issn.1000-0534.2016.00067
Keywords: precipitation, interdecadal variation, SST configuration, Gill-Matsuno response, Bay of Bengal, western Pacific warm pool, western North Pacific subtropical high
Citation: Dong Z, Gui S, Yang R, Cheng J, Yang H and Ma J (2023) Interdecadal variation of precipitation over Yunnan, China in summer and its possible causes. Front. Environ. Sci. 11:1281202. doi: 10.3389/fenvs.2023.1281202
Received: 22 August 2023; Accepted: 12 September 2023;
Published: 25 September 2023.
Edited by:
Hainan Gong, Chinese Academy of Sciences (CAS), ChinaReviewed by:
Cheng Sun, Beijing Normal University, ChinaZhiqiang Gong, Beijing Climate Center (BCC), China
Copyright © 2023 Dong, Gui, Yang, Cheng, Yang and Ma. This is an open-access article distributed under the terms of the Creative Commons Attribution License (CC BY). The use, distribution or reproduction in other forums is permitted, provided the original author(s) and the copyright owner(s) are credited and that the original publication in this journal is cited, in accordance with accepted academic practice. No use, distribution or reproduction is permitted which does not comply with these terms.
*Correspondence: Ruowen Yang, eWFuZ3J1b3dlbkB5bnUuZWR1LmNu
†These authors have contributed equally to this work