 Wei Liu1*
 Jiayi Liu
 Marcus Feldman
- 1School of Public Administration, Xi’an University of Architecture and Technology, Xi’an, China
- 2School of Public Administration, Xi’an University of Finance and Economics, Xi’an, China
- 3School of Public Administration, Xi’an Jiaotong University, Xi’an, China
- 4Department of Biology, Stanford University, Stanford, CA, United States
Livelihood status of rural households is the focus of disaster resettlement research. Influenced by various factors, rural households face multiple environmental and social pressures after relocation, and the study of livelihood resilience and vulnerability provides a new framework for research into the livelihoods of relocated households. There has been a call for more quantitative evidence about the links between livelihood resilience and livelihood vulnerability in the context of disaster resettlement. This study uses data from a sample of 657 individuals from the relocation area of Ankang prefecture in southern Shaanxi, China. The resilience of rural household livelihood systems is quantified in terms of two dimensions of general resilience and specific resilience using the spatial vector method from systems engineering. The IPCC framework was used to measure three dimensions of livelihood vulnerability: exposure, sensitivity, and adaptability, and a threshold regression model was applied to investigate the impacts of livelihood resilience on livelihood vulnerability. Results show that: (i) livelihood vulnerability of relocated households (−0.042) was significantly lower than that of local households (0.091), while relocated households in the process of livelihood reconstruction had a certain degree of vulnerability risk. (ii) there is a significant threshold effect of livelihood resilience on livelihood vulnerability of rural households. (iii) increasing livelihood resilience significantly reduced the degree of vulnerability of rural households, and the marginal effect of general resilience on livelihood vulnerability shows a decreasing trend. Specific resilience has a positive influence on livelihood vulnerability before it exceeds the threshold, but the effect disappears above the threshold of resilience. (iv) The threshold value of livelihood resilience of local households (0.5039) is generally lower than that of relocated households (0.6548), and relocation does improve the ability of rural households to resist uncertainty risks. It is necessary for local governments to formulate more targeted policies to reduce the livelihood vulnerability of rural households and thereby promote sustainable livelihood development.
1 Introduction
Disaster resettlement is a tactic for alleviation of suffering for those who cannot reside in their original communities because of widespread hazards (Xu et al., 2022). Previous studies on disaster resettlement have mostly focused on climate-change-induced relocations such as floods (Kita, 2017), earthquakes (Bahadur, 2021) or tsunamis (Weerasena et al., 2018), or development-induced relocations such as the construction of dams and hydro power projects (Reddy, 2018; Mavhura, 2020). Although there has been considerable literature about the ecological (Chen and Tsai, 2021) and demographic (Lo and Wang, 2018) aspects of disaster resettlement, less is known about how to accomplish livelihood reconstruction in the case of disaster resettlement. Indeed, livelihood is a major challenge for resettlement projects and is a meaningful and necessary perspective for exploring the impacts of disaster-related resettlement. This article expands on previous research on disaster resettlement by studying the relationship between livelihood resilience and livelihood vulnerability at the household level in rural resettlement areas of China. The concepts of resilience and vulnerability are intertwined (Gallopín, 2006). However, they have often been used separately to analyze livelihood responses to perturbations (Eadie et al., 2020; Sunil et al., 2023), or to construct a framework including both, while still studying the impact of external changes separately (Nath et al., 2020; Tina et al., 2022). Importantly, the livelihood resilience and vulnerability of rural households have received less attention in the disaster resettlement context, especially in terms of analyzing the linkages between them. This paper focuses on the interactions between household livelihood resilience and livelihood vulnerability that might assist in local policymaking towards sustainable development.
The concept of resilience has its origins in ecological science as the ability of a system to maintain its original state when faced with change (Holling, 1973). Resilience has been a focus of study in many disciplines over recent decades (Walsh-Dilley et al., 2016). Much of this research has focused on natural sciences such as ecology and engineering (Brown, 2014), ignoring the political or social aspects (Quandt, 2018). In response to these neglects, livelihood is proposed as a new lens (Liu et al., 2020). Livelihood resilience is defined as the ability of an individual or household to cope with stresses or disturbances caused by environmental changes and to recover from their adverse impacts (Speranza et al., 2014). Empirical studies on this topic have found that the factors influencing livelihood resilience vary among regions in different geographical (Sun et al., 2023) and climatic contexts (Kumar et al., 2020), and in ecological settings (Rabiul and Greg, 2022). For example, coastal residents in Bangladesh have suffered severe damage to their livelihoods and assets due to cyclones (Salim et al., 2021). Prolonged drought has caused long-term damage to agricultural production in northern Ghana, severely reducing the resilience of livelihoods of local residents (Asante et al., 2021). These studies highlighted the critical role of social networks (Antonio et al., 2022), government documents (Daniel et al., 2019) and individual wellbeing (Dantje et al., 2019) in livelihood resilience assessment. Using synthetic evaluation (Liu et al., 2020), scenario simulation (Maksims and Francesco, 2021) and other methods to measure resilience, the study of resilience has shifted from temporal to spatial (Li et al., 2021a). This paper introduces the spatial vector approach of system dynamics to measure livelihood resilience, incorporating livelihood characteristics of rural households.
In the context of sustainable development, livelihood resilience is often connected to livelihood vulnerability. It is described as “the degree to which households are exposed to or unable to cope with natural, social, political, and economic pressures” (Zhang et al., 2022a). Vulnerability also has the meaning of “being open to harm or damage” (Taleb, 2014). Scholars have gradually turned to assessing livelihood vulnerability at the household level. Three main analytical frameworks have been proposed: (i) The Sustainable Livelihood Approach (SLA) proposed by the Department for International Development (DFID) in the United Kingdom, which explains the processes and mechanisms of livelihood vulnerability (Bhattacharjee and Behera, 2018). (ii) The exposure–sensitivity–adaptability analytical framework proposed by Polsky (Polsky et al., 2007) is used to assess the level of vulnerability. (ⅲ) A comprehensive livelihood vulnerability analysis framework developed by Reed to examine vulnerability to climate change (Reed et al., 2013). The “Exposure-Sensitivity-Adaptive Capacity” framework has been empirically tested in different regions and contexts such as India (Pankaj and Swades, 2022), Vietnam (Duc et al., 2022) and China (Huang et al., 2017; Zhang et al., 2018; Peng et al., 2018). For example, Reddy et al. built a multidimensional farmer distress index from a seven-dimensional study of risk exposure, adaptive capacity and sensitivity. It provides a reference for the sustainability and vulnerability of rural households’ livelihoods (Reddy et al., 2021). Here, we adopt this framework to quantify and calculate livelihood vulnerability.
We make the following two innovations: (i) we quantify and measure livelihood resilience based on the level of income of rural households and the type of livelihood activity rather than the traditional livelihood capital or the three major capabilities. At the same time, the spatial vector method in system dynamics is introduced into the calculation of livelihood resilience, which enriches the livelihood research methodology. (ii) We link livelihood resilience to livelihood vulnerability and explore the relationship between the two using a threshold regression approach in the hope that new contributions can be made. We first present the relevant concepts and then describe our data and methodology. We calculate livelihood resilience and livelihood vulnerability separately and explore the relationship between the two using a threshold regression model to find the threshold of resilience. Finally, we discuss our findings and summarize our conclusions.
2 Data and methods
2.1 Data source
The data for this article were obtained from a special survey on household livelihoods conducted in Ankang prefecture, southern Shaanxi, China (Figure 1). Our data came from the rural household survey conducted by the research group of the Population and Development Institute of Xi’an Jiaotong University in Ankang in 2015. The investigators were teachers, graduate students, and undergraduates from Xi’an Jiaotong University, Northwest University, and Xi’an University of Finance and Economics. Ankang is in southern Shaanxi, China, the hin-terland of the Qinling Mountains in the upper reaches of the Han River, and has always been a disaster-prone area. Disaster prevention and mitigation has been a priority for the local government. In 2011, the government of Shaanxi province launched a disaster resettlement program (Liu et al., 2020; Liu et al., 2022), whose aim was to help rural poor people in remote areas to re-locate to new settlement communities. Since the plan began, Ankang prefecture has moved 267,300 households, or 937,800 people, accounting for 39.7% of the total number of people moved in the province (Liu et al., 2020b). The plan faces great difficulties in local economic and social development as a disaster-prone, poverty-ridden, and ecologically important area. The present survey adopted convenience sampling for some administrative villages or resettlement communities, and randomly selected household members between the ages of 18 and 65 for interviews or other permanent residents who met the age requirement. Based on the representativeness and feasibility of sample selection, we conducted research in Ziyang County, Hanbin District, and Ningshan County. Considering ecological conditions, transportation availability, and types of migrant resettlement in the surveyed areas, three typical centralized resettlement communities were first selected in Ziyang county. Eight administrative villages in four towns in other two places where ecological compensation projects, such as returning farmland to forests, were implemented were also included in the sample frame. The contents of the survey included demographic characteristics, consumption behavior of rural households, and information related to relocation. A total of 657 valid questionnaires were obtained, of which 69.7% were from relocated households and 30.3% were from local households.
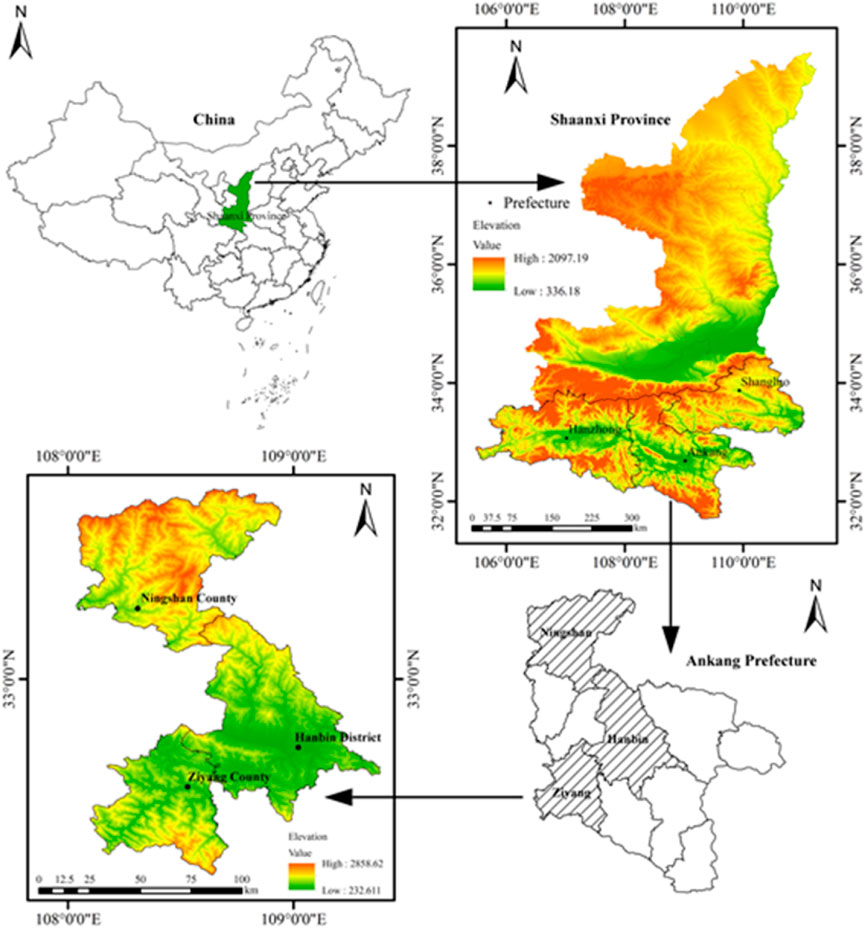
FIGURE 1. Location of the study area (Liu et al., 2020).
2.2 Selection of variables
2.2.1 Livelihood resilience
Livelihood resilience is the ability of rural households to withstand disturbances and recover from adverse outcomes through a combination of livelihood activities. Specific resilience entails coping with a specific disturbance, while general resilience involves coping with different types of disturbances and shocks. Drawing on the spatial vector method proposed by Li et al. (2021a), the livelihood resilience of rural households was measured according to two dimensions: general resilience and specific resilience, based on the livelihood activities of rural households. The specific measurement steps are as follows:
(1) To simplify the livelihood system of rural households by observing livelihood activities, a quantitative model of rural households’ livelihood level, R, can be characterized by the following relational expressions:
Where K is a classification standard for livelihood activities, meaning rural household income; N is the number of all livelihood activities of rural households. A is a classified collection of livelihood activities; S is the number of livelihood activities engaged in by a rural household; AS is a set of livelihood activities for a rural household, which is a subset of set A; Mi is the ith livelihood activity, namely the ith income source for the rural household (1 ≤ i ≤ S), When S = N, the set AS of a rural household engaged in livelihood activities is the full set A. The level of livelihood diversification of rural households can be expressed as (N, S, A). According to the reality of the livelihood activities of rural households in the study area, the livelihood activities of rural households include agricultural and forestry activities, breeding activities, working activities and non-agricultural business activities including agri-tourism and transportation. Then the following formula can be obtained:
A = {Agriculture and forestry activities, breeding activities, working activities, non-agricultural business activities}, S = N.
AS ⊆ A, S ≤ 4, and have
(2) Universal resilience measure, Fa. Using the level of livelihood diversity (N, S, A) as a reference system to describe the stability of income, the ratio of the rural household’s income to the maximum income value in the corresponding set AS is estimated, and when this ratio is small it indicates that the rural household’s income is less stable, and for a rural household with a level of livelihood diversity (N, S, A) and a total income of M, there exists a maximum income MA in set A. The formula for the general elasticity of this rural household is:
(3) Specific resilience measure, Fv. The rural household is engaged in N classifications under the set of AS livelihood activities containing S classifications {M1, M2, … , MS }, the ith livelihood activity income is mi (i = 1, 2, … , S) and the total is M. The probability of having any yuan income belonging to Ai (i = 1, 2, … , S) is Pi, thus Pi = mi/M with ΣPi = 1. Using the Shannon-Wiener calculation, the livelihood diversity index of this rural household was:
For the livelihood diversity index
Greater specific resilience indicates that rural households have multiple sources of income and that income is more evenly distributed, and when external shocks lead to a severe reduction of a certain income, they do not cause large fluctuations in rural household income and consumption levels, and the rural household livelihood system is able to operate stably. Referring to the common practice of system prediction and decision making, universal and specific resilience were defined as vectors (Figure 2), the angle of the vectors was calculated by cosine similarity, and the livelihood resilience of the rural households was estimated based on the cosine theorem. Measure the magnitude of α value using Eqs. (1) and (3) is:
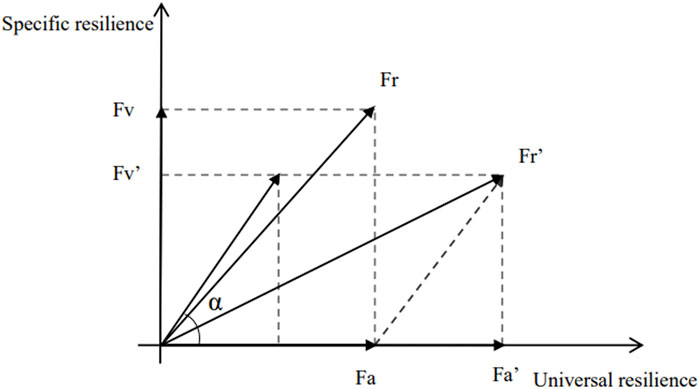
FIGURE 2. Measurement of livelihood resilience.
Cos α is determined with the help of Pearson’s correlation coefficient, which eliminates the effect of magnitude and allows for a more accurate measurement of the relationship between the variables and is calculated as follows:
According to the law of cosine, the rural household’s livelihood resilience is calculated.
2.2.2 Livelihood vulnerability
Following the “exposure-sensitivity-adaptability” analysis framework of the IPCC, we constructed a livelihood vulnerability evaluation index system of rural households (Table 1). Since the individual indicators are expressed in different units, we used deviation normalization to avoid problems. By means of standardized data processing, the resulting values are within (0–1). The following can be used as a suitable equation:
where xij represents the initial value of the households’ indicator; xjmin is the minimum of each indicator; and xjmax is maximum of each indicator.
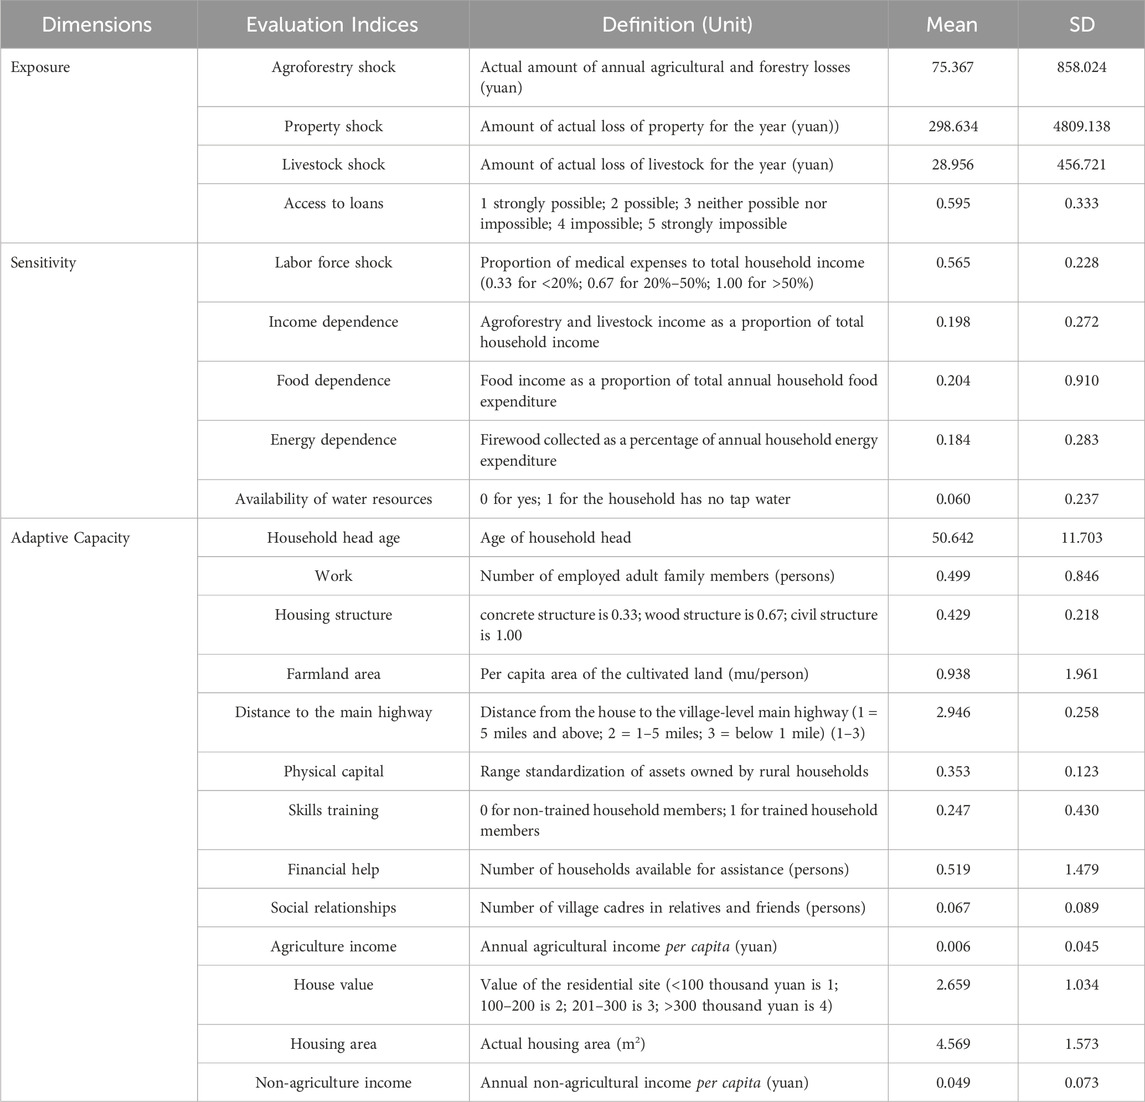
TABLE 1. Data for the index of livelihood vulnerability.
Then, we extracted the main factors determining livelihood vulnerability through principal component analysis (PCA). A total of 22 variables were subjected to principal component analysis, from which 8 principal components were identified. Using the results of principal component analysis, a formula for calculating the livelihood vulnerability index of rural households can be constructed by using the variance contribution of each principal component as the weight by which to multiply the score value of the principal component.
where LVI represents the score of the rural household’s livelihood vulnerability; Fi is the score of the ith principal component; Wi is the weight of the ith principal component, namely, the contribution of this principal component to the overall variance; the matrix of principal component score coefficients and the original normalized values of each indicator can be calculated for i = 1, 2, … , 8. The specific formula for livelihood vulnerability constructed here from our data is:
2.2.3 Control variables
Since human capital, natural capital, social capital, and financial capital are important factors of production that sustain the livelihood activities of rural households, they were included in the regression model. Human capital is measured by the proportion of the non-working population to total household size, labeled “non-labor ratio” (Liu et al., 2021; Xu et al., 2019), which reflects the ability of the rural household to support the non-working population. The variable “loan” is used to measure financial capital (Javed and Bill, 2022), and indicates the likelihood of obtaining loans, which determines the buffering capacity of the rural household to cope with external shocks and disturbances. Social capital is the social network (Wei et al., 2021), reciprocal norms and trust that rural households form in the process of interacting with other social agents, and is represented by “phone charge”. Natural capital refers to the natural resources owned by the rural household (Quandt and Neufeldt, 2019) that are used to produce products or provide other resource flows and services to the rural household, and is measured by “land area”. Table 2 shows the corresponding variable settings and descriptive statistics.
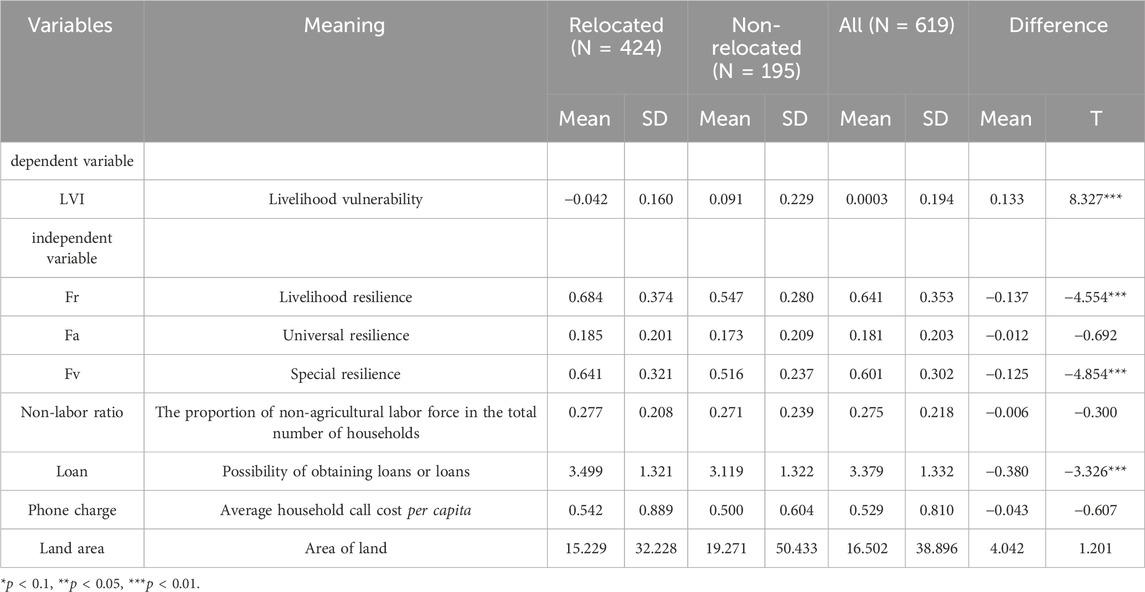
TABLE 2. Variables and descriptive statistics.
2.3 Model construction
Empirical experience and related studies suggest that the relationship between livelihood resilience and livelihood vulnerability of rural households may be nonlinear (Usamah et al., 2014), and therefore the analysis was conducted using a threshold regression model. The phenomenon when one economic parameter reaches a specific value and causes a sudden shift in another economic parameter to another form of development (structural mutation) is called the “threshold effect”, and the threshold value as the cause of the phenomenon is also called the “threshold value”. The model is constructed as follows:
where
where
3 Results
3.1 Descriptive statistics of livelihood resilience
3.1.1 Differences in livelihood resilience across rural households
Using relocation status as a classification criterion, Table 2 shows the differences in livelihood vulnerability of different farmers. We see that the livelihood vulnerability of relocated households (−0.042) was significantly lower than local (0.091), while the livelihood resilience of relocated households was slightly higher than that of local households. This suggests that as a positive intervention to deal with the cycle of poverty, migration policies to reduce disasters have led to increased levels of livelihood resilience and have significantly reduced the vulnerability of relocated households. Thus, for relocated households whose production and living environment have been greatly transformed, the ability to withstand risks is enhanced after they go through the complicated economic recovery and reconstruction processes in the relocated areas.
3.1.2 Number of different livelihood activities and livelihood resilience
Rural households’ livelihood strategies are dynamic in nature and change with the interaction between their own livelihood capital and external environmental conditions, showing gradual development from mainly agricultural to diversified livelihood strategies including labor and non-farm business. Table 3 exhibits the association between livelihood resilience and the number of livelihood activities and shows that as the number of rural households’ livelihood activities increased, general resilience showed an increasing trend, and both specific resilience and livelihood resilience showed a decreasing trend.
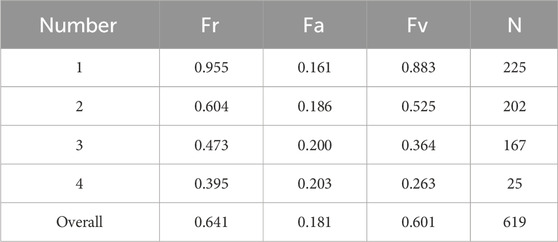
TABLE 3. Relationship between Livelihood Resilience and the number of Livelihood Activities.
3.1.3 Fitted graph of livelihood resilience and livelihood vulnerability
To show the relationship between livelihood resilience and livelihood vulnerability of rural households, we use first-order fitting graph analysis, second-order fitting graph analysis and kernel density regression fitting graph analysis. The results of these graphical analyses are shown in Figure 3.
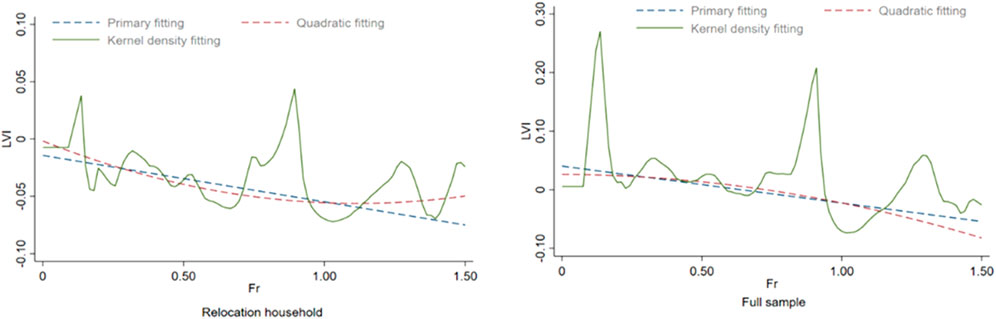
FIGURE 3. Graphical fitting of livelihood resilience and vulnerability.
Livelihood resilience shows an overall downward effect on the livelihood vulnerability of all samples. The kernel density regression fitting results show that the marginal effect of livelihood resilience on livelihood vulnerability fluctuates to some extent after a critical value is reached, and the magnitudes of the critical value and marginal effect need to be further estimated by regression models.
3.2 Threshold effect test for livelihood resilience
We test whether the livelihood resilience of relocated households, local households and all rural households have threshold effects on livelihood vulnerability. The results of the test for all rural households are shown in Figure 4.
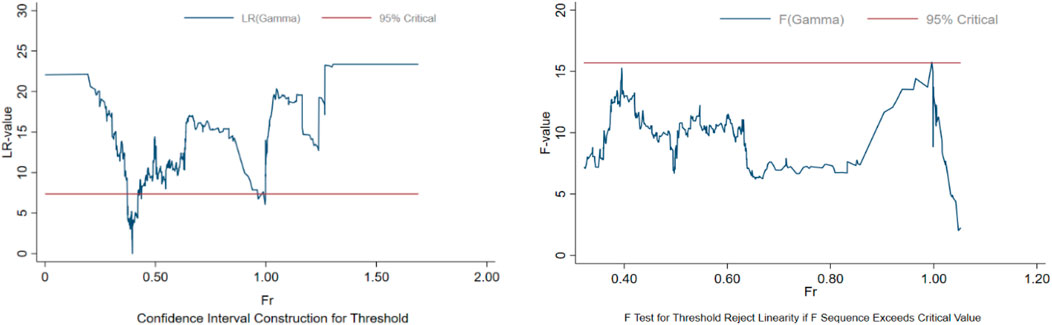
FIGURE 4. Threshold effect test and confidence interval estimation of resilience of households.
When both the threshold variable and the explanatory variable are livelihood resilience, the LM estimate is 15.74 and the p-value is 0.0098, rejecting the original hypothesis that there is no threshold effect. That is, there is a threshold effect of all rural households’ livelihood resilience on livelihood vulnerability, and the preliminary estimate of the threshold value is 0.3818 with estimated 95% confidence interval is [0.3225, 1.0583]. Due to space limitation, the threshold test details of relocated and non-relocated households is not listed.
The threshold effect test and confidence interval of different sample rural households are obtained by taking the livelihood resilience of rural households as the threshold variable and livelihood resilience, general resilience and specific resilience as independent variables. The results are shown in Table 4. The livelihood resilience of relocated households, local households and all households have a threshold effect on livelihood vulnerability. For the same explanatory variables, the thresholds for livelihood resilience were higher for relocated households than for local households, and the thresholds for general resilience and specific resilience were lower than for local households.
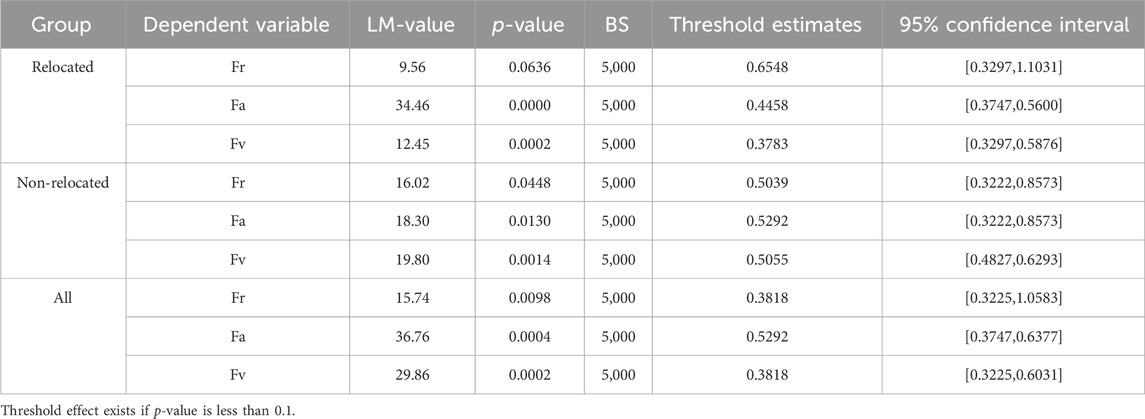
TABLE 4. Threshold effects and confidence interval.
3.3 Impact of livelihood resilience on livelihood vulnerability
3.3.1 Results
Table 5 describes the results of livelihood resilience on rural households’ livelihood vulnerability for different samples. Livelihood resilience, general resilience and specific resilience are included in the regression model as explanatory variables. Model 1-Model 3, Model 4-Model 6 and Model 7-Model 9 refer to the regression results of relocated households, local households and all rural households, respectively.
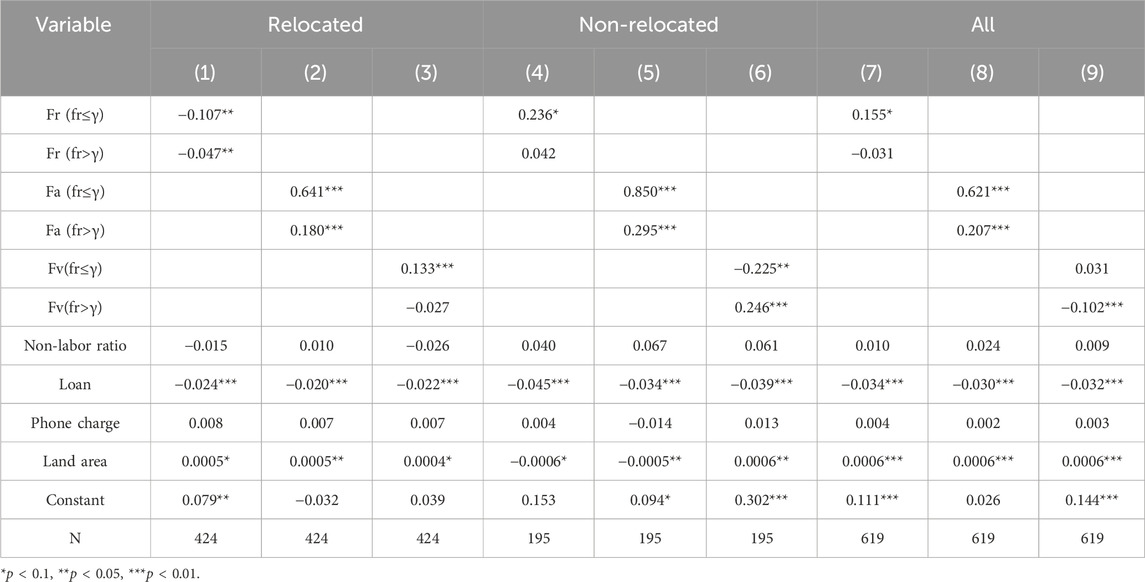
TABLE 5. Impact of livelihood resilience on livelihood vulnerability.
Model 1. shows a negative effect on livelihood vulnerability until the livelihood resilience of relocated households reaches the threshold and remains significant at the 5% level of significance after crossing the threshold of 0.6548. Model 2 shows that when livelihood resilience crosses the threshold value of 0.4458, the marginal effect of universal resilience on livelihood vulnerability changes from 0.641 to 0.180. Model 3 shows that specific resilience has a significant positive contribution on livelihood vulnerability before livelihood resilience reaches a threshold of 0.3783. When livelihood resilience crosses the threshold of 0.3783, specific resilience has a negative but not notable impact of relocated households.
Model 4. shows a positive effect on livelihood vulnerability until local household livelihood resilience reaches a threshold value of 0.5039, and a non-significant effect on livelihood vulnerability after crossing this threshold. Model 5 shows that the marginal effect of universal resilience on livelihood vulnerability changes from 0.850 to 0.295 when livelihood resilience crosses the threshold of 0.5292. Model 6 shows that specific resilience has a negative contribution before crossing the threshold of 0.5055, but after crossing the threshold, it has a significant positive impact. Model 7 shows a positive effect on livelihood vulnerability until livelihood resilience of all rural households reaches the threshold, and a negative effect after crossing the threshold of 0.3818, but the effect is no-significant. Model 8 shows that universal resilience has a positive effect on livelihood vulnerability. Model 9 shows that after livelihood resilience reaches the threshold of 0.3818, specific resilience has a significant negative impact, although previously it had an insignificant effect.
3.3.2 Robustness tests
The results of robustness tests for the relocated households are shown in Table 6.

TABLE 6. Results of robustness tests of relocated households.
Robustness tests usually examine whether the evaluation methods and variables are relatively stable and consistent in their interpretation when certain parameters of the model are changed. The above threshold regression for rural households’ livelihood resilience and livelihood vulnerability may have endogenous problems due to the cross-sectional data used. It is therefore necessary to check whether the regression results are robust by controlling some variables. Large-scale relocation in Shaanxi Province began in 2011. Besides disaster reduction relocation, there is also a small amount of synchronous relocation, and the resettlement methods fall mainly into two types: centralized relocation and decentralized relocation, which may affect the estimated results. The regression models that introduce the type of relocation and resettlement method as control variables for relocated households are model 10-model 12 and model 13-model 15, respectively. Overall, the test results for the main indicators when controlling for different variables are similar to the regression results of models 1-3, the threshold values of livelihood resilience are the same, the marginal effect of each indicator fluctuates slightly but the action trend is consistent, which indicates that the regression results are robust.
4 Discussion
Disaster resettlement provides an opportunity to explore environmental and climate-related issues in a rapidly changing global context (Xu et al., 2022). It has many objectives including reducing livelihood vulnerability and improving and enhancing livelihood resilience and adaptation. We have explored household livelihood resilience in the case of disaster resettlement. The results show that livelihood resilience, general resilience and specific resilience of relocated households are slightly higher than those of local (non-relocated) households. This indicates that the relevant coping not only improves rural households’ living environment and increases their income, but also enhances their adaptive capacity (Justin and Brooke, 2020; Patrick et al., 2022). With an increase in the number of livelihood activities, the livelihood resilience and specific resilience show a decreasing trend and general resilience shows an increasing trend. A quantitative estimation of the vulnerability in the livelihood system of rural households suggests that although the livelihood vulnerability of relocated households is significantly lower than that of local households, there remains a certain degree of vulnerability risk.
In terms of the relationship of livelihood resilience on livelihood vulnerability, there is a significant threshold effect: for relocation households, livelihood resilience has a significant negative impact on livelihood vulnerability, which decreases as livelihood resilience increases. Some studies have shown that participation in relocation increases the wellbeing of rural households and significantly reduces their vulnerability. In addition, the marginal effect of general resilience is to decrease livelihood vulnerability. This is consistent with previous studies (Li et al., 2021b; Zhang et al., 2022b). In general, low income from agriculture forces farmers to increase indebtedness and therefore destroys the farmers’ livelihood resilience (Reddy et al., 2020). However, as relocated rural households are subject to various policy subsidies as well as welfare preferences (Morris et al., 2009; Li and Zander, 2020), their overall income level increases significantly. This has solved the double dilemma of eco-environmental protection and social and economic development to a certain extent. Although the disaster resettlement policy has increased the overall income level of rural households in the research area by 1,815.52 yuan, which significantly reduced their vulnerability at the income level (Liu et al., 2023), the welfare effect brought by the policy will gradually decrease with the continuous development of relocation (Sina et al., 2019). It is not advisable to rely solely on government subsidies to reduce the vulnerability of farmers. For the same explanatory variables, the threshold value of livelihood resilience of relocated households is slightly higher than local households, and the threshold value of general resilience and specific resilience is slightly lower than that for local households. According to Folke (Folke, 2006), the threshold value of livelihood resilience reflects the maximum disturbance that a livelihood system in a stable state can withstand while maintaining basic structure and function. The slightly higher threshold value further indicates that with the gradual implementation of the relocation project, the efficiency of targeting and the effectiveness of identification of the project as well as the effectiveness of the policy have been improved. Relocation improves the ability of rural households to cope with external changes and risks.
Disaster resettlement is a long-term process for rural households to restore and rebuild livelihoods; therefore, it will take some time for the relocation to enter the final stage of development and integration (Guo and naim, 2018). The specific livelihood resilience in Model 3 and Model 6 is linked to the livelihood diversity of rural households, and livelihood diversification before reaching a critical value instead increases the possibility that rural households will fall into a vulnerability trap, which indicates that diversified livelihoods have certain limitations (Peng et al., 2022). Combined with the results in Table 3, in the early stage of relocation, single livelihood activities of rural households are transformed into diversified livelihoods, which leads to a chance of livelihood transformation (Chidozie and Chang-Richards, 2022). The diversified orientation of livelihood activities ignores the reproduction dilemma of rural households and takes capital for industrial development from the scarce resources, which entails livelihood risks. In addition, our interviews show that many rural households try to generate income by growing tea and raising livestock. However, such production activities not only occupy limited human resources and family funds, but also have certain requirements on planting and breeding technology, so the income is not satisfactory. After introducing the relocation type and relocation reason as control variables into the regression model of relocated households, we find that when different variables are controlled, indicators, threshold values, and significances are consistent with those before, indicating that the regression result is robust.
This article has clear limitations. First, using cross-sectional data only offers a “snapshot” of livelihood features. Moreover, this survey only covered Ankang City in southern Shaanxi, while the Shaanxi Disaster Prevention and Resettlement Project also covered parts of northern Shaanxi and Guanzhong. Thus, the general significance of the research results is limited. Persistent changes in the livelihood resilience and vulnerability of relocated were difficult to observe. At the same time, although several developed frameworks and indicators have been adopted to assess vulnerability, indicators may still not all-inclusive. Also, the differences between households surveyed in different regions may affect their participation and create bias in assessing the variables of interest. The threshold regression analysis method used in this paper is limited by the survey data and relevant indicators. Therefore, there is potential for further improvement of the methodology used in this study. Third, although the survey was conducted in rural areas of China, the results of the survey are not representative of the situation in all rural areas. This is because rural areas vary greatly, with different levels of development and characteristics in different regions. Therefore, these differences and specific contexts need to be taken into account when applying the results of the survey to less developed areas.
5 Conclusion
This paper analyzes the impact of livelihood resilience on livelihood vulnerability of rural households in Ankang, Southern Shaanxi, China. There was a significant threshold effect of livelihood resilience on the livelihood vulnerability of rural households. Compared with local households, the livelihood vulnerability of relocated (−0.042) was significantly lower than local households (0.091), an increase in livelihood resilience significantly reduced the livelihood vulnerability of rural households, and the effect of general resilience on livelihood vulnerability showed a decreasing marginal effect. Before the specific resilience exceeds the threshold, it has a positive effect on livelihood vulnerability, but this effect disappears when the resilience exceeds the threshold. This indicates that relocation can significantly reduce the livelihood vulnerability of households in disaster-prone areas.
Resilience and vulnerability are both currently hot topics in the global development, and this study offers specific information concerning the linkages between resilience and vulnerability in resettlement settings. Based on the findings of the study, we suggest that attention should be paid to the role of resilience in the livelihood status of rural households, while the link between livelihood resilience and vulnerability should be utilized to formulate follow-up support policies. Consequently, the rural households in China could have improved livelihood resilience through a number of measures to reduce their vulnerability including strengthening the skills training policies, helping rural households engage in non-farm employment, promoting industrial integration in rural resettlement areas and enhancing their practical learning capacity to promote sustainable livelihoods.
Data availability statement
The raw data supporting the conclusion of this article will be made available by the authors, without undue reservation.
Ethics statement
Written informed consent from the participants was not required to participate in this study in accordance with the national legislation and the institutional requirements.
Author contributions
WL: Data curation, Writing–original draft, Writing–review and editing. JaL: Formal Analysis, Writing–original draft, Writing–review and editing. JX: Data curation, Writing–review and editing. JeL: Data curation, Writing–review and editing. MF: Supervision, Writing–review and editing.
Funding
This research was funded by the National Natural Science Foundation of China (Grant No. 71803149), the Ministry of Education Humanities and Social Science Research Youth Fund Project (Grant No. 22YJCZH110 and No. 22XJC630007), the China Postdoctoral Science Foundation (Grant No. 2022M721904), the Special Scientific Research Project of Shaanxi Education Department (Grant No. 21JK0154), the Natural Science Foundation of Shaanxi Province (Grant No. 2023JCYB607), the Social Science Foundation of Shaanxi Province (Grant No. 2023R290), the Scientific Research Program Funded by The research institute of new urbanization and human settlement in Shaanxi Province of XAUAT (Grant No. 2023SCZH14), and the Morrison Institute for Population and Resource Studies at Stanford University.
Acknowledgments
The authors appreciate the support of the local government and the patient cooperation of the interviewees during the data collection.
Conflict of interest
The authors declare that the research was conducted in the absence of any commercial or financial relationships that could be construed as a potential conflict of interest.
Publisher’s note
All claims expressed in this article are solely those of the authors and do not necessarily represent those of their affiliated organizations, or those of the publisher, the editors and the reviewers. Any product that may be evaluated in this article, or claim that may be made by its manufacturer, is not guaranteed or endorsed by the publisher.
References
Antonio, L., María, O. A., Feliu, L., and Varela, E. (2022). Implementing the livelihood resilience framework: an indicator-based model for assessing mountain pastoral farming systems. Agric. Syst. 199, 103405. doi:10.1016/j.agsy.2022.103405
Asante, F., Guodaar, L., and Arimiyaw, S. (2021). Climate change and variability awareness and livelihood adaptive strategies among smallholder farmers in semiarid northern Ghana. Environ. Dev. 39, 100629. doi:10.1016/j.envdev.2021.100629
Bahadur, K. M. (2021). Differential vulnerability and resilience of earthquake: a case of displaced Tamangs of Tiru and Gogane villages of Central Nepal. Prog. Disaster Sci. 12, 100205. doi:10.1016/j.pdisas.2021.100205
Bhattacharjee, K., and Behera, B. (2018). Determinants of household vulnerability and adaptation to floods: empirical evidence from the Indian State of West Bengal. Int. J. Disaster Risk Reduct. 31, 758–769. doi:10.1016/j.ijdrr.2018.07.017
Brown, K. (2014). Global environmental change I: a social turn for resilience? Prog. Hum. Geog. 38 (1), 107–117. doi:10.1177/0309132513498837
Chen, T., and Tsai, C. (2021). Coping with extreme disaster risk through preventive planning for resettlement. Int. J. Disaster Risk Reduct. 64, 102531. doi:10.1016/j.ijdrr.2021.102531
Chidozie, K. G., and Chang-Richards, A. (2022). A tool to assess livelihood preparedness for disasters: a study of Kaikōura earthquake in New Zealand. Nat. Hazards 113 (1), 745–766. doi:10.1007/s11069-022-05322-x
Daniel, D., Sutherland, M., Speranza, C. I., et al. (2019). The role of tenure documents for livelihood resilience in Trinidad and Tobago. Land Use Pol. 87, 104008. doi:10.1016/j.landusepol.2019.05.027
Dantje, S., Yan, C. A., Suzanne, W., and Potangaroa, R. (2019). A conceptual framework for measuring livelihood resilience: relocation experience from Aceh, Indonesia. World Dev. 117, 253–265. doi:10.1016/j.worlddev.2019.01.003
Duc, T. D., Edward, P., Ngoc, T. H. T., Thien, N. D., Tu, V. H., Anh Ngoc, P. T., et al. (2022). Climate change impacts on rice-based livelihood vulnerability in the lower Vietnamese mekong delta: empirical evidence from can tho city and tra vinh province. Environ. Technol. Inno. 28, 102834. doi:10.1016/j.eti.2022.102834
Eadie, P., Atienza, M. E., Tan-Mullins, M., et al. (2020). Livelihood and vulnerability in the wake of Typhoon Yolanda: lessons of community and resilience. Nat. Hazards 103, 211–230. doi:10.1007/s11069-020-03984-z
Folke, C. (2006). Resilience: the emergence of a perspective for social–ecological systems analyses. Glob. Environ. Change 16 (3), 253–267. doi:10.1016/j.gloenvcha.2006.04.002
Gallopín, G. C. (2006). Linkages between vulnerability, resilience, and adaptive capacity. Glob. Environ. Change 16 (3), 293–303. doi:10.1016/j.gloenvcha.2006.02.004
Guo, X., and Naim, K. (2018). Examining the impacts of disaster resettlement from a livelihood perspective: a case study of Qinling Mountains, China. Disasters 42 (2), 251–274. doi:10.1111/disa.12242
Holling, C. S. (1973). Resilience and stability of ecological systems. Annu. Rev. Ecol. Syst. 4 (4), 1–23. doi:10.1146/annurev.es.04.110173.000245
Huang, X., Huang, X., He, Y., and Yang, X. (2017). Assessment of livelihood vulnerability of land-lost farmers in urban fringes: a case study of Xi'an. China. Habitat Int. 59, 1–9. doi:10.1016/j.habitatint.2016.11.001
Javed, A. M., and Bill, P. (2022). Financial capital as a shaper of households' adaptive capabilities to flood risk in northern Bangladesh. Ecol. Econ. 195, 107381. doi:10.1016/j.ecolecon.2022.107381
Justin, S., and Brooke, W. (2020). Just adaptation? Generating new vulnerabilities and shaping adaptive capacities through the politics of climate-related resettlement in a Philippine coastal city. Glob. Environ. 65, 102188. Change 65102188-102188. doi:10.1016/j.gloenvcha.2020.102188
Kita, S. M. (2017). Urban vulnerability, disaster risk reduction and resettlement in Mzuzu city, Malawi. Int. J. Disaster Risk Reduct. 22, 158–166. doi:10.1016/j.ijdrr.2017.03.010
Kumar, S., Mishra, A. K., Pramanik, S., Mamidanna, S., and Whitbread, A. (2020). Climate risk, vulnerability and resilience: supporting livelihood of smallholders in semiarid India. Land Use Pol. 97, 104729. doi:10.1016/j.landusepol.2020.104729
Li, C., Gao, M., Li, S., et al. (2021a). Impact of rural households' livelihood resilience on multidimensional poverty: evidence from the poverty alleviation relocation areas in Shaanxi Province. China Population-Resources Environ. 31 (7), 150–160. (in Chinese). doi:10.13448/j.cnki.jalre.2021.263
Li, C., Guo, M., Li, S., and Feldman, M. (2021b). The impact of the anti-poverty relocation and settlement program on rural households’ well-being and ecosystem dependence: evidence from western China. Soc. Natur. Resour. 34 (1), 40–59. doi:10.1080/08941920.2020.1728455
Li, Q., and Zander, P. (2020). Resilience building of rural livelihoods in PES programmes: a case study in China’s Loess Hills. Ambio 49 (4), 962–985. doi:10.1007/s13280-019-01236-4
Liu, M., Feng, X., Zhao, Y., and Qiu, H. (2023). Impact of poverty alleviation through relocation: from the perspectives of income and multidimensional poverty. J. Rural. Stud. 99, 35–44. doi:10.1016/j.jrurstud.2023.02.009
Liu, W., Cheng, Y., Li, J., and Feldman, M. (2022). Livelihood adaptive capacities and adaptation strategies of relocated households in rural China. Front. Sustain. Food Syst. 6. doi:10.3389/fsufs.2022.1067649
Liu, W., Elisabeth, G., Jung, S., and Agrawal, A. (2021). The role of human and social capital in earthquake recovery in Nepal. Nat. Sustain. 5 (2), 167–173. doi:10.1038/s41893-021-00805-4
Liu, W., Li, J., Ren, L., and Xu, J. (2020). Exploring livelihood resilience and its impact on livelihood strategy in rural China. Soc. Indic. Res. 150 (3), 977–998. doi:10.1007/s11205-020-02347-2
Liu, W., Li, J., Xu, J., et al. (2020). Effects of disaster-related resettlement on the livelihood resilience of rural households in China. Int. J. Disaster Risk Reduct. 49, 101649. doi:10.1016/j.ijdrr.2020.101649
Lo, K., and Wang, M. (2018). How voluntary is poverty alleviation resettlement in China? Habitat Int. 73, 34–42. doi:10.1016/j.habitatint.2018.01.002
Maksims, F., and Francesco, R. (2021). Dynamic assessment of urban resilience to natural hazards. Int. J. Disaster Risk Reduct. 62, 102328. doi:10.1016/j.ijdrr.2021.102328
Mavhura, E. (2020). Dam-induced displacement and resettlement: reflections from Tokwe-Mukorsi flood disaster, Zimbabwe. Int. J. Disaster Risk Reduct. 44, 101407. doi:10.1016/j.ijdrr.2019.101407
Morris, M. D., Popper, S. T., Rodwell, T. C., Brodine, S. K., and Brouwer, K. C. (2009). Healthcare barriers of refugees post-resettlement. J. community health 34, 529–538. doi:10.1007/s10900-009-9175-3
Nath, S., Frank, L., Peter, D., et al. (2020). Capital, rules or conflict? Factors affecting livelihood-strategies, infrastructure-resilience, and livelihood-vulnerability in the polders of Bangladesh. Sustain. Sci. 15, 1–15. doi:10.1007/s11625-020-00818-6
Pankaj, S., and Swades, P. (2022). Wetland transformation and its impact on the livelihood of the fishing community in a flood plain river basin of India. Sci. Total Environ. 858 (1), 159547. doi:10.1016/J.SCITOTENV.2022.159547
Patrick, A., Odei, E. M., and Matthew, A. (2022). Displacements and livelihood resilience in Ghana's mining sector: the moderating role of coping behavior. Resour. Policy 78. doi:10.1016/j.resourpol.2022.102820
Peng, L., Xu, D., and Wang, X. (2018). Vulnerability of rural household livelihood to climate variability and adaptive strategies in landslide-threatened western mountainous regions of the three gorges reservoir area, china. Clim. Dev., 1–16. doi:10.1080/17565529.2018.1445613
Peng, W., Brian, R., Zheng, H., et al. (2022). The limits of livelihood diversification and sustainable household well-being, evidence from China. Environ. Dev. 42 (2). doi:10.1016/J.ENVDEV.2022.100736
Polsky, C., Neff, R., Yarnal, B., et al. (2007). Building comparable global change vulnerability assessments: the vulnerability scoping diagram. Glob. Environ. Change 17 (34), 472–485. doi:10.1016/j.gloenvcha.2007.01.005
Quandt, A. (2018). Measuring livelihood resilience: the household livelihood resilience approach (HLRA). World Dev. 107, 253–263. doi:10.1016/j.worlddev.2018.02.024
Quandt, A., Neufeldt, H., and McCabe, J. T. (2019). Terrence McCabe. Building livelihood resilience: what role does agroforestry play? Clim. Dev. 11 (6), 485–500. doi:10.1080/17565529.2018.1447903
Rabiul, I., and Greg, W. (2022). Livelihood assets, mutual support and disaster resilience in coastal Bangladesh. Int. J. Disaster Risk Reduct. 78, 103148. doi:10.1016/j.ijdrr.2022.103148
Reddy, A. A. (2018). Involuntary resettlement as an opportunity for development: the case of urban resettlers of the New Tehri Town. J. Land Rural Stud. 6 (2), 145–169. doi:10.1177/2321024918766590
Reddy, A. A., Bhattacharya, A., Reddy, S. V., and Ricart, S. (2021). Farmers’ distress index: an approach for an action plan to reduce vulnerability in the drylands of India. Land 10 (11), 1236. doi:10.3390/land10111236
Reddy, A. A., Raju, S. S., and Bose, A. (2020). Farmers' income, indebtedness and agrarian distress in India. Microfinance Rev. 12 (1), 20–38.
Reed, M. S., Podesta, G., Fazey, I., Geeson, N., Hessel, R., Hubacek, K., et al. (2013). Combining analytical frameworks to assess livelihood vulnerability to climate change and analyse adaptation options. Ecol. Econ. 94, 66–77. doi:10.1016/j.ecolecon.2013.07.007
Salim, M. U., Emdad, C. H., Nuruzzaman, M. K., Doberstein, B., and Cox, R. S. (2021). “Disasters threaten livelihoods, and people cope, adapt and make transformational changes”: community resilience and livelihoods reconstruction in coastal communities of Bangladesh. Int. J. Disaster Risk Reduct. 63, 102444. doi:10.1016/j.ijdrr.2021.102444
Sina, D., Alice, Y. C., Wilkinson, S., et al. (2019). What does the future hold for relocated communities post-disaster? Factors affecting livelihood resilience. Int. J. Disaster Risk Reduct., 34173–34183. doi:10.1016/j.ijdrr.2018.11.015
Speranza, C. I., Wiesmann, U., Rist, S., et al. (2014). An indicator framework for assessing livelihood resilience in the context of social-ecological dynamics. Glob. Environ. Change 28, 109–119. doi:10.1016/j.gloenvcha.2014.06.005
Sun, Y., Wang, Y., Huang, C., Tan, R., and Cai, J. (2023). Measuring farmers’ sustainable livelihood resilience in the context of poverty alleviation: a case study from Fugong County. China. Hum. Soc. Sci. Commun. 10 (1), 75. doi:10.1057/s41599-023-01575-4
Sunil, K., Ranjan, J. P., Bahadur, R. D., et al. (2023). Can rural livelihood programs enhance capabilities and reduce vulnerability to poverty? Evidence from a tribal region of eastern India. Econ. Anal. Policy 77, 85–98. doi:10.1016/j.eap.2022.10.018
Tina, B., Wil, d J., Verina, I., Arts, B., and Pacheco, P. (2022). Thriving in turbulent times: livelihood resilience and vulnerability assessment of Bolivian Indigenous forest households. Land Use Pol. 119, 106146. doi:10.1016/j.landusepol.2022.106146
Usamah, M., Handmer, J., Mitchell, D., and Ahmed, I. (2014). Can the vulnerable be resilient? Co-existence of vulnerability and disaster resilience: informal settlements in the Philippines. Int. J. Disaster Risk Reduct. 10, 178–189. doi:10.1016/j.ijdrr.2014.08.007
Walsh-Dilley, M., Wolford, W., McCarthy, J., et al. (2016). Rights for resilience: food sovereignty, power, and resilience in development practice. Ecol. Soc. 21 (1), 11. doi:10.5751/es-07981-210111
Weerasena, N., Amaratunga, D., Hettige, S., Haigh, R., and Sridarran, P. (2018). Provision of social infrastructure for resettled victims of the 2004 tsunami: evidence from the grass roots. Procedia Eng. 212, 379–386. doi:10.1016/j.proeng.2018.01.049
Wei, J., Han, Z., Han, Y., and Gong, Z. (2021). What do you mean by community resilience? More assets or better prepared? Disaster Med. 16, 706–713. doi:10.1017/dmp.2020.466
Xu, D., Deng, X., Guo, S., and Liu, S. (2019). Sensitivity of livelihood strategy to livelihood capital: an empirical investigation using nationally representative survey data from rural china. Soc. Nat. Resour. 144. doi:10.1007/s11205-018-2037-6
Xu, J., Liu, W., Li, J., and Feldman, M. (2022). Disaster resettlement and adaptive capacity among rural households in China. Soc. Nat. Resour. 35 (3), 245–259. doi:10.1080/08941920.2022.2048329
Zhang, Q., Xue, H., Lan, X., Luwei, D., Bojie, W., Fengqi, C., et al. (2022a). Livelihood vulnerability of pastoral households in the semiarid grasslands of northern China: measurement and determinants. Ecol. Indic. 140, 109020. doi:10.1016/j.ecolind.2022.109020
Zhang, Q., Zhao, X., Tang, H., et al. (2018). Vulnerability of communities to climate change: application of the livelihood vulnerability index to an environmentally sensitive region of China. Clim. Dev. 11 (6), 525–542. doi:10.1080/17565529.2018.1442808
Keywords: disaster resettlement, livelihood resilience, livelihood vulnerability, rural households, China
Citation: Liu W, Liu J, Xu J, Li J and Feldman M (2024) Examining the links between household livelihood resilience and vulnerability: disaster resettlement experience from rural China. Front. Environ. Sci. 11:1340113. doi: 10.3389/fenvs.2023.1340113
Received: 17 November 2023; Accepted: 31 December 2023;
Published: 07 March 2024.
Edited by:
Dingde Xu, Sichuan Agricultural University, ChinaReviewed by:
Peng Jiquan, Jiangxi University of Finance and Economics, ChinaA. Amarender Reddy, National Institute of Biotic Stress Management, India
Copyright © 2024 Liu, Liu, Xu, Li and Feldman. This is an open-access article distributed under the terms of the Creative Commons Attribution License (CC BY). The use, distribution or reproduction in other forums is permitted, provided the original author(s) and the copyright owner(s) are credited and that the original publication in this journal is cited, in accordance with accepted academic practice. No use, distribution or reproduction is permitted which does not comply with these terms.
*Correspondence: Wei Liu, bHdlaUB4YXVhdC5lZHUuY24=