 Zhou Fang1†
 Yuxin Liao
 Chang Ma
 Rong Wu
- 1Guangzhou Transport Planning Research Institute Co., Ltd., Guangzhou, China
- 2School of Architecture and Urban Planning, Guangdong University of Technology, Guangzhou, Guangdong, China
Introduction: Urbanization has affected the quality of the living environments. It is important to improve residents’ living environments and promote their happiness.
Methods: We use a national and representative dataset targeting the labor force in China, collecting basic information about the work environments, the social environments, and the urban environments. This work employed a linear regression model to investigate the influencing factors of residents’ SWB.
Results: The three major findings are as follows: 1) At the national level, residents’ SWB exhibits a notable spatial variability, being higher in the northern regions and lower in the southern areas. 2) The dimensions of the urban environments (housing prices, POI density, NPP, land development intensity and the number of tertiary hospitals), the work environments (work pressure and job satisfaction), and the social environments (community trust, social justice and sense of security), along with sociodemographic characteristics, significantly influence SWB. 3) In China, the impacts on SWB exhibit pronounced regional heterogeneity. The relationship between environmental pollution and SWB is characterized by an inverted U-shaped pattern. Intriguingly, while housing prices negatively affect SWB in the eastern and central regions, the enforcement of housing purchase limits has been observed to enhance residents’ SWB in the western region.
Discussion: First, this work show the overall spatial level of SWB in China geographically. And second, this research found the SWB heterogeneity on a regional level (eastern, central, and western regions). Furthermore, this methodological framework provides a novel perspective among the urban, work and social environments on SWB. This work also contributes to inform policy to improve residents’ SWB in China.
1 Introduction
Attaining happiness is a universal goal of human beings, which has seen a surge of research interest (Wilson, 1967). Happier people are more successful in many life domains with more qualities like being social, active, having stronger bodies and better resolve disputes resolution abilities (Lyubomirsky et al., 2005). The Declaration of Independence states that every American has the right to pursue happiness. Over the past decade, “happiness” is a popular term with many meanings, which mainly divide into two scholarly work centers. “Happiness” can refer to instantaneous pleasant moods, or to the overall evaluations of life which conceptualize as subjective wellbeing (SWB) (Haybron, 2003). Understanding the determinants and correlations mechanism of SWB has many benefits for society. Representative empirical researches have shown that SWB should be used as a national indicator to guide public policy decision (Elliott et al., 2014). According to the Diener’s scholar insight, environmental effects influence the SWB and result large differences between nations (Diener and Seligman, 2004). During the past 30 years, average SWB in western countries appears to have been stable throughout time (Veenhoven, 2006). The World Happiness Report in 2022 (UN, 2022) showed that China ranked 72nd out of 146 countries with a respondent happiness index of 5.585 and behind less economically advanced countries such as Thailand and the Philippines. However, since the economic reforms commenced and the opening up policy began in the late 1970s, China has experienced economic growth with sharply increasing quality of residents’ lives and become the world’s secondary largest economy. According to previous research, the SWB in China demonstrated a declining trend or a U-shaped pattern (Brockmann et al., 2009). The phenomenon is like the Easterlin paradox that demonstrated the fact that there was not the expected increase in residents’ SWB with the dramatic increase in the economic conditions of nations (Easterlin, 1974). Notably, China is a large country with a massive problem of insufficient and unbalanced development among regions (Knight and Gunatilaka, 2008). China’s swift urbanization has resulted drastic economic growth and restructuring in spatial environment (Knight, et al., 2009). The space of the three emerging city regions such as the Yangtze Delta, the Pearl River Delta, and the Beijing-Tianjin-Hebei Region is expanding dramatically with integration of urban and rural areas (Wei and Liefner, 2012). The increased social mobility from rural to urban areas, and from small and medium-sized cities to large cities and megacities, has been driven by differences in resource allocation, employment opportunities, and public services (Brockmann et al., 2009). The heterogeneity of populations is determined by the level of attractiveness to labor, economic development, technological upgrading and natural environment in different cities (Easterlin et al., 2017). As far as the spiritual dimension is concerned, the desire for a better life and the need for a high quality of life among urban residents are increasing. The study of the interaction mechanism between the physical environment and the spiritual dimension of urban residents is of great significance, and needs to be paid more attention from the aspect of Chinese socio-cultural geography.
SWB has been the prominent topic to the fields of psychology, sociology, economics, and geography. In western countries, the early research mainly focused on definition, measurement, descriptive analysis on SWB in psychology. Psychologists are concerned with the link between an individual’s SWB and endogenous factors, like income, gender, education, job, characters and so on (Pavot and Diener, 1993; Diener, 1994). Additionally, there has been interest in SWB from economists recently (Easterlin, 1974; Ng, 1997). The relevant studies have focused on the association between an individual’s SWB and their socioeconomic status (Brockmann et al., 2009). Furthermore, the subjects of economics, sociology, environmental science, and geography mainly focus on the influence of exogenous factors, such as daily activities, life experiences, group affiliation, status differentiation, exclusion and integration, and natural and human environments (Carrus, et al., 2015; Mouratidis, 2018; Zhua and Fan, 2018). As SWB became the emerging crucial subject in the human geography, a large amount of empirical researches have attempted to investigate the effects of some material aspects of the urban environments on SWB, such as green spaces, access to natural outdoor environments, fine particulate matter (PM2.5), GDP per capital, pollution, road density, and so on (Wen and Wang, 2009; Knight, 2011; Gascon et al., 2015; Fleming et al., 2016; Liu et al., 2021).
So far, many studies have investigated the effects of the residential physical environment on SWB in the Chinese transition context (Wen and Wang, 2009; Wang et al., 2016; Liu et al., 2017a). Gao et al. (2016) investigated the perceptions of the built environment and health-related quality of life in various neighborhood types and found that the environmental quality of neighborhoods, such as perceived diversity, safety, and esthetics, significantly related to better physical and mental wellbeing. Tang et al. (2021) examined how the participation in poverty alleviation programs affected rural residents in China. The issue that the dearth of in-depth research on the effect of urban environments on regional scale requires to be paid more attention. Particularly, most previous empirical studies on SWB have focused on urban villages, urban neighborhoods, or some major large or medium-sized cities at individual, household, and community scales in China, but few studies have investigated spatial disparities in macroscale contexts like nation, city cluster, or regional areas. An increasing amount of research has established the significance that material dimension of neighborhood’s residential environments enhancing an individual’s wellbeing (Yen et al., 2009; Cagney and York Cornwell, 2010; Evans, 2003). Pan et al. (2021) focused on the factors affecting the poverty alleviation migrants’ (PAM) SWB and found community environment have a positive effect on SWB. Zhou et al. (2015) explored the SWB of the elderly living independently in rural areas of Wenzhou and revealed that children’s support has a positive influence on the SWB of the rural elderly living independently. Some scholars analyzed some indicator on the work environments dimension, like Nie and Sousa-Poza (2016) discovered that daily activity time, especially sleep, acts as a partly mediating role in the relationship between commute time and employees’ SWB in national level.
Nevertheless, there is a lack of conceptualization that the overall level of SWB spatially distribution from a geographic perspective. Moreover, to date, many studies on residents’ SWB have been conducted at various scales, such as nation (Cai and Wang, 2018), provinces (Tang, et al., 2021), large cities (Liu, et al., 2021), urban agglomerations (Cheng et al., 2023), and communities (Liu, et al., 2018; Pan, et al., 2021; Huang and Fang, 2021). However, only a handful of studies have paid little attention to examine the SWB heterogeneity based on geographic local variation (eastern, central, and western regions) (Knight, 2011). Furthermore, a number of potential pathways have been disregarded. The effects of the urban environments, the social environments and the work environments on residents’ SWB is still not sufficiently understood (Diener, et al., 2018). This work aims to fill these gaps. First, the work explores the overall level of SWB spatially using a national sample to measure SWB from a geographic perspective through global Moran indexes. Second, the work not only considers sociodemographic characteristics at the individual level, but also examines the complex associations among the social environments, the urban environments, and the work environments dimensions. Third, this work explores cross-regional geographical disparities in SWB in the Chinese context with respect to these different dimensions. Respondent group heterogeneities are considered in understanding the mechanism of SWB. This work further contributes to inform policy to improve the SWB of residents in China.
2 Literature review
2.1 Understand and measure SWB
SWB refers to an individual’s overall judgment about their life experience. SWB is a measure of life satisfaction rather than happiness, which was considered as an instantaneous pleasant emotion (Diener, 1984; Kahneman and Deaton, 2010). SWB demonstrates the significance of the attractiveness of economic, sociopolitical, and environmental contexts.
There are numerous ways to measure SWB, and social scientists continue to find new and better ways to quantify this construct (Ryff, 1989; Pavot and Diener, 1993). A common way that SWB has been measured is through self-report rating scales, which are based on personal evaluations and experiences. Although self-report measures show high convergence with one another, it is important to realize the danger of measurement bias. Other innovative measures have been used, including facial measures, text analyses of biographies, physiological measures, and neuroimaging (Diener, 1994). This work applied Diener et al. (1984)’s Satisfaction with Life Scale (SWLS) to measure respondents’ SWB level. The SWLS instrument consists of five items. Respondents are required to report on a 5-point Likert scale ranging from “Very unhappy” (value = 1) to “Very happy” (value = 5). Furthermore, Positive and Negative Affect Schedule (PANAS) contain items from positive affect and negative affect aspect, for instance, proud, inspired, nervous and scared (De Neve et al., 2013).
2.2 Related determinants of SWB
SWB is a complex amalgamation of different component like material, spiritual, physical, mental, and emotional. Based on an extensive literature review, it has been determined that the social, political, work, and urban environments significantly influence residents’ SWB (Sahai and Mahapatra, 2020). Psychologists have established the correlates of SWB, how SWB is created, and its connection to social contexts (Diener, et al., 2018). Extensive studies have focused on factors derived from individual social aspects, such as demographic characteristics. Among all the personal determinants, income has attracted the most research. It is commonly believed that an upsurge in income as a crucial way to meet the need for livelihood and raise SWB (Clark et al., 2008). Previous studies have found that there is a linear relationship between SWB and income before individuals meet basic and psychological needs (Watson et al., 1988). Specifically, once basic material goal are fulfilled, income may exert a diminishing marginal utility to SWB (Kahneman and Deaton, 2010). Hsee et al. (2010) explained how the presentation of information affects one’s happiness. Moreover, Wang et al. (2019) found that social comparisons of income are important for wellbeing and the downward income comparisons tend to have a greater impact on increasing SWB. Age is another consistent predictor of SWB (Wilson, 1967; Wang et al., 2019). Individual differences result in an age–life satisfaction relationship that is often shaped like a U (Diener et al., 2018). People are more satisfied with their lives in their 70s and 80s and in their 20s but felt less satisfied with their lives in their late 40s and early 50s (Blanchfower and Oswald, 2008). There is a long record of studies showing that SWB contributes to health and longevity. People with high SWB are more likely to exercise rather than smoke or drink alcohol to release negative emotions (Lyubomirsky et al., 2005; Diener and Chan, 2011). Furthermore, psychology claims that education changes an individual’s cognitive abilities and provides greater emotional support, which results in higher happiness (Huang, 2013; Hu, 2017). For example, Jin et al. (2020) found a significant positive relationship between education level and SWB. The positive effect was weakening and the influence of education level on urban and rural respondents’ SWB was significantly different.
In addition to differences in individual characteristics (Dittmann and Goebel, 2010; Ludwig et al., 2012), Manski (1993) discussed the ways to model different individuals’ behaviors depending on the exogenous characteristics of their communities. Schyns (2002) and Ballas and Tranmer (2012) analyzed the interactions of individually and geographically aggregated determinants of SWB. Previous empirical studies have revealed that SWB is correlated with community-level differences in wellbeing, such as unemployment levels, crime rates and safety, maintenance, air pollution, population density, access to facilities, access to green space, blue space, and traffic modes (Schyns, 2002; MacKerron and Mourato, 2009; Arifwidodo and Perera, 2011; Ballas and Tranmer, 2012; Gandelman et al., 2012; Li and Kanazawa, 2016; Ala-Mantila et al., 2018). Studies have also focused on neighborhood-level factors in Chinese cities. Physical and social environments attributes such as land use, travel conditions, proximity to urban parks, safety, and neighborhood social capital are correlated with wellbeing in Chinese cities (Liu et al., 2017a; Dong and Qin, 2017; Ma et al., 2018). Dang et al. (2019) investigated the variations of subjective on a district and neighborhood levels by a bi-variate response binomial multilevel model and found residents in commercial housing communities showing higher levels of SWB than those in affordable housing neighborhoods. Zhang and Zhang (2017) pointed out that neighborhood social cohesion and social capital are associated significantly with the wellbeing of older adults. Wang et al. (2016) used self-collected survey data to show that 9% of differences in life satisfaction across Beijing are due to district-level factors. Social capital can attenuate the negative impacts of income inequality on SWB especially for people with disabilities (Huang and Fang, 2021). Social justice is an integral factor of social progress, implying fair access to livelihood, political participation and social resources and residents’ SWB from the dimension of the social environments (Dukhanin, et al., 2018).
Numerous studies have confirmed that people with high SWB not only live longer with better mental and physical health but also form stronger social bonds with others, and increase productivity at work (Sharma and Tolani et al., 2015; Shier and Graham, 2011). As a result, they appear to have better work performance and work-life balance than those who struggle with it (Bryson, et al., 2017). Recent studied have dedicated to unravel on the relationship between work environments and SWB. Shier and Graham (2011) found that SWB is mainly impacted by various factors from work environments dimension, for instance the physical and cultural characteristics of the work environments like systemic interrelationships at work and specific aspects of the job. As important elements of work stress, skill discretion, work social support and so on have been incorporated into the research of work environments (Stansfeld et al., 2013). Stansfeld et al. (2013) found the psychosocial working environment have effects on SWB and policies need to be designed to improve workplaces to increase the positive aspect. Additionally, job engagement, job satisfaction, working hours, citizenship behavior, and optimism are important predictors of employee’ SWB (Knight et al., 2009). Bryson, et al. (2017) investigated the correlation between employees’ SWB and workplace performance and revealed positive association between the job satisfaction, workplace performance and SWB. Kuykendall et al. (2015) assessed employee’s SWB and physiological functioning. Thus, work stress and job satisfaction both are influenced by job conditions and impact the level of SWB. Job satisfaction raises the levels of working productivity so as to improve SWB. In this manuscript, we will particularly focus on two cognitive elements like job satisfaction, work stress to describe their cognition of work environments. The cognitive elements are person’s overall perspective of their current circumstances in life.
2.3 Heterogeneity across groups in SWB
As confirmed in previous SWB literature, the stringent household registration (hukou) system has shaped the Chinese population’s migrations between rural and urban areas since the late 1950s. This has also generated remarkable disparities in SWB between rural and urban respondents (Knight and Gunatilaka, 2010; Han, 2015). The hukou system divided people into two groups: those who lived in rural areas and had agricultural (or rural) hukou, and those who lived in urban areas and had nonagricultural (or urban) hukou, which were inherited from parents at birth. There is a significant rural–urban gap in mean earnings and in the availability of services, for example, those with urban hukou are entitled to a wide range of social assistance, including free healthcare, housing subsidies, pensions, child education, and lifetime employment (Knight and Gunatilaka, 2010).
There are striking differences across socioeconomic and geographic groups. The group’s inherent disparities with regard to aspirations, income expectations, and evaluation for life improvement (Knight, et al., 2009). For migrants from different regions and for different income groups, the negative impacts of income inequality on SWB show clear heterogeneity. Empirical studies devote specific attention to the impact of neighborhood environment on rural-to-urban migrants because their SWB is consistently lower than that of urban residents from birth and may depend in specific ways on the local geographical context (Sun et al., 2016; Wang et al., 2016; Ala-Mantila et al., 2018). Moreover, a growing body of literature is dedicated to the SWB of migrants from rural areas and small towns to Chinese cities (Schwanen and Wang, 2014; Davis et al., 2016). Yu et al. (2019) used national-level data to demonstrate that income inequality has a greater negative impact on migrants in western China. There have been empirical studies on SWB in China for different education level of students, other groups of youth, the aging (Liu et al., 2017b; Xu et al., 2019).
3 Materials and methods
3.1 Study area and data sources
The data used in this study are from the China Labor-force Dynamics Survey (CLDS) 2018, conducted by the Center for Social Survey of Sun Yat-sen University (CSS). The survey is a national and representative dataset, collecting basic information about work conditions, living conditions, public services, and social interactions. Using probability proportional sampling (PPS), the studied sample covered all 29 provinces and 146 cities in China. The final datasets generated 8,396 valid residents. The data analysis was conducted using SPSS 25.0 and STATA 16.0 statistical software.
Table 1 lists the main variables used in the estimate function and provides brief definitions and descriptive statistics. In the complete dataset, males outnumber female residents, accounting for 54.0%. The average age of residents is 51.78, and the proportion of unmarried residents is 12.1%. Non-migrant residents are 15.9% of the participants. Eastern province residents are half of the residents. As for educational background, 86.8% of residents have a secondary or senior high school diploma; only 12.4% have a college education, and 0.8% of them have received a master’s degree or above. Members of the Communist Party of China are 7.9% of the residents. Most of the residents are in the low-income category (82.8%).
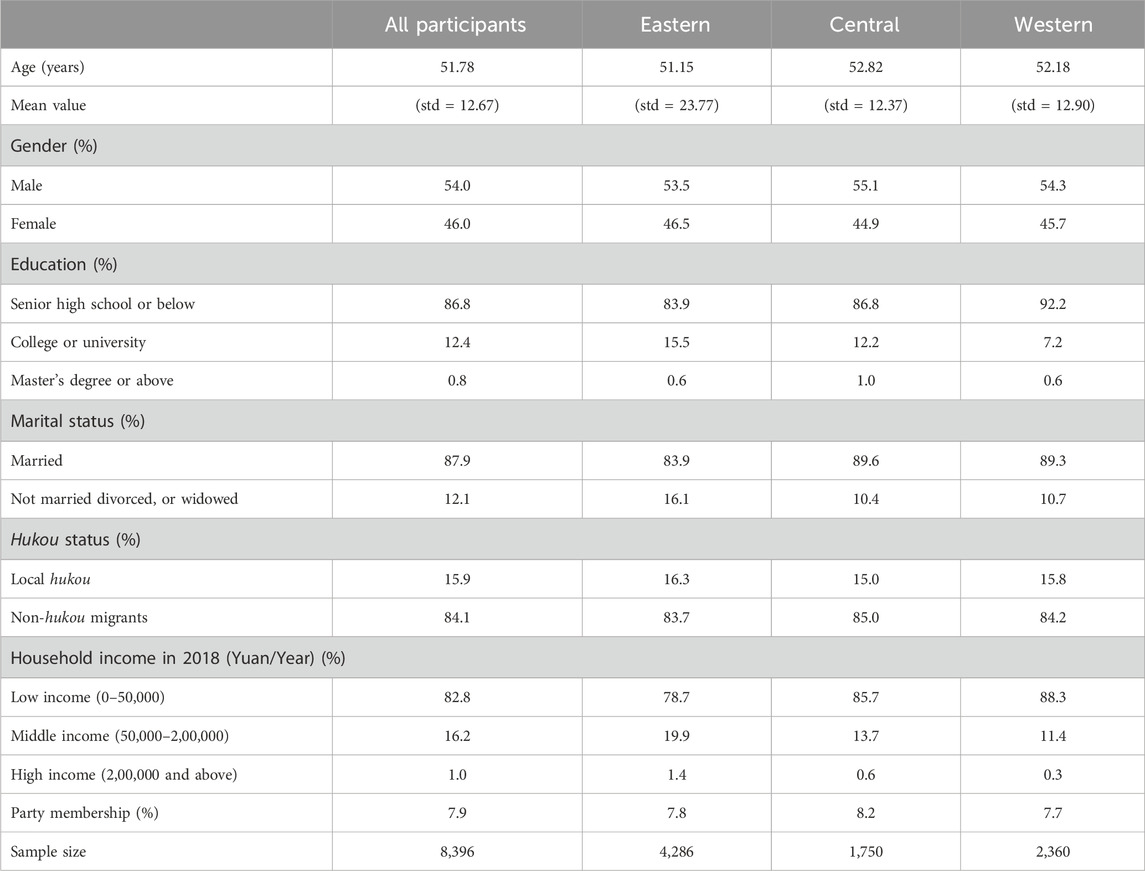
TABLE 1. Sociodemographic characteristics of the sample.
3.2 Variables
3.2.1 Dependent variables
The dependent variable is residents’ SWB. SWB is built on the individual responses to the SWB question, do you feel happy in your life overall? Options for answers include Very unhappy, Unhappy, Neutral, Happy, Very happy. A 5-point Likert-type scale was used in the research, whereby a higher point value means a higher level of SWB. For example, 1 point equates to Very unhappy and 5 points means Very happy.
3.2.2 Independent variables
Based on prior empirical studies, SWB is affected by the work environments, social environments, and urban environments dimensions in this study (Liu et al., 2019; Mouratidis, 2018; Stansfeld et al., 2013). Besides, work stress and job dissatisfaction influence residents’ SWB in the work environments (Sahai and Mahapatra, 2020). A 5-point Likert-type scale ranging from 1 (low) to 5 (high) was used for each indicator. The Cronbach’s alpha of work stress is 0.769 and job dissatisfaction Cronbach’s alpha is 0.933. The indicators shown in Table 2 measure the job dissatisfaction and work stress variables from the work environments dimension. A higher total score for the indicator job dissatisfaction suggested a higher level of job dissatisfaction. While, the work stress index is negative, and a higher score indicates less work stress with a total possible score of 15 points.
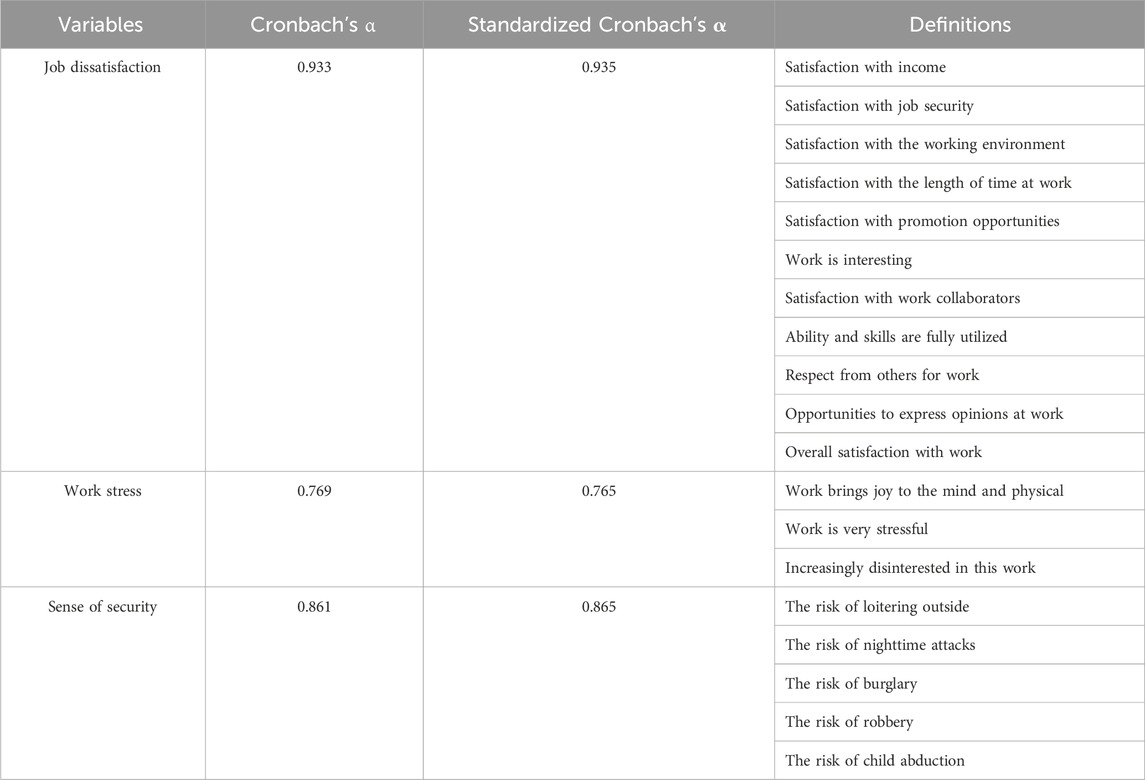
TABLE 2. Description of index of job dissatisfaction, work stress, sense of security.
Moreover, with respect to factors affecting residents’ SWB from social environment dimension, three variables were included in the model: social justice, sense of security and community trust (Dukhanin, et al., 2018; Xu, et al., 2022). Community trust indicates the level of trust in neighbors (Xu, et al., 2022). Social justice refers to the level of social justice with comparison between the hardness of work and their ideal lives (Dukhanin, et al., 2018). Furthermore, sense of security is defined as the individual evaluation of several types of community risk (Liu, et al., 2017c). The variation in sense of security can be classified through five items, including the risks of loitering outside, attacks at night, burglary, robbery, and child abduction. A higher sum score for these indicators means a higher level of sense of security with a total possible score of 25 points. The Cronbach’s alpha of sense of security is 0.816.
To explore how the urban environments dimension influences respondents’ SWB, we included another variable in the analysis (Gao, et al., 2016; Zhang, and Zhang, 2017; Mouratidis, 2018). Table 3 provides a brief definition for each variable. Urbanization rate, administrative region, Land development intensity and population density were all derived from the China Statistical Yearbook 2018. More specifically, capturing the data of the Point of Interest (POI) density in 2018 from the Gaode map API (https://www.amap.com). This mapping application has been widely adopted as a comprehensive POI database, offering rich information on resident services, such as commerce, public services, leisure and entertainment, finance, and so on. Housing prices are obtained from Anjuke, which is a large-scale housing transaction website in China (https://guangzhou.anjuke.com). In particular, Net primary productivity (NPP) is a key indicators of ecosystem health in urban environment, which is collected from National Aeronautics and Space Administration (NASA) (https://appeears. earthdatacloud. nasa. gov/).
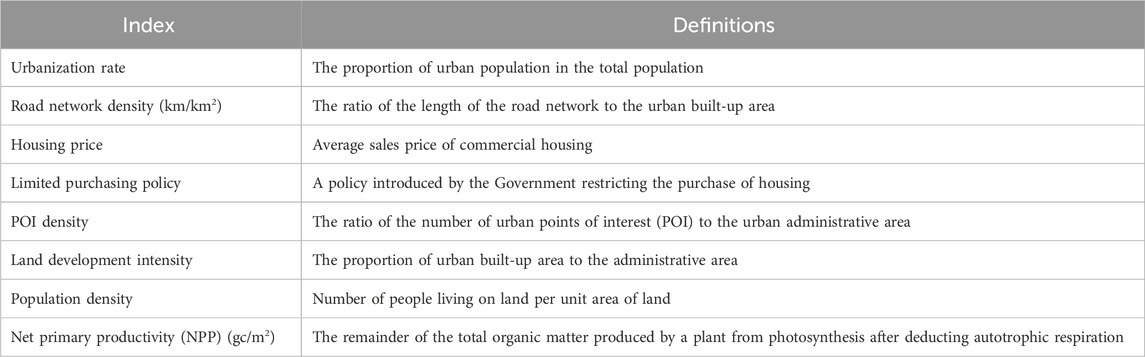
TABLE 3. Urban environment dimension index.
3.2.3 Model specification
SWB is affected by sociodemographic characteristics and the work environments, social environments, and urban environments dimensions in this study. This work employed a multilevel regression model to investigate the influencing factors of residents’ SWB. A null model of SWB considered the dependent variable and calculated the intraclass correlation (ICC) (Goldstein et al., 2011). The ICC model was specified as follows:
In Eq. (1), where
where
4 Results
4.1 Spatial distribution analysis of SWB
We categorized the SWB into five levels, as shown in Figure 1. The average SWB across China is 3.77, which is higher than the average for developed countries (3.55) (Oishi and Schimmack, 2010). Respondents in northeastern China have a higher SWB. Dalian, in Liaoning province. Has the highest SWB at 4.8, while, in Sichuan province, has the lowest SWB at 2.6. At the national level, SWB shows a high in the north and low in the south trend.
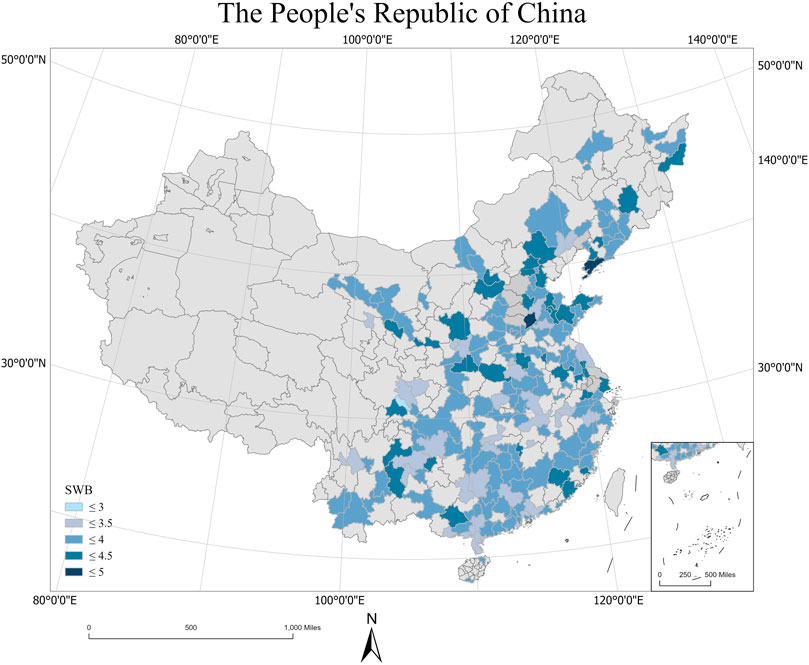
FIGURE 1. Subjective wellbeing (SWB) in China.
We employed a global autocorrelation measure to describe and visualize the spatial distribution of SWB based on the Moran’s I statistic (Goodchild et al., 1992; Huang et al., 2023). The value of Moran’s I (Figure 2) is 0.112 with a Z-score of 4.22 and a p-value below 0.001, which shows that SWB has a significant spatial autocorrelation.
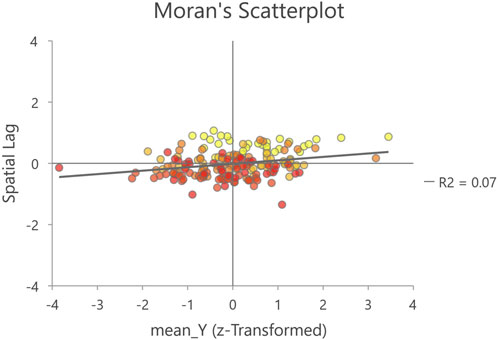
FIGURE 2. Moran’s I scatterplot.
We further use the local indicators of spatial association (LISA) map to detect the local autocorrelation (Figures 3, 4). The high-high hot spots of SWB are in North China and are mainly in the Bohai Economic Circle (the economic region including Beijing, Tianjin, Hebei, Liaoning, and Shandong), while the low–low hot spots are found mainly in South China, Guangdong, Hunan, Hubei, and Sichuan Provinces. The LISA and Moran’s I data indicate that there are significant spatial variabilities of SWB in China. The overall differences contrast with the previous score distribution chart.
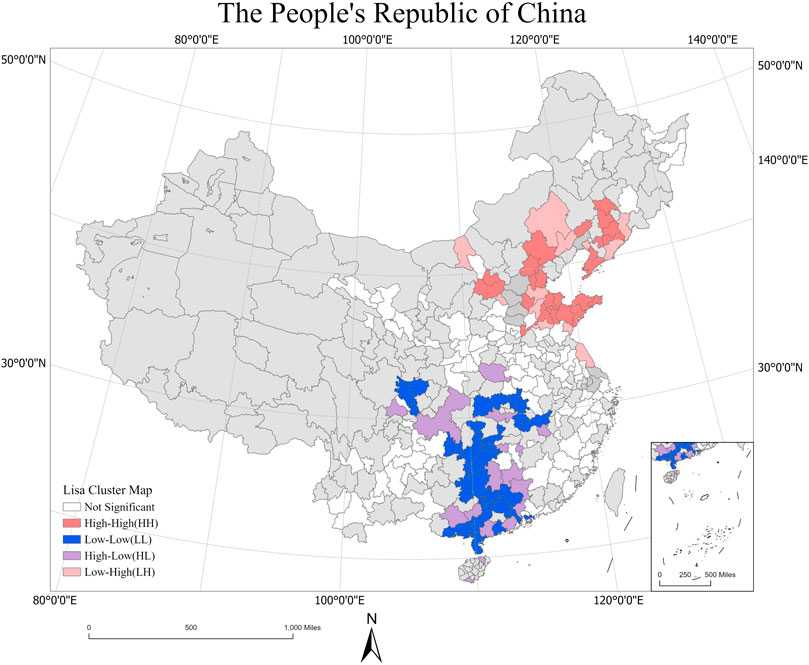
FIGURE 3. Local indicators of spatial association (LISA) cluster map.
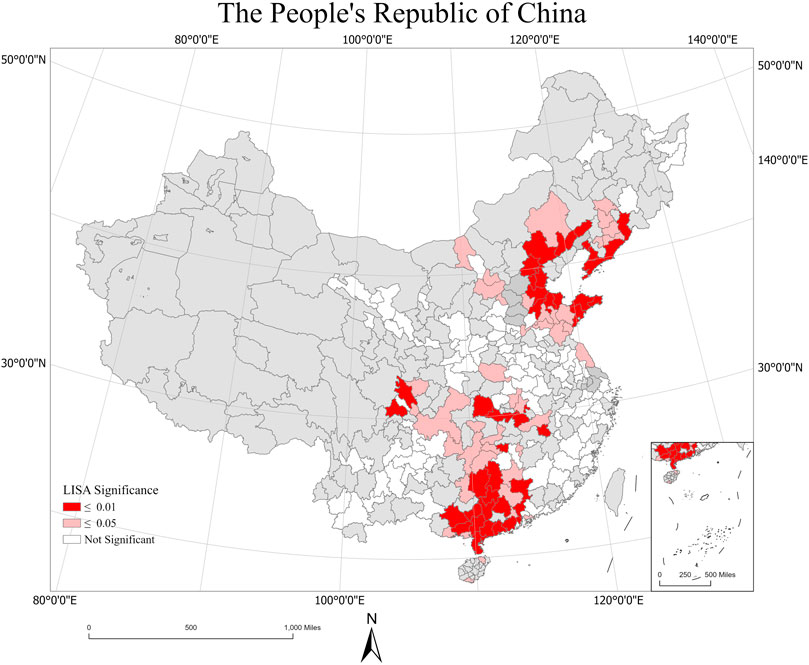
FIGURE 4. LISA significance.
4.2 Determinants of SWB
Table 4 documents the results for the overall regression model using the complete dataset. Using the eastern region as the reference group, the level of overall SWB in the eastern region is slightly higher than that in the central and western regions. Focusing on understanding the association of SWB with respect to sociodemographic characteristics, a rise in gender of one unit leads to a decrease in the proportion of respondents by 0.045 (p < 0.05). Specifically, females seem to be happier than men because men have to take more economic responsibilities in the Chinese traditional society structure, facing more striking social competition and work pressure (Diener et al., 2018). The married residents are happier than unmarried ones possibly due to the enhanced sense of belonging among families after marriage. The finding is consistent with previous studies that married people are happier than single, divorced, or widowed people (Lucas et al., 2003; Bhattarai et al., 2021). Communist Party membership is related with higher levels of SWB (0.157), because party members have strong inner ideological aspirations for pursuing a happier life.
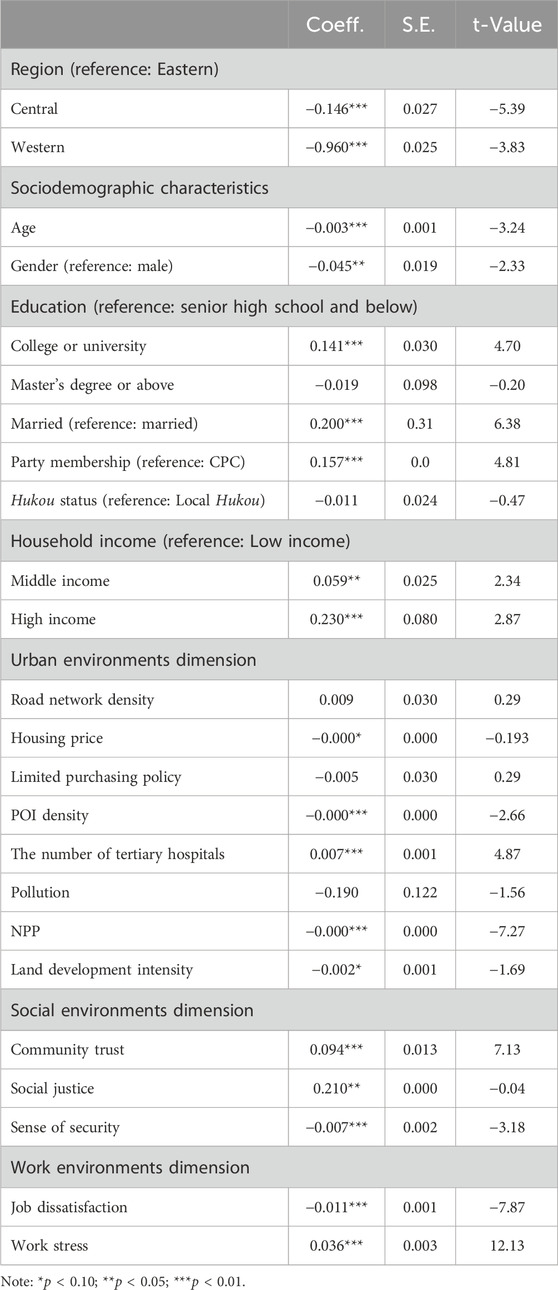
TABLE 4. Regression results for different dimensions of subjective wellbeing (SWB) in the entire sample.
Education is a predictive indicator of one’s capability to obtain success in traditional Confucianism. Respondents with college or university education have more employment advantages than respondents with senior high school education or below, and they have higher level of SWB. Surprisingly, more education such as a master’s degree or above does not significantly correlate with a higher SWB. One explanation may be that respondents with higher education create higher expectations and a higher set point of SWB (Ambrey et al., 2014). In terms of income, respondents are separated into three subsamples: low-income group, high-income group, and middle-income group. The low-income group (0–50,000-yuan annually) is chosen as the reference group. The coefficient of the middle-income group is 0.059 (p < 0.1) and the coefficient of the high-income group is 0.230 (p < 0.01), indicating that rising income has significant positive impact on respondents’ SWB and that economically disadvantaged respondents remain at a lower level of SWB. This finding is consistent with existing literature (Glaeser et al., 2016; Zhan et al., 2022).
For the urban environments dimension, the relationship between the POI density (p < 0.0.1) and SWB remains inconclusive (Grossman et al., 1991; Glaeser et al., 2016; Requena, 2016; Winters and Li, 2017). Increasing POI density is significantly negatively correlated with SWB, which are commonly characterized by urbanization. An increase in the number of tertiary hospitals will also improve the level of SWB by 0.7%. Meanwhile, housing pressure is a principal factor affecting urban respondents’ SWB, because house price is associated with SWB for homeowners with a home loan. Meanwhile, negative significant is found in the effects of the NPP (p < 0.01). The area with higher NPP possibly mainly higher land development intensity is negatively associated with SWB. Specifically, a one-point increase in land development intensity produces 0.002 points decrease in SWB. This implies that land development intensity is important marker of urbanization process and development. Nevertheless, the supply of basic public services is not synchronized with the urbanization development, reducing the SWB of urban residents (Wen and Wang, 2009).
In the social environments dimension, if community trust is increased by 1 point, it will lead to a 0.7% decrease in respondents’ SWB. Respondents with higher level of community trust would believe that they could build up greater social support and more easily solve problems with others’ help. The index to measure sense of security is negative, so if the level increases by one unit, SWB is decreased by 0.7%. Therefore, sense of security has a positive impact on respondents’ SWB. When their sense of security is satisfied, respondents have more awareness of and expectations about their present and future, which enhances their SWB. Additionally, the social justice plays a significant positive role on respondents’ SWB (0.210, p < 0.05). Therefore, with an increased social justice, individuals are likely to have more enthusiasm and creativity to realize their goals. For the work environments dimension, work pressure (0.036, p < 0.01) is significantly positively correlated with SWB. The work stress index is negative, and a high score means less work stress. If work pressure decreased by one unit, it would generate a 3.6% increase in respondents’ SWB. Additionally, the more total score points of the job dissatisfaction variable indicates the less job satisfaction. Thus, a higher level of work satisfaction improves respondents’ SWB.
4.3 Heterogeneity analysis
After examining the entire sample, this study explored SWB heterogeneity from a geographic perspective and divided the total sample into three groups: the eastern, central, and western regions. There is a history of insufficient and unbalanced economic development among the three regions in China. From the results listed in Table 5, among the sociodemographic characteristics, age has a negative impact on the respondents’ SWB in the three regions. This result is consistent with previous studies. For instance, middle-aged respondents with a low level of SWB suffer more stress in social competition and more responsibility to provide for their families (Diener et al., 2018). The coefficient for college or university education is higher for the central region group than for the eastern region group, their higher SWB could be explained by the limited level of economic development in the western region, dominated by labor-intensive traditional industries. It is hard to provide abundant and well-paid job opportunities for highly educated talents in the western region, compared with the eastern and central regions. This leads to an insignificant correlation coefficient for the College or university variable. In addition, there is a positive association between marriage and SWB among different regions because marriage is associated with lasting happiness. However, the coefficient of the married variable in the eastern region is lower than that in the other regions. The eastern region has a higher level of urbanization and a more open mindset. Furthermore, Communist Party membership (0.226, p < 0.01) is significantly positively related to the SWB of respondents in the eastern region. A party member’s high sense of responsibility also brings great happiness in his or her job. The hukou status has a significant positive impact on respondents’ SWB only in the eastern region. A plausible explanation may be that the eastern region can provide a better public service system for respondents and this is more attractive to respondents whose hukou is not local.
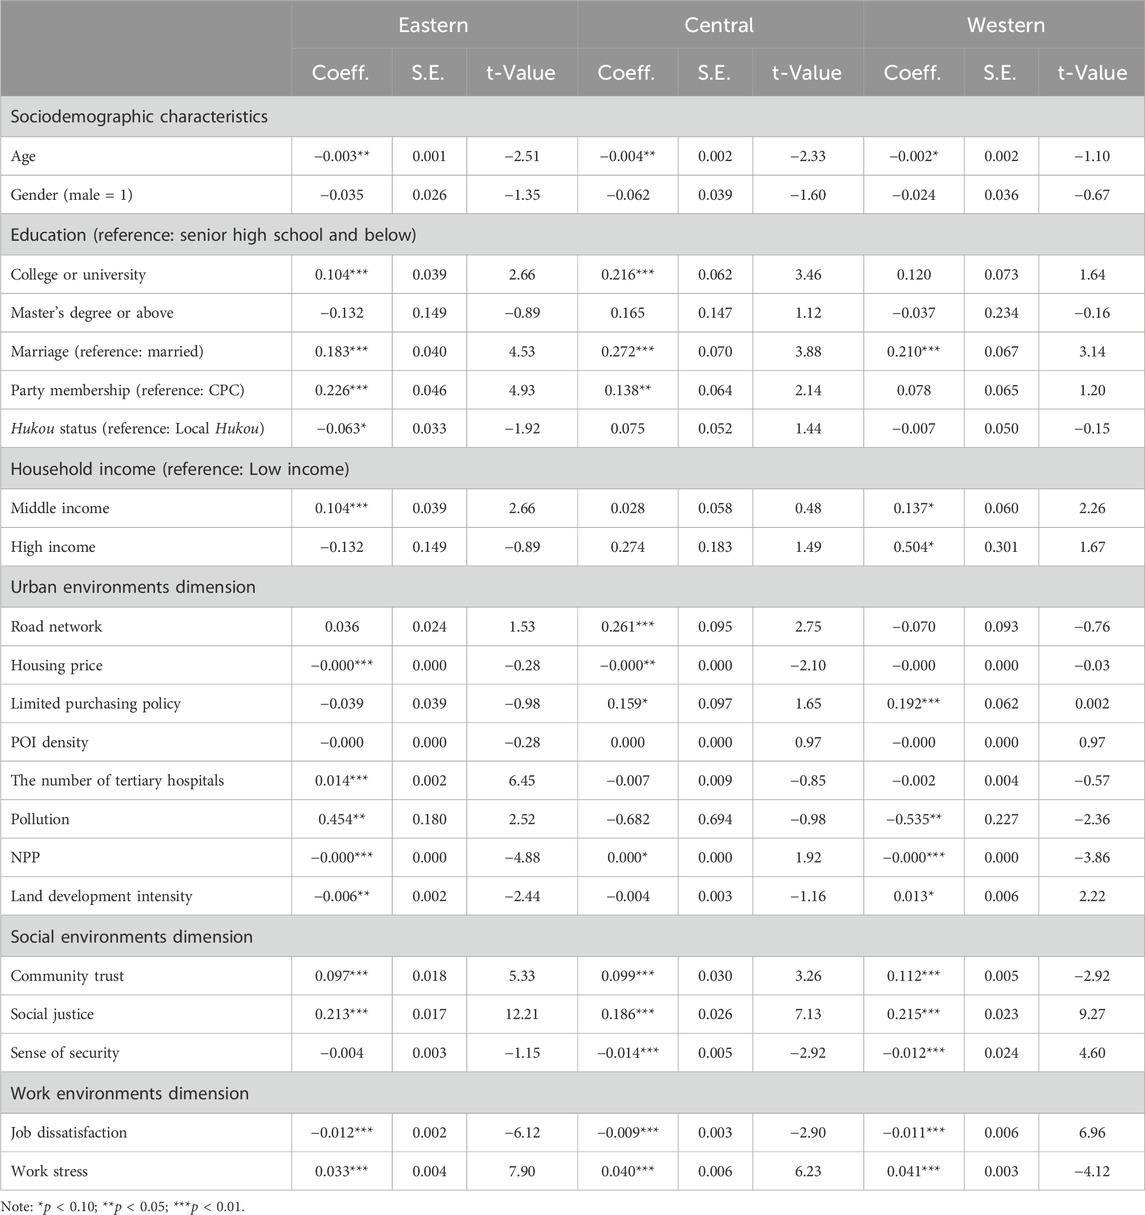
TABLE 5. Regression results of cross-regional subjective wellbeing (SWB).
For the urban environments dimension, gaps in regional development mean that the accessibility of neighborhood facilities can significantly enhance an individual’s SWB (0.261, p < 0.01). Improved transportation networks and accessibility between regions will have a significant positive impact on respondents’ SWB with respect to urban planning and community governance. Housing price has a significant negative correlation with respondents’ SWB in the eastern and central regions. Compared with the western region, the eastern and central regions have higher housing prices, which reduce housing affordability and weaken their SWB. This finding is consistent with previous research (Hu, 2017; Liu et al., 2021). Notably, the results indicate that for every 1 unit increase in the Limited purchasing policy variable, the level of SWB advanced by 0.192 units in the western region, owing to the implementation of housing purchase limits that began in the provincial capital of the western region, and housing prices rising in the other western region cities with relatively weak economic development. The rise in house prices produces a housing wealth effect for home-owning respondents, which has a significant effect on SWB in the western region. The impact of the housing purchase limit is significantly positive for respondents’ SWB in the central region, which indicates the equalization of property resources and enhanced SWB of respondents. The sense of security has no significant effect on respondents’ SWB in the eastern region because of the high mobility of migrants in the cities and the increased heterogeneity between neighborhoods that reduces respondents’ SWB. Moreover, pollution increases the SWB of respondents in the eastern region and significantly suppresses the SWB of respondents in the western region, for two reasons. First, the degree of pollution in the east represents economic development and urbanization at the expense of environmental pollution. Second, the transfer of manufacturing industries from the eastern and central regions to the western region exacerbates environmental pollution and reduces respondents’ quality of life. An inverted U-shaped pattern can describe both the relationship between pollution and economic development and the association between environmental pollution and SWB. With the growth of a region’s economy and the SWB of respondents, the level of environmental pollution will first increase to a certain level, and then decrease. Thus, the western region is on an upward trend and the eastern region is on a downward trend.
Increasing work stress and decreasing job satisfaction exert statistically significant negative effects on SWB in different regions in terms of the work environments dimension. Similarly, the level of community trust, social justice, and sense of security exert statistically significant effects on respondents’ SWB among the three regions in terms of the social environments dimension.
5 Conclusion and discussion
5.1 Conclusion
Improving the living environments and protecting potentially disabled and marginalized groups are critical issues. However, the determinants of SWB from different dimensions, such as the social environments, the work environments, and the urban environments and how they affect Chinese residents’ SWB remains unclear. In this study we discuss the differences in SWB among different regions of China. The study reveals that the mechanism of SWB of Chinese residents has the following three associations:
(1) At the national level, SWB is high in the north and low in the south. The LISA and Moran’s I results indicate that there are significant spatial variabilities of SWB in China. The high-high hot spots of SWB are in North China and are mainly in the Bohai Economic Circle, while the low-low hot spots are found mainly in South China, Guangdong, Hunan, Hubei, and Sichuan Provinces.
(2) For the social environments dimension, community trust, social justice, and sense of security are positively associated with SWB. Moreover, age, gender, Communist Party membership, education, and income are significantly associated with community trust. Meanwhile, for the urban environments dimension, indicators such as housing price, POI density, and the number of tertiary hospitals have significant effects on SWB. Additionally, factors like work stress and job dissatisfaction from the work environments dimension exert significant effects on SWB in general.
(3) There are distinct heterogeneity effects on SWB from different dimensions across regions. The association between environmental pollution and SWB can be portrayed as an inverted U-shaped pattern. Housing price has a significant negative impact on SWB in the eastern and central regions, while implementation of housing purchase limits improved residents’ SWB in the western region.
5.2 Discussion
This study sheds light on how to improve residents’ SWB and build up harmonious communities for policymakers, urban planners, and related architects. First, the imbalance and differentiation in the supply of public services among different regions cannot be ignored by government policymakers. The government should provide more support for socioeconomically disadvantaged areas to narrow the development gaps between regions with the assistance for employment, education, healthcare, housing, and social welfare. For example, to balance the relationship between ecology and economic development, the western region can develop innovative industries like green finance, ecological compensation policies, and so on. Second, to meet the diverse needs of the public and improve accessibility to service facilities, the government not only should provide more opportunities for residents to express their needs, especially for disadvantaged and vulnerable groups, but also promote resident participation in public policymaking together with social institutions and organizations. Third, to stimulate residents’ enthusiasm to achieve happier lives, the government must promote an equal employment system and better work environments for residents.
This study has some limitations that should be noted. First, the cross-sectional nature of the data was used in the research. In the future work, utilizing longitudinal databases and experiments may provide more robust empirical evidence chain. It will be necessary to give a dynamic follow-up investigation and provide more favorable polices by using the panel data. Second, we did not consider some variables such as green space, social contact in the analysis due to the unavailability of relevant data. Regression estimations may be biased if related variables are omitted. In terms of data, apart from socio-economic statistics and remote sensing data from a bird’s-eye view, research should also be carried out in combination with mobile phone signaling big data and street view data, so as to enrich the research perspective and improve the research refinement.
Data availability statement
The original contributions presented in the study are included in the article/Supplementary material, further inquiries can be directed to the corresponding author.
Author contributions
ZF: Conceptualization, Writing–original draft. YL: Conceptualization, Data curation, Writing–original draft. CM: Formal Analysis, Writing–original draft. RW: Funding acquisition, Project administration, Supervision, Writing–original draft.
Funding
The author(s) declare financial support was received for the research, authorship, and/or publication of this article. This work was supported by the National Natural Science Foundation of China (Grant No. 42001147), Guangdong Province Natural Science Fund (Grant No. 2022A1515011728), Special Funds for the Cultivation of Guangdong College Students’ Scientific and Technological Innovation (“Climbing Program” Special Funds, Grant No. pdjh 2022a0153).
Conflict of interest
Author ZF was employed by Guangzhou Transport Planning Research Institute Co., Ltd.
The remaining authors declare that the research was conducted in the absence of any commercial or financial relationships that could be construed as a potential conflict of interest.
Publisher’s note
All claims expressed in this article are solely those of the authors and do not necessarily represent those of their affiliated organizations, or those of the publisher, the editors and the reviewers. Any product that may be evaluated in this article, or claim that may be made by its manufacturer, is not guaranteed or endorsed by the publisher.
References
Ala-Mantila, S., Heinonen, J., Junnila, S., and Saarsalmi, P. (2018). Spatial nature of urban well-being. Reg. Stud. 52, 959–973. doi:10.1080/00343404.2017.1360485
Ambrey, C. L., Fleming, C. M., and Manning, M. (2014). Perception or reality, what matters most when it comes to crime in your neighbourhood? Soc. Indic. Res. 119, 877–896. doi:10.1007/s11205-013-0521-6
Arifwidodo, S. D., and Perera, R. (2011). Quality of life and compact development policies in Bandung, Indonesia. Appl. Res. Qual. Life 6, 159–179. doi:10.1007/s11482-010-9123-5
Ballas, D., and Tranmer, M. (2012). Happy people or happy places? A multilevel modelling approach to theanalysis of happiness and well-being. Int. Regional Sci. Rev. 35, 70–102. doi:10.1177/0160017611403737
Bhattarai, M., Jin, Y., Smedema, S. M., Cadel, K. R., and Baniya, M. (2021). The relationships among self-efficacy, social support, resilience, and subjective well-being in persons with spinal cord injuries. J. Adv. Nurs. 77, 221–230. doi:10.1111/jan.14573
Blanchfower, D. G., and Oswald, A. J. (2008). Hypertension and happiness across nations. J. Health Econ. 27, 218–233. doi:10.1016/j.jhealeco.2007.06.002
Brockmann, H., Delhey, J., Welzel, C., and Yuan, H. (2009). The China puzzle: falling happiness in a rising economy. J. Happiness Stud. 10, 387–405. doi:10.1007/s10902-008-9095-4
Bryson, A., Forth, J., and Stokes, L. (2017). Does employees’ subjective well-being affect workplace performance? Hum. Relat. 70, 1017–1037. doi:10.1177/0018726717693073
Cagney, K. A., and York Cornwell, E. (2010). Neighborhoods and health in later life: the intersection of biology and community. Annu. Rev. Gerontology Geriatrics 30, 323–348. doi:10.1891/0198-8794.30.323
Cai, S., and Wang, J. (2018). Less advantaged, more optimistic? Subjective well-being among rural, migrant and urban populations in contemporary China. China Econ. Rev. 52, 95–110. doi:10.1016/j.chieco.2018.06.005
Carrus, G., Scopelliti, M., Lafortezza, R., Colangelo, G., Ferrini, F., Salbitano, F., et al. (2015). Go greener, feel better? The positive effects of biodiversity on the well-being of individuals visiting urban and peri-urban green areas. Landsc. Urban Plan. 134, 221–228. doi:10.1016/j.landurbplan.2014.10.022
Cheng, Y., Yu, Z., Xu, C., Manoli, G., Ren, X., and Zhang, J. (2023). Climatic and economic background determine the disparities in urbanites’ expressed happiness during the summer heat. Environmental Science and Technology 57 (30), 10951–10961.
Clark, A. E., Frijters, P., and Shields, M. A. (2008). Relative income, happiness, and utility: an explanation for the Easterlin paradox and other puzzles. J. Econ. Literature 46, 95–144. doi:10.1257/jel.46.1.95
Davis, N., Daams, M., Hinsberg, A., and Sijtsma, F. (2016). How deep is your love – of nature? A psychological and spatial analysis of the depth of feelings towards Dutch nature areas. Appl. Geogr. 77, 38–48. doi:10.1016/j.apgeog.2016.09.012
Dang, Y., Dong, G., Chen, Y., Jones, K., and Zhang, W. (2019). Residential environment and subjective well-being in Beijing: A fine-grained spatial scale analysis using a bivariate response binomial multilevel model. Environment and Planning B: Urban Analytics and City Science 46 (4), 648–667.
De Neve, J. E., Diener, E., Tay, L., and Xuereb, C. (2013). “The objective benefits of subjective well-being,” in World happiness report (Sunway City Kuala Lumpur: UN Sustainable Development Solutions Network).
Diener, E. (1984). Subjective well-being. Psychol. Bull. 95, 542–575. doi:10.1037/0033-2909.95.3.542
Diener, E. (1994). Assessing subjective well-being: progress and opportunities. Sociallndicators Res. 31, 103–157. doi:10.1007/bf01207052
Diener, E., and Chan, M. (2011). Happy people live longer: subjective well-being contributes to health and longevity. Appl. Psychol. Health Well Being 3, 1–43. doi:10.1111/j.1758-0854.2010.01045.x
Diener, E., Oishi, S., and Tay, L. (2018). Advances in subjective well-being research. Nat. Hum. Behav. 2, 253–260. doi:10.1038/s41562-018-0307-6
Diener, E., and Seligman, M. E. P. (2004). Beyond money: toward an economy of wellbeing. Psychol. Sci. Public Interest 5, 1–31. doi:10.1111/j.0963-7214.2004.00501001.x
Dittmann, J., and Goebel, J. (2010). Your house, your car, your education: the socioeconomic situation of the neighborhood and its impact on life satisfaction in Germany. Soc. Indic. Res. 96, 497–513. doi:10.1007/s11205-009-9489-7
Dong, H., and Qin, B. (2017). Exploring the link between neighborhood environment and mental wellbeing: a case study in Beijing, China. Landsc. Urban Plan. 164, 71–80. doi:10.1016/j.landurbplan.2017.04.005
Dukhanin, V., Searle, A., Zwerling, A., Dowdy, D. W., Taylor, H. A., and Merritt, M. W. (2018). Integrating social justice concerns into economic evaluation for healthcare and public health: a systematic review. Soc. Sci. Med. 198, 27–35. doi:10.1016/j.socscimed.2017.12.012
Easterlin, R. A. (1974). “Does economic growth improve the human lot? Some empirical evidence,” in Nations and households in economic growth 1974 (Cambridge, Massachusetts, United States: Academic Press), 89–125.
Easterlin, R. A., Wang, F., and Wang, S. (2017). “Growth and happiness in China, 1990-2015,” in World happiness report (Sunway City Kuala Lumpur: UN Sustainable Development Solutions Network), 48–82.
Elliott, J., Gale, C. R., Parsons, S., Kuh, D., and Halc, S. (2014). Neighbourhood cohesion and mental wellbeing among older adults: a mixed methods approach. Soc. Sci. Med. 107, 44–51. doi:10.1016/j.socscimed.2014.02.027
Fleming, C. M., Manning, M., and Ambrey, C. L. (2016). Crime, greenspace and life satisfaction: an evaluation of the New Zealand experience. Landsc. Urban Plan. 1–10. doi:10.1016/j.landurbplan.2015.12.014
Gandelman, N., Piani, G., and Ferre, Z. (2012). Neighborhood determinants of quality of life. J. Happiness Stud. 13, 547–563. doi:10.1007/s10902-011-9278-2
Gao, M. L., Ahern, J., and Koshland, C. P. (2016). Perceived built environment and health-related quality of life in four types of neighborhoods in Xi’an, China. Health Place 39, 110–115. doi:10.1016/j.healthplace.2016.03.008
Gascon, M., Triguero-Mas, M., Martinez, D., Dadvand, P., Forns, J., Plasencia, A., et al. (2015). Mental health benefits of long-term exposure to residential green and blue spaces: a systematic review. Int. J. Environ. Res. Public Health 12, 4354–4379. doi:10.3390/ijerph120404354
Glaeser, E. L., Gottlieb, J. D., and Ziv, O. (2016). Unhappy cities. J. Labor Econ. 34, 129–182. doi:10.1086/684044
Goldstein, N. E. S., Romaine, C. L. R., Zelle, H., Kalbeitzer, R., Mesiarik, C., and Wolbransky, M. (2011). Psychometric properties of the miranda rights comprehension instruments with a juvenile justice sample. Assessment 18, 428–441. doi:10.1177/1073191111400280
Goodchild, M., Haining, R., and Wise, S. (1992). Integrating GIS and spatial data analysis: problems and possibilities. Int. J. Geogr. Inf. Syst. 6, 407–423. doi:10.1080/02693799208901923
Grossman, G. M., Krueger, , and B, A. (1991). Environmental impacts of a north American free trade agreement. Cambridge: National Bureau of Economic Research.
Han, C. (2015). Explaining the subjective well-being of urban and rural Chinese: income, personal concerns, and societal evaluations. Soc. Sci. Res. 49, 179–190. doi:10.1016/j.ssresearch.2014.08.006
Haybron, D. M. (2003). What do we want from a theory of happiness? Metap-hilosophy 34, 305–329. doi:10.1111/1467-9973.00275
Hsee, C. K., Yang, A. X., and Wang, L. (2010). Idleness aversion and the need for justifiable busyness. Psychol. Sci. 21, 926–930. doi:10.1177/0956797610374738
Hu, D. (2017). A study on the influence mechanism of education degree on happiness of urban and rural residents in China: based on the data of the 2013 Chinese general social survey. Contemp. Educ. Sci. 11, 22–27. doi:10.3969/j.issn.1672-2221.2017.11.006
Huang, J. (2013). Education, income and happiness of Chinese urban residents:Based on the data of the 2005 Chinese general social survey. Chin. J. Sociol. 33, 181–203. doi:10.15992/j.cnki.31-1123/c.2013.05.009
Huang, J., and Fang, Y. (2021). Income inequality, neighbourhood social capital and subjective well-being in China: exploration of a moderating effect. IJERPH 18, 6799. doi:10.3390/ijerph18136799
Huang, Y., Yi, D., and Clark, W. A. (2023). Subjective wellbeing in 21st century China: a multi-level multi-dimensional perspective on urban-rural disparities. Appl. Geogr. 159, 103071. doi:10.1016/j.apgeog.2023.103071
Jin, Y., Li, Z., and An, J. (2020). Impact of education on Chinese urban and rural subjective well-being. Child. Youth Serv. Rev. 119, 105505. doi:10.1016/j.childyouth.2020.105505
Kahneman, D., and Deaton, A. (2010). High income improves evaluation of life but not emotional well-being. Proc. Natl. Acad. Sci. 107, 16489–16493. doi:10.1073/pnas.1011492107
Knight, J., and Gunatilaka, R. (2008). The rural–urban divide in China: income not happiness? Oxford: University of Oxford: Department of Economics.
Knight, J., and Gunatilaka, R. (2010). Great expectations? The subjective well-being of rural–urban migrants in China. World Dev. 38, 113–124. doi:10.1016/j.worlddev.2009.03.002
Knight, J., Song, L., and Gunatilaka, R. (2009). Subjective well-being and its determinants in rural China. China Econ. Rev. 20, 635–649. doi:10.1016/j.chieco.2008.09.003
Knight, R. G., and Gunatilaka, R. (2011). Does economic growth raise happiness in China? Oxford Dev. Stud 39, 1–24. doi:10.1080/13600818.2010.551006
Kuykendall, L., Tay, L., and Ng, V. (2015). Leisure engagement and subjective well-being: a meta-analysis. Psychol. Bull. 141 (2), 364–403. doi:10.1037/a0038508
Li, N. P., and Kanazawa, S. (2016). Country roads, take me home to my friends: how intelligence, population density, and friendship affect modern happiness. Br. J. Psychol. 107, 675–697. doi:10.1111/bjop.12181
Liu, Y., Dijst, M., Faber, J., Geertman, S., and Cui, C. (2017a). Healthy urban living: residential environment and health of older adults in Shanghai. Health Place 47, 80–89. doi:10.1016/j.healthplace.2017.07.007
Liu, Y., Wu, F., Liu, Y., and Li, Z. (2017b). Changing neighbourhood cohesion under the impact of urban redevelopment: a case study of Guangzhou, China. Urban Geogr. 38, 266–290. doi:10.1080/02723638.2016.1152842
Liu, Y., Xiao, T., Liu, Y., Yao, Y., and Wang, R. (2021). Natural outdoor environments and subjective well-being in Guangzhou, China: comparing different measures of access. Urban For. Urban Green. 59, 127027. doi:10.1016/j.ufug.2021.127027
Liu, Y., Zhang, F., Liu, Y., Li, Z., and Wu, F. (2017c). The effect of neighbourhood social ties on migrants' subjective wellbeing in Chinese cities. Habitat Int. 66, 86–94. doi:10.1016/j.habitatint.2017.05.011
Lucas, R. E., Clark, A. E., Georgellis, Y., and Diener, E. (2003). Reexamining adaptation and the set point model of happiness: reactions to changes in marital status. J. Pers. Soc. Psychol. 84, 527–539. doi:10.1037/0022-3514.84.3.527
Ludwig, J., Duncan, G. J., Gennetian, L. A., Katz, L. F., Kessler, R. C., Kling, J. R., et al. (2012). Neighborhood effects on the long-term well-being of low-income adults. Science 337, 1505–1510. doi:10.1126/science.1224648
Lyubomirsky, S., King, L., and Diener, E. (2005). Te benefts of frequent positive afect: does happiness lead to success? Psychol. Bull 131, 803–855. doi:10.1037/0033-2909.131.6.803
Ma, J., Dong, G., Chen, Y., and Zhang, W. (2018). Does satisfactory neighbourhood environment lead to a satisfying life? An investigation of the association between neighbourhood environment and life satisfaction in Beijing. Cities 74, 229–239. doi:10.1016/j.cities.2017.12.008
MacKerron, G., and Mourato, S. (2009). Life satisfaction and air quality in London. Ecol. Econ. 68, 1441–1453. doi:10.1016/j.ecolecon.2008.10.004
Manski, C. F. (1993). Identification of endogenous social effects: the reflection problem. Rev. Econ. Stud. 60, 531–542. doi:10.2307/2298123
Mouratidis, K. (2018). Built environment and social well-being: how does urban form affect social life and personal relationships? Cities 74, 7–20. doi:10.1016/j.cities.2017.10.020
Ng, Y. K. (1997). A case for happiness, cardinalism, and interpersonal comparability. Econ. J. 107 (445), 1848–1858. doi:10.1111/j.1468-0297.1997.tb00087.x
Nie, P., and Sousa-Poza, A. (2016). Commute time and subjective well-being in urban China. China Econ. Rev. 48, 188–204. doi:10.1016/j.chieco.2016.03.002
Oishi, S., and Schimmack, U. (2010). Residential mobility, well-being, and mortality. J. Personality Soc. Psychol. 98, 980–994. doi:10.1037/a0019389
Pan, Z., Zhang, Y., Zhou, C., and Zhou, Z. (2021). Effects of individual and community-level environment components on the subjective well-being of poverty alleviation migrants: the case in Guizhou, China. International Journal of Sustainable Development and World Ecology 28 (7), 622–631.
Pavot, W., and Diener, E. (1993). Review of the satisfaction with life scale. Psychol. Assess. 5, 164–172. doi:10.1037/1040-3590.5.2.164
Requena, F. (2016). Rural–urban living and level of economic development as factors in subjective well-being. Soc. Indic. Res. 128, 693–708. doi:10.1007/s11205-015-1051-1
Ryff, C. D. (1989). Happiness is everything, or is it? Explorations on the meaning of psychological well-being. J. personality Soc. Psychol. 57, 1069–1081. doi:10.1037/0022-3514.57.6.1069
Sahai, A., and Mahapatra, D. M. (2020). Subjective well-being at workplace: a review on its implications. J. Crit. Rev. doi:10.31838/jcr.07.11.144
Schwanen, T., and Wang, D. (2014). Well-being, context, and everyday activities in space and time. Ann. Assoc. Am. Geogr. 4, 833–851. doi:10.1080/00045608.2014.912549
Schyns, P. (2002). Wealth of nations, individual income and life satisfaction in 42 countries: a multilevel approach. Soc. Indic. Res. 60, 5–40. doi:10.1023/a:1021244511064
Sharma, G., and Tolani, B. (2015). Subjective well-being for employees in an organization. Indian Journal of Health and Wellbeing 6 (5), 529.
Shier, M. L., and Graham., J. R. (2011). Work-related factors that impact social work practitioners’ subjective well-being: well-being in the workplace. J. Soc. Work 11 (4), 402–421. doi:10.1177/1468017310380486
Stansfeld, S. A., Shipley, M. J., Head, J., Fuhrer, R., and Kivimaki, M. (2013). Work characteristics and personal social support as determinants of subjective well-being. PloS one 8 (11), e81115.
Sun, S., Chen, J., Johannesson, M., Kind, P., and Burström, K. (2016). Subjective well-being and its association with subjective health status, age, sex, region, and socio-economic characteristics in a Chinese population study. J. Happiness Stud. 17, 833–873. doi:10.1007/s10902-014-9611-7
Tang, J., Xu, Y., Ma, W., and Gao, S. (2021). Does participation in poverty alleviation programmes increase subjective well-being? Results from a survey of rural residents in Shanxi, China. Habitat Int. 118, 102455. doi:10.1016/j.habitatint.2021.102455
Veenhoven, R., and Hagerty, M. (2006). Rising happiness in nations 1946–2004: a reply to Easterlin. Soc. Indic. Res. 79, 421–436. doi:10.1007/s11205-005-5074-x
Wang, D., Schwanen, T., and Mao, Z. (2019). Does exposure to richer and poorer neighborhoods influence wellbeing? Cities 95, 102408. doi:10.1016/j.cities.2019.102408
Wang, M., Wang, S., Zhang, X., Xia, Q., Cai, G., Yang, X., et al. (2016). Analysis on the situation of subjective well-being and its influencing factors in patients with ankylosing spondylitis. Health Qual. Life Outcomes 14, 118–127. doi:10.1186/s12955-016-0522-7
Watson, D., Clark, L. A., and Tellegen, A. (1988). Development and validation of brief measures of positive and negative affect: the PANAS scales. J. Pers. Soc. Psychol. 54, 1063–1070. doi:10.1037/0022-3514.54.6.1063
Wei, Y. D., and Liefner, I. (2012). Globalization, industrial restructuring, and regional development in China. Applied geography 32 (1), 102–105.
Wen, M., and Wang, G. (2009). Demographic, psychological, and social environmental factors of loneliness and satisfaction among rural-to-urban migrants in Shanghai, China. Int. J. Comp. Sociol. 50, 155–182. doi:10.1177/0020715208101597
Wilson, W. R. (1967). Correlates of avowed happiness. Psychol. Bull. 67, 294–306. doi:10.1037/h0024431
Winters, J. V., and Li, Y. (2017). Urbanisation, natural amenities and subjective well-being: evidence from US counties. Urban Stud. 54, 1956–1973. doi:10.1177/0042098016631918
Xu, G., Liao, Y., Jiang, Y., Xu, P., Yang, L., Huang, W., et al. (2022). The impacts of urban environments on community trust of the low-income group: a case study for the Pearl River Delta region. Land 12, 61. doi:10.3390/land12010061
Xu, W., Sun, H., Zhu, B., Bai, W., Yu, X., Duan, R., et al. (2019). Analysis of factors affecting the high subjective well-being of Chinese residents based on the 2014 China family panel study. Int. J. Environ. Res. public health 16, 2566. doi:10.3390/ijerph16142566
Yen, I. H., Michael, Y. L., and Perdue, L. (2009). Neighborhood environment in studies of health of older adults: a systematic review. Am. J. Prev. Med. 37 (5), 455–463. doi:10.1016/j.amepre.2009.06.022
Yu, M., Yang, S., Qiu, T., Gao, X., and Wu, H. (2019). Moderating role of self-esteem between perceived organizational support and subjective well-being in Chinese nurses: a cross-sectional study. Front. Psychol. 10, 2315. doi:10.3389/fpsyg.2019.02315
Yuan, K. H., and Bentler, P. M. (2007). 3. Multilevel covariance structure analysis by fitting multiple single-level models. Sociol. Methodol. 37, 53–82. doi:10.1111/j.1467-9531.2007.00182.x
Zhan, D., Kwan, M.-P., Zhang, W., Chen, L., and Dang, Y. (2022). The impact of housing pressure on subjective well-being in urban China. Habitat Int. 127, 102639. doi:10.1016/j.habitatint.2022.102639
Zhang, Z., and Zhang, J. (2017). Perceived residential environment of neighborhood and subjective well-being among the elderly in China: a mediating role of sense of community. J. Environ. Psychol. 51, 82–94. doi:10.1016/j.jenvp.2017.03.004
Zhou, Y., Zhou, L., Fu, C., Wang, Y., Liu, Q., and Wu, H. (2015). Socio-economic factors related with the subjective well-being of the rural elderly people living independently in China. Int. J. Equity Health 14, 5. doi:10.1186/s12939-015-0136-4
Keywords: subjective wellbeing, urban environment, work environment, social environment, cross-regional analysis, China
Citation: Fang Z, Liao Y, Ma C and Wu R (2024) Examining the impacts of urban, work and social environments on residents’ subjective wellbeing: a cross-regional analysis in China. Front. Environ. Sci. 11:1343340. doi: 10.3389/fenvs.2023.1343340
Received: 23 November 2023; Accepted: 29 December 2023;
Published: 15 January 2024.
Edited by:
Xu Zhao, Shandong University, Weihai, ChinaReviewed by:
Jili Xu, Guangzhou Institute of Geography, ChinaXiang Huang, South China Normal University, China
Copyright © 2024 Fang, Liao, Ma and Wu. This is an open-access article distributed under the terms of the Creative Commons Attribution License (CC BY). The use, distribution or reproduction in other forums is permitted, provided the original author(s) and the copyright owner(s) are credited and that the original publication in this journal is cited, in accordance with accepted academic practice. No use, distribution or reproduction is permitted which does not comply with these terms.
*Correspondence: Rong Wu, d3Vyb25nQGdkdXQuZWR1LmNu
†These authors have contributed equally to this work and share first authorship