 Lin Li
 Zhexi Xia
 Jiahui Yi
 Rui Qi
 Jinhua Cheng
- School of Economics and Management, China University of Geosciences, Wuhan, China
Introduction: The uncertainty associated with PM2.5 pollution hinders the economic high-quality development and threatens public health. Industrial agglomeration stands as a critical factor in regional economic and environmental governance, and the current studies about its impact on PM2.5 pollution are mostly limited to a specific industry or unidirectional influence.
Methods: Our study constructed spatial econometric models to analyze the effect of three major industrial agglomerations on PM2.5 pollution, based on evidence from 110 prefecture-level cities of the Yangtze River Economic Belt in 2005–2019.
Results: The results show that: 1) The three major industrial agglomerations and PM2.5 pollution present different spatiotemporal characteristics and show prominent positive spatial autocorrelation and agglomeration effect. 2) The primary industrial agglomeration contributes to a decrease in PM2.5 pollution and exhibits negative spatial spillover effects. A nonlinear relationship is observed between the secondary industrial agglomeration and PM2.5 pollution. The tertiary industrial agglomeration results in an increase in PM2.5 pollution. 3) The effects of secondary industrial agglomeration on PM2.5 pollution exhibit varying degrees of ‘inverted U-shape’ curves in the upstream, midstream, and downstream cities. The midstream cities are the first to reach the inflection point of agglomeration. 4) Industrial agglomeration affects PM2.5 pollution through three mechanisms, including scale expansion effect, technological spillover effect, and population scale effect.
Discussion: Based on the empirical findings, this study provides scientific support and decision-making reference to improve the positive impacts of industrial agglomerations on PM2.5 pollution.
1 Introduction
PM2.5 pollution, characterized by wide impact, enormous difficulty of governance, and uncertain occurrence frequency, has consistently remained a focal point of attention for the government and scholars in recent years (Colmer et al., 2020; Jbaily et al., 2022). The report Towards an Environmentally Sustainable Future: National Environmental Analysis of the People’s Republic of China reveals that seven out of ten most severely polluted cities globally are located in China (The Asian Development Bank, 2012). In 2013, there are less than 1% of the largest 500 cities in China that attained the air quality criteria outlined by the World Health Organization. The occurrence of PM2.5 pollution is associated with natural factors such as climate and geographical environment, but it is primarily influenced by industrial structure and economic growth patterns. The Chinese government has carried out a range of policies and measurements to address issues related to industrial structure adjustment and optimization of energy structure. Initiatives such as the Action Plan on Prevention and Control of Air Pollution and the Three-Year Action Plan to Fight Air Pollution have been introduced, regarding the reduction of PM2.5 pollution as a momentous task essential for public health and wellbeing. Industrial agglomeration refers to the phenomenon where economic activities of enterprises become relatively concentrated within specific spatial regions, closely intertwined with regional economic progression and environmental governance (Glaeser and Kahn, 2010). Through the concentration and scaling of production factors, industrial agglomeration contributes to enhancing the efficiency of pollution control, thereby mitigating PM2.5 pollution levels (Zhang et al., 2022). Conversely, industrial agglomeration could also lead to excessive resources and energy consumption, resulting in adverse environmental influence (He et al., 2022). Therefore, the impact of industrial agglomeration on PM2.5 pollution remains uncertain. In the context of urgent environmental concerns, understanding the relationship between industrial agglomeration and PM2.5 pollution is beneficial for alleviating environmental issues and propelling harmonious economic and ecological progression.
The Yangtze River Economic Belt (YEB) is a crucial strategic support zone for economic growth in China. It is endowed with a number of industrial clusters, holding an exceptionally significant position and role in regional development of China. In 2021, the economic output of the YEB accounted for 46.7% of the nation’s total output, contributing to 51.1% of China’s economic growth (Changjiang times, 2022). After years of progression and construction, the YEB has achieved a transformative shift from a “regional economy” to a “river basin economy.” A dynamic scenario has unfolded, characterized by industrial agglomeration, intra-industry competition and the diverse spread of industries (Zhang et al., 2023a). Parallel to the economic advancement, the impact of industrial spatial arrangement on PM2.5 pollution has garnered widespread attention in society. Many researchers argued that the current industrial structure and arrangement of the YEB are considered unreasonable, leading to various environmental issues which including PM2.5 pollution (Wang et al., 2022; Yuan et al., 2022). First, the prominent issue is the phenomenon of industrial structure convergence leading to excessive resource utilization. Cities of the YEB have not effectively leveraged their respective comparative advantages, resulting in fragmented industrial layout. Also, the lack of an effective division of labor and collaboration among cities has led to numerous low-level and repetitive constructions, causing the total emissions of pollutants to exceed the environmental carrying capacity (Sun et al., 2018). Second, the overall industrial structure of the YEB shows a trend towards heaviness. It is characterized by a high proportion of energy-intensive and pollution-intensive industries (Xu et al., 2018). Third, low resource utilization efficiency and high pollutant emissions are evident in industries. Cities of the YEB exhibit distinct characteristics of a “three lows” structure, with low industrial hierarchy, low value-added products, and low technological levels (Chen et al., 2021). Fourth, industrial enterprises are densely distributed along the YEB, posing notable environmental risks. Existing administrative barriers severely hinder the coordinated development of regional green economies, and there is an overall lack of mechanisms for regional joint control (Liu et al., 2020; Fu et al., 2022). Thus, it is imperative to have a further study on this issue.
Currently, research on industrial agglomeration and PM2.5 pollution has garnered widespread attention. Scholars have mostly assessed the environmental effects from a single research perspective, with a particular industrial agglomeration, such as the textile (Zhao and Lin, 2019), manufacturing (Fang et al., 2020), or service industries (Liu et al., 2021). It is noteworthy that PM2.5 pollution is a cross-boundary issue, and there are complex interactions among different regions (Colmer et al., 2020). Recent studies have increasingly emphasized the presence of spatial effects and incorporated spatial factors into the assessment of environmental effects linked to industrial agglomeration (Liu and Zhang, 2021; He et al., 2022). As investigations into the effects of industrial agglomeration on PM2.5 pollution continues to grow, researchers hold differing perspectives on its influences. Firstly, industrial agglomeration generates a positive impact on reducing PM2.5 pollution (Zeng and Zhao, 2009; Qin et al., 2022). Scholars argued that industrial agglomeration can reduce pollution by enhancing energy efficiency, thereby saving costs in pollution control and consequently mitigating environmental pollution (Zhao and Lin, 2019; Tanaka and Managi, 2021). The production chain tends to be perfected due to the increase of enterprises in the agglomeration area, which is conducive to strengthening the communication and connection among enterprises and reducing the asymmetry of information (Chen et al., 2020). By the input-output correlation among enterprises, the deepening of the industrial division of labor and the improvement of the collaborative efficiency in the whole industrial chain could assist in preventing PM2.5 pollution (Karkalakos, 2010). Moreover, industrial agglomeration can sufficiently diminish energy consumption during commuting through the concentration of labor, which in turn reduces the pollutant emissions levels (Glaeser and Kahn, 2010; Wang et al., 2019). Secondly, industrial agglomeration presents the impact of exacerbating PM2.5 pollution levels (Liu et al., 2017). Current researches suggested that industrial agglomeration elevates the overall pollution control costs, while promoting improvements in production efficiency (Ren et al., 2022). Scale expansion is the most intuitive manifestation caused by industrial agglomeration. It expands the demand for resources in the agglomeration region, triggering excessive resource consumption and centralized emission of pollutants, leading to the intensification of the contradiction between economic progression and environment protection (Li et al., 2023). Industrial agglomeration inevitably results in urban expansion and population growth, and the associated increase in energy consumption and traffic congestion obviously exacerbates air pollution (Lu et al., 2021). In addition, strong linkages among enterprises could unavoidably be accompanied by technological spillovers, but where technological bottlenecks are challenging to overcome, the diffusion of low-quality technologies can deteriorate environmental pollution (Ottaviano et al., 2002; Wang and Luo, 2020). Thirdly, the effect of industrial agglomeration on PM2.5 pollution is contingent upon the combined influences of positive and negative impacts, displaying a non-linear relationship. Specifically, the non-linear relationship refers to the variation in the impact across different developmental stages, industry types, or time spans (Liu and Guo, 2023). These variations are manifested in relationships such as “U-shape” (Wang and Wang, 2019), “inverted U-shape” (Chen et al., 2022), “inverted N-shape” (Song et al., 2023), and “‘inverted S-shape” (Zhang et al., 2022).
The current research still has certain limitations. Firstly, in terms of the research perspective, scholars have predominantly focused on analyzing the impact of agglomeration in a specific industry on environmental pollution. This unidirectional perspective falls short of providing a comprehensive exploration of the three major industries of the national economy, overlooking potential variations in the impact of agglomeration across these industries. Secondly, although existing studies discuss the non-linear influence of industrial agglomeration on PM2.5 pollution, most research opts for provincial-level data, neglecting the heterogeneity among different cities and failing to delve into their diverse non-linear relationships they may exhibit. Finally, in terms of the mechanisms, the existing studies are deficient in explaining the specific mechanisms by which industrial agglomeration affects PM2.5 pollution and lack discussion of factors such as population, technology, and region.
This study explored the effects of three major industrial agglomerations on PM2.5 pollution, and introduced a quadratic term of the secondary industry to investigate the non-linear relationship. We used panel data from 110 prefecture-level cities of the YEB in 2005–2019 to construct a spatial econometric model for empirical analysis, and discussed heterogeneity and mechanisms, aiming to put forward relevant policy recommendations about how industrial agglomeration can contribute to the reduction of PM2.5 pollution.
This study mainly has the following marginal contributions. Firstly, compared with previous studies, the research perspective of this paper is no longer limited to a specific industry but is extended to analyze the three major industries simultaneously. We focused on the agglomeration of the three major industries, investigating the differentiated effects of the primary, secondary, and tertiary agglomerations on PM2.5 pollution, and discussed the non-linear relationship between secondary industrial agglomeration and PM2.5 pollution. The conclusions can serve as valuable references for implementing PM2.5 pollution control strategies across various industrial sectors. Secondly, in terms of data selection, we used data at the prefecture level to ensure that spatial differences are captured more clearly. This study utilized spatial panel data at the prefecture-level to examine disparities in the impacts in upstream, midstream, and downstream cities. We delved into the characteristics of different non-linear influences and agglomeration turning points caused by regional heterogeneity, aiming to offer support for the formulation of region-specific governance policies. Thirdly, regarding mechanism analysis, this study explored the impacts of industrial scale effects, technological spillover effects, and population scale effects. This further expanded the research findings on the impacts of industrial agglomeration on PM2.5 pollution.
The subsequent parts of this paper are laid out as follows. Section 2 exhibits the theoretical frameworks and hypotheses. Section 3 constructs the spatial econometric model and describes the variables. Section 4 shows and discusses the findings derived from the empirical analysis. Section 5 presents the conclusions and policy implications.
2 Theoretical mechanisms and hypotheses
2.1 Direct effect
As a vital spatial organizational form in the progression of the economy, industrial agglomeration is a crucial factor in regional economic and environmental governance (Fu et al., 2022). An efficient and collaborative agglomeration environment serves as a magnet for enterprises across the entire industrial chain, elevating the degree of industrial agglomeration in both local and neighboring regions. Consequently, this dynamic contributes to the spatial spillover effects on the influence of PM2.5 (Ke, 2010; Song et al., 2023). The effect of industrial agglomeration on PM2.5 pollution demonstrates duality, with the overall effect depends on the power contrast between positive and negative influences, exhibiting the characteristics of the environmental Kuznets curve (Kuznets, 1955; Zhang et al., 2023b). The main producers, production factors, production methods, and output products vary among the three major industries. Consequently, the pollutants generated also exhibit differences, leading to distinct environmental impacts for each of the three industries (Zheng et al., 2020). Figure 1 illustrates the associated mechanisms.
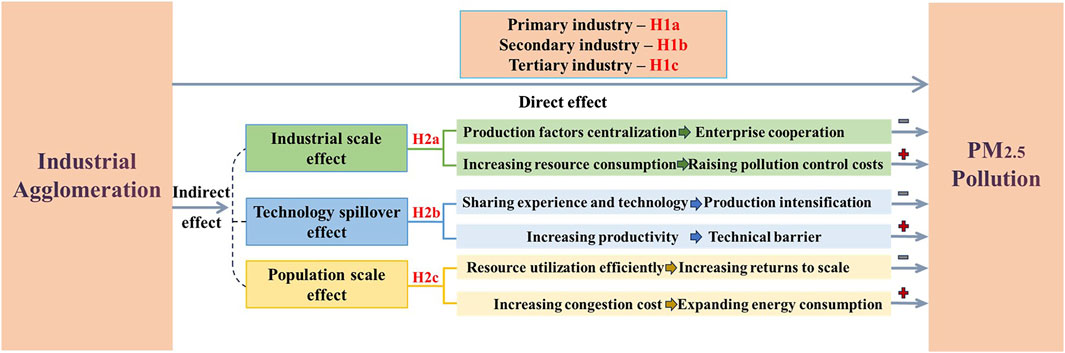
FIGURE 1. Theoretical mechanisms.
For the primary industry, the continuous agglomeration of elemental resources associated with crops and livestock farming within a specific region could drive the development of agriculture towards scale-up operations. It contributes to achieving cost savings at various stages of agricultural product production, enabling agricultural producers to have more economic surplus for the application of modern agricultural machinery and green agricultural production technologies. The application of modern agricultural technology and equipment can markedly enhance agricultural production efficiency, reduce the generation of waste in agricultural production, thereby decreasing the emission of PM2.5 pollution (Giannadaki et al., 2018). For the secondary industry, in the early stages of industrial agglomeration, enterprises seek to expand production scale to gain a competitive advantage, but excessive resource consumption may lead to an increase in PM2.5 pollution (Lu et al., 2021). As industrial agglomeration develops, the core industry attracts the entry of related and complementary enterprises, forming a more comprehensive industrial chain. Specialized division of labor and collaboration among different enterprises along the industrial chain play a crucial role in enhancing operational efficiency within the agglomeration region, reducing resource waste, and correspondingly decreasing pollution emissions (Chen et al., 2020). For the tertiary industry, the agglomeration contributes to steering it towards specialization and diversification, achieving cost savings through shared mechanisms, and enhancing returns through learning mechanisms. The substantial accumulation and flow of knowledge, talent, and information within agglomeration regions of the tertiary industry prominently reduce production costs, search costs, transaction costs, and pollution control costs (Ma et al., 2021). The scale of urbanization is a critical factor limiting the diversified growth of the tertiary industry. Thus, the tertiary industrial agglomeration may lead to a mismatch in the urban-industrial relationship (He et al., 2022).
Derived from the preceding analysis, our study proposed hypothesis group 1.
H1a. The primary industrial agglomeration shows a negative correlation with PM2.5 pollution, accompanied by spatial spillover effects.
H1b. The secondary industrial agglomeration exhibits the ‘inverted U-shape’ relationship with PM2.5 pollution, accompanied by spatial spillover effects.
H1c. The tertiary industrial agglomeration shows a negative correlation with PM2.5 pollution, accompanied by spatial spillover effects.
2.2 Indirect effect
The indirect effects of industrial agglomeration on PM2.5 pollution can be discussed in terms of scale expansion, technology spillover, and population.
The scale expansion effect on PM2.5 pollution can be divided into two sides. On one hand, industrial agglomeration achieves centralization and scale-up of production factors such as labor and capital. These serve to strengthen collaborative division of labor among enterprises and comprehensive pollutant treatment, ultimately leading to a reduction in PM2.5 pollution. In accordance with the economies of scale theory, industrial agglomeration enables enterprises to actualize internal scale benefits, thereby augmenting their operational efficiency (Karkalakos, 2010). By sharing infrastructure such as roads and factories, industrial agglomeration generates spatial spillover effects, contributing to the mitigation of PM2.5 pollution resulting from the production processes of enterprises in local and neighboring cities (Andreoni and Levinson, 2001). Furthermore, industrial agglomeration engenders a scale effect in the governance of PM2.5 pollution, by optimizing integrated pollution treatment (Copeland and Taylor, 2004). On the other hand, the process of industrial agglomeration through scale expansion leads to a continuous increase in pollution control costs. Enterprises in different regions could engage in vicious competition such as resource plunder. Simultaneously, there is a substantial ascent in the overall resource input required by the entire industry, thereby causing high PM2.5 pollution (Lu et al., 2021).
The influence of technological spillover effect in industrial agglomeration is not explicit, and its effects on PM2.5 pollution exhibit varying impacts. From one angle, by promoting knowledge spillover and the dissemination of new technologies in the production process, industrial agglomeration reduces PM2.5 pollution (Grossman and Krueger, 1995). Industrial agglomeration has a positive driving impact on innovation within enterprises, contributing to increased resource efficiency and pollution control abilities (Aarstad et al., 2016). Externally, it fosters the exchange and dissemination of knowledge and technology, propelling enterprises in local and neighboring cities to adopt advanced emission reduction technologies (Feldman, 1999; Huang and Lv, 2021). The technological spillover in industries within a collaborative innovation environment is a crucial driver of industrial agglomeration. When an enterprise in the production chain within the agglomeration region carries out technological innovations of production or pollution reduction, it stimulates surrounding relevant enterprises to imitate and learn in the neighboring region. This process, accompanied by the diffusion of various clean technologies, consequently inhibits overall pollutant emissions (Krugman, 1991; Ma et al., 2021). From another angle, industrial agglomeration enhances the labor productivity of the industry through technological progress, leading to an expansion of production scale. Simultaneously, it creates ‘barriers’ in production processes and clean technologies, thereby impeding improvements in PM2.5 pollution (Ke, 2010). Imperfect market-oriented institutions, such as a lack of property rights protection, could constrain collaborative efforts in green technology among enterprises and form technological barriers. Due to the existence of these barriers, industrial agglomeration fails to promote the dissemination of knowledge and technology among industries and the enhancement of regional pollution reduction capabilities (Zeng et al., 2021).
Population factors not only serve as a tremendous driving force for regional economic development but also constitute a prerequisite for industrial agglomeration. Industrial agglomeration, based on the growth of population scale, exerts both positive and negative impacts on PM2.5 pollution. On one hand, industrial agglomeration is concomitated by the growth of population scale, facilitates the sharing and utilization of resources and achieves increasing returns to scale in environmental governance, subsequently promoting a decline in PM2.5 pollution (Begum et al., 2015). On the other hand, the increase in population size is typically accompanied by a rise in energy demand. It could lead to increased extraction and utilization of energy resources, as well as the associated emission of air pollutants, thereby generating adverse effects on neighboring cities (Qiang et al., 2021). Due to the limited carrying capacity of environmental resources for the population, industrial agglomeration coupled with the excessive expansion of the population scale, leads to a rise in congestion costs, thereby contributing to an elevation in PM2.5 pollution (Dong et al., 2018).
Taking into account the analysis of mechanisms, our study proposed hypothesis group 2.
H2a. Industrial agglomeration exerts an industrial scale effect on PM2.5 pollution.
H2b. Industrial agglomeration exerts a technology spillover effect on PM2.5 pollution.
H2c. Industrial agglomeration exerts a population scale effect on PM2.5 pollution.
3 Spatiotemporal evolution trends
3.1 Measurement of industrial agglomeration level
The location quotient is employed to evaluate industrial agglomeration level in a specific region. In contrast to various quantitative methods used in the past to measure industrial agglomeration, the location quotient has the ability to eliminate differences in scale between regions, providing a more objective reflection of the spatial distribution (Miller et al., 1991). The calculation formula for the location quotient is
3.2 Spatiotemporal characteristic of industrial agglomeration level
Figure 2 demonstrates the time trend of the average levels of the three major industries agglomeration in the YEB from 2005 to 2019, using location quotient as a quantitative indicator.
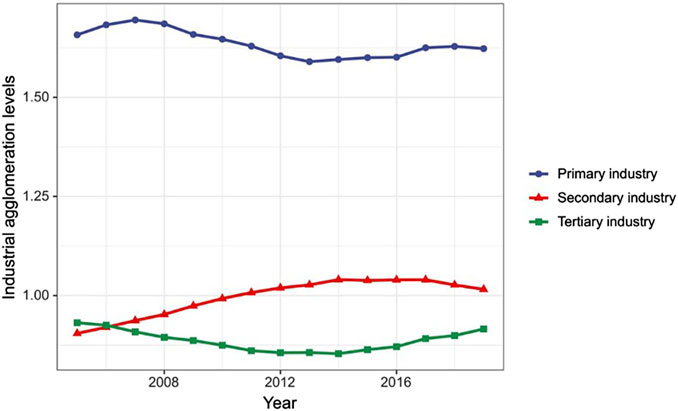
FIGURE 2. The average levels of industrial agglomeration of three major industries in the YEB in 2005–2019.
The primary industrial agglomeration level exhibits a trend of initial decline followed by an upward. It displays a rapid decline trend in 2007–2013. As the process of industrialization continues to advance, some rural arable land has been left fallow, leading to a steady decline in the primary industrial agglomeration level. After 2014, China has taken the application of the poverty alleviation and rural revitalization strategy as the opportunity to adopt various policies. It has vigorously promoted the large-scale operation of agriculture by supporting new agricultural management bodies such as family farms, cooperatives and dragon-head enterprises. Agriculture has expanded to the three major industries through the whole industrial chain, raising the industrial agglomeration level. It is worth mentioning that the primary industrial agglomeration level is generally higher than the secondary and tertiary industries. This is because we employ the location quotients to describe the industrial agglomeration levels, where a higher numerical value indicates a higher degree of agglomeration. Due to the intensive land resources required for agricultural development, the unique characteristics of the primary industrial production determine that its agglomeration level is higher than other industries.
The secondary industrial agglomeration level gradually increased in 2005–2014, and has stabilized since 2015. According to the regional industrial structure evolution theory (Capello, 2015), the industrial layout of a region tends to exhibit a “highly industrialized structure law.” The three major industries evolve from the predominance of the primary industry to the predominance of the secondary and tertiary industries in succession. The YEB also follows this law. The period in 2005–2014 was a time of rapid industrial development in the YEB. Guided by the strategy of intensive and large-scale development, the secondary industrial agglomeration level grew rapidly year by year. After 2015, as the transition of economic development from high-speed to high-quality, government began to emphasize ecological environmental protection, improve resource utilization efficiency, and strengthen environmental regulations, leading to a slowdown in the growth of the secondary industrial agglomeration level and maintaining relatively small fluctuations.
The tertiary industrial agglomeration level also exhibits a trend of initially declining followed by rising. From 2005 to 2014, due to the dominance of investment and exports in the “three leading drivers,” the industrial structure was largely dominated by the secondary industry, leading to a relatively low agglomeration level of the tertiary industry, and even a gradual decline. As urbanization continued to advance, the tertiary industry gradually surpassed the traditional secondary industry to transform into the pillar of economy. With the increasing pressure on resources and the environment in the YEB, the cities along the river urgently need to transition from the extensive development model reliant on traditional industries. Therefore, driving the agglomeration and progress of the tertiary industry has become the inevitable choice. Since 2015, the tertiary industrial agglomeration level has been gradually increasing, gradually becoming a key driver for achieving quality-driven economic growth in the YEB.
Figures 3–5 present the spatial characteristic of industrial agglomeration in the three major industries in prefecture-level cities of the YEB in 2005–2019 by using ArcGIS, respectively.
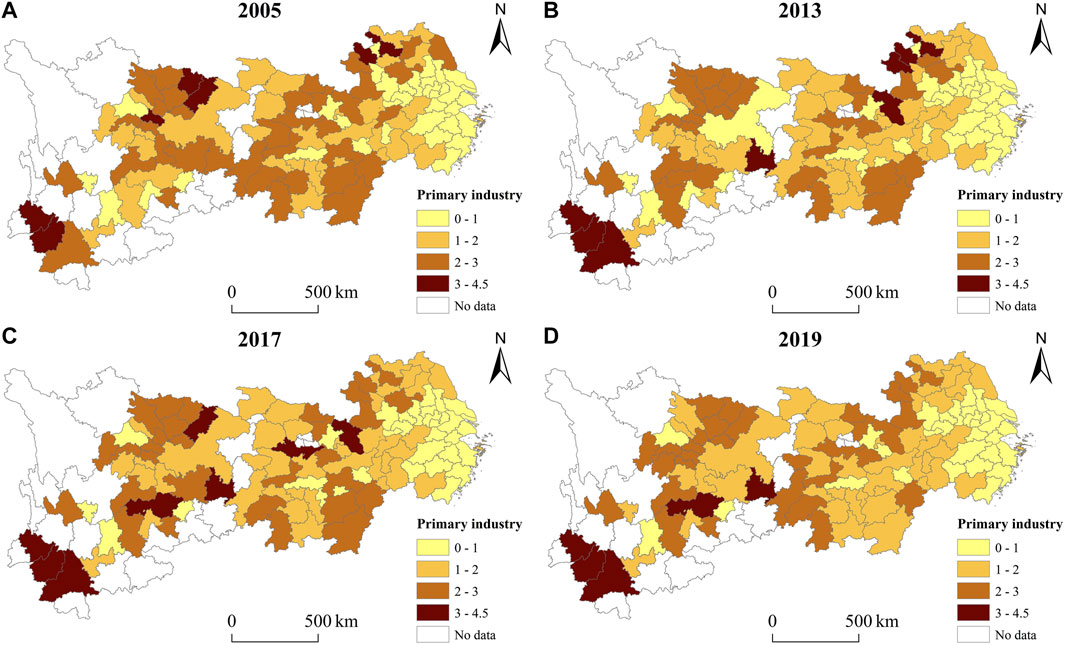
FIGURE 3. The FAGG in cities of the YEB in 2005 (A), 2013 (B), 2017 (C), and 2019 (D).
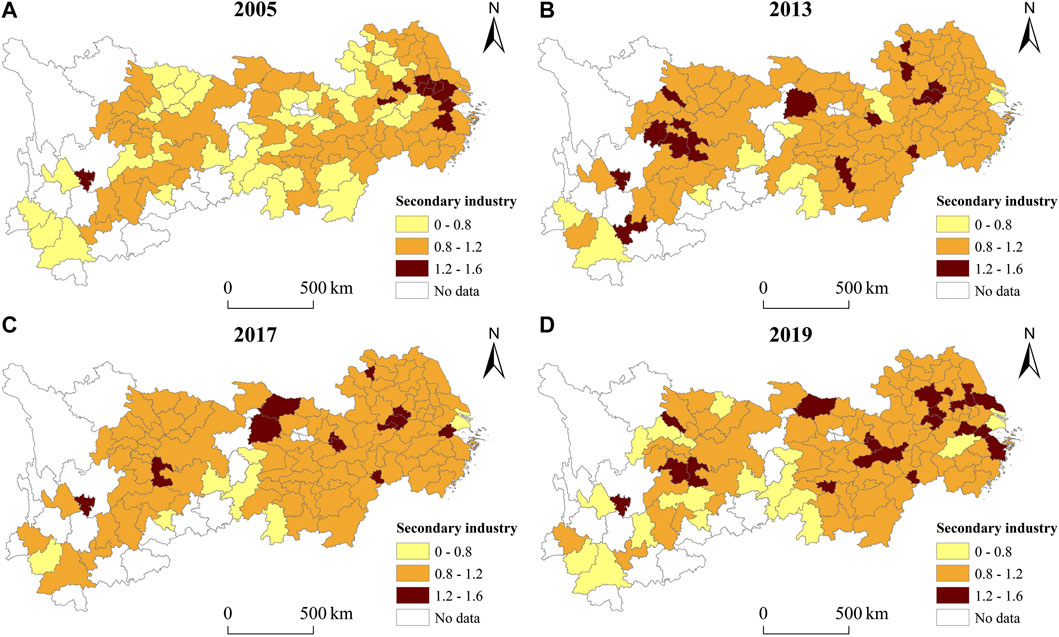
FIGURE 4. The SAGG in cities of the YEB in 2005 (A), 2013 (B), 2017 (C), and 2019 (D).
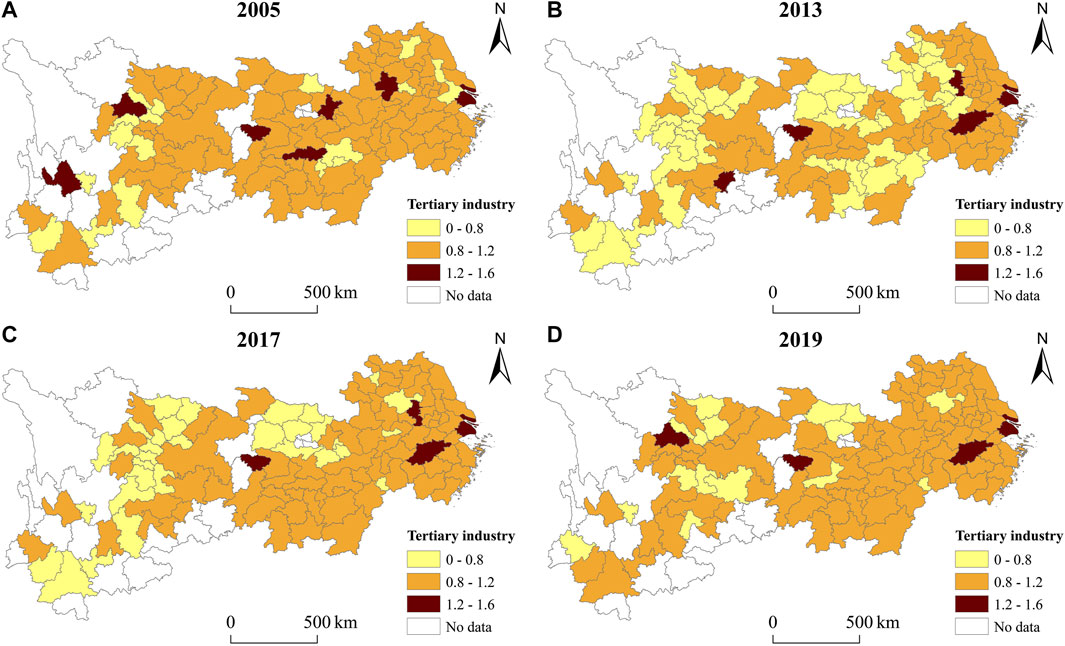
FIGURE 5. The TAGG in cities of the YEB in 2005 (A), 2013 (B), 2017 (C), and 2019 (D).
The spatial pattern of the primary industrial agglomeration level exhibits the “high-value in the upstream and midstream cities, low-value in the downstream cities” pattern. The upstream and midstream cities make full use of their geographical resources and location advantages, utilizing the excellent conditions brought by the Three Gorges Dam, Chengdu Plain, and Jianghan Plain to develop the primary industry through large-scale and modern agricultural production methods. In the downstream cities, urban areas continue to expand, leading to encroachment on agricultural land. It has resulted in a growing contradiction between population and land resources. While the secondary and tertiary industries in the downstream cities have developed rapidly, the agricultural competitiveness is relatively weak, causing a low primary industrial agglomeration level.
Regarding the secondary industry, the spatial pattern of the agglomeration level shows a characteristic of “high-value in the midstream and downstream cities, low-value in the upstream region.” The midstream and downstream cities are the forefront of China’s opening-up to the outside world. They possess developed industries, relatively mature production methods, and complete transportation network and infrastructure, resulting in a high industrial agglomeration level. The upstream cities are located in the western region of China, with a weak economic foundation and backward production techniques. The industrialization process in this region lags behind that of the midstream and downstream cities, leading to a low secondary industrial agglomeration level.
The spatial pattern of the tertiary industrial agglomeration level also demonstrates the “high-value in the midstream and downstream cities, low-value in the upstream cities” pattern. The downstream cities exist numerous modern international port cities, which gives this region strong capabilities for providing services to foreign countries. Additionally, due to the strong economic power of downstream cities, the financial industry, commercial services, education, culture, sports, and entertainment industries are all advancing in tandem. The downstream cities are well-built of comprehensive services, with a high tertiary industrial agglomeration level, as well as a radiation and driving influence on the midstream cities. The overall economic advancement pace in the upstream cities is comparatively slow, and the core competitiveness of the tertiary industry is weak, leading to low tertiary industrial agglomeration levels.
3.3 Spatial correlation test
The global Moran’s I index and the local Moran’s I scatterplot can be used to determine that the three major industries agglomeration and PM2.5 pollution in cities of the YEB exhibit positive spatial autocorrelation and agglomeration effects.
This study conducted global Moran’s I index tests on the three major industries agglomeration and PM2.5 pollution in cities of the YEB (Table 1). We used the adjacency matrix to establish the spatial weight matrix Wb. Specifically, the adjacency matrix indicates that if city i and city j have a common boundary, then Wij = 1; conversely, Wij = 0. In 2005-2019, the global Moran’s I indices for PM2.5 pollution and the three major industries agglomeration levels were both positive, which notes that the PM2.5 pollution and industrial agglomeration in cities of the YEB present significant positive spatial autocorrelation. Figure 6 displays the local Moran’s I scatterplot for PM2.5 pollution in 2005, 2013, 2017, and 2019. PM2.5 pollution in cities of the YEB exhibits certain clustering in spatial distribution, High-High(H-H) and Low-Low(L-L) agglomeration. The local Moran’s I index elevated from 0.747 in 2005 to 0.764 in 2019, indicating an increase in the number of cities with H-H and L-L agglomeration patterns.
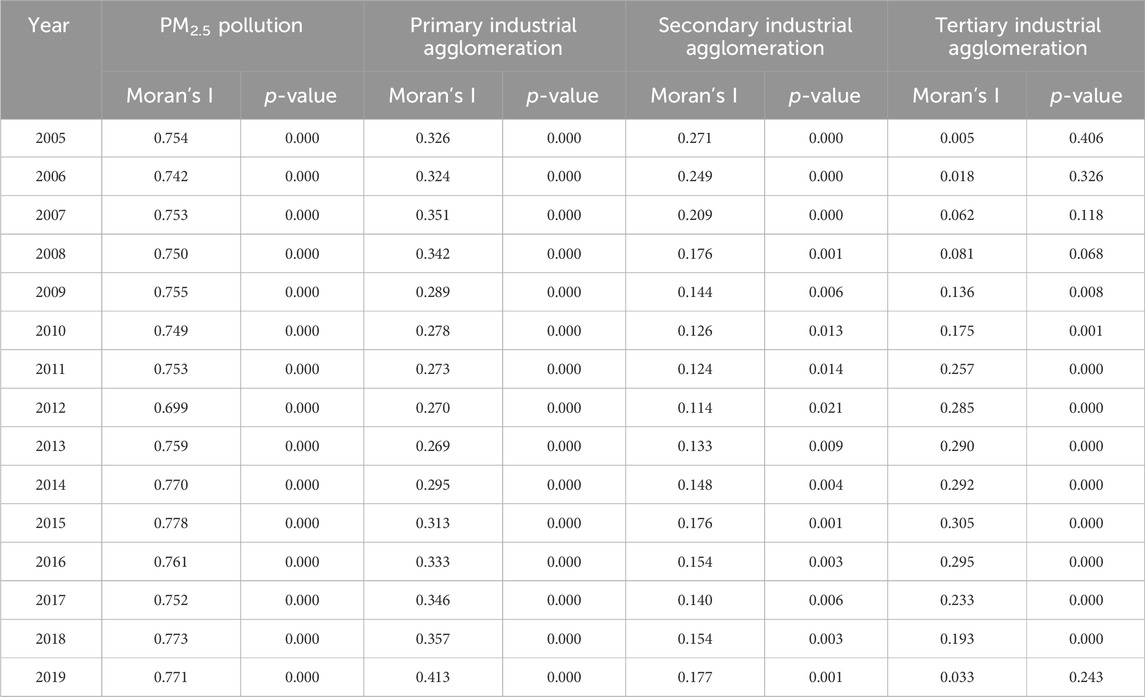
TABLE 1. The three major industries agglomeration and PM2.5 pollution in cities of the YEB, 2005–2019.
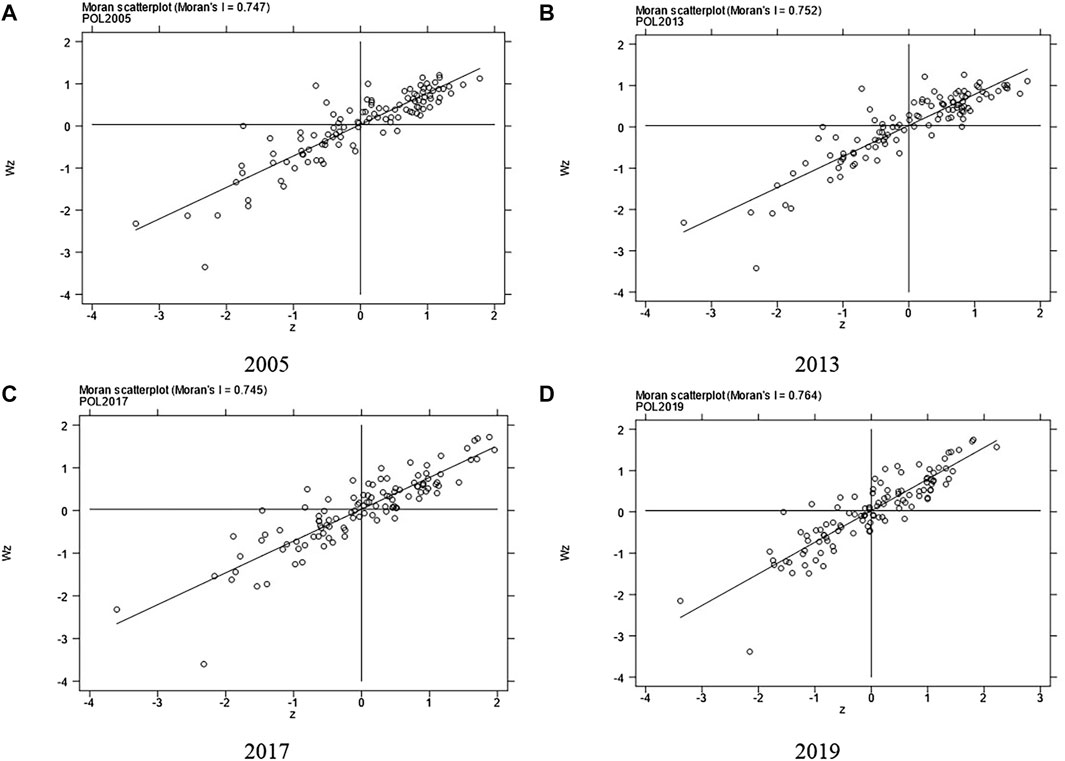
FIGURE 6. Moran’s I scatterplot of PM2.5 pollution in 2005 (A), 2013 (B), 2017 (C), and 2019 (D).
4 Model, variables, and data
4.1 Spatial econometric model
Subject to passing the spatial correlation test, we used a spatial econometric model. In draw to choose adaptive model form, we have done LM-lag and LM-error test. Table 2 shows the results for form selection. We chose the Spatial Durbin Model (SDM) because the LM tests all notably passed. Additionally, LR and Wald tests both passed significantly, indicating that SDM does not degenerate into SEM and SAR (Lesage and Pace, 2009). The coefficient of Hausman test is significant, suggesting that choosing the fixed-effects model is more reasonable.
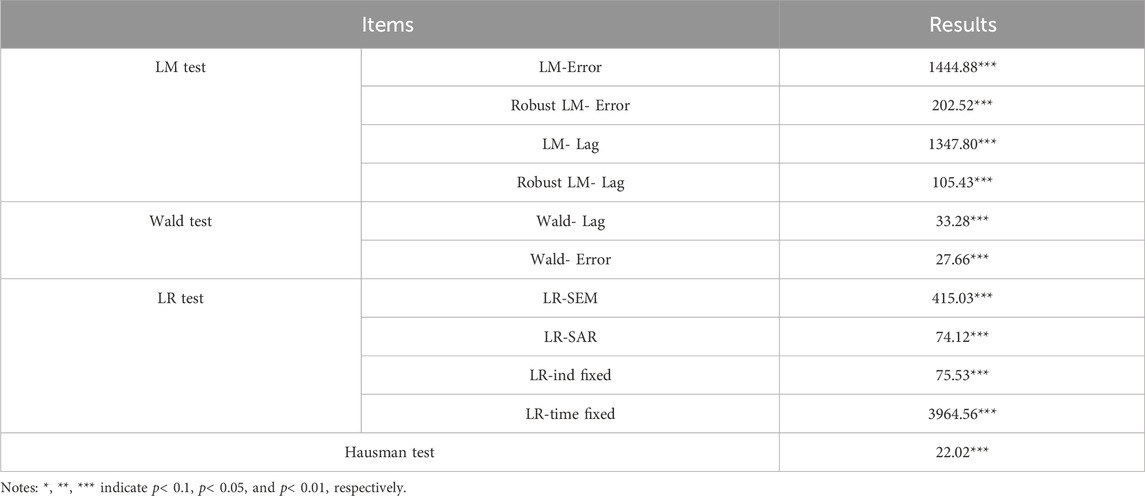
TABLE 2. Statistical tests results for form selection.
To test hypothesis 1, we construct the SDM with spatiotemporal fixed-effects as shown in Eq. 1.
Where i and j is different cities, t is time; lnPM is the PM2.5 pollution concentration; ρ is the spatial autoregressive coefficient; w = ωij is the spatial weight matrix; AGG is the industrial agglomeration level; SAGG2 is the squared term of the secondary industrial agglomeration level; γ is the regression coefficient; Z are control variables; δ is the spatial coefficient; γ0 is the constant, ui is the city fixed effect, vt is the time fixed effect; εit is the random error term.
To verify the hypothesis group 2, we constructed models for mechanism analysis, referring to the methodologies presented by Li and Wang (2022) and Yao et al. (2023). In Section 2.2, we discussed in detail the impacts of scale expansion, technology spillover, and population on PM2.5 at the theoretical level. Moreover, empirical verification is conducted in Eq. 1. Therefore, this paper further explored the influences of the three major industrial agglomerations on the mechanism variables (ECO, TEC, and POP), aiming to clarify the mechanism of industrial agglomerations affecting PM2.5. The mechanism analysis models are presented in Eqs 2–4.
Where Z1, Z2, and Z3 denote the groups of control variables when ECO, TEC, and POP are used as explained variables, respectively. Z1 includes TEC, POP, IND, OD, EE; Z2 includes ECO, POP, IND, OD, EE; Z3 includes ECO, TEC, IND, OD, EE.
4.2 Variables
4.2.1 Explained variables
PM2.5 pollution (lnPM): The natural logarithm of the annual average PM2.5 concentration is used to represent PM2.5 pollution.
4.2.2 Core explanatory variables
The industrial agglomeration level (AGG): This study selects the added value of primary industry (FAGG), secondary industry (SAGG), and tertiary industry (TAGG) of the cities in the YEB, and their corresponding location quotients are calculated respectively.
There could be a non-linear relationship between secondary industrial agglomeration and PM2.5 pollution, and researchers usually add a quadratic term representing the secondary industry to explore the changes in the impact on PM2.5 pollution before and after the inflection point of agglomeration (Chen et al., 2020). Therefore, this study introduces the square of secondary industrial agglomeration level (SAGG2) into the model to explore this possible non-linear relationship.
4.2.3 Mechanism variables
(1) Economic development level (ECO): This study uses the natural logarithm of GDP per capita to estimate the economic development level. All the GDP per capita were calculated with 2005 as the base period. It is generally recognized by researchers that economic development is pivotal in PM2.5 pollution (Karkalakos, 2010).
(2) Population size (POP): The natural logarithm of the year-end total population in a city as an indicator for measuring population size. Industrial agglomeration contributes to attracting the growth of the population scale, creating conditions for resource sharing and environmental governance. Contrarily, excessive population growth, which may lead to increased energy consumption and rising congestion costs, exacerbates pollution (Zhou et al., 2019).
(3) Technological development level (TEC): The natural logarithm of the annual amounts of granted invention patents is used as a measure of the technological development level. Invention patents reflect the technological innovation level in the region. Researchers usually believe that improvements in production technology, including environmental protection technology, can reduce pollution emissions in the production process. However, when production technologies are improved in the direction of increased productivity and scale-up, they may also result in increased levels of air pollutant emissions (Krugman, 1991).
4.2.4 Control variables
(1) Industrial structure (IND): This study uses the ratio of value added of the tertiary industry in GDP to quantify the industrial structure. The tertiary industry produces relatively low levels of pollution, and a rise in the ratio of the tertiary industry in the economy can reduce the PM2.5 pollution (Muhammad et al., 2022).
(2) Opening-up degree (OD): We use the ratio of actual amount of utilized foreign capital in GDP to measure opening-up degree. When a region increases its opening-up degree to foreign involvement, it attracts foreign investment, promoting local business development and increasing production scale within the region. Yamashita et al. (2014) pointed out that the elevation in foreign investment intensifies the agglomeration of related industries. Al-Mulali et al. (2015) argued that opening-up introduces high-level investment, effectively improving environmental pollution.
(3) Energy efficiency (EE): The ratio of social electricity consumption to GDP is used to measure energy efficiency. Energy utilization patterns dominated by traditional fossil fuels could exacerbate PM2.5 pollution levels (Gani, 2021).
4.3 Data
We selected the data from 110 prefecture-level cities of the YEB in 2005–2019. After entering the 21st century, the Chinese economy can be divided into three distinct phases, namely, the high-speed growth stage, the structural adjustment stage, and the high-quality development stage (Hu et al., 2021; Zhou et al., 2021). Since the formal implementation of the Kyoto Protocol internationally in 2005, coupled with the decision of the Chinese State Council to strengthen environmental protection in line with the Scientific Outlook on Development, these policies signify the incorporation of air pollution control into considerations of economic development (Van Vuuren et al., 2006). Some studies have explored the effectiveness of these policies (Cirman et al., 2009). For instance, Maamoun (2019) argued that emissions of pollutants would increase by 7% in a ‘no Kyoto’ scenario. Consequently, we have chosen 2005 as the starting point for this paper. To eliminate the potential impact of the COVID-19 pandemic, the data after 2020 have not been included. In summary, this paper selected 2005–2019 as the observation period. The annual average PM2.5 concentration comes from the Atmospheric Composition Analysis Group of WUSTL. Other data are from the China city Statistical Yearbook, the statistical yearbooks of provinces and cities along the YEB, and the China Research Data Service Platform (CNRDS). The missing data are supplemented by linear interpolation. Table 3 is the descriptive statistics.
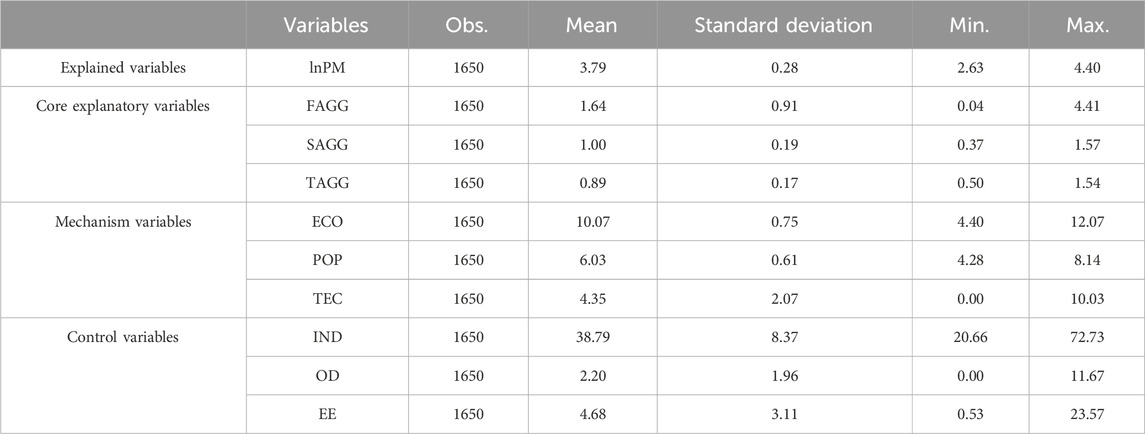
TABLE 3. Descriptive statistics.
5 Results and discussion
5.1 Regression results
This study carries out a partial differential decomposition of the results of the regression analysis, which decomposes the total effect of the SDM into direct and indirect effects (Lesage and Pace, 2009). This method can sufficiently distinguish the different effects in local and neighboring cities. Columns (1)–(3) of Table 4 show the direct, indirect and total effects of industrial agglomeration on PM2.5 pollution in the YEB, respectively. Figure 7 shows the comparison of the coefficients of each effect by visualization method.
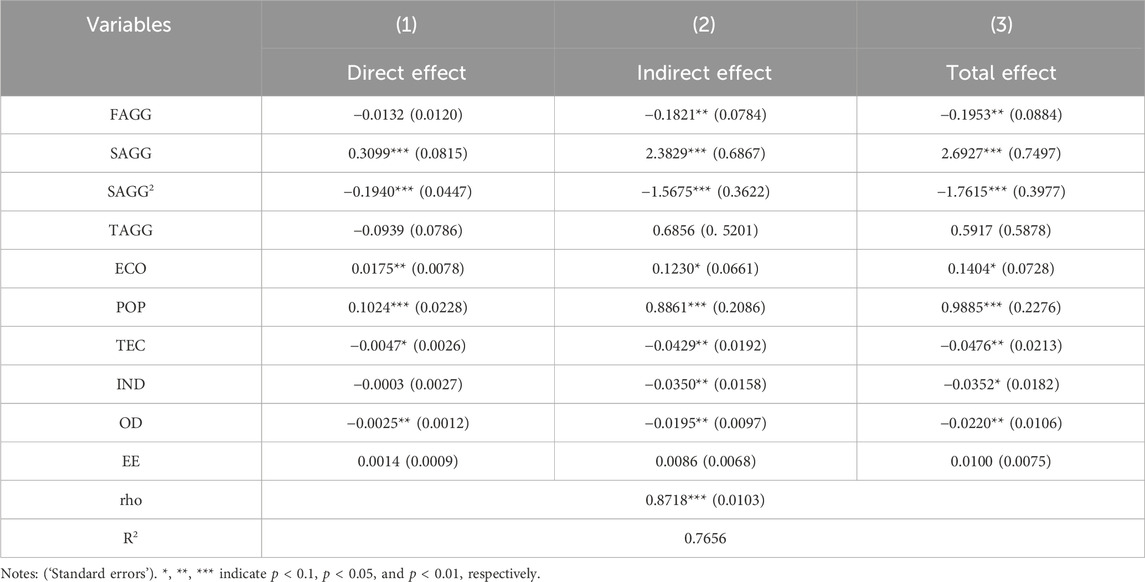
TABLE 4. Result of benchmark regression.
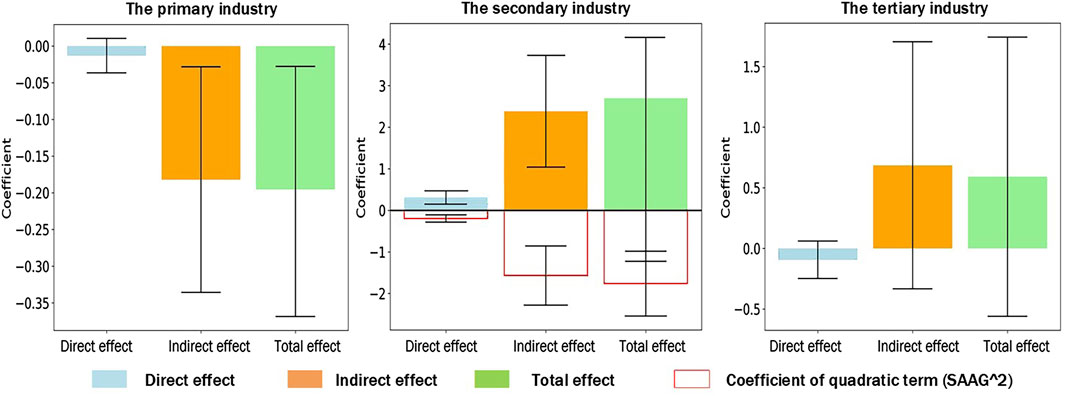
FIGURE 7. Direct, indirect, and total effects of industrial agglomeration on PM2.5 pollution in the YEB.
The primary industrial agglomeration can reduce PM2.5 pollution and presents a negative spatial spillover effect, validating the hypothesis H1a. With the implementation of the rural revitalization strategy by the country and local governments in the YEB, the level of intensive and large-scale production in the primary industry is gradually increasing. It has formed a number of distinctive agricultural clusters, with a more optimized industrial layout and a more scientific fertilizer application on farmland, which in turn promotes a continuous decline in PM2.5 pollution.
The secondary industrial agglomeration level exhibits an “inverted U-shape” relationship with PM2.5 pollution, strongly confirming the hypothesis H1b, which is also supported by EKC theory. This non-linear relationship indicates that local and neighboring industrial agglomerations initially exacerbate and subsequently alleviate local PM2.5 pollution. In the early stages of industrialization, the negative impacts of industrial agglomeration dominate, contributing to a rise in PM2.5 pollution. Specifically, during the initial phases of industrialization, pollution-intensive industries concentrated in agglomeration regions, leading to a rapid rise in PM2.5 pollution. These pollution disperse with the air into neighboring regions, resulting in spatial spillover of PM2.5 pollution. As industrialization progresses, the positive impacts of industrial agglomeration gradually take precedence. There are gradual elevations in both the production efficiency of enterprises and the extent of infrastructure sharing. Simultaneously, the efficiency in treating pollution is enhanced, contributing to a reduction in the overall emission PM2.5 pollution.
For the tertiary industrial agglomeration, the direct effect coefficient on PM2.5 pollution is −0.0939 and the indirect effect coefficient is 0.6856, which does not support the hypothesis H1c. The results are supported by the findings of Li et al. (2021) and Wang et al. (2023). The reason for this phenomenon could be stem from the fact that the current tertiary industrial agglomeration mainly occurs in the low-end service industry, and the local government tends to utilize the regional resource endowment to focus on the layout of advantageous industries. Due to the lack of scientific guidance and supervision, a monopolistic market structure is easily formed. It diminishes the efficiency of resource allocation in different cities, making it difficult for enterprises to reach a reciprocal cooperation, resulting in a waste of resources and aggravating PM2.5 pollution in local and neighboring cities. Additionally, in comparison to the secondary industry, the tertiary industry exhibits lower fossil fuel consumption but demands higher levels of urbanization and labor resources. The tertiary industrial agglomeration results in prominent geographical concentration of enterprises, accompanied by a rise in production and consumption activities associated with urban environmental pollution. The mismatch between urban transportation facilities and population density leads to a substantial increase in congestion costs, which has a negative effect on controlling PM2.5 pollution. According to the EKC theory, the transition of the tertiary industry towards high-end development in the future is expected to be more conducive to the advancement of a green economy, culminating in environmentally beneficial influences.
For control variables, the economic development level shows positive influence on PM2.5 pollution. Population growth significantly contributes to an elevation in PM2.5 pollution. The rapid progression of industrialization and urbanization, along with a surge in population density, leads to a substantial rise in the demand for consumables such as vehicles and solid fuels, exacerbating PM2.5 pollution. The optimization of industrial structure contributes to a reduction in PM2.5 pollution. The tertiary industry, firmly positioned as the largest sector in the national economy, serves as both a catalyst for economic and a mitigating factor in lowering PM2.5 pollution. Technological progress plays a crucial role in significantly reducing PM2.5 pollution. The rapid development of technology-intensive industries, coupled with a continual increase in investment of environmental protection equipment and measures in the industrial sector, constitutes key factors in improving PM2.5 pollution. The elevation of the opening-up degree leads to a marked decrease in PM2.5 pollution. It is attributed to the promotion of economic growth and environmental improvement by foreign direct investment in a favorable institutional environment and policy-driven context. In recent years, China has vigorously promoted high-level openness to foreign country, coupled with regulatory reforms through initiatives such as the streamline administration, delegate power, strengthen regulation, and improve services, has optimized the commercial environment. These measures not only attract higher quality foreign investment but also contribute to a reduction in PM2.5 pollution, through greener production practices and advanced management. Currently, China heavily relies on thermal power generation to meet the electricity demand, despite the gradually increasing proportion of new energy generation, which still remains in a supplementary role within the total power generation (Chen et al., 2023). The excessive reliance on thermal power generation, resulting in an increase in electricity consumption, could contribute to elevated PM2.5 pollution levels. To address this issue, there is an urgent need for continuous optimization of the power generation structure.
We conducted the robustness test by using the economic-geographic distance matrix
dij is the geographic distance between city i and j, pGDPi is the GDP per capita of city i.
Table 5 presents the results of the robustness tests. Through comparative analysis, the effects of each variable are consistent with the benchmark regression, so the original regression results are considered robust. The indirect effect of industrial agglomeration on PM2.5 pollution is numerically larger, and in the subsequent analysis we explore whether regional differences, technology spillover, population size and other factors play an indirect role through heterogeneity analysis and mechanism analysis.
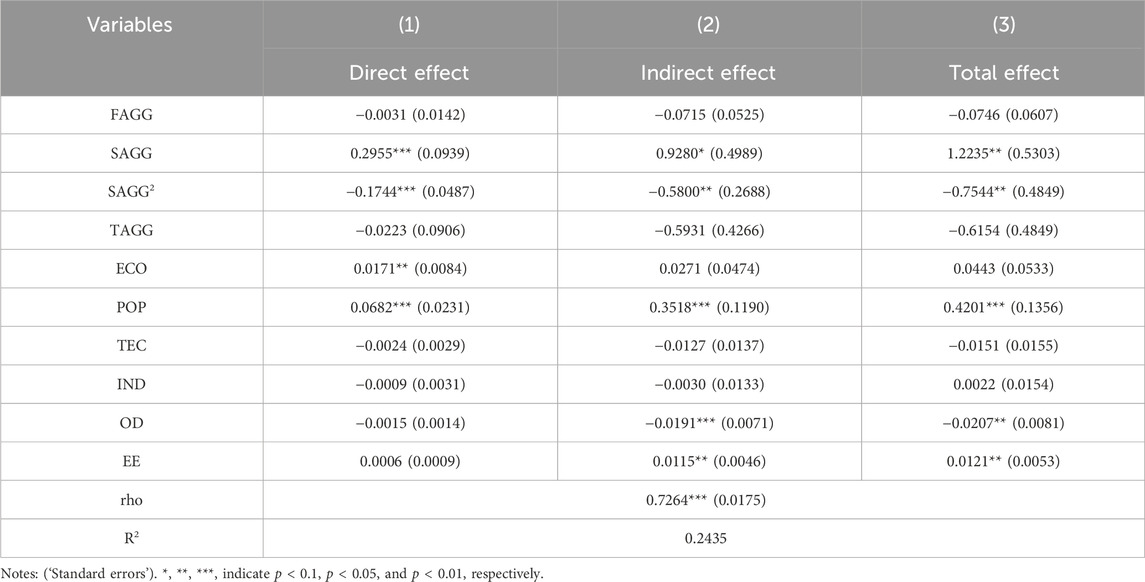
TABLE 5. Robustness test.
5.2 Heterogeneous analysis
The YEB spans eastern, central, and western regions in China, with large discrepancies in industrial agglomeration levels and PM2.5 pollution in the upstream, midstream and downstream cities. Table 6 lists the regional heterogeneity analysis of the effect of the secondary industrial agglomeration on PM2.5 pollution.
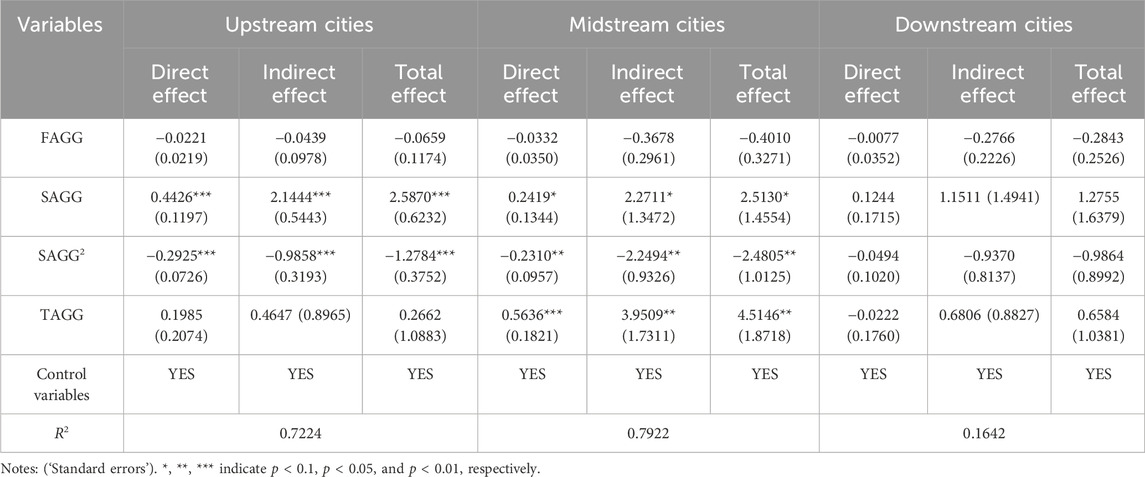
TABLE 6. Heterogeneity analysis.
The effect of the secondary industrial agglomeration on PM2.5 pollution in the upstream, midstream and downstream cities exhibit varying degree of ‘inverted U-shape’ curve (Figure 8). Before reaching the inflection point of agglomeration, PM2.5 pollution tends to intensify with the rising agglomeration level. During this period, cities are in the stage of economic accumulation, with a low proportion of investment in environmental protection and new energy. Industries such as manufacturing and construction, which have a significant environmental footprint, exert the negative influence on PM2.5 pollution. Once the agglomeration level reaches the inflection point of agglomeration, the increasing agglomeration level has a restraining influence on PM2.5 pollution. At this stage, cities exhibit a higher economic development level, accompanied by increased emphasis on environmental protection and sustainable development. There is a rise in technological investment for green development, and policies for environmental protection are strengthened, leading to a remarkable improvement in PM2.5 pollution control efficiency. With the ascent of agglomeration levels, the midstream cities are the first to reach the inflection point of agglomeration, followed by the downstream and upstream cities. Additionally, the intercept value of the influence curve for the midstream cities is the highest. It is attributed to the fact that the midstream cities have the highest proportion of added value in the secondary industry relative to the total added value of the three major industries, resulting in its maximal impact on PM2.5 pollution.
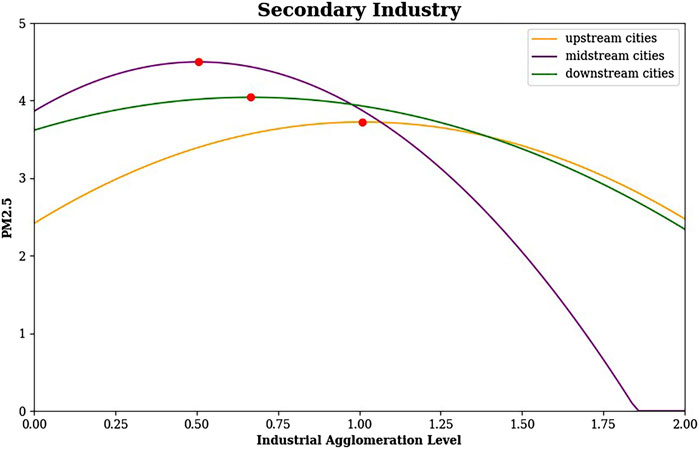
FIGURE 8. “Inverted U-shape” curve of the secondary industrial agglomeration on PM2.5 pollution in the upstream, midstream, and downstream cities of the YEB.
The curve in the midstream cities exhibits the greatest degree of curvature, and the corresponding PM2.5 level at the inflection point of agglomeration is the highest, with the coefficient of SAGG is 2.5130 and SAGG2 is −2.4805. The midstream cities, with Wuhan, Changsha, and Nanchang as their core, have formed a closely integrated development pattern. Guided by policies such as the Strategy for the Rise of Central China, the industrial development scale in this region has rapidly expanded, accommodating the transfer of many high-pollution enterprises from the downstream regions. The secondary industry in the midstream cities is dominated by heavy industry, with an obvious proportion of high-energy manufacturing, constituting a critical factor in regional environmental pollution. Elevating the secondary industrial agglomeration level in the midstream cities not only sustains the demand for industrial products but also effectively promotes a reduction in PM2.5 pollution. In the upstream cities, where the curvature of the influence curve is minimal, the PM2.5 level corresponding to the inflection point of agglomeration is relatively low. The upstream cities display a relatively weak economic development foundation and lower technological proficiency. The core cities of Chengdu and Chongqing mainly specialize in the production and processing of original products. The scale of the secondary industry in this region is comparatively small, leading to a limited contribution on PM2.5 pollution. The downstream cities, including Shanghai, Nanjing, Suzhou, and Hangzhou, have moved beyond the pursuit of rapid economic growth, gradually transitioning towards a direction of high-end development and increased efficiency. Leveraging its advantages in technology, talent, and funding, the downstream cities are well-positioned to foster advanced production processes, contributing to maintaining a low PM2.5 pollution. During the period of 2005–2019, the average value of the SAGG in the upstream, midstream, and downstream cities of the YEB were 0.9675, 0.9915, 1.0217, and the agglomeration level in the downstream cities is noticeably higher than that in the upstream and midstream cities. The total effect in the upstream cities is currently experiencing a period of diminishing marginal impacts, unable to significantly mitigate PM2.5 pollution, which aligns with the conclusions drawn in the study by Liu and Zhang (2021).
5.3 Mechanism analysis
We have verified that ECO, TEC and POP exhibit significant associations with PM2.5 in Table 4. According to Table 7, it can be observed that an increase in the industrial agglomeration level presents varying degrees of impact on scale expansion, technological innovation, and population size.
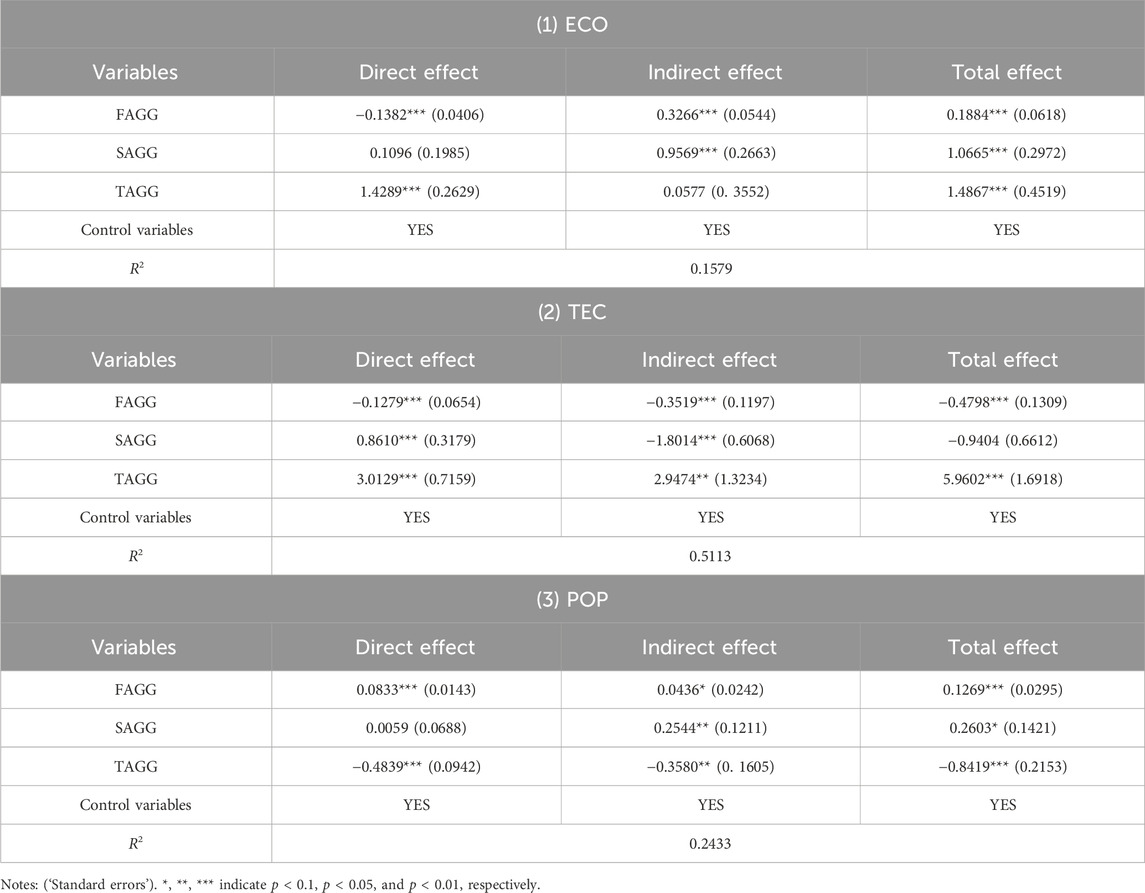
TABLE 7. Mechanism analysis.
Industrial agglomeration promotes the concentrated distribution of affiliated enterprises within the industrial chain, reducing transportation costs and fostering conditions for collaborative development (Andreoni and Levinson, 2001; Wang and Wang, 2019). Numerous studies have verified the impact of scale expansion on PM2.5 (Fang et al., 2020; Yao et al., 2023), and this paper subsequently reported on the relationship between the three major industrial agglomeration and scale expansion. The direct effect coefficient of FAGG is −0.1382, and the indirect effect is 0.3266. The results indicated that the primary industrial agglomeration does not promote local economic scale expansion, while it has a positive effect on the neighboring cities. For the secondary and tertiary industries, as the level of agglomeration increases, it not only facilitates the local economic scale expansion but also exerts a positive impact on neighboring cities. The industrial and service sectors can rely on the regional convenience brought about by agglomeration to effectively carry out detailed division of labor and collaborative cooperation, generating economies of scale. By comparing the regression coefficients, we found that the coefficient for TAGG is the largest, suggesting that the tertiary industry presents the most prominent influence on the economic scale expansion (β = 0.1884, p = 0.002 for FAGG; β = 1.0665, p = 0.000 for SAGG; β = 1.4867, p = 0.001 for TAGG).
Agglomeration can strengthen information exchange and communication among enterprises within a region, thus fostering a favorable interaction and innovation environment (Feldman, 1999). Under the influence of knowledge spillover, advanced technological knowledge and cutting-edge management concepts can be applied in production, thereby elevating the technological research and progression, product design and management level (Aarstad et al., 2016). The overall enhancement of enterprise productivity could ultimately contribute to the reduction of PM2.5 pollution (Song et al., 2023). The primary industrial agglomeration cannot sufficiently promote the enhancement of technological innovation, which is consistent with the findings of Deng et al. (2022). The increase in the value of agricultural output constitutes only a small portion of the total increase in total output, insufficient to support the high research costs associated with technological innovation. For the secondary industry, the coefficient of the direct effect is 0.8610 and the indirect effect is −1.8014. The secondary industrial agglomeration, especially in high-tech industries and strategic emerging industries with low resource consumption and minimal pollution emissions, contributes to technological innovation. The increase in the level of secondary industrial agglomeration ultimately leads to a reduction in PM2.5 pollution. However, the secondary industrial agglomeration exhibits negative spillover effects, indicating that the secondary industry characterized by resource-intensive could competitively hinder resource utilization of neighboring cities, consequently suppressing technological innovation in neighboring cities. The tertiary industrial agglomeration shows obvious spatial spillover effects, effectively promoting the technological innovation level of local and neighboring cities. The tertiary industrial agglomeration, characterized by knowledge intensity, is conducive to the information flow across spatial constraints among affiliated enterprises, thereby enhancing the overall innovation levels.
Population agglomeration leads to an elevation in production and consumption activities associated with environmental pollution, which serves as a major obstacle to controlling PM2.5 pollution (Begum et al., 2015; Dong et al., 2018). The primary industrial agglomeration obviously promotes population growth, accompanied by positive spatial spillover effects. The total effect coefficient of SAGG is 0.2603, indicating that the rise in the secondary industrial agglomeration level effectively facilitates population growth. The secondary industry is mostly composed of labor-intensive sectors, providing numerous employment opportunities in the labor market and playing a stimulating role in the complementary development of neighboring cities. The coefficients of both the direct and indirect effects of TAGG are negative, with values of −0.4839 and −0.3580, respectively. This indicates that the tertiary industry exerts a restraining influence on population growth. In recent years, the rapid advancement of digitization has propelled emerging service industries towards an increasing reliance on artificial intelligence technology, resulting in a reduced demand for labor and effectively alleviating population agglomeration.
Through the above discussion, we found that the three major industrial agglomeration is apparently associated with scale expansion, technological spillover, and population scale. Combining existing theories and analyses, it can be concluded that industrial agglomeration exerts influences on PM2.5 pollution through scale expansion effect, technological spillover effect, and population scale effect. Therefore, hypotheses H2a, H2b, and H2c are validated.
6 Conclusion and policy implications
6.1 Conclusion
This study explores the effects of three major industrial agglomerations on PM2.5 pollution, based on data from 110 prefecture-level cities of YEB in 2005–2019. We conducted a systematic analysis of the relevant theories and mechanisms. And then, the spatiotemporal trends of industrial agglomeration in these 110 prefecture-level cities are analyzed, examining their spatial correlations. A SDM is established to examine the effect, and the heterogeneity test and mechanism analysis were conducted. The primary conclusions are outlined below.
(1) Regarding temporal trends, the primary and tertiary industries agglomeration levels in the YEB exhibit a trend of initial decline followed by an upward, while the secondary industrial agglomeration level shows a trend of initially rising and then stabilizing. Regarding spatial distribution, the primary industry demonstrates high-value agglomeration in upstream cities, while the high-value agglomeration regions of the secondary and tertiary industries are primarily distributed in cities of midstream and downstream cities. Industrial agglomerations and PM2.5 pollution in prefecture-level cities of the YEB present prominent positive spatial autocorrelation, mainly following a pattern of H-H and L-L agglomeration.
(2) Notable variances are existing in the effects of the three major industrial agglomerations on PM2.5 pollution in the YEB. Specifically, the primary industrial agglomeration contributes to a decrease in PM2.5 pollution and exhibits negative spatial spillover effects. A non-linear relationship is observed between the secondary industrial agglomeration and PM2.5 pollution, with an initial exacerbation followed by a subsequent alleviation. And the tertiary industrial agglomeration results in an increase in PM2.5 pollution.
(3) The effects of secondary industrial agglomeration on PM2.5 pollution exhibit varying degrees of ‘inverted U-shape’ curves in the upstream, midstream, and downstream cities. As the agglomeration levels develop, the midstream cities attain the inflection point of agglomeration as a precursor, followed sequentially by the cities of downstream and upstream cities. The curve in the midstream cities exhibits the greatest degree of curvature, and the PM2.5 pollution corresponding to the inflection point of agglomeration is the highest. For the downstream cities, the effect is in a period where the marginal effects are gradually decreasing, and it cannot significantly restrain PM2.5 pollution.
(4) Industrial agglomeration affects PM2.5 pollution through three mechanisms, including scale expansion effect, technological spillover effect, and population scale effect. Industrial agglomeration concentrates enterprises geographically, enhancing cooperation, communication, and technological innovation among enterprises within the region. It promotes the sharing and utilization of resources, thereby exerting an impact on controlling PM2.5 pollution.
6.2 Policy implications
Drawing upon the above findings, we put forward the following policy implications.
(1) By improving the joint control for PM2.5 pollution and constructing a regional coordination system, favorable policy conditions can be created for the positive impact of industrial agglomeration on air environment. On one hand, government needs to establish specialized regulatory agencies, formulate and optimize management systems, and break down administrative barriers. On the other hand, it is essential to establish support and transfer systems. Developed cities exhibit high-value agglomerations in PM2.5 pollution, necessitating an urgent shift towards the high-end of the industrial and value chains. Underdeveloped cities can undertake the transfer of industries from developed regions, simultaneously introducing clean production technologies and advanced green management.
(2) There is a need to optimize the development paths of the three major industries, fostering distinctive industrial clusters and propelling the transformation of industries. The primary industry should accelerate the mechanization and digitization mode, fully leveraging the agglomeration effect of the primary industry to drive a sustained decrease in pollution. To break through the existing technological boundaries of traditional industries, it is necessary to integrate the secondary industrial agglomeration with modern information technologies such as artificial intelligence, in order to create high-end industrial clusters. The tertiary industrial agglomeration needs to be vigorously promoted so that it can exert a positive environmental effect. Productive service industries should extend to specialization, while upgrading lifestyle service industries to a higher quality.
(3) Based on the status of regional development, different strategies need be adopted. For upstream cities, strengthening environmental regulations to constrain production behavior could elevate the industrial agglomeration level. For midstream cities, efforts might be made to promote the progression of industries towards less-polluting, technology-intensive, and green environmental practices. For downstream cities, the transformation and upgrading of agglomerated industries should focus on internal management innovation and efficient utilization of production factors.
(4) The scale expansion, technological spillover, and population scale effects of industrial agglomeration are worth being effectively utilized. It necessitates cities to improve infrastructure construction and strengthen planning guidance and support in order to ensure that cooperation among enterprises could bring about a scale effect. Considering technological innovation as a key approach for economic growth and controlling air pollution, promoting the application of environmentally friendly technologies, and maximizing the environmental benefits derived from technological spillover effects. The government could deepen reforms in the talent system, dismantle institutional barriers hindering the social mobility of labor, and fundamentally transform the pressure of population growth into a driving force for human capital to propel industrial development.
6.3 Limitations and suggestions for future research
Initially, regarding the issue of sample selection, we focused on data from prefecture-level cities of the YEB in 2005–2019. The existing research sample does not include the impacts caused by the COVID-19 pandemic. Additionally, our study area is relatively small, and it is uncertain whether the research results can be replicated in other countries or regions. We recommend that other researchers exploring this topic consider increasing the sample size, such as by extending the time span or expanding the study area. Lastly, there are still some shortcomings in the content of the research. We did not analyze the effects of industrial synergy agglomeration. Exploring the impact mechanisms of industrial agglomeration on PM2.5 pollution is worthwhile, and future studies can conduct a more in-depth analysis from the perspective of industrial synergy.
Data availability statement
The original contributions presented in the study are included in the article/Supplementary Material, further inquiries can be directed to the corresponding author.
Author contributions
LL: Conceptualization, Data curation, Formal Analysis, Methodology, Software, Writing–original draft, Writing–review and editing. ZX: Methodology, Software, Visualization, Writing–original draft. JY: Conceptualization, Investigation, Validation, Writing–review and editing. RQ: Project administration, Supervision, Writing–review and editing. JC: Funding acquisition, Resources, Writing–review and editing.
Funding
The author(s) declare financial support was received for the research, authorship, and/or publication of this article. The authors gratefully acknowledge the financial support from Strategic Research and Consulting Projects of CAE (the Chinese Academy of Engineering) (2023-DFZD-45) and the Fundamental Research Funds for the Central Universities (CUGW210801).
Conflict of interest
The authors declare that the research was conducted in the absence of any commercial or financial relationships that could be construed as a potential conflict of interest.
Publisher’s note
All claims expressed in this article are solely those of the authors and do not necessarily represent those of their affiliated organizations, or those of the publisher, the editors and the reviewers. Any product that may be evaluated in this article, or claim that may be made by its manufacturer, is not guaranteed or endorsed by the publisher.
References
Aarstad, J., Kvitastein, O. A., and Jakobsen, S.-E. (2016). Related and unrelated variety as regional drivers of enterprise productivity and innovation: a multilevel study. Res. Policy 45, 844–856. doi:10.1016/j.respol.2016.01.013
Al-Mulali, U., Ozturk, I., and Lean, H. H. (2015). The influence of economic growth, urbanization, trade openness, financial development, and renewable energy on pollution in Europe. Nat. Hazard. 79, 621–644. doi:10.1007/s11069-015-1865-9
Andreoni, J., and Levinson, A. (2001). The simple analytics of the environmental Kuznets curve. J. Public. Econ. 80, 269–286. doi:10.1016/S0047-2727(00)00110-9
Begum, R. A., Sohag, K., Abdullah, S. M. S., and Jaafar, M. (2015). CO2 emissions, energy consumption, economic and population growth in Malaysia. Renew. Sust. Energ. Rev. 41, 594–601. doi:10.1016/j.rser.2014.07.205
Changjiang Times (2022). The Yangtze River Economic Belt's breakthroughs and achievements are fruitful, accounting for 46.7% of the country's total economic output. Available at: http://www.changjiangtimes.com/2022/01/620632.html.
Chen, C., Sun, Y., Lan, Q., and Jiang, F. (2020). Impacts of industrial agglomeration on pollution and ecological efficiency-A spatial econometric analysis based on a big panel dataset of China’s 259 cities. J. Clean. Prod. 258, 120721. doi:10.1016/j.jclepro.2020.120721
Chen, D., Jiang, P., and Li, M. (2021). Assessing potential ecosystem service dynamics driven by urbanization in the Yangtze River Economic Belt, China. J. Environ. Manage. 292, 112734. doi:10.1016/j.jenvman.2021.112734
Chen, X. H., Tee, K., Elnahass, M., and Ahmed, R. (2023). Assessing the environmental impacts of renewable energy sources: a case study on air pollution and carbon emissions in China. J. Environ. Manage. 345, 118525. doi:10.1016/j.jenvman.2023.118525
Chen, Y., Zhu, Z., and Cheng, S. (2022). Industrial agglomeration and haze pollution: evidence from China. Sci. Total Environ. 845, 157392. doi:10.1016/j.scitotenv.2022.157392
Cirman, A., Domadenik, P., Koman, M., and Redek, T. (2009). The Kyoto protocol in a global perspective. Econ. Bus. Rev. 11, 3. doi:10.15458/2335-4216.1259
Colmer, J., Hardman, I., Shimshack, J., and Voorheis, J. (2020). Disparities in PM2.5 air pollution in the United States. Science 369, 575–578. doi:10.1126/science.aaz9353
Copeland, B. R., and Taylor, M. S. (2004). Trade, growth, and the environment. J. Econ. Lit. 42, 7–71. doi:10.1257/.42.1.7
Deng, Y., Cui, Y., Khan, S. U., Zhao, M., and Lu, Q. (2022). The spatiotemporal dynamic and spatial spillover effect of agricultural green technological progress in China. Environ. Sci. Pollut. Res. Int., 1–15. doi:10.1007/s11356-021-18424-z
Dong, K. Y., Hochman, G., Zhang, Y. Q., Sun, R. J., Li, H., and Liao, H. (2018). CO2 emissions, economic and population growth, and renewable energy: empirical evidence across regions. Energy Econ. 75, 180–192. doi:10.1016/j.eneco.2018.08.017
Elhorst, J. P., and Emili, S. (2022). A spatial econometric multivariate model of Okun's law. Reg. Sci. Urban. Econ. 93, 103756. doi:10.1016/j.regsciurbeco.2021.103756
Fang, J. Y., Tang, X., Xie, R., and Han, F. (2020). The effect of manufacturing agglomerations on smog pollution. Struct. Chang. Econ. Dyn. 54, 92–101. doi:10.1016/j.strueco.2020.04.003
Feldman, M. P. (1999). The new economics of innovation, spillovers and agglomeration: areview of empirical studies. Econ. Innov. New Technol. 8, 5–25. doi:10.1080/10438599900000002
Fu, S., Viard, V. B., and Zhang, P. (2022). Trans-boundary air pollution spillovers: physical transport and economic costs by distance. J. Dev. Econ. 155, 102808. doi:10.1016/j.jdeveco.2021.102808
Gani, A. (2021). Fossil fuel energy and environmental performance in an extended STIRPAT model. J. Clean. Prod. 297, 126526. doi:10.1016/j.jclepro.2021.126526
Giannadaki, D., Giannakis, E., Pozzer, A., and Lelieveld, J. (2018). Estimating health and economic benefits of reductions in air pollution from agriculture. Sci. Total Environ. 622, 1304–1316. doi:10.1016/j.scitotenv.2017.12.064
Glaeser, E. L., and Kahn, M. E. (2010). The greenness of cities: carbon dioxide emissions and urban development. J. Urban. Econ. 67, 404–418. doi:10.1016/j.jue.2009.11.006
Grossman, G. M., and Krueger, A. B. (1995). Economic growth and the environment. Q. J. Econ. 110, 353–377. doi:10.2307/2118443
He, Y., Lin, K., Liao, N., Chen, Z., and Rao, J. (2022). Exploring the spatial effects and influencing factors of PM2. 5 concentration in the Yangtze River delta urban agglomerations of China. Atmos. Environ. 268, 118805. doi:10.1016/j.atmosenv.2021.118805
Hu, W. Q., Tian, J. P., and Chen, L. J. (2021). An industrial structure adjustment model to facilitate high-quality development of an eco-industrial park. Sci. Total Environ. 766, 142502. doi:10.1016/j.scitotenv.2020.142502
Huang, R., and Lv, G. N. (2021). The climate economic effect of technology spillover. Energy Policy 159, 112614. doi:10.1016/j.enpol.2021.112614
Jbaily, A., Zhou, X. D., Liu, J., Lee, T. H., Kamareddine, L., Verguet, S., et al. (2022). Air pollution exposure disparities across US population and income groups. Nature 601, 228–233. doi:10.1038/s41586-021-04190-y
Karkalakos, S. (2010). Capital heterogeneity, industrial clusters and environmental consciousness. J. Econ. Integr. 25, 353–375. doi:10.11130/jei.2010.25.2.353
Ke, S. (2010). Agglomeration, productivity, and spatial spillovers across Chinese cities. Ann. regional Sci. 45, 157–179. doi:10.1007/s00168-008-0285-0
Krugman, P. (1991). Increasing returns and economic geography. J. Polit. Econ. 99, 483–499. doi:10.1086/261763
Lesage, J. P., and Pace, R. K. (2009). “Spatial econometric models,” in Handbook of applied spatial analysis: Software tools, methods and applications (Springer), 355–376.
Li, T., Shi, Z., Han, D., and Zeng, J. (2023). Agglomeration of the new energy industry and green innovation efficiency: does the spatial mismatch of R&D resources matter? J. Clean. Prod. 383, 135453. doi:10.1016/j.jclepro.2022.135453
Li, X. H., Xu, Y. Y., and Yao, X. (2021). Effects of industrial agglomeration on haze pollution: a Chinese city-level study. Energy Policy 148, 111928. doi:10.1016/j.enpol.2020.111928
Li, Z. G., and Wang, J. (2022). The dynamic impact of digital economy on carbon emission reduction: evidence city-level empirical data in China. J. Clean. Prod. 351, 131570. doi:10.1016/j.jclepro.2022.131570
Liu, S. J., He, N. N., Shi, Y. T., and Li, G. Q. (2021). The roles logistics agglomeration and technological progress play in air pollution - new evidence in sub-regions of Chongqing, China. J. Clean. Prod. 317, 128414. doi:10.1016/j.jclepro.2021.128414
Liu, S. X., Zhu, Y. M., and Du, K. Q. (2017). The impact of industrial agglomeration on industrial pollutant emission: evidence from China under New Normal. Clean. Technol. Environ. Policy 19, 2327–2334. doi:10.1007/s10098-017-1407-0
Liu, X., and Zhang, X. (2021). Industrial agglomeration, technological innovation and carbon productivity: evidence from China. Resour. Conserv. Recycl. 166, 105330. doi:10.1016/j.resconrec.2020.105330
Liu, Y., and Guo, M. (2023). The impact of FDI on haze pollution:“Pollution paradise” or “pollution halo?”--Spatial analysis of PM2. 5 concentration raster data in 283 cities. Front. Environ. Sci. 11, 318. doi:10.3389/fenvs.2023.1133178
Liu, Y., Zhang, X., Pan, X., Ma, X., and Tang, M. (2020). The spatial integration and coordinated industrial development of urban agglomerations in the Yangtze River Economic Belt, China. Cities 104, 102801. doi:10.1016/j.cities.2020.102801
Lu, J., Li, B., Li, H., and Al-Barakani, A. (2021). Expansion of city scale, traffic modes, traffic congestion, and air pollution. Cities 108, 102974. doi:10.1016/j.cities.2020.102974
Ma, Q., Murshed, M., and Khan, Z. (2021). The nexuses between energy investments, technological innovations, emission taxes, and carbon emissions in China. Energy Policy 155, 112345. doi:10.1016/j.enpol.2021.112345
Maamoun, N. (2019). The Kyoto protocol: empirical evidence of a hidden success. J. Environ. Econ. Manage. 95, 227–256. doi:10.1016/j.jeem.2019.04.001
Miller, M. M., Gibson, L. J., and Wright, N. G. (1991). Location quotient: a basic tool for economic development analysis. Econ. Dev. Rev. 9, 65.
Muhammad, S., Pan, Y., Agha, M. H., Umar, M., and Chen, S. (2022). Industrial structure, energy intensity and environmental efficiency across developed and developing economies: the intermediary role of primary, secondary and tertiary industry. Energy 247, 123576. doi:10.1016/j.energy.2022.123576
Ottaviano, G., Tabuchi, T., and Thisse, J.-F. (2002). Agglomeration and trade revisited. Int. Econ. Rev. 43, 409–435. doi:10.1111/1468-2354.t01-1-00021
Qiang, W., Lin, Z. W., Zhu, P. Y., Wu, K., and Lee, H. F. (2021). Shrinking cities, urban expansion, and air pollution in China: a spatial econometric analysis. J. Clean. Prod. 324, 129308. doi:10.1016/j.jclepro.2021.129308
Qin, Y., Zhang, H., Zhao, H., Li, D., Duan, Y., and Han, Z. (2022). Research on the spatial correlation and drivers of industrial agglomeration and pollution discharge in the Yellow River Basin. Front. Environ. Sci. 10, 1004343. doi:10.3389/fenvs.2022.1004343
Ren, Y., Tian, Y., and Zhang, C. (2022). Investigating the mechanisms among industrial agglomeration, environmental pollution and sustainable industrial efficiency: a case study in China. Environ. Dev. Sustain. 24, 12467–12493. doi:10.1007/s10668-021-01971-3
Song, Y., Zhu, J., Yue, Q., Zhang, M., and Wang, L. (2023). Industrial agglomeration, technological innovation and air pollution: empirical evidence from 277 prefecture-level cities in China. Struct. Chang. Econ. Dyn. 66, 240–252. doi:10.1016/j.strueco.2023.05.003
Sun, C., Chen, L., and Tian, Y. (2018). Study on the urban state carrying capacity for unbalanced sustainable development regions: evidence from the Yangtze River Economic Belt. Ecol. Indic. 89, 150–158. doi:10.1016/j.ecolind.2018.02.011
Tanaka, K., and Managi, S. (2021). Industrial agglomeration effect for energy efficiency in Japanese production plants. Energy Policy 156, 112442. doi:10.1016/j.enpol.2021.112442
The Asian Development Bank (2012). Toward an environmentally sustainable future: country environmental analysis of the People's Republic of China. Available at: https://www.adb.org/publications/toward-environmentally-sustainable-future-country-environmental-analysis-prc.
Van Vuuren, D. P., Cofala, J., Eerens, H. E., Oostenrijk, R., Heyes, C., Klimont, Z., et al. (2006). Exploring the ancillary benefits of the Kyoto Protocol for air pollution in Europe. Energy Policy 34, 444–460. doi:10.1016/j.enpol.2004.06.012
Wang, Q., Kwan, M. P., Zhou, K., Fan, J., Wang, Y. F., and Zhan, D. S. (2019). The impacts of urbanization on fine particulate matter (PM2.5) concentrations: empirical evidence from 135 countries worldwide. Environ. Pollut. 247, 989–998. doi:10.1016/j.envpol.2019.01.086
Wang, X., and Luo, Y. (2020). Has technological innovation capability addressed environmental pollution from the dual perspective of FDI quantity and quality? Evidence from China. J. Clean. Prod. 258, 120941. doi:10.1016/j.jclepro.2020.120941
Wang, X., Wang, M. L., Pang, S. L., Wei, Z. Y., and Liu, Z. (2023). Does producer services agglomeration affect environmental quality? New findings from a spatial spillover effect analysis. J. Environ. Plan. Manag. 66, 1601–1621. doi:10.1080/09640568.2022.2036600
Wang, Y., Duan, X., Wang, L., and Zou, H. (2022). Spatial temporal patterns and driving factors of industrial pollution and structures in the Yangtze River Economic Belt. Chemosphere 303, 134996. doi:10.1016/j.chemosphere.2022.134996
Wang, Y., and Wang, J. (2019). Does industrial agglomeration facilitate environmental performance: new evidence from urban China? J. Environ. Manage. 248, 109244. doi:10.1016/j.jenvman.2019.07.015
Xu, X., Yang, G., Tan, Y., Liu, J., and Hu, H. (2018). Ecosystem services trade-offs and determinants in China's Yangtze River Economic belt from 2000 to 2015. Sci. Total Environ. 634, 1601–1614. doi:10.1016/j.scitotenv.2018.04.046
Yamashita, N., Matsuura, T., and Nakajima, K. (2014). Agglomeration effects of inter-firm backward and forward linkages: evidence from Japanese manufacturing investment in China. J. Jpn. Int. Econ. 34, 24–41. doi:10.1016/j.jjie.2014.04.001
Yao, S. J., Zhang, X. Q., and Wang, Z. T. (2023). On economic agglomeration and carbon productivity in Chinese cities: a spatial econometric analysis. Environ. Dev. Sustain. doi:10.1007/s10668-023-03034-1
Yuan, L., Li, R., He, W., Wu, X., Kong, Y., Degefu, D. M., et al. (2022). Coordination of the industrial-ecological economy in the yangtze river economic belt, China. Front. Environ. Sci. 10, 451. doi:10.3389/fenvs.2022.882221
Zeng, D. Z., and Zhao, L. X. (2009). Pollution havens and industrial agglomeration. J. Environ. Econ. Manage. 58, 141–153. doi:10.1016/j.jeem.2008.09.003
Zeng, W., Li, L., and Huang, Y. (2021). Industrial collaborative agglomeration, marketization, and green innovation: evidence from China’s provincial panel data. J. Clean. Prod. 279, 123598. doi:10.1016/j.jclepro.2020.123598
Zhang, L., Mu, R., Hu, S., Yu, J., and Zhang, J. (2022). Industrial coagglomeration, technological innovation, and environmental pollution in China: life-cycle perspective of coagglomeration. J. Clean. Prod. 362, 132280. doi:10.1016/j.jclepro.2022.132280
Zhang, X., Ma, W., and Sheng, S. (2023a). Understanding the structure and determinants of economic linkage network: the case of three major city clusters in Yangtze River Economic belt. Front. Environ. Sci. 10, 1073395. doi:10.3389/fenvs.2022.1073395
Zhang, X., Yao, S., Zheng, W., and Fang, J. (2023b). On industrial agglomeration and industrial carbon productivity---impact mechanism and nonlinear relationship. Energy 283, 129047. doi:10.1016/j.energy.2023.129047
Zhao, H. L., and Lin, B. Q. (2019). Will agglomeration improve the energy efficiency in China's textile industry: evidence and policy implications. Appl. Energy 237, 326–337. doi:10.1016/j.apenergy.2018.12.068
Zheng, Y., Peng, J., Xiao, J., Su, P., and Li, S. (2020). Industrial structure transformation and provincial heterogeneity characteristics evolution of air pollution: evidence of a threshold effect from China. Atmos. Pollut. Res. 11, 598–609. doi:10.1016/j.apr.2019.12.011
Zhou, Q., Wang, C., and Fang, S. (2019). Application of geographically weighted regression (GWR) in the analysis of the cause of haze pollution in China. Atmos. Pollut. Res. 10, 835–846. doi:10.1016/j.apr.2018.12.012
Keywords: industrial agglomeration, PM2.5 pollution, spatial econometric model, non-linear estimation, Yangtze River Economic Belt
Citation: Li L, Xia Z, Yi J, Qi R and Cheng J (2024) Industrial agglomeration and PM2.5 pollution in Yangtze River Economic Belt in China: non-linear estimation and mechanism analysis. Front. Environ. Sci. 11:1346323. doi: 10.3389/fenvs.2023.1346323
Received: 29 November 2023; Accepted: 26 December 2023;
Published: 09 January 2024.
Edited by:
Le Wen, University of Auckland, New ZealandReviewed by:
Zirui Lan, Tianjin Academy of Social Sciences, ChinaWeiwei Xiong, UMR8212 Laboratoire des Sciences du Climat et de l’Environnement (LSCE), France
Qiong Xu, Central South University, China
Copyright © 2024 Li, Xia, Yi, Qi and Cheng. This is an open-access article distributed under the terms of the Creative Commons Attribution License (CC BY). The use, distribution or reproduction in other forums is permitted, provided the original author(s) and the copyright owner(s) are credited and that the original publication in this journal is cited, in accordance with accepted academic practice. No use, distribution or reproduction is permitted which does not comply with these terms.
*Correspondence: Rui Qi, cWlydWlAY3VnLmVkdS5jbg==