 Qiulan Qian1
 Shuangcheng Luo2*
- 1Hunan Vocational College of Commerce, Changsha, China
- 2School of Economics, Hunan Agricultural University, Changsha, China
Introduction: Improving land use efficiency is a necessary way to promote sustainable urban development. The objective of this study is to examine the issue of land green use efficiency (LGUE) in resource-based cities and analyze the impact of digital transformation on LGUE. The research utilizes data from 113 resource-based cities in China spanning from 2008 to 2020.
Methodology: Firstly, using the stochastic frontier analysis (SFA) to measure LGUE in China cities, this paper investigates the spatial and temporal evolution of LGUE in different cities. Then, this paper explores the impact of digital transformation on the LGUE of resource-based cities based on the broadband China policy using the DID method.
Findings: According to the data measured by the SFA, it is found that resource-based cities are 20.4% lower than non-resource-based cities. An in-depth study found that digital transformation significantly improves LGUE, and the effect is greater in resource-based cities, which is a powerful tool to solve the difficulty of LGUE in resource-based cities. Specifically, digital transformation helps to improve the LGUE of resource-based cities enhance by technological innovation and industrial structure upgrading, and alleviating land factor mismatch.
Discussion: It is not only necessary to guide and encourage the in-depth integration of traditional industries with digital technology to enhance the digital transformation of resource-based cities, but also to continuously optimize the allocation of land resources between regions and narrow the gap in LGUE between cities.
1 Introduction
With the continuous development of industrialization and urbanization, countries have intensified the use of land resources. However, the transformation of land resources from their natural state to urban construction land is usually irreversible (Torrey and Jolly, 1993), which has triggered a great deal of attention to the rational and full utilization of land resources. China is a populous country, and China’s urbanization rate has grown from 17.9% in 1978 to 65.2% in 2022. The massive rural-urban migration and industrial development have exacerbated the consumption of land resources and triggered serious land-use problems, including the loss of arable land, inefficient allocation of land resources, land resource tension, and unbalanced urban-rural development (Liu et al., 2014; Huang and Song, 2019), which has attracted extensive attention from the political and academic circles. How to coordinate land use, promote the effective distribution of land resources, and improve the efficiency of land use has become the key to alleviate land use problems.
Resource-based cities are formed and developed through the development and processing of abundant natural resources (Martinez-Fernandez et al., 2012), and urban development is often characterized by a high degree of dependence on resource-based industries, a single industrial structure, and distorted factor allocation. According to the definition of resource-based cities in the National Sustainable Development Plan for Resource-Based Cities (2013–2020), there are 262 resource-based cities in China (116 of which are prefecture-level cities), accounting for 30% of all cities in developing countries (Li et al., 2021). Resource-based cities provide a variety of basic raw materials for economic growth and contribute greatly to economic development. However, the development of resource-based cities is constrained by the characteristics of industrial structure and the dependence on the environment, and the land green use efficiency (LGUE) is often low. Some research has been found that land use problems are more prominent in resource-based cities because of their higher degree of resource dependence and more serious ecological damage (Chen et al., 2019a; Ge and Liu, 2021). According to the data measured by the stochastic frontier analysis (SFA) in this paper, on average, the LGUE of resource-based cities is 20.4% lower than that of non-resource-based cities. The study in this paper confirms the land use dilemma in resource-based cities.
How to improve the LGUE of resource-based cities is a top priority for alleviating land tension and developing green economy. Most of the existing studies have explored how to improve land use efficiency from the aspects of economic development and industrial structure (Masini et al., 2019; Koroso et al., 2020; Liu et al., 2021), and few studies have explored the impact of digital transformation on LGUE. Tang et al. (2022) found that the efficiency of technology use is the main constraint on land use efficiency (Tang and Chen, 2022).Tang and Chen (2022) found that digital construction can effectively improve the green use efficiency of regional cropland, confirming the favorable contribution of digital transformation to land use (Tang et al., 2022). Some studies have also explored the economic effects of digital land use planning (Hersperger et al., 2022; Adade and Vries, 2023; Kyriakopoulou and Picard, 2023). However, there is a lack of research on the factors influencing the LGUE of resource cities, and how digital transformation affects the LGUE of resource-based cities is still unknow.
The innovations of this paper compared to the existing studies are as follows. Firstly, based on the SFA, we measured the LGUE of resource-based cities and non-resource-based cities, and explored the spatial and temporal evolution characteristics of the LGUE of resource-based cities. Secondly, we explore the mechanism of improving LGUE from the aspects of technological innovation and technological application capacity, and the mechanism of digital transformation affecting LGUE, which supplements the existing literature. Thirdly, in combination with the “Broadband China” policy, we use the differences-in-differences (DID) method to empirically test the impact and mechanism of digital transformation on LGUE, which effectively overcomes the bias of the estimation caused by the endogeneity problem.
The next part of this paper is arranged as follows. The second part is a literature review, combing the relevant literature from the measurement of LGUE and its influencing factors, and pointing out the deficiencies and gaps in the existing literature. The third part theoretically analyzes how to improve the LGUE, and combs through the mechanism of the impact of digital transformation on the LGUE. The fourth part utilizes the SFA approach to measure the LGUE, and analyzes the spatial and temporal evolution characteristics of LGUE in Chinese cities. The fourth part is data description and research methods, and the fifth part is the empirically results, analyzes the impact of digital transformation on LGUE based on the Broadband China policy. The sixth part is the conclusion.
2 Literature review
From the existing literature, relevant studies have done a lot of analysis mainly from the aspects of land use efficiency measurement and its influencing factors, but there are not many studies exploring the impact of LGUE from the perspective of digital transformation.
Regarding land use efficiency, studies have pointed out that the development of urbanization and industrialization needs to consume a large amount of land resources, resulting in urban land resources becoming more scarce, and how to improve land use efficiency and promote the sustainable use of land is the key to solving the land problem (Liu, 2018). Therefore, the study of land use efficiency is of great significance for high-quality urban development. Some research pointed out that the rapid process of China’s urbanization has really increased the scarcity of urban construction land (Liu and Ravenscroft, 2017). In terms of urban land use efficiency measurement, mainstream methods include SFA, data envelopment analysis (DEA), and SBM model (Chen et al., 2016; Jia et al., 2017; Yu et al., 2019). Compared with other methods, the advantage of the SFA is that it can separate the random interference term from the technical inefficiency term and reduce the influence of random factors, and for the selection of the production function, it can use the transcendental logarithmic function that is more flexible, easy to estimate and inclusive. So it is widely used in the measurement of land use efficiency (Liu et al., 2020). This provides the theory and methodology for the study in this paper.
Since land use efficiency affects resource consumption and environmental pollution, people have begun to pay more attention to LGUE. Relevant studies have pointed out that because urban industrial development can create tax revenue for the government, industrial land is often oversupplied in urban construction land and the price of the land is low, resulting in a mismatch of land resources. The oversupply of industrial land reduces enterprise costs, squeezes the resources of emerging enterprises, and reinforces the structural rigidity of low-end industries, which together form a crude economic development model that exacerbates resource consumption and environmental pollution in the long run (Xie et al., 2022). Improving land use efficiency not only improves the efficiency of industrial inputs and facilitates the treatment of industrial pollutants (Peng et al., 2017; Li et al., 2021), but also ameliorates environmental pollution and CO2 emissions by shortening commuting distances, promoting industrial transformation, and improving transportation efficiency (Zhang et al., 2018; Dong et al., 2020). On this basis, some studies have considered the comprehensive benefits of economy, ecology, and society when analyzing land use efficiency (Lu et al., 2020; Tan et al., 2021), and focused on the LGUE. For this reason, this paper focuses on the LGUE from an environmental perspective.
Regarding the influencing factors of land use efficiency, most of the existing literature discusses how to improve land use efficiency from the aspects of economic development, residents’ income, industrial structure, etc. Some scholars studied the land use efficiency of 417 metropolitan cities in Europe, and found that residents’ income and wealth affect land use efficiency, and, specifically, wealthier cities tend to have higher land use efficiency (Masini et al., 2019). Some scholars studied land use efficiency in Ethiopia from the perspective of urban land lease policy and concluded that factors such as increasing land productivity and ensuring sustainable urban growth are key to improving land use efficiency (Koroso et al., 2020). In addition, some research have found that industrial restructuring not only promotes intensive land use in local areas, but also has a large radiation effect on other areas (Peng et al., 2017), while affecting urban land use efficiency by changing the urban land use structure and promoting the reconfiguration of land resources in various industrial sectors (Liu et al., 2021). Some research also explored the impact of urban land use efficiency from the perspective of factor mobility, and found that labor and capital factor mobility has a promotional effect on land use efficiency (Lu et al., 2022).
In recent years, more and more literature has begun to focus on the value of digital technology applications, exploring the relationship between digital transformation and business performance and technological innovation from a micro perspective (Bouwman et al., 2019; Ribeiro-Navarrete et al., 2021; Wu et al., 2023), and analyzing the digital economy from a macro perspective impact on macroeconomic stability, carbon emissions (Bertani et al., 2021; Li and Wang, 2022; Ma et al., 2022; Luo and Yuan, 2023). In addition, digital transformation contributes to green technological innovation and industrial structure transformation, thus affecting green economic growth (Hao et al., 2023). Thus, digital transformation plays an important role in technological innovation and improving environmental performance, and influences the regional industrial structure, which in turn has a profound impact on the efficiency of green land use. However, the existing literature lacks to explore the impact of LGUE from the perspective of digital transformation, and its transmission mechanism is not yet clear. The study in this paper will be a useful addition to the field.
3 Theoretical analysis
3.1 Theoretical analysis of LGUE
The SFA was first proposed by Aigner (Aigner et al., 1977), aiming to explore the gap between the actual output of each unit within the economic system and the optimal output, so as to characterize the ability to achieve optimal production under the given conditions. In reality, due to various frictions and impediments, production subjects often deviate from the optimal production state in practice, resulting in inefficiency. Therefore, the production subject in the given conditions, through continuous adjustment of production inputs, technology application, etc. to ensure that the production process of output maximization and profit maximization goals.
As far as land use is concerned, land and factors such as capital and labor are used as actual inputs for production, and the output component includes both the actual outputs of various sectors of the economy (desired outputs) and the pollution emissions caused by production (non-desired outputs). Under the conditions of comprehensive consideration of desired and non-desired outputs, the efficiency of green land use, can be measured. This is done by considering pollution emissions as a consumption of environmental resources, i.e., pollution emissions are included in the super-efficient production function as a production input. From the existing studies, they included energy and other raw materials as intermediate inputs (Jorgenson and Stiroh, 2000), together with capital and labor, into the production function to analyze the economic growth and productivity of the United States in the post-World War II period. Some research included energy and emissions together as inputs into the production function (Ramanathan, 2005; Lu et al., 2006). In addition, there are some studies that directly introduce both desired and non-desired outputs into the production process at the same time and analyze them using the directional distance function (Chung et al., 1997).
According to the SFA, it is difficult to guarantee that land will achieve the optimal output under the given conditions in the actual development. Referring to the related research (Liu et al., 2021), a theoretical model is constructed to analyze the technical inefficiency situation in the LGUE (as shown in Figure 1).
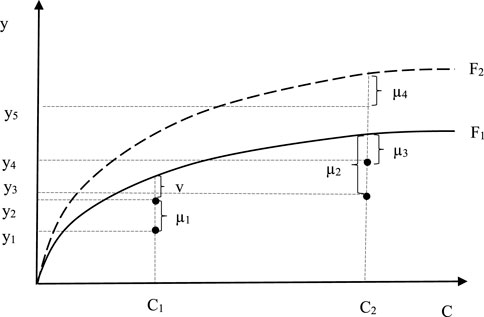
FIGURE 1. Theoretical analysis of LGUE. Note: The horizontal axis C denotes the land input, and the vertical axis y denotes the actual output under the corresponding land input; v denotes the stochastic disturbance term, where v > 0 means that the stochastic disturbance term negatively affects the output, and vice versa positively. µ1, µ2, µ3, and µ4 denote technological inefficiencies. F1 and F2 denote the optimal output scenarios under the different technological conditions, with the output of F2 having a higher technological level.
Assuming that F1 is the stochastic frontier boundary of land use input and output, the actual land input is C1 and the actual output is y1 under the established conditions, at this time, y1 has not yet reached the optimal output scale, and there exists the phenomenon of inefficiency (µ1≠0). When the economic agents continue to improve the ability to apply technology, improve technical efficiency to fully efficient, µ1 = 0, the actual output then grows to y2. At this time the actual output may be subject to stochastic disturbances, that is, it may be higher than the optimal output (i.e., v < 0), may also be lower than the optimal output (i.e., v > 0). The SFA separates the stochastic disturbing factors from the technical inefficiency, and analyzes the gap between the actual output and the optimal output after the elimination of the stochastic disturbing factors. Ratio of y1 to y2 can reflect the technical efficiency of the land use (taking the value between 0 and 1), and when the value is equal to 1, it means that the input and output of the land use at this time reaches the fully efficient state.
In the case of technology and other conditions remain unchanged, when the land use from C1 to C2, the actual output from y1 to y3, assuming that the random interference factors have been removed, the actual output y3 and technically efficient output gap is µ2. With the increasing inputs of land and other factors, external competition gradually intensified, the economic agents can promote production by improving the ability to apply the technology to improve technical efficiency. That is, the actual output of land use increases from y3 to y4, and the gap between the actual output of land use and the technologically effective output is narrowing (µ3<µ2). If technological progress occurs, frontier production increases from F1 to F2 levels, and real output increases accordingly (y5>y4). To summarize, the main channels to increase real output can be to improve technology application capabilities and to promote technological progress. If technology application capacity and technological progress occur simultaneously, the technical efficiency of land use and real output will be greatly enhanced.
3.2 Analysis of the role of digital transformation on LGUE
According to the theoretical analysis in the previous section, the impact of digital transformation on the LGUE in resource-based cities is also mainly reflected in the promotion of technological innovation, enhancement of technological application capacity, and improvement of land resource mismatch.
Firstly, digitalization helps technological innovation, especially for green innovation that reduces the consumption of environmental resources plays a significant role. For one thing, digital transformation helps to reduce R&D costs, shorten the R&D cycle, consumer participation in product development, etc., and improve the level of enterprise innovation (Tan and Zhan, 2017). Digital transformation can effectively alleviate information asymmetry and improve the matching efficiency of supply and demand of innovation factors such as R&D capital and innovation talents, which play a key role in industrial structure upgrading and technological innovation. Secondly, digital finance based on information technology can reduce information asymmetry and improve the efficiency of capital allocation, thus effectively solving the problem of “difficult and expensive financing” of enterprises. Third, digital transformation can help enterprises grasp market demand in a timely manner, integrate internal and external data resources to improve the efficiency of collaboration, and promote R&D innovation (Kleis et al., 2012), and can also encourage enterprises to cooperate with consumers to enrich the idea of new product development (Hoyer et al., 2010; Schweisfurth, 2017).
Secondly, digital transformation helps to enhance the ability to apply technology and drives the transformation of industrial structure. Digital transformation promotes the intelligence, automation and informatization of enterprise production and services, and enhances the enterprise’s technological application capabilities. In terms of production, digital technologies can increase the intelligent and flexible design of products to meet the diversified and customized product needs of consumers and reduce the manufacturing costs and selling prices of products. In terms of service, intelligent back-end production, customer service and software systems can provide users with diversified and constantly upgraded services, such as personalized customization, system solutions, product performance maintenance and optimization, which greatly improves the types of services and efficiency of manufacturing enterprises. With the deep integration of digital technology and the real economy, new industries such as intelligent transportation and intelligent energy have been spawned, as well as new modes and new business forms such as online education, Internet healthcare, online office, digital governance, etc., which eliminate backward and inefficient production capacity and promote the transformation and upgrading of the real industry. Some research applied the data of Brazilian SMEs and found that automation technology is a key factor in upgrading the value chain of enterprises (Oliveira et al., 2021). Some scholars also found that digital economic development and technological innovation are important driving forces in promoting the upgrading of industrial structure (Su et al., 2021).
Finally, digital transformation also helps to improve the mismatch of land resources, thus enhancing the LGUE. In China, with the increasing level of urbanization and industrialization, the demand for construction land for urban development continues to grow, while the transformation of land from agricultural land to urban construction land requires planning and approval by the central and provincial governments. This may lead to two scenarios: urbanization of population is greater than urbanization of land or urbanization of land is greater than urbanization of population. The former may create a “congestion effect”, resulting in traffic jams and high land prices, while the latter may lead to the disorderly spread of cities, resulting in “empty cities”, “ghost cities”, and “ghost towns”, thus leading to the spatial mismatch of land resources. Digital transformation mainly improves the land resources mismatch phenomenon from two aspects. On the one hand, digital transformation has the function of discovering the transaction object and transaction value, which can reduce the information asymmetry and transaction cost, so as to enhance the actual utilization value of land. On the other hand, digital technology enables the government to grasp more data on land use, traffic operation, population flow, etc., which helps the government to adjust the land policy in a timely manner, and improves the governmental governance capacity and transparency (Erkut, 2020). Based on the above analysis, this paper proposes the following hypotheses.
H1. Digital transformation enhances the LGUE in resource-based cities by promoting green technology innovation, industrial structure upgrading and improving land resource allocation.
4 LGUE measurement and spatial and temporal evolution
4.1 Measurement methods
Currently, the methods used to measure land use efficiency mainly include SFA, SBM, DEA, etc. Compared with other non-parametric methods, the SFA has the advantage of separating the stochastic factors in the composite error, which reduces the bias caused by deviation from the optimum due to the stochastic factors in the efficiency measurement. Therefore, this paper adopts the SFA to measure the LGUE. The SFA can generally take the form of Cobb-Douglas function and super-efficiency function. The former function form is too simplified and difficult to reflect the reality. Therefore, this paper adopts the latter, and constructs the stochastic frontier production function model that takes logarithm on both sides beyond the logarithmic production function, as shown in Eq. 1.
Y is real output. K, L, and P denote capital, labor, and land, respectively. C denotes pollution emissions, measured by sulfur dioxide emissions from urban industries. Pollution emission is actually a non-desired output, which is included as an input factor in the super-efficient production function, this is because the emission is a consumption of the natural environment, which can increase the level of output given the other input factors, and thus can be considered as one of the input factors. The subscript i denotes the city, t denotes the year, and
The LGUE can be expressed as the ratio of the actual output of urban land use to the expected value of the output under the fully efficient technology, and the specific calculation formula is shown in Eq. 2.
4.2 Construction of input-output indicators
Input indicators mainly include capital, labor, and land factor inputs (as shown in Table 1). The capital input adopts the perpetual inventory method to calculate the fixed capital stock of the municipal district. The calculation method is as follows:
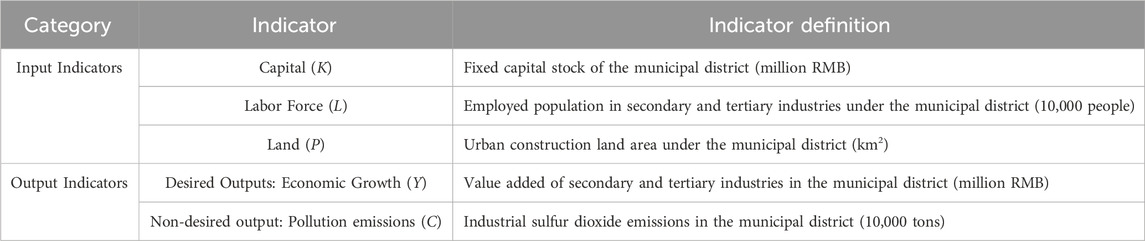
TABLE 1. Input-output related indicators and their definitions.
Output indicators include desired output and non-desired output. Desired output is the level of economic growth and is expressed by the real value added of the secondary and tertiary industries in the municipal district. Taking 2008 as the base period, the actual output value is calculated by adjusting the value added index of the secondary and tertiary industries. In this paper, the non-desired output is regarded as the input variable introduced into the super-efficient production function, in which the non-desired output is the pollution emission, which is expressed by the urban sulfur dioxide emission.
4.3 Spatial and temporal evolution of LGUE
(1) Temporal change characteristics
According to the availability of data, this paper selects the data of 282 prefecture-level cities in China (including 113 resource-based cities and 169 non-resource-based cities), and uses the SFA to measure the LGUE. In terms of time, the main features are as follows. First, in general, the LGUE of both resource-type cities and non-resource-type cities improved significantly from 2008 to 2020. After removing the random disturbance term, China’s technological progress as well as its technological application capacity are improved, reducing the degree of inefficiency, thus greatly improving the LGUE. Second, compared with non-resource-based cities, the LGUE of resource-based cities is much lower than that of non-resource-based cities, and on average, the LGUE of resource-based cities is 20.4% lower than that of non-resource-based cities. The higher degree of dependence on resource-based industries and the unitary industrial structure of resource-based cities, and the greater consumption of environmental resources and land elements by this economic structure and the consequent lower efficiency, which is one of the key factors constraining the improvement of LGUE in resource-based cities.
(2) Spatial structure characteristics
According to the availability of data, resource-based cities in the sample are mainly concentrated in the central, northeastern and western regions. Using Arcgis software, this paper observe the spatial distribution of LGUE in resource-based cities and use non-resource-based cities as the comparative object (as shown in Figures 2, 3). In resource-based cities, LGUE is higher in the Northeast region, followed by the Central region, and lowest in the West region, i.e., showing a decreasing trend of Northeast > Central > West. In terms of time, compared with 2008, the LGUE of resource-based cities in 2020 has improved significantly, still showing a decreasing trend of Northeast > Central > West. Due to the serious missing data of some prefecture-level cities and states in the west, the observed non-resource-based cities are distributed in both the east, center and west regions. For non-resource-based cities, the LGUE in the eastern region is significantly higher than that of other cities, and the number of cities with higher LGUE in the eastern region increases significantly over time. By 2020, Chengdu-Chongqing, the middle reaches of the Yangtze River, and other cities in central and western in China also show a significant increase in LGUE.
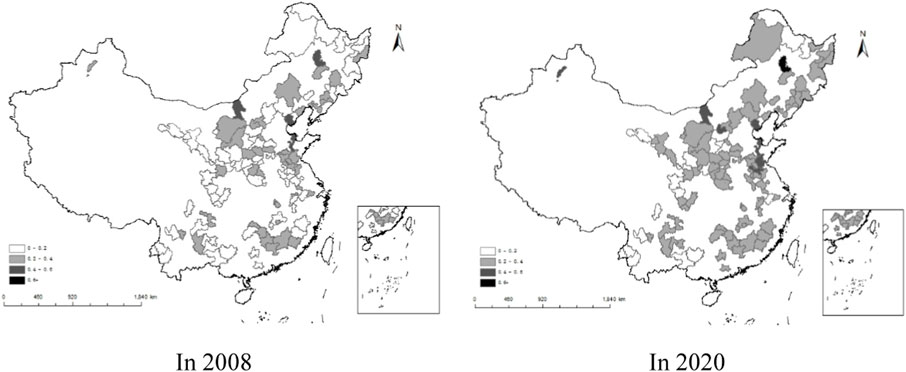
FIGURE 2. Evolution of the LGUE in resource-based cities.
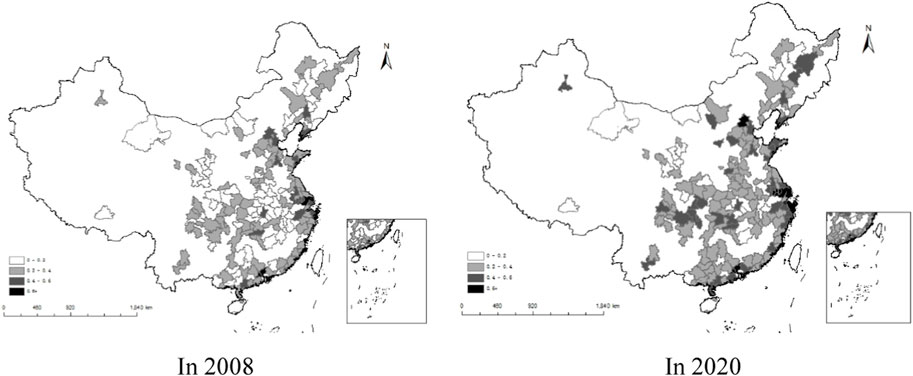
FIGURE 3. Evolution of the LGUE in non-resource-based cities. Note: Resource-based cities are established according to the National Sustainable Development Plan for Resource-based Cities (2013–2020) in China. The LGUE is divided into four grades based on 0–0.2, 0.2–0.4, 0.4–0.6, and 0.6+, and the darker the color indicates the higher the LGUE. Blank areas are areas with missing data.
5 Data description and research methods
5.1 Background of “Broadband China” policy
In order to solve the problems of slow network speed and unbalanced regional network development, and to promote the construction and development of network infrastructure, China’s State Council issued the “Broadband China” Strategy and Implementation Plan in August 2013, thus elevating broadband network construction to a national strategy. Subsequently, the Ministry of Industry and Information Technology (MIIT) and the National Development and Reform Commission (NDRC) jointly issued the Measures for the Administration of the Work of Creating “Broadband China” Demonstration Cities (City Clusters) (hereinafter referred to as the Measures), which were based on the indicators of household broadband access capacity, broadband penetration, cell phone penetration, and broadband subscriber penetration, etc., and were issued in three batches in 2014, 2015 and 2016. Finally, 120“Broadband China” demonstration cities (clusters) were selected in three batches.
The Measures clearly point out that “Broadband China” demonstration cities (city clusters) refer to those cities (city clusters) that have a good foundation for broadband development, have realized a significant increase in the level of broadband development in the region through the creation of demonstrations, and have a greater role in demonstrating and leading the overall level and mode of broadband development for the same kind of regions in the country. The focus of the construction of demonstration cities includes improving the speed and application level of broadband networks, promoting the continuous improvement of the broadband network industry chain, and enhancing the security guarantee capability of broadband networks, so as to promote the digital transformation of the cities through the construction of network infrastructures. Therefore, the “Broadband China” policy can be regarded as a quasi-natural experiment for this paper to analyze the impact of digital transformation on the LGUE.
5.2 DID model
In order to explore the impact of digital transformation of resource-based cities on the LGUE, the multi-period differences-in-differences model (DID) is constructed as shown in Eq. 3.
Where,
5.3 Data sources and treatment of variables
This paper selects Chinese cities as the initial sample of the study, deletes some cities with serious data missing, considers data availability, and finally obtains 113 resource-based cities from 2008 to 2020. The land green utilization efficiency was measured by the SFA method, some missing values were filled in by linear interpolation, and all variables were shrink-tailed at the bilateral 1% level in order to avoid the interference of extreme values on the empirical results. All data were obtained from the China Urban Statistical Yearbook.
In this paper, the relevant variables affecting the efficiency of green land use are controlled as follows. Population density is one of the key factors affecting the LGUE, and urban construction land resources should match the population flow, otherwise it may cause the problem of spatial mismatch of urban construction land. Therefore, this paper uses the number of population per square kilometer of urban area to reflect the population density (Popu). Economic growth also affects the LGUE, and the faster the economic growth rate, the greater the consumption of land resources and environmental resources by urbanization and industrialization. This paper uses the GDP growth rate (GDPr) to measure the economic growth rate. Industrial development is a direct factor affecting LGUE, which is measured by the proportion of the secondary industry in GDP in this paper (Struc). The degree of industrial agglomeration is also directly related to the LGUE, therefore the entropy of secondary industry location, i.e., the ratio of the proportion of city secondary industry employment to the regional total employment and the proportion of national secondary industry employment to the national total employment, is used to reflect the level of regional industrial agglomeration (Aggl). Whether foreign direct investment (FDI) affects land use has received extensive attention from scholars (Vongpraseuth and Choi, 2015; Wu and Heerink, 2016), and in order to control for its potential impact, a foreign direct investment indicator (FDI) is added to the regression model and measured by the intensity of actual utilization of foreign capital. In addition, this paper also controls for variables related to land use and environmental resources, including two indicators of the breadth of land development and utilization (Land) and the level of human habitat (Envi). Table 2 reports the results of descriptive statistics for the main variables for resource-based cities.
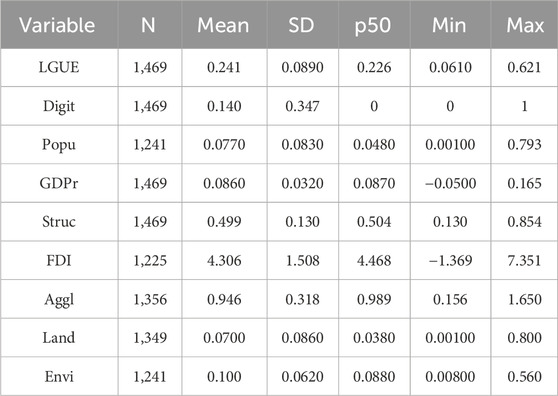
TABLE 2. Descriptive statistics results of variables for resource-based cities.
The left three columns of Table 3 report the mean values of the indicators and the significance of the differences between resource-based cities and non-resource-based cities. The results show that compared with non-resource-based cities, the LGUE of resource-based cities is low and significant at the 1% level. The population density, foreign direct investment, and breadth of land development and utilization in resource-based cities are lower than those in non-resource-based cities, but the average value of resource-based cities is higher in the proportion of secondary industry and industrial agglomeration, indicating that resource-based cities mainly develop the secondary industry and the industrial structure is relatively concentrated.
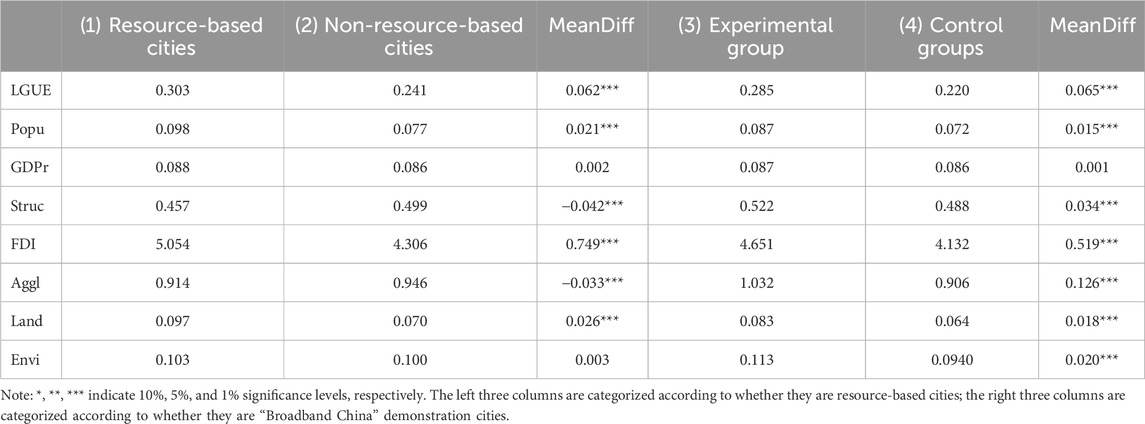
TABLE 3. Comparison of group differences of main variables.
The right three columns of Table 3 report the means and significance of differences between the experimental and control groups of resource-based cities. Depending on whether the city is recognized as a “Broadband China” city or not, the resource-based cities are divided into a digital transformation experimental group (Digit = 1) and a control group (Digit = 0). The results show that the mean value of the indicators of the experimental group is significantly higher than that of the control group, indicating that digital transformation has a significant impact on the LGUE, economic growth, industrial agglomeration and so on.
6 Results
6.1 Benchmark regression results
Table 4 reports the estimation results of the impact of digital transformation on LGUE. Column (1) does not control the relevant control variables, and column (2) adds control variables based on column (1). The results show that the coefficients of the impact of digital transformation on LGUE are significantly positive, indicating that the implementation of the “Broadband China” policy promotes the digital transformation of cities and improves the LGUE of resource-based cities. As a comparison, this paper also estimates the impact of digital transformation on LGUE in non-resource-based cities. The results of columns (3) and (4) in Table 4 show that the coefficients of digital transformation impact on LGUE in non-resource-based cities are significantly positive, but the coefficients are smaller than that of resource-based cities (0.000864 < 0.00118), which indicates that the effect of digital transformation on the improvement of LGUE is universal, but has a greater impact on resource-based cities. Therefore, it is particularly important for resource-based cities to accelerate the promotion of city digital transformation.
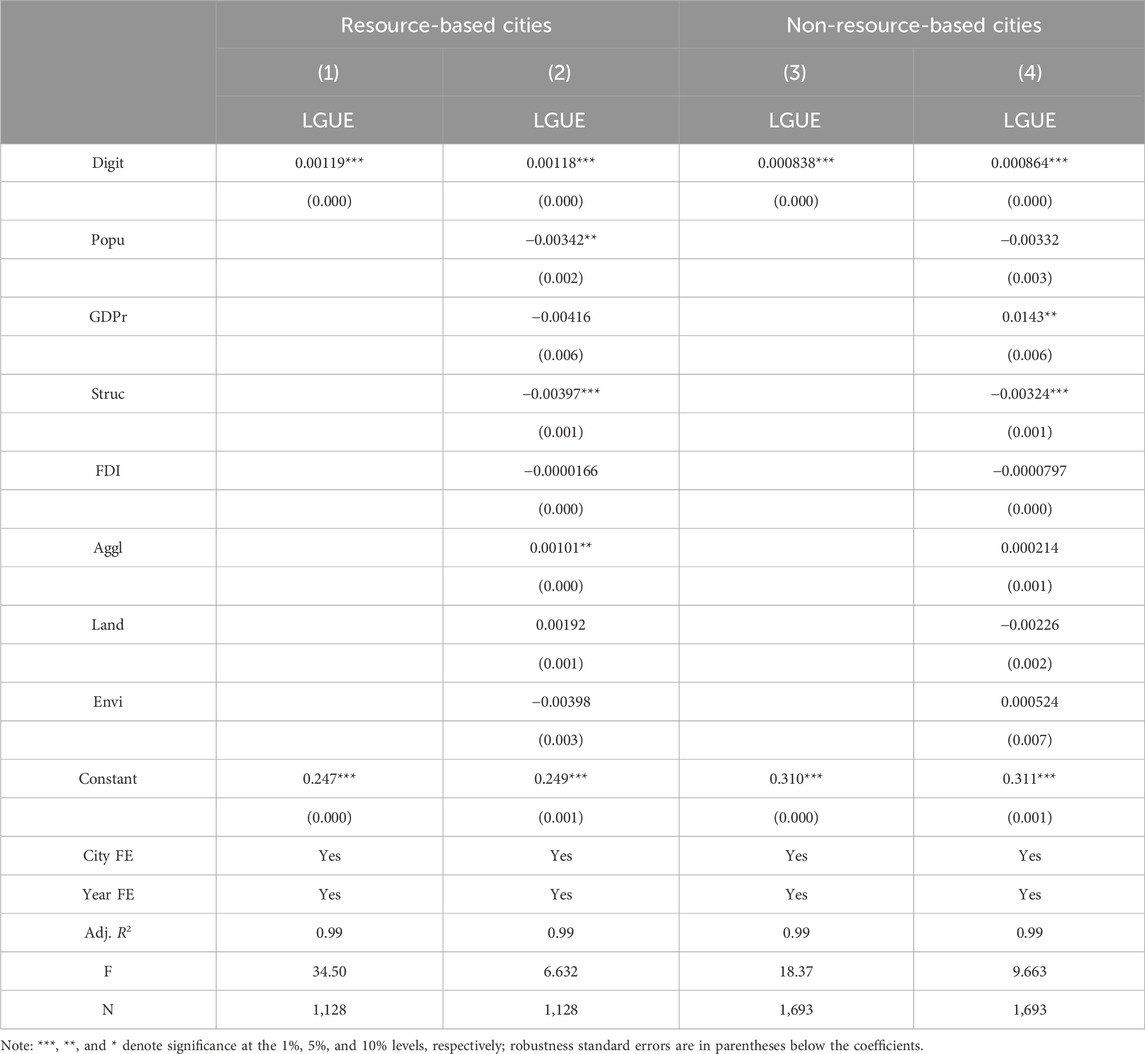
TABLE 4. Baseline regression results of digital transformation on LGUE.
From the perspective of control variables, the influence coefficient of the proportion of the secondary industry in GDP on the LGUE is positive, indicating that industrial production consumes more environmental resources, and promoting the upgrading of the industrial structure is crucial for the green utilization of urban land. For resource-based cities, the increase in population density inhibits the improvement of LGUE, but industrial agglomeration can improve LGUE. For non-resource-based cities, economic growth has a significant contribution to the improvement of LGUE, indicating that the output per unit of land resources increases significantly under certain other conditions, which helps to improve LGUE.
6.2 Parallel trend test and its dynamic effect analysis
Taking the “Broadband China” policy as the background, this paper uses the DID to test whether the digital transformation affects the LGUE, which needs to satisfy the parallel trend assumption. It needs to test that before the implementation of the “Broadband China” policy, the treatment group and the control group have a consistent trend of change in the LGUE. The parallel trend hypothesis test is carried out using the event study method, and the regression model is shown in Eq. 4.
Where,
Figure 4 shows the parallel trend test, the vertical axis is the size of the estimated coefficient of the impact of the “Broadband China” policy on LGUE in different periods, the horizontal axis is the relative time before and after the implementation of the “Broadband China” policy. 0 indicates the initial period of the implementation of the “Broadband China” policy, and the dotted lines above and below the hollow circles are the 95% confidence intervals. The results in the figure show that before the implementation of the “Broadband China” policy, the coefficients of the estimates is around the value of 0, which indicates that the parallel trend is satisfied. After the implementation of the “Broadband China” policy, digital transformation has a sustained positive impact on LGUE, and there is a lag in this impact.
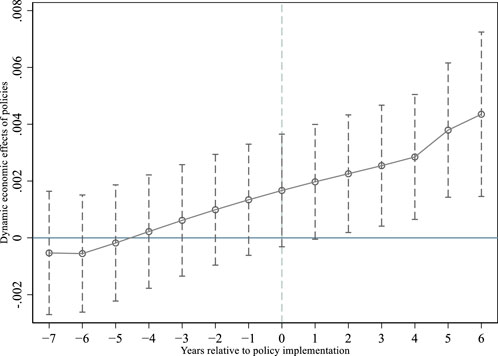
FIGURE 4. Parallel trend test for “Broadband China” policy.
6.3 PSM-DID estimation
The difference-in-difference based on propensity score matching (PSM-DID) can alleviate the problem of “selective bias” of the pilot policy to a certain extent, so this paper conducts a robustness test through the PSM-DID model. In order to avoid the loss of sample size after matching, this paper adopts one-to-two caliper nearest neighbor matching (Luo and Yuan, 2023). Estimation using this model needs to satisfy the balance test, i.e., after matching, the relevant control variables are not significantly different between the treatment and control groups. The results of the balance test in Figure 5 show that after matching, the difference in the means of the control variables between the treatment and control groups is not significant, implying that the balance test condition is satisfied.
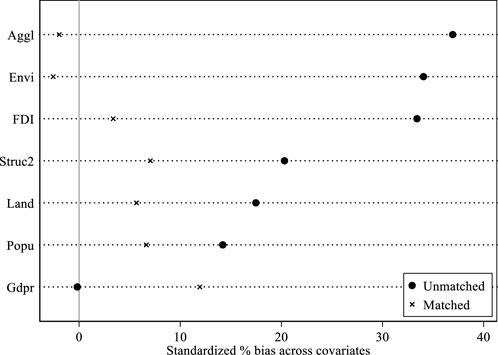
FIGURE 5. Balance test for propensity score matching.
Table 5 shows the estimation results under the conditions that the matching meets the com-mon support hypothesis and the weight is not null after matching. The estimated coefficients, significance, and direction of action of the model are in high agreement with the previous results, which indicates that the previous estimation results are robust.
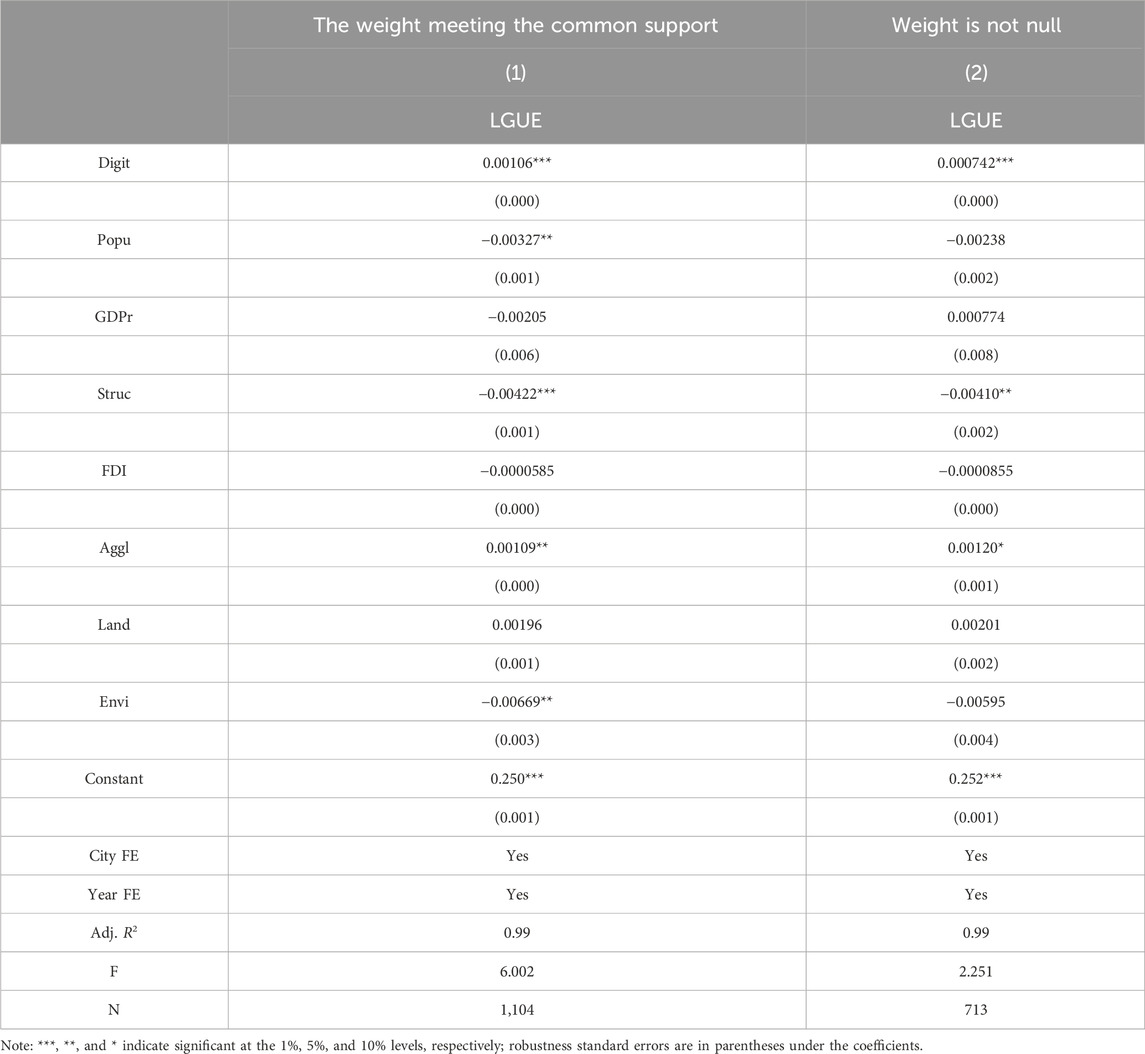
TABLE 5. PSM-DID estimation results.
6.4 Robustness tests
In order to test the robustness of the benchmark regression results, this paper also conducts robustness estimation in terms of replacing variables and replacing samples.
6.4.1 Replacement variables
For the explanatory variables, we use the Cobb-Douglas function to measure to get the LGUE (LGUE_cd) as a replacement variable. For the core explanatory variable digital transformation, reference to relevant studies (He et al., 2022), we adopt the PKU-DFIIC as a proxy variable to measure the level of digital transformation of each city (Digit_PKU), which is compiled by a joint research team composed of the Peking University Digital Financial Inclusion Index of China. Table 6 columns (1) and (2) report the estimation results after replacing the explanatory variables, respectively, which show that the coefficient of the effect of digital transformation on the LGUE remains significantly positive. Columns (3) and (4) of Table 6 report the estimation results after replacing the explanatory variables for digital transformation, which shows that the baseline regression results are robust after replacing the variables.
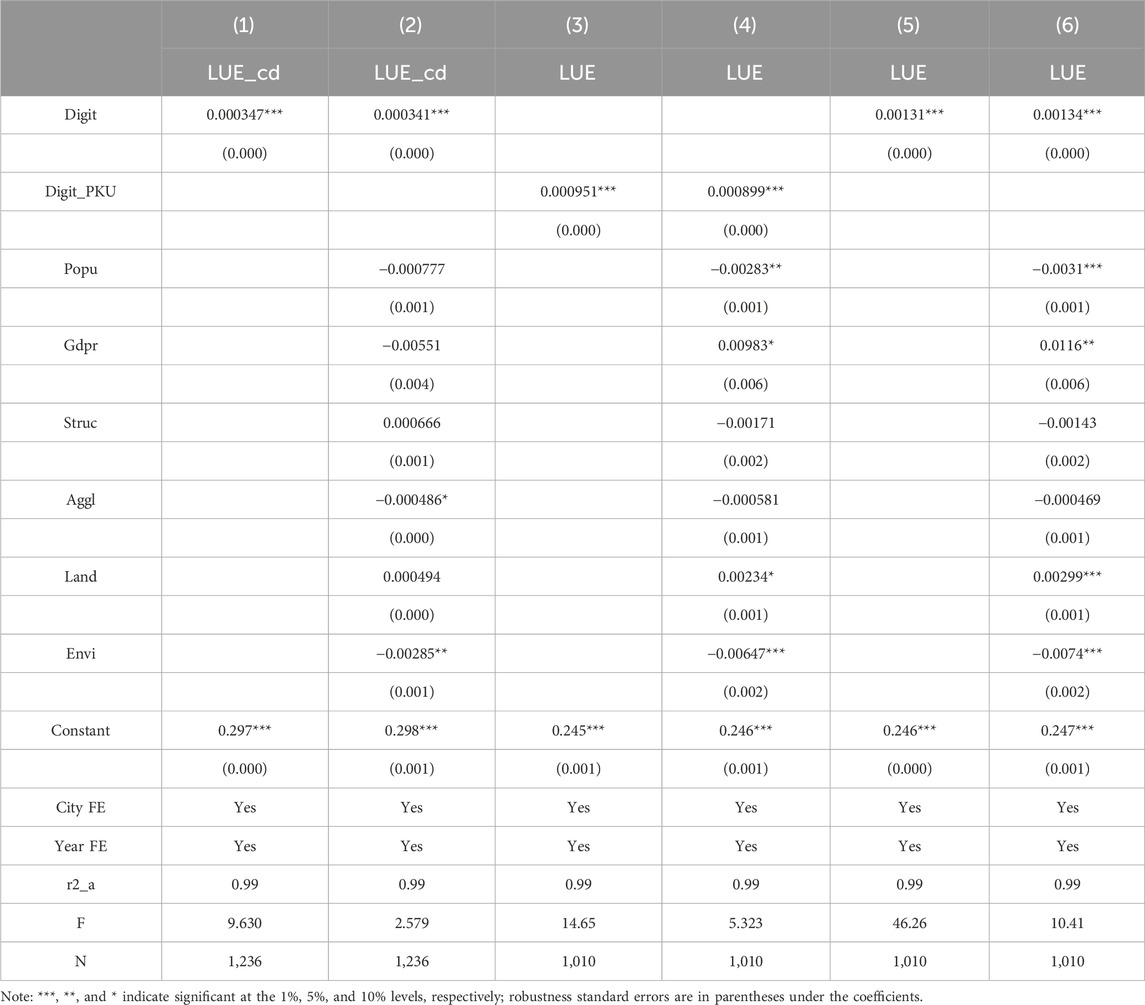
TABLE 6. Robustness test estimation results.
6.4.2 Replacement sample
Influenced by the subprime crisis in 2008, the Chinese government introduced macro-control policies of countercyclical adjustment in 2009, which had far-reaching impacts on both the real estate market and land use. In order to minimize the interference of the relevant policies on the regression results, this paper will keep the sample after 2011 for re-estimation. The estimation results after replacing the sample are reported in columns (5) and (6) of Table 6, which shows that the coefficient of the impact of digital transformation on the LGUE is still significantly positive.
6.5 Mechanism analysis of digital transformation affecting LGUE
The interaction term between digital transformation and mechanism variables is added to the baseline regression model as a way to test the impact of digital transformation on LGUE through mechanism variables, and the interaction term econometric model is constructed as shown in Eq. 5.
Where
6.5.1 Technological innovation
Theoretical analysis finds that the key to improve the LGUE is technological innovation and technological application capacity, and digital transformation plays an important role in reducing costs and increasing efficiency, thus contributing to technological innovation and the improvement of LGUE. In this paper, the number of patent applications is used to reflect the level of regional innovation. Column (1) of Table 7 reports the estimation results of the interaction term econometric model of digital transformation affecting LGUE through the mechanism of technological innovation. The result shows that the coefficient of the interaction term between digital transformation and technological innovation is significantly positive, indicating that the higher the level of technological innovation is, the greater the impact of digital transformation on LGUE, which means that the digital transformation significantly improves LGUE through technological innovation. Column (2) of Table 7 reports the estimated results of the interaction term between digital transformation and green innovation, and it can be seen that the coefficient of the interaction term is also significantly positive, which indicates that the digital transformation also affects the green innovation and reduces the consumption of the environmental resources by the economic agents, and in this way, enhances the LGUE.
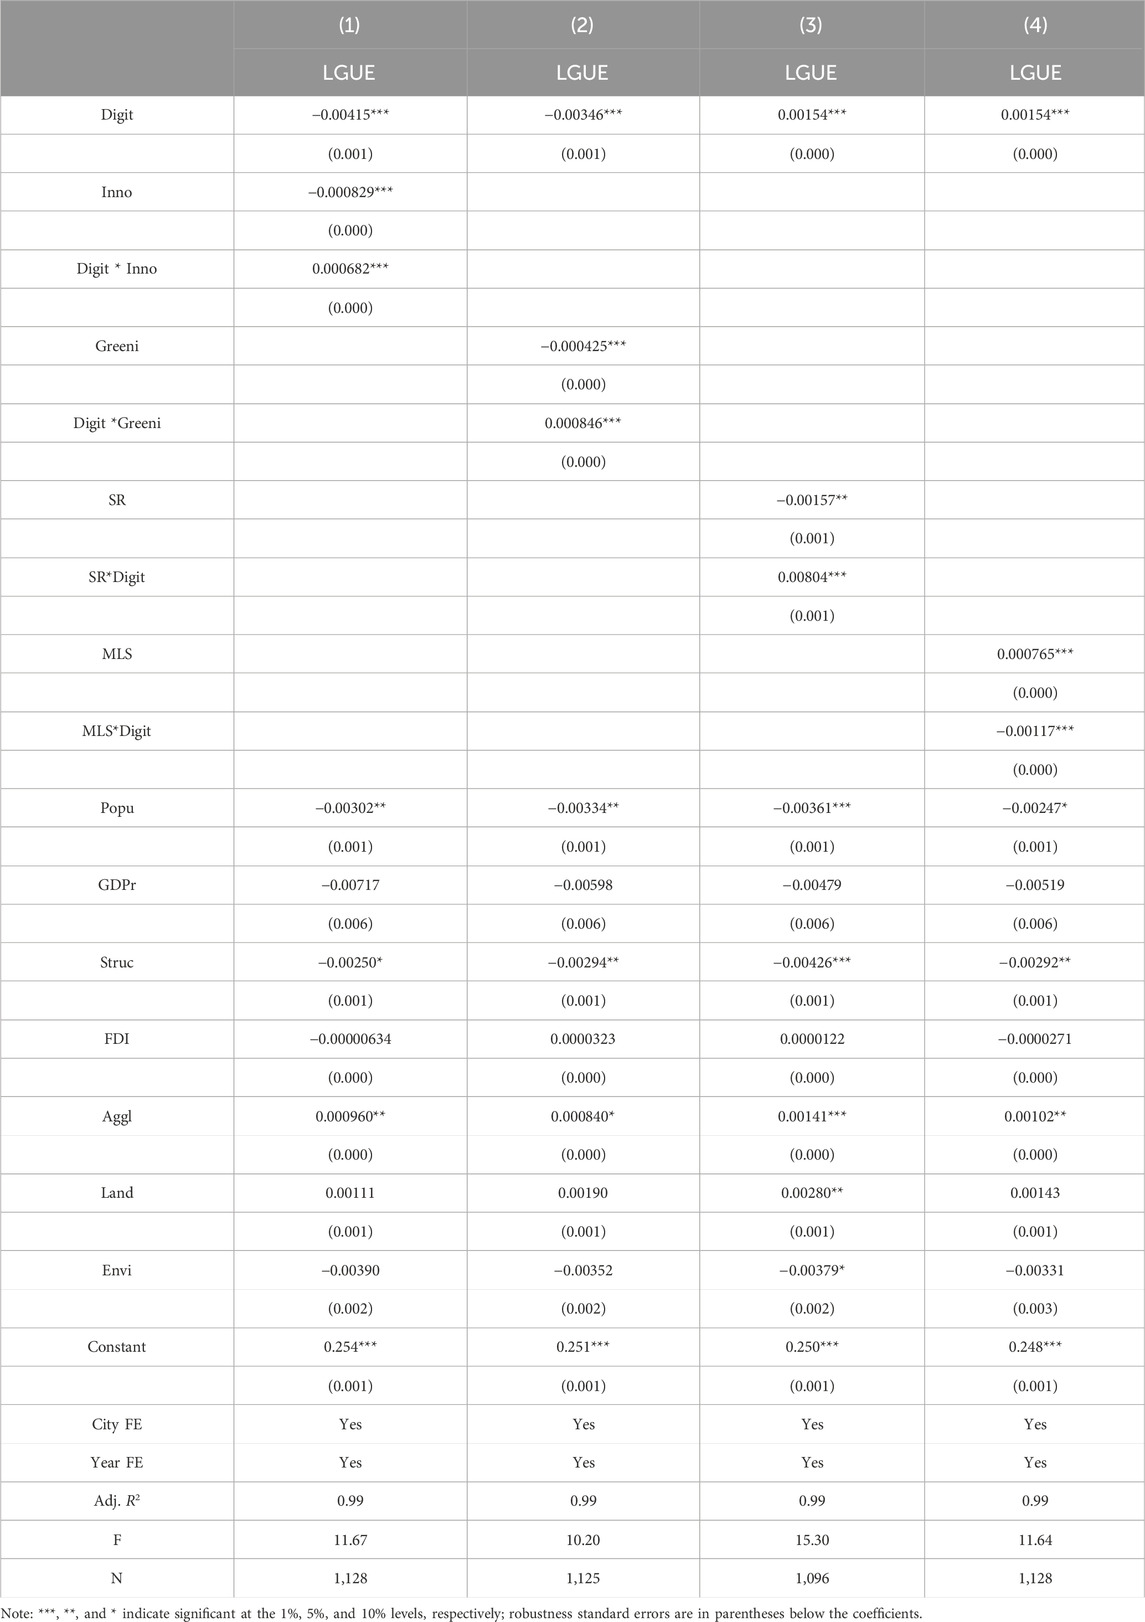
TABLE 7. Mechanism analysis of digital transformation affecting LGUE.
6.5.2 Industrial structure upgrading
The theoretical analysis points out that digital transformation not only drives new industries and new business forms such as intelligent transportation and digital governance, but also eliminates backward production capacity by improving efficiency, thus optimizing industrial structure and improving LGUE. Industrial structure upgrading is a dynamic process of rational allocation of resources among industries, i.e., the reallocation of resources from low-productivity sectors to high-productivity sectors. Under the condition of free flow of production factors, the higher the degree of coupling between input and output structures, the higher the resource allocation effect, which is often manifested in more mature industrial development stages and higher productivity levels. Therefore, industrial structure rationalization index is generally used to characterize industrial structure upgrading. In this paper, the degree of industrial structure rationalization is measured by the Theil index, and the specific calculation formula is shown in Eq. 6.
Where j denotes the industrial classification by three sub-industries, n = 1,2,3.
Column (3) of Table 7 reports the estimation results of the interaction term econometric model of digital transformation affecting the LGUE through the mechanism of industrial structure upgrading. It is found that the coefficient of the interaction term between digital transformation and industrial structure upgrading is significantly positive, indicating that the more reasonable the industrial structure is, the greater the impact of digital transformation on LGUE, which implies that digital transformation promotes the improvement of LGUE through industrial structure upgrading.
6.5.3 Land resource mismatch
To a large extent, land policy directly affects land allocation and land utilization efficiency. In most areas of China, the power of land use approval is concentrated in the central and provincial governments, which makes it difficult for local governments to effectively allocate land resources according to their own level of economic development and population resources, thus forming a spatial mismatch of land resources. Therefore, this paper constructs the index of the misallocation of land resources (MLS), as shown in Eq. 7.
where
Column (4) of Table 7 reports the estimation results of the interaction term econometric model of digital transformation and land resource mismatch. The results show that the coefficient of the interaction term is significantly negative, indicating that the larger the land resource mismatch is, the smaller the effect of digital transformation on the LGUE is, which means that the land resource mismatch inhibits the promotion effect of digital transformation on the LGUE. Therefore, improving land resource mismatch by increasing the level of digital transformation is the key to improving the LGUE. Digital transformation not only reduces the transaction costs of land transactions, but also provides the ability to improve government governance to adjust land policies as a way to improve the spatial mismatch of land resources.
7 Discussion
In this paper, the SFA method is used to measure the LGUE of resource-based cities in China, and it is found that compared with non-resource-based cities, the LGUE of resource-based cities is even lower, which is 20.4% lower than that of non-resource cities on average. This indicates that it is urgent to improve the green land use efficiency of resource cities. Chen et al. (2019) also obtained similar conclusions and found that industrial land in resource cities faces the problem of inefficient utilization (Chen et al., 2019b). Ge and Liu (2021) study also concluded that the land use problem of resource cities is more prominent because of the more extensive use of land and serious deterioration of the ecological environment (Ge and Liu, 2021). The study in this paper further explores how to improve the dilemma of land use efficiency based on measuring the LGUE in resource-based cities.
Theoretically, based on the stochastic frontier model, this paper constructs a theoretical framework for analyzing LGUE, and explores how to improve LGUE from the perspective of digital transformation. It is found that the factors driving land green utilization efficiency mainly include technology application capacity and technological progress. In a related study, Tang et al. (2022) also found that technology utilization efficiency is the main constraint on land use efficiency (Tang et al., 2022). Tang and Chen (2022) found that digital construction can effectively improve the green use efficiency of regional arable land, confirming the favorable contribution of digital transformation to land use (Tang and Chen, 2022). In addition, some studies have found that digitization of land use planning affects the level of stakeholder engagement and influence, and influences the innovation efficiency and productivity of cities (Hersperger et al., 2022; Adade and Vries, 2023; Kyriakopoulou and Picard, 2023), exploring the impact of digitization on innovation. On this basis, this paper further analyzes and finds that digital transformation is not only conducive to technological innovation and technological application capabilities, but also helps to improve the efficiency of land allocation, which is an advantageous factor to alleviate the dilemma of LGUE in resource-based cities.
Empirically, this paper takes the “Broadband China” model city policy as a quasi-natural experiment, and uses the DID method to identify the impact of digital transformation on LGUE, and the results confirm that digital transformation effectively improves the land utilization efficiency of resource cities. Wang et al. (2023) used the DID model to analyze the impact of the construction of new energy demonstration cities on land use efficiency, and found that this policy mainly enhances land use efficiency through the upgrading of industrial structure (Wang et al., 2023). Liu et al. (2021) study also explored the impact of industrial structure optimization on land use efficiency (Liu et al., 2021). Unlike these studies, which analyze based on the industrial structure perspective, this paper explores and discusses the impact of digital transformation on the LGUE through technological advancement, technological application capacity and land allocation.
8 Conclusion
Enhancing LGUE in resource-based cities is an important way to alleviate land resource tension and guarantee food security. This paper utilizes the SFA to measure the LGUE of resource-based cities in China, and finds that overall the LGUE of resource-based cities in China has gradually improved, but there is still a certain gap with non-resource-based cities. There is still a large room for improvement in the LGUE of resource-based cities. From a spatial point of view, the LGUE of resource-based cities shows a decreasing trend of Northeast > Central > West. Enhancing the land-use efficiency of resource-based cities is crucial for developing countries, especially China, which has a large population and tight land resources. Therefore, resource-based cities should pay more attention to land utilization efficiency, on the one hand, exchange idle land with developed provinces in the east to improve the value of land utilization. On the other hand, resource-based cities should learn from the development experience of the eastern developed region, and improve the efficiency of green land utilization in terms of industrial structure, regional planning and other aspects.
Based on the realistic problem of how to improve the land use efficiency of resource cities, this paper explores the impact of digital transformation on the LGUE of resource-based cities based on the broadband China policy using the DID method. It is found that digital transformation significantly improves the LGUE of resource-based cities. In terms of the mechanism of action, digital transformation affects the LGUE of resource-based cities by promoting technological innovation, upgrading industrial structure, and mitigating land factor mismatch. The conclusion is an important revelation for how to realize industrial structure upgrading and improve land resource allocation efficiency in resource-based cities. This paper argues that it is important to increase continue to increase the construction of digital infrastructure and promote the digital industrialization of cities and the digitalization of industries. It is necessary to guide and encourage the in-depth integration of traditional industries with digital technology, attract more investment in digital enterprises, and vigorously improve the digitalization level of resource-based cities, so as to promote the industrial transformation of resource-based cities and improve the efficiency of land use.
Existing studies have focused more on the impact of digitization on the utilization efficiency of arable land, as well as the economic effects brought about by the digitization of land use planning (Hersperger et al., 2022; Tang and Chen, 2022; Adade and Vries, 2023; Kyriakopoulou and Picard, 2023), and there is a lack of studies that explore resource-based cities’ industrial transformation and improvement of land use efficiency from a digital transformation perspective to explore land use in resource-based cities. This paper uses the SFA model to measure the LGUE in resource-based cities, and explores the impact of digital transformation on the LGUE based on the Broadband China policy, which bridges the research gap in this field. However, this paper has not yet explored in depth how resource-based cities realize digital transformation and lacks research on the micro-mechanisms to improve land use efficiency. In the next study, we will measure the digitalization indicators more accurately from the micro enterprise level and the macro city level, examine the heterogeneity analysis of digital transformation on land green use efficiency from the digitalization type, industrial structure, policy factors, etc., and summarize the experience of digital transformation in resource cities through case studies.
Data availability statement
Publicly available datasets were analyzed in this study. This data can be found here: http://www.stats.gov.cn/ and the China Urban Statistical Yearbook.
Author contributions
QQ: Conceptualization, Resources, Supervision, Writing–original draft. SL: Conceptualization, Methodology, Software, Supervision, Visualization, Writing–original draft, Writing–review and editing.
Funding
The author(s) declare financial support was received for the research, authorship, and/or publication of this article. This study was supported by the National Social Science Foundation of China (21CJY041), the Social Science Foundation of Hunan Province of China (21YBQ120).
Conflict of interest
The authors declare that the research was conducted in the absence of any commercial or financial relationships that could be construed as a potential conflict of interest.
Publisher’s note
All claims expressed in this article are solely those of the authors and do not necessarily represent those of their affiliated organizations, or those of the publisher, the editors and the reviewers. Any product that may be evaluated in this article, or claim that may be made by its manufacturer, is not guaranteed or endorsed by the publisher.
References
Adade, D., and Vries, W. T. d. (2023). Digital twin for active stakeholder participation in land-use planning. Land 12 (3), 538. doi:10.3390/land12030538
Aigner, D., Lovell, C. K., and Schmidt, P. (1977). Formulation and estimation of stochastic frontier production function models. J. Econ. 6 (1), 21–37. doi:10.1016/0304-4076(77)90052-5
Bertani, F., Ponta, L., Raberto, M., Teglio, A., and Cincotti, S. (2021). The complexity of the intangible digital economy: an agent-based model. J. Bus. Res. 129, 527–540. doi:10.1016/j.jbusres.2020.03.041
Bouwman, H., Nikou, S., and de Reuver, M. (2019). Digitalization, business models, and SMEs: how do business model innovation practices improve performance of digitalizing SMEs? Telecommun. Policy 43 (9), 101828. doi:10.1016/j.telpol.2019.101828
Chen, W., Chen, W., Ning, S., Liu, E. n., Zhou, X., Wang, Y., et al. (2019b). Exploring the industrial land use efficiency of China's resource-based cities. Cities 93 (93), 215–223. doi:10.1016/j.cities.2019.05.009
Chen, W., Chen, W., Ning, S., Liu, E.-n., Zhou, X., Wang, Y., et al. (2019a). Exploring the industrial land use efficiency of China's resource-based cities. Cities 93, 215–223. doi:10.1016/j.cities.2019.05.009
Chen, Y., Chen, Z., Xu, G., and Tian, Z. (2016). Built-up land efficiency in urban China: insights from the general land use plan (2006–2020). Habitat Int. 51, 31–38. doi:10.1016/j.habitatint.2015.10.014
Chung, Y. H., Färe, R., and Grosskopf, S. (1997). Productivity and undesirable outputs: a directional distance function approach. J. Environ. Manag. 51 (3), 229–240. doi:10.1006/jema.1997.0146
Dong, Y., Jin, G., and Deng, X. (2020). Dynamic interactive effects of urban land-use efficiency, industrial transformation, and carbon emissions. J. Clean. Prod. 270, 122547. doi:10.1016/j.jclepro.2020.122547
Erkut, B. (2020). From digital government to digital governance: are we there yet? Sustainability 12 (3), 860. doi:10.3390/su12030860
Ge, X. J., and Liu, X. (2021). Urban land use efficiency under resource-based economic transformation—a case study of Shanxi Province. Land 10 (8), 850. doi:10.3390/land10080850
Hao, X., Li, Y., Ren, S., Wu, H., and Hao, Y. (2023). The role of digitalization on green economic growth: does industrial structure optimization and green innovation matter? J. Environ. Manag. 325, 116504. doi:10.1016/j.jenvman.2022.116504
He, C., Qiu, W., and Yu, J. (2022). Clinical efficacy and safety of surgery combined with 3D printing for tibial plateau fractures: systematic review and meta-analysis. Front. Environ. Sci. 10, 403. doi:10.21037/atm-21-7008
Hersperger, A. M., Thurnheer-Wittenwiler, C., Tobias, S., Folvig, S., and Fertner, C. (2022). Digitalization in land-use planning: effects of digital plan data on efficiency, transparency and innovation. Eur. Plan. Stud. 30 (12), 2537–2553. doi:10.1080/09654313.2021.2016640
Hoyer, W. D., Chandy, R., Dorotic, M., Krafft, M., and Singh, S. S. (2010). Consumer cocreation in new product development. J. Serv. Res. 13 (3), 283–296. doi:10.1177/1094670510375604
Huang, X., and Song, Y. (2019). Evaluation model of regional resource and environment comprehensive carrying capacity based on the conjugation-wrestling mechanism. J. Nat. Resour. 34, 2103. doi:10.31497/zrzyxb.20191007
Jia, S., Wang, C., Li, Y., Zhang, F., and Liu, W. (2017). The urbanization efficiency in Chengdu City: an estimation based on a three-stage DEA model. Phys. Chem. Earth, Parts A/B/C 101, 59–69. doi:10.1016/j.pce.2017.05.003
Jorgenson, D. W., and Stiroh, K. J. (2000). US economic growth at the industry level. Am. Econ. Rev. 90 (2), 161–167. doi:10.1257/aer.90.2.161
Kleis, L., Chwelos, P., Ramirez, R. V., and Cockburn, I. (2012). Information technology and intangible output: the impact of IT investment on innovation productivity. Inf. Syst. Res. 23 (1), 42–59. doi:10.1287/isre.1100.0338
Koroso, N. H., Zevenbergen, J. A., and Lengoiboni, M. (2020). Urban land use efficiency in Ethiopia: an assessment of urban land use sustainability in Addis Ababa. Land Use Policy 99, 105081. doi:10.1016/j.landusepol.2020.105081
Kyriakopoulou, E., and Picard, P. M. (2023). The Zoom city: working from home, urban productivity and land use. J. Econ. Geogr. 23 (6), 1397–1437. doi:10.1093/jeg/lbad025
Li, J., Huang, X., Chuai, X., and Yang, H. (2021b). The impact of land urbanization on carbon dioxide emissions in the Yangtze River Delta, China: a multiscale perspective. Cities 116, 103275. doi:10.1016/j.cities.2021.103275
Li, Q., Liu, S., Yang, M., and Xu, F. (2021a). The effects of China's sustainable development policy for resource-based cities on local industrial transformation. Resour. Policy 71, 101940. doi:10.1016/j.resourpol.2020.101940
Li, Z., and Wang, J. (2022). The dynamic impact of digital economy on carbon emission reduction: evidence city-level empirical data in China. J. Clean. Prod. 351, 131570. doi:10.1016/j.jclepro.2022.131570
Liu, J., Hou, X., Wang, Z., and Shen, Y. (2021a). Study the effect of industrial structure optimization on urban land-use efficiency in China. Land Use Policy 105, 105390. doi:10.1016/j.landusepol.2021.105390
Liu, P., and Ravenscroft, N. (2017). Collective action in implementing top-down land policy: the case of Chengdu, China. Land Use Policy 65, 45–52. doi:10.1016/j.landusepol.2017.03.031
Liu, S., Xiao, W., Li, L., Ye, Y., and Song, X. (2020). Urban land use efficiency and improvement potential in China: a stochastic frontier analysis. Land Use Policy 99, 105046. doi:10.1016/j.landusepol.2020.105046
Liu, S., Ye, Y., Li, L., and Xiao, W. (2021b). Research on urban land use efficiency in China based on the stochastic frontier analysis. J. Nat. Resour. Chin. 36 (5), 1268–1281. doi:10.31497/zrzyxb.20210514
Liu, Y. (2018). Introduction to land use and rural sustainability in China. Land use policy 74, 1–4. doi:10.1016/j.landusepol.2018.01.032
Liu, Y., Fang, F., and Li, Y. (2014). Key issues of land use in China and implications for policy making. Land use policy 40, 6–12. doi:10.1016/j.landusepol.2013.03.013
Lu, X., Pan, J., and Chen, Y. (2006). Sustaining economic growth in China under energy and climate security constraints. China and World Econ. 14 (6), 85–97. doi:10.1111/j.1749-124x.2006.00047.x
Lu, X., Qu, Y., Sun, P., Yu, W., and Peng, W. (2020). Green transition of cultivated land use in the Yellow River Basin: a perspective of green utilization efficiency evaluation. Land 9 (12), 475. doi:10.3390/land9120475
Lu, X., Shi, Z., Li, J., Dong, J., Song, M., and Hou, J. (2022). Research on the impact of factor flow on urban land use efficiency from the perspective of urbanization. Land 11 (3), 389. doi:10.3390/land11030389
Luo, S., and Yuan, Y. (2023). The path to low carbon: the impact of network infrastructure construction on energy conservation and emission reduction. Sustainability 15 (4), 3683. doi:10.3390/su15043683
Ma, Q., Tariq, M., Mahmood, H., and Khan, Z. (2022). The nexus between digital economy and carbon dioxide emissions in China: the moderating role of investments in research and development. Technol. Soc. 68, 101910. doi:10.1016/j.techsoc.2022.101910
Martinez-Fernandez, C., Wu, C. T., Schatz, L. K., Taira, N., and Vargas-Hernández, J. G. (2012). The shrinking mining city: urban dynamics and contested territory. Int. J. Urban Regional Res. 36 (2), 245–260. doi:10.1111/j.1468-2427.2011.01094.x
Masini, E., Tomao, A., Barbati, A., Corona, P., Serra, P., and Salvati, L. (2019). Urban growth, land-use efficiency and local socioeconomic context: a comparative analysis of 417 metropolitan regions in Europe. Environ. Manag. 63, 322–337. doi:10.1007/s00267-018-1119-1
Oliveira, L., Fleury, A., and Fleury, M. T. (2021). Digital power: value chain upgrading in an age of digitization. Int. Bus. Rev. 30 (6), 101850. doi:10.1016/j.ibusrev.2021.101850
Peng, C., Song, M., and Han, F. (2017). Urban economic structure, technological externalities, and intensive land use in China. J. Clean. Prod. 152, 47–62. doi:10.1016/j.jclepro.2017.03.020
Ramanathan, R. (2005). An analysis of energy consumption and carbon dioxide emissions in countries of the Middle East and North Africa. Energy 30 (15), 2831–2842. doi:10.1016/j.energy.2005.01.010
Ribeiro-Navarrete, S., Botella-Carrubi, D., Palacios-Marqués, D., and Orero-Blat, M. (2021). The effect of digitalization on business performance: an applied study of KIBS. J. Bus. Res. 126, 319–326. doi:10.1016/j.jbusres.2020.12.065
Schweisfurth, T. G. (2017). Comparing internal and external lead users as sources of innovation. Res. policy 46 (1), 238–248. doi:10.1016/j.respol.2016.11.002
Su, J., Su, K., and Wang, S. (2021). Does the digital economy promote industrial structural upgrading? a test of mediating effects based on heterogeneous technological innovation. Sustainability 13 (18), 10105. doi:10.3390/su131810105
Tan, K. H., and Zhan, Y. (2017). Improving new product development using big data: a case study of an electronics company. R&D Manag. 47 (4), 570–582. doi:10.1111/radm.12242
Tan, S., Hu, B., Kuang, B., and Zhou, M. (2021). Regional differences and dynamic evolution of urban land green use efficiency within the Yangtze River Delta, China. Land Use Policy 106, 105449. doi:10.1016/j.landusepol.2021.105449
Tang, X., Sheng, L., and Zhou, Y. (2022). Exploring complex urban growth and land use efficiency in China’s developed regions: implications for territorial spatial planning. Front. Earth Sci. 16 (4), 1040–1051. doi:10.1007/s11707-022-0973-6
Tang, Y., and Chen, M. (2022). The impact mechanism and spillover effect of digital rural construction on the efficiency of green transformation for cultivated land use in China. Int. J. Environ. Res. Public Health 19 (23), 16159. doi:10.3390/ijerph192316159
Torrey, B. B., and Jolly, C. L. (1993). Population and land use in developing countries: report of a workshop. Washington, DC: National Academy Press.
Vongpraseuth, T., and Choi, C. G. (2015). Globalization, foreign direct investment, and urban growth management: policies and conflicts in Vientiane, Laos. Land Use Policy 42, 790–799. doi:10.1016/j.landusepol.2014.10.003
Wang, M., Lin, N., Dong, Y., and Tang, Y. (2023). How does new energy demonstration city policy promote urban land use efficiency in China? The mediating effect of industrial structure. Land 12 (5), 1100. Ethics approval and consent to participate Not applicable. Consent for publication Not applicable. doi:10.3390/land12051100
Wu, H., Hu, S., and Hu, S. (2023). How digitalization works in promoting corporate sustainable development performance? The mediating role of green technology innovation. Environ. Sci. Pollut. Res. 30 (8), 22013–22023. doi:10.1007/s11356-022-23762-7
Wu, Y., and Heerink, N. (2016). Foreign direct investment, fiscal decentralization and land conflicts in China. China Econ. Rev. 38, 92–107. doi:10.1016/j.chieco.2015.11.014
Xie, R., Yao, S., Han, F., and Zhang, Q. (2022). Does misallocation of land resources reduce urban green total factor productivity? An analysis of city-level panel data in China. Land Use Policy 122, 106353. doi:10.1016/j.landusepol.2022.106353
Yu, J., Zhou, K., and Yang, S. (2019). Land use efficiency and influencing factors of urban agglomerations in China. Land Use Policy 88, 104143. doi:10.1016/j.landusepol.2019.104143
Keywords: land green use efficiency, digital transformation, resource-based cities, “Broadband China” policy, stochastic frontier analysis
Citation: Qian Q and Luo S (2024) The dilemma of land green use efficiency in resource-based cities: a perspective based on digital transformation. Front. Environ. Sci. 12:1339928. doi: 10.3389/fenvs.2024.1339928
Received: 17 November 2023; Accepted: 15 January 2024;
Published: 26 January 2024.
Edited by:
Chenxi Li, Xi’an University of Architecture and Technology, ChinaReviewed by:
Xin Long Xu, Hunan Normal University, ChinaYuanyuan Hao, Jiangsu University of Technology, China
Copyright © 2024 Qian and Luo. This is an open-access article distributed under the terms of the Creative Commons Attribution License (CC BY). The use, distribution or reproduction in other forums is permitted, provided the original author(s) and the copyright owner(s) are credited and that the original publication in this journal is cited, in accordance with accepted academic practice. No use, distribution or reproduction is permitted which does not comply with these terms.
*Correspondence: Shuangcheng Luo, bHVvX3NjQDE2My5jb20=