 Lili Dong1*†
 Yiquan Wang
 Xiang Cheng
- 1School of Architecture and Urban Planning, Chongqing Jiaotong University, Chongqing, China
- 2Chongqing Key Laboratory of Germplasm Innovation and Utilization of Native Plants, Chongqing, China
- 3Chongqing Landscape and Gardening Research Institute, Chongqing, China
- 4School of Architecture and Urban Planning, Chongqing University, Chongqing, China
- 5Key Laboratory of the Ministry of Education of Mountainous City and Towns Construction and New Technology, Chongqing University, Chongqing, China
- 6Department of Architecture, The University of Kitakyushu, Kitakyushu, Fukuoka, Japan
Along with urbanization and industrialization, carbon emissions have been increasing significantly, resulting in global warming. Green space has been widely accepted as a natural element in cities to directly increase carbon sinks and indirectly reduce carbon emissions. The quantification of carbon benefits generated by green space is an important topic. This paper aims to provide a comprehensive review of the methods for measuring carbon sinks of green spaces. The results indicate that existing assessment methods can accurately estimate the carbon sinks in green spaces at large scales. However, existing methods are not fully applicable to studies of urban green spaces, due to the low precision of research results. The assimilation method is the most suitable method to study the carbon sequestration efficiency of plants and can project the carbon sinks of urban green spaces at large scales through macroscopic means. Even though, the results of assimilation experiments are unstable under different weather conditions. To address existing research challenges, this paper proposes a photosynthetic rate estimation method based on the light-response curve which is an efficient method to describe the relationship between light intensity and net photosynthetic rate in studying plant physiological characteristics. The newly proposed method, through integrating net photosynthesis-light response curves and urban light intensity associated with meteorological data, has advantages of short measurement time and ensuring standardized experimental environment for result comparability. Overall, this study is important to combine meteorology and plant physiology to propose a photosynthetic rate estimation method for optimizing carbon sink measurement in urban green spaces. The method is more convenient for application for its simple experimental process and result comparability. In practice, this study provides guidance for low-carbon urban green space planning and design, and helps to promote energy conservation and emission reduction through nature-based solutions.
1 Introduction
1.1 Urbanization, greenhouse gas emission, and global warming
With the predominant industrialization and urbanization, the construction of urban infrastructure and land use changes have dramatically replaced natural ecosystem areas (He et al., 2021), resulting in significant environmental deterioration, economic losses, social challenges, and public health issues (Li K. et al., 2023; He, 2023; Wei et al., 2023). Addressing such challenges have been a consensus of the public, governments and organizations (Liu X. et al., 2023). Even though, cities are highly dependent on heavy fossil-fuel use. Authorities estimate that fossil fuel combustion accounts for 90% of total CO2 emissions in 2023 (Friedlingstein et al., 2023), resulting in a rapid rise in atmospheric concentrations of greenhouse gases on Earth, ultimately causing global warming (Gao et al., 2021; Shen and Zhao, 2024). For example, a 1.1°C increase in global average temperature worldwide presents the largest increase in the last 1,000 years (Intergovernmental Panel On Climate Change, 2023). Furthermore, it is reported that the urbanization has contributed to one-quarter of the average annual temperature increase of Guangdong Province in the last 70 years (Zhong et al., 2023). The atmospheric studies in Guangdong, Hong Kong, and Macao in China have concluded that greenhouse gases are the most important determinants of future average and extreme temperatures (Zheng et al., 2022).
The global atmospheric CO2 concentration in 2022 will be about 1.5 times that of the pre-industrial revolution, in addition to total global CO2 emissions of about 40.9 billion tons in 2023, of which China will be the largest emitter, accounting for about 35% of the total emissions (Friedlingstein et al., 2023). Cities only cover 3% of the Earth’s surface, but they are now representing more than 55% of the global population. Moreover, the spatial distribution of carbon emissions in cities are much higher than rural counterparts, indicating that cities and their adjacent regions are among the highest contributors to carbon emissions (Figure 1). In China, the situation is more alerting since urban areas contribute as much as 90% of national carbon emissions (Li, 2010). With this background, the United Nations Framework Convention on Climate Change was signed by more than 150 countries in 1992, in order to collectively maintain atmospheric greenhouse gas concentrations at a stable level. The 2015 Paris Agreement requires all signatory nations to reduce their greenhouse gas emissions. In September 2020, China explicitly set a double carbon target for 2030 in order to achieve carbon neutrality by 2060.

FIGURE 1. Global distribution of total carbon emissions in 2022 (source: Global carbon atlas).
1.2 Significance of green spaces for climate change mitigation
Achieving carbon neutrality generally involves two primary approaches: carbon emission reduction and carbon sink augmentation. Carbon reduction is the ability of green spaces to reduce energy consumption in buildings, transportation, etc., by improving the microclimate of the space. The carbon sequestration is to increase the carbon sequestration capacity of greenfield plants, with a focus on strengthening the ecological construction and protection of urban green spaces. The terrestrial biosphere shows significant potential for carbon sequestration. The studies indicate that in China, the terrestrial biosphere annually sequestered an average of approximately 1.11 (±0.38) ×109 tons of carbon dioxide between 2010 and 2016, roughly equivalent to 45% of the concurrent annual anthropogenic carbon dioxide emissions (Wang J. et al., 2020). Urban green spaces represent primary green ecological resources in densely populated and economically developed urbanized regions. These spaces also constitute the main natural carbon sinks within urban ecosystems and possess a unique ability for self-purification and self-regulation. It is demonstrated that urban green space contributes to improving urban environmental quality by sequestering carbon (Nowak et al., 2018). This is mainly manifested through vegetation employing photosynthesis to reduce atmospheric CO2 while releasing O2 (Russo et al., 2014), playing a crucial role in regulating the balance of atmospheric carbon and oxygen, and enhancing urban environmental quality.
Urban greenspace ecosystem comprises individual plant entities within the city, and its carbon sequestration capacity relies on the carbon sequestration abilities of vegetation. Urban green space vegetation serves as the main component of urban greenspace carbon sinks. Through photosynthesis and respiration within their leaves, plants accumulate a net carbon amount, sequestrating CO2 within the vegetation, soil, and water bodies, thereby reducing atmospheric CO2 concentrations (Dong and He, 2023). Moreover, urban green spaces effectively mitigate heat islands (Liu H. et al., 2023), decrease urban energy use, and thereby reduce urban carbon emission. Plants play a dual role of reducing CO2 emissions and increasing CO2 sequestration, making them the primary carbon sink in landscape architecture (Bao, 2011). Overall, ecosystem carbon sequestration, including urban greening carbon sinks, has become a focal task in the top-level design of China’s efforts toward achieving carbon neutrality. To address warming challenges, it is essential to include more carbon sinks during urban planning and design to sequestrate greenhouse gases such as CO2 and CH4, as well as to alleviate environmental deterioration such as urban flooding and heat islands. Quantitative analysis of the carbon sequestration capacity of plants is an important research topic since it not only comprehensively demonstrates their carbon sequestration and oxygen release abilities and influencing factors but also provides the basis for creating, designing, managing, and improving urban natural carbon sinks. Furthermore, the quantitative analysis aids in scientifically selecting tree species for urban green spaces in a low-carbon era, offering theoretical references for strong carbon sink plant configurations, ecological landscape construction, and the development of eco-friendly urban landscapes. Overall, the quantification of green space carbon sink potential is a crucial means for alleviating global greenhouse and heat island effects, serving as a key player in supporting sustainable urban development and mitigating climate change.
2 Green space carbon sink: progress and status
In 1992, the United Nations General Assembly defined the process, activities, and mechanisms to remove CO2 from the atmosphere as carbon sink. Green carbon sink, accordingly, involves the release of oxygen through plant photosynthesis, absorption of atmospheric CO2, and its sequestration within vegetation and soil, thereby reducing CO2 concentration in the atmosphere (Dong and He, 2023). Carbon sequestration is the process of capturing and securely storing carbon, as an alternative to directly emitting CO2 into the atmosphere. A fundamental principle of plant carbon sequestration is that green plants utilize chlorophyll and other photosynthetic pigments under visible light for their growth requirements, converting CO2 and H2O into organic compounds, while releasing O2 to maintain the balance of carbon and oxygen in the air. Note that plants can absorb only atmospheric CO2 through photosynthesis (King et al., 2012) so that converting carbon sink quantity into CO2 absorption is a more direct chemical quantification method. The capacity of plants to absorb atmospheric CO2 depends primarily on the intensity of their photosynthetic activity which is often represented by the photosynthetic rate. The photosynthetic rate refers to the speed at which photosynthesis sequestrates CO2 (or generates oxygen). The net photosynthetic rate signifies the organic matter accumulated through plant photosynthesis and is derived by subtracting the respiration rate from the total photosynthetic rate, serving as a determinant of a plant’s carbon-fixing ability (Wang et al., 2014). It is commonly measured by a portable photosynthesis system (PPS).
Studies on plant carbon sequestration began in the 1960s and has gradually grown into an important research topic over the past decade, yielding significant accomplishments. For instance, in 1991, Rowntree and Nowak estimated the carbon stock of urban forests across the United States (Rowntree and Nowak, 1991) and concluded that green spaces could sequester CO2 by regulating local urban conditions such as temperature and humidity. Subsequently, estimates of annual carbon sequestration in urban green spaces were conducted (Nowak et al., 2002; Pataki et al., 2006), enlightening many studies on urban ecosystem carbon storage. Presently, research on the carbon sink potential of garden plants primarily involves macro-scale estimations (i.e., the methods of sample plot measurement, model calculations, remote sensing (RS) estimation, and micrometeorological) and micro-scale measurements (e.g., assimilation) (Figure 2). However, these estimations are different in methods, accuracy levels, and requirements.
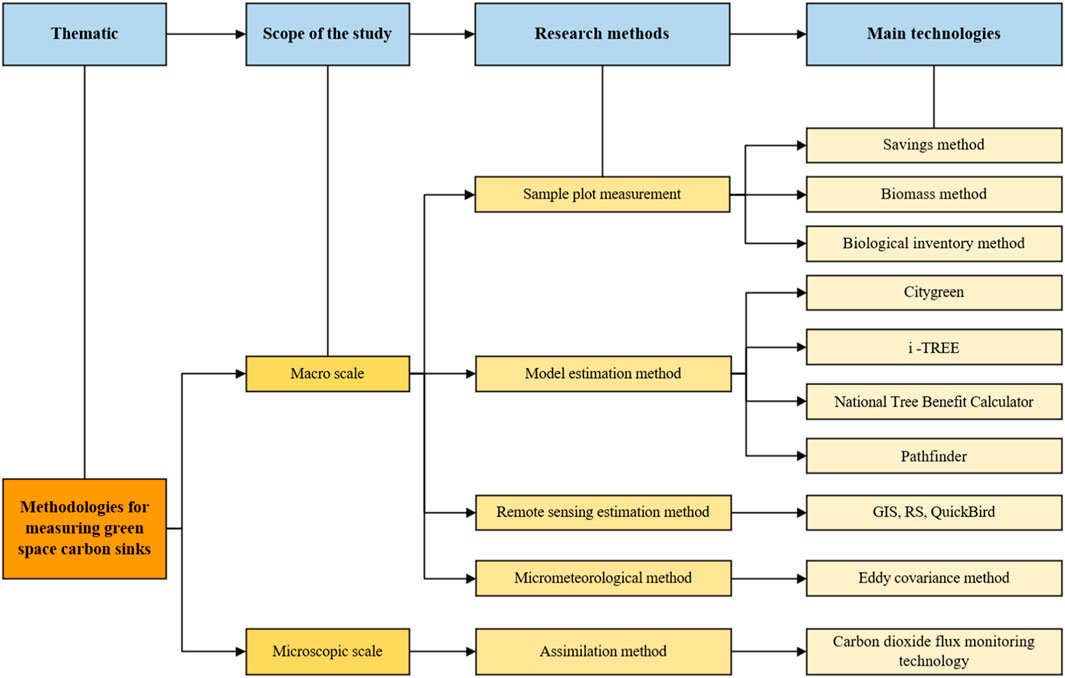
FIGURE 2. Summary of research methods and techniques.
At macro scale, the research is primarily focused on carbon sequestration and storage quantification in extensive ecological systems (e.g., forests), from the perspective of plant carbon storage capacity in the agricultural and forestry-related domains (Houghton et al., 1985). Regarding the total carbon storage estimation of urban or natural green spaces, the macro-level approaches allow people to understand the carbon sink benefits of ecosystems, and thereby support and formulate urban forestry policies (Garcia-Gonzalo et al., 2007). Empirically, relevant studies were found before 2010, focusing on quantifying carbon sequestration in vegetation within green spaces (Paw U et al., 2004), yet macroscopic research methods were unable to estimate the net production within ecosystems or plants (López et al., 2010). Nevertheless, these methods are used as a basis for developing process-based simulations and models. Physiological measurements using infrared gas analyzers for CO2 assimilation in plant leaves and branches, complemented by leveraging Earth observation technologies (e.g., satellite data), are used to extrapolate these measurements to larger scales (Holifield Collins et al., 2008).
At micro scale, primarily from the perspective of plant physiological characteristics, the quantification of carbon sequestration in plants during the process of photosynthesis is carried out by directly measuring flux difference using PPS to quantify their carbon sequestration. Since the 1950s, infrared CO2 gas analyzers have been widely employed, with a fundamental principle of calculating net photosynthetic rate by measuring the difference in the CO2 concentration entering the leaf stomata. These analyzers have shown innovation in measurement accuracy, efficiency, applicability, and data storage and are particularly suitable for outdoor measurements. Therefore, the assimilation method has been widely used for quantifying carbon sequestration of individual plants.
2.1 Sample plot measurement
Sample plot measurement refers to an estimation method of setting up sample plots in typical areas with good forest growth and conducting continuous observation in the sample plots to obtain the changes in carbon stocks per unit time (Zhou et al., 2013). This method quantifies growth over time, considering the time when plants start growing until the time of their harvest. It is mainly applied to investigating the carbon sink potential of macro-scale green spaces. There has been a long history of sample plot measurement application, mainly in forestry and agricultural production, and it is a well suggested method by the IPCC for forest carbon sink assessment (Ouyang et al., 1999). This approach estimates the carbon sequestration of plants by harvesting and weighing all aboveground and belowground organic matter within sampling plots. The average values from these plots were used to estimate the biomass of the entire forest or individual plants, which were then converted into an average annual carbon sequestration rate for green vegetation.
In practical applications, it often involves the use of highly accurate measured data obtained from standard tree analysis to construct ecological indicators and biomass growth equations (Lee et al., 2014). For instance, the relationship between diameter at breast height (DBH), tree height and age indicators of trees was utilized to develop an allometric growth equation to estimate the carbon sequestration capacity of forests (Zhang et al., 2019). The biomass method acquires measured data through extensive field surveys to assess the biomass of plants at different time and measure their photosynthetic intensity. Overall, it is now the most commonly used method for calculating forest carbon storage because of its direct, explicit, and technically straightforward advantages. However, it has several limitations, such as destructive experimentation, inability for continuous observation, difficulty in accounting for root production and litterfall, and complex processing procedures.
2.2 Model estimation method
The model estimation method, based on a plot inventory, is a convenient and precise approach suitable for quantifying carbon sequestration of urban green spaces in large areas or urban regions. By the end of the 21st century, leveraging big data systems, the United States Forest Service, systematically analyzed and developed several convenient plant carbon sequestration calculation systems. At current, the widely utilized systems include Citygreen, the NTBC (National Tree Benefit Calculator), Pathfinder, and the I-Tree Eco. These models receive extensive application in assessing the ecological benefits of urban green spaces. For instance, the Citygreen calculation system, in conjunction with on-site surveys, has been employed to estimate the total carbon sequestration of green spaces in cities like Shenzhen (Chen et al., 2009), Shanghai (Xu, 2010), and Shenyang (Liu et al., 2008). And quantification of carbon sequestration benefits of green space plants in Nanjing residential area using NTBC (Li Q. et al., 2023). The I-Tree Eco module has been used in cities in the United Kingdom (Monteiro et al., 2019), the United States (Ning et al., 2016), Thailand (Intasen et al., 2017), and Hungary (Kiss et al., 2015) to assess the ecological value of urban green spaces. Moreover, the I-Tree Eco can estimate the carbon sequestration of individual plants based on specific characteristics. Overall, these estimation systems estimate carbon sequestration on a large regional scale by considering vegetation characteristics, meteorological data, site features, greenspace area, and surrounding environments so that the results are comprehensive. However, it is important to note that the physiological, ecological, and climatic parameters of the associated models were calibrated based on the U.S. conditions. Consequently, when such methods are applied to regions with different ecological systems and climatic conditions, substantial errors may occur. Therefore, these models are primarily suitable for use in areas with geographical and climatic conditions similar to those in the United States, upon some essential validation.
2.3 Remote sensing (RS) estimation method
The RS method, using satellite remote sensing to acquire various vegetation status parameters, offers the advantage of rapid, real-time, and large-scale data acquisition. It can well address the limitations of model-based estimations. The basic principle is to obtain various parameters of vegetation within the survey areas by sensing techniques on the basis of ground survey, and to estimate the impact of changes in land use and green space coverage on carbon stocks through spatial classification of vegetation and analysis of time series. Sensing-based assessments of net ecosystem productivity (NEP) are widely applied in carbon sink studies at regional and urban scales, such as some studies utilized QuickBird, RS and GIS to estimate the annual CO2 uptake per tree in Los Angeles (Mcpherson et al., 2008), and combined LiDAR with QuickBird to estimate carbon stocks in urban trees (Schreyer et al., 2014). Meanwhile, there are studies on the use of remote sensing-based explicit forest carbon stock calculation models to realize high-resolution mapping of forest carbon stocks at large scales and dynamic monitoring of forest carbon sinks globally (Zhu et al., 2024), as well as the combination of ground-based measurements and LiDAR data to estimate the carbon stocks of urban trees (Gülin and Bosch, 2021). Research on the surface carbon storage of urban green spaces in Auckland also used LiDAR data combined with field surveys, suggesting that this approach not only provided more accurate data but also reduced the frequency and cost of actual measurements (Wang V. et al., 2020). This is because the method can offer detailed information on plant biomass in complex urban areas (Alonzo et al., 2014). However, due to the spatial heterogeneity and temporal dynamics of urban green spaces, the use of RS estimation methods for estimating carbon storage may encounter challenges like the inability to accurately determine plant quantity and difficulties in separating overlapping tree canopy boundaries (Richardson and Moskal, 2014). In addition, individual ecological differences among species can also lead to significant errors.
2.4 Micrometeorological method
The micrometeorological method is based on microclimate monitoring and involves continuous dynamic monitoring of near-surface atmospheric flow conditions and atmospheric CO2 concentrations. This approach indirectly estimates the carbon flux of vegetation (Liu et al., 2018). It focuses on the quantitative study of carbon dioxide and water exchange between the atmosphere and terrestrial ecosystems (Grimmond et al., 2002). In Phoenix, the micrometeorological method was adopted, revealing that CO2 concentrations at midday were lower than before sunrise mainly due to the strong sunlight at midday which promotes photosynthesis in vegetation (Idso et al., 1998), while in Essen using mobile measurement, it was shown that CO2 concentrations in the city were lower in summer months given vegetation photosynthesis and other effects (Henninger and Kuttler, 2010). The micrometeorological method can accurately estimate regional-scale carbon fluxes, with eddy covariance being the most commonly used method. For instance, Velasco et al. used the eddy covariance method to show that urban CO2 concentrations are lower during the daytime during the plant growing season, mainly due to the high photosynthetic capacity of plants at this time of year (Velasco and Roth, 2010), similar to the conclusion reached by Rana et al. (2021). Although the micrometeorological method allows for continuous in-situ observations, the unstable near-surface atmosphere and replicated topographic conditions can introduce significant errors into the results (Wilson et al., 2002). For example, atmospheric inversion and data from the Shangri-La observation point in the complex terrain of the Hengduan Mountains resulted in higher estimated data (Wang J. et al., 2020). The micrometeorological method also relies on site-specific observations and cannot represent carbon flux values for the entire region. At the regional scale, there are challenges related to low spatial resolution, making it difficult to differentiate the carbon sink amounts for different ecosystems (Piao et al., 2022).
2.5 Assimilation method
The assimilation method is a micro-scale research method. Since leaves are the most important organs for photosynthesis in trees, the assimilation method calculates plant carbon sequestration by determining the instantaneous net photosynthetic rate per unit of leaf area from the instantaneous CO2 concentration of the leaves and the change in water content. Infrared Carbon Dioxide Gas Analyzers have been widely used from the 1950s to the present day, and the basic principle of their work is to calculate the net photosynthetic rate by determining the difference in CO2 concentration entering leaf stomata. Measurements of photosynthesis rates of Wisconsin field species in the 1990s were an early application of the use of PPS to measure net photosynthetic rates of plants (Reich et al., 1995). By the end of 20th century, some studies reported the adoption of a photosynthesis meter to quantify plant photosynthetic intensity in a representative urban green space in Guangzhou and estimated the CO2 uptake of the plants through the reaction equation of the photosynthesis process (Yang, 1996). Using infrared gas analyzers, measurement of the annual carbon dioxide uptake by urban plants in Korea was conducted, resulting in an empirical formula for future estimation. Furthermore, Han proposed a method for calculating plant carbon sequestration and oxygen release using the net assimilation rate formula (Han, 2005). The assimilation method experiment requires only a small amount of plant leaves, making it friendly to plants and widely applicable, and it has been employed in studies on common garden plants in locations such as West Bengal (Biswas et al., 2014), Rome (Gratani et al., 2016), and Fuzhou (Wang, 2010).
The assimilation method directly measures the carbon sequestration capacity of a single plant, and the results are accurate, allowing a direct comparison of carbon sequestration benefits among different plants. However, its outcomes are significantly influenced by temporal and spatial factors. This is attributed to the rhythmic cyclical variations in the photosynthetic rate of plant leaves, which systematically fluctuate with diurnal and seasonal changes. The primary rationale behind these fluctuations is the close relationship between photosynthetic rates and physiological and ecological environmental conditions such as atmospheric temperature, relative humidity, and solar radiation (Figure 3) (Evans and Santiago, 2011). For instance, the impact of vertical illumination results in peak solar radiation and daylight duration during the summer in the northern hemisphere, leading to a noticeable increase in carbon fixation by plants during this season compared to others. Although winter exhibits relatively weaker carbon fixation capacity throughout the year, the method still remains a high efficiency (Weissert et al., 2017). Moreover, air with higher relative humidity enhances stomatal conductivity in plant leaves, thereby elevating the rate of photosynthesis (Wang et al., 2019). These conditions necessitate labor-intensive hourly measurements of plant photosynthetic rates and impose significant requirements on weather conditions.
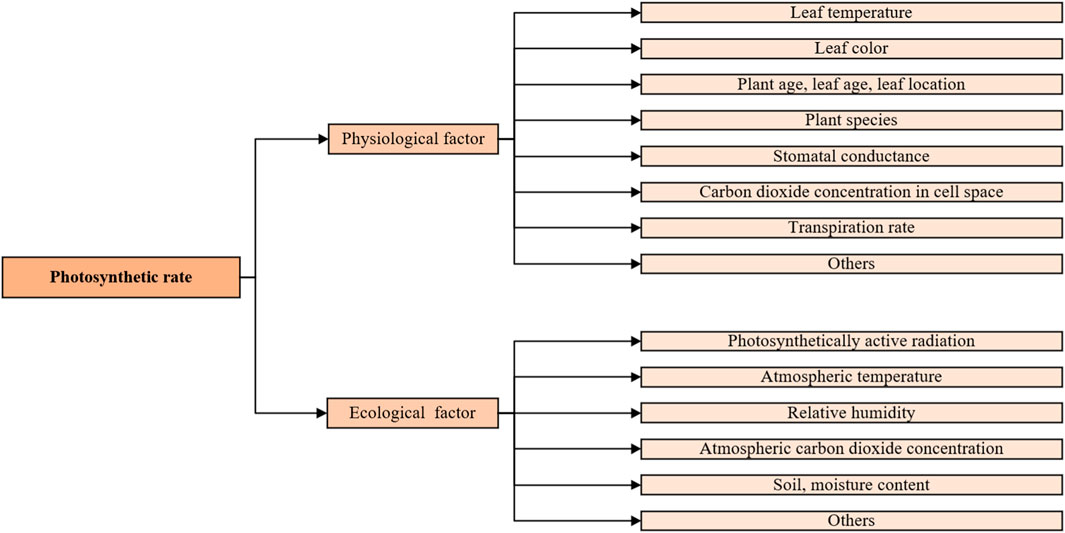
FIGURE 3. Photosynthesis-related influencing factors.
2.6 Summary
Whilst there have been many methods for urban green space carbon sink estimation, the advantages and disadvantages of each method are distinct (Table 1). Furthermore, there is no direct way to quantify carbon sinks in urban green spaces, and existing studies on urban green space carbon sink often employ methodologies developed for forest carbon sink (Gratani et al., 2016). Urban green spaces, primarily composed of artificial greenery, differ significantly from natural green spaces such as forests and grasslands. Urban green spaces also exhibit high heterogeneity, with plant species determined by early urban planning, incorporating both local and introduced species. This prominent contrast with naturally evolved green spaces implies that carbon sink in urban green spaces is more complex (Zhao et al., 2023). Therefore, existing methods for green space carbon sequestration may not be entirely applicable to urban settings. The sample plot measurement suitable for large-scale natural environments like forests, faces limitations in regions with diverse tree species distributions, rendering standard plots dissimilar to the entire region. Moreover, its destructive nature, involving irreversible vegetation removal, makes it unsuitable for urban green spaces designed and constructed through human planning. Explorations into non-destructive methods, such as the biomass method, for studying carbon sequestration in Bangkok park green spaces have been undertaken (Singkran, 2022), and the use of remote sensing to quantify and map forest structure to estimate forest above-ground biomass to quantify carbon stocks and fluxes in tropical forests (Mohd Zaki and Abd Latif, 2017), these studies explore additional possibilities for the sample plot inventory method.
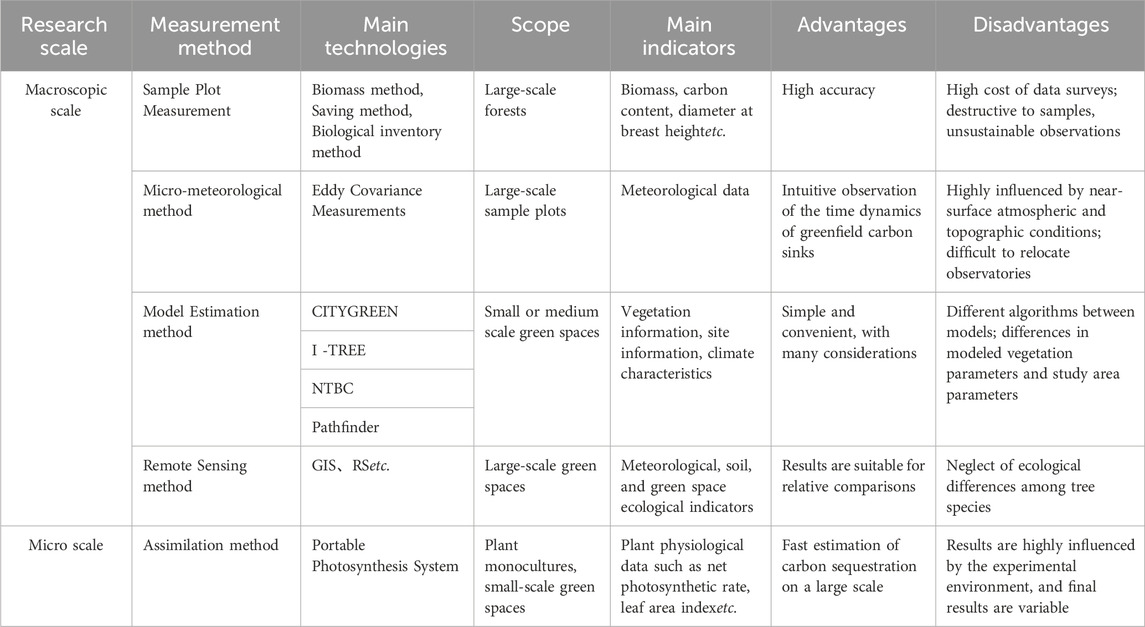
TABLE 1. Methodologies for estimating carbon sinks in green spaces.
Micrometeorological methods demonstrate high accuracy in regional-scale estimations but are sensitive to variations in urban spatial characteristics, leading to significant errors in different regions. Results from these methods reflect carbon sequestration at the regional scale and cannot discern individual plant carbon sequestration at a finer level. Model estimation incorporates green space information from similar regions into the model for estimation, potentially introducing errors due to ecological differences between regions. RS estimates carbon sequestration by calculating various green quantity indicators from satellite imagery, but the considerable variations in carbon sequestration benefits among different plant species result in two-dimensional indicators that may not fully reflect the actual carbon sequestration benefits of urban green spaces. Assimilation method is the most accurate way to quantify the benefits of plant carbon sequestration, but its results may include large errors owning to experimental weather fluctuations. Moreover, scattered distributions of tree species in the experiment require a long period of time, resulting in limitations of labor dependence. The assimilation amount method is only for single plant scale, so that extensive sample plant data should be carried out when facing the large-scale urban green spaces.
3 Proposal of a prediction method for photosynthetic rate
Existing macroscopic studies, except for assimilation quantities, are limited to estimating carbon sinks and stocks for the current green space as a whole. They are unable to quantify and compare the carbon sinks of individual plants within these green spaces. Therefore, the relevant results and findings are of limited significance in providing guidance on construction of urban green spaces. The assimilation method is the most commonly used and accurate method for studying individual plant carbon sequestration. The results can guide the subsequent planning of tree species in urban green spaces. However, the assimilation method is greatly influenced by weather conditions such as light and temperature, and the results under different weather conditions are not comparable. Therefore, ongoing research should explore more convenient and precise measurement methods.
There have been some studies to utilize a photosynthesis model from natural green spaces at similar latitudes to simulate carbon sequestration through photosynthesis (Soegaard and MLler-Jensen, 2003; Helfter et al., 2010). However, results from non-urban green spaces may not be applicable to urban green spaces due to environmental disparities. Moreover, it is also revealed that plant leaf nitrogen concentration (N) is positively proportional to its net photosynthetic rate and leaf area (Mu and Chen, 2021). Since leaf nitrogen measurements require less time and can be amplified to regional and global scales by satellite sensors (Knyazikhin et al., 2012), there are good potentials to use leaf nitrogen concentration as an indirect estimate of photosynthetic carbon sequestration (Giacomo et al., 2005). However, measurements of leaf nitrogen should be conducted in the laboratory and is not suitable for experiments involving a large variety of tree species. A novel approach based on spatial and temporal dynamic analysis was proposed to study the carbon sequestration and oxygen release capacity of tree species (Chen, 2020). This approach reduces the error of the results due to the difference in experimental time and geographical area. However, the indicators required in this method include not only conventional net photosynthetic rates but also light-response curve, chlorophyll content, etc. Although the data accuracy is high, the experimental process is complex and therefore not practical for application.
Since the plant photosynthetic rate has some intrinsic relationships with internal and external factors, an estimation model can be established through the regression relationship between the photosynthetic rate and the main factors. The photosynthetic rate of plants is primarily influenced by intrinsic physiological factors of the plant itself and external ecological variations. However, intrinsic physiological factors are not artificially controllable and can only be simulated and estimated by altering the experimental environment. The annual variation in plant photosynthetic rates is predominantly driven by changes in temperature and light intensity associated with seasons. At diurnal scales, the variation is primarily determined by changes in photosynthetically active radiation (PAR) (Weissert et al., 2017), where in evergreen broadleaf forests, CO2 concentration decreases with increasing PAR values, and temperature, relative humidity, and CO2 concentration show insignificant relationships with plant photosynthetic rates. Among these factors, PAR stands out as the most significant factor, while temperature and relative humidity are also greatly influenced by light intensity (Guo, 2012).
Some studies adopt the Farquhar model to fit data and demonstrate an empirical model based on the significant linear relationships between net photosynthetic rate and PAR, deriving (Zhang et al., 2013). Given the maturity of studies on PAR in meteorology, it can be calculated from meteorological observation station data. Accordingly, PAR can be derived as a singular influential factor for predicting plant photosynthetic rates, serving as the basis for a photosynthetic rate prediction model. Specific methods include manual control of light intensity in the leaf chamber, using the light control accessory of the Photosynthesis Measurement System (PMS) to measure the photosynthetic rate of the plant at different light intensities, in order to establish a regression relationship. Typically, existing studies show that there is a significant correlation between the test results of artificially controlled light intensity and actual light intensity under different light geographic conditions (He, 2010). Therefore, this approach can obtain the photosynthetic rate estimation model through a short testing time, which solves the problems of long hourly testing cycle and distinct results in different testing environments. As a result, this paper proposes to simplify the calculation of plant carbon sequestration benefits by establishing a predictive model through the regression relationship between photosynthesis rate and PAR (Figure 4).
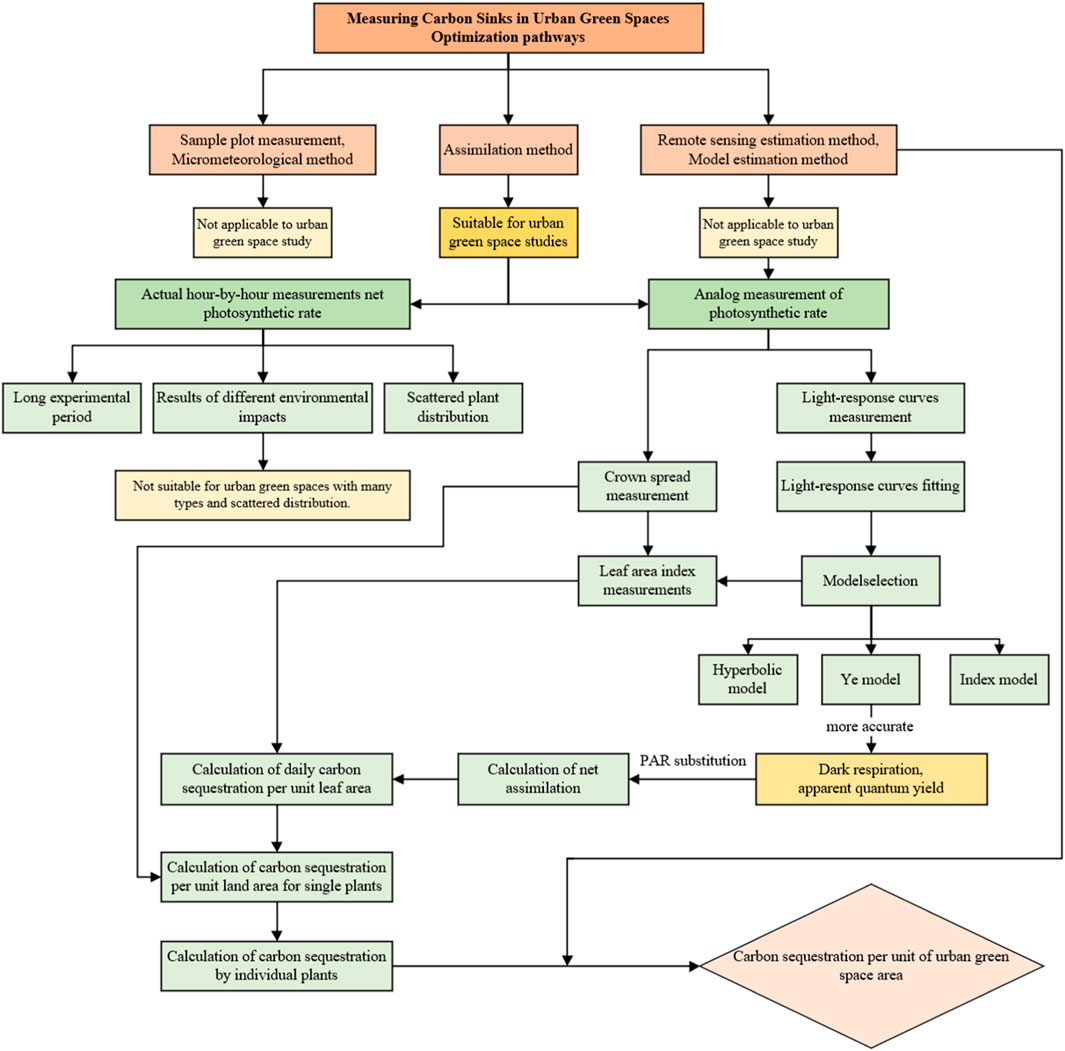
FIGURE 4. Optimization of technical routes.
3.1 Modeling
The relationship between net photosynthesis rate and PAR can be described by the net photosynthesis-light response curve which refers to the tendency of the photosynthetic rate of plant leaves to change with the change in the PAR intensity when other environmental conditions are kept unchanged (Figure 5). The light response curves are mainly derived by fitting the photosynthetic rate values exhibited by the plants at different levels of light intensity. In essence, the light response curves show a functional relationship between the photosynthetic rate and light intensity, so that it can be used as a model to predict photosynthetic rate.
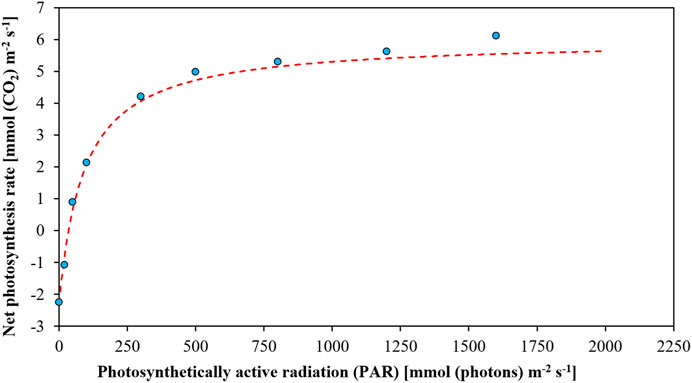
FIGURE 5. The light-response curve to demonstrate the relationship between net photosynthesis rate and photosynthetically active radiation (PAR).
Many models have been used to fit net photosynthetic light-response curves, such as exponential model (Eq. 1) (Bassman and Zwier, 1991), rectangular hyperbolic model (Eq. 2) (Baly, 1997), non-rectangular hyperbolic model (Eq. 3) (Gates, 1977; Hardwick, 1977), and mechanistic model (Eq. 4) (Ye, 2007). These models describe photosynthetic physiology and can reasonably analyze the whole process of the light response curve so that they are capable of obtaining accurate data and fitting curves with high reliability. However, there are no models suitable for all situations. For instance, the data fitted by the non-rectangular hyperbolic model and the exponential model are more in line with actual data, but the prediction results of the mechanistic model were more accurate and realistic (de Lobo et al., 2013). Accordingly, the mechanistic model was later modified and simplified as Eq. 5 (Ye et al., 2013). In practice, the fitting can be done by Ye’s photosynthetic computational model and the computational model built upon Microsoft Excel (de Lobo et al., 2013).
where Pn represents the net photosynthetic rate [μmol (CO2)m-2·s-1], which is the difference between the overall photosynthetic rate and the dark respiration rate of the plant; Pmax is the maximum net photosynthetic rate [μmol (CO2)m-2·s-1]; θ is the curvature of the curve; I is the photosynthetic photon flux density; α is the initial slope of the light response curve at I = 0, representing the initial quantum efficiency of the photosynthetic process [μmol (CO2) (photon)−1]; Rd is the dark respiration, the amount of carbon dioxide released by the plant in dark [μmol (CO2) (photon)−1]. Icomp is the light compensation point [μmol (photon)m-2·s-1], and β and γ are adjustment factor.
3.2 PAR value estimation
Solar radiation is the primary energy source of the Earth’s surface, where the portion of solar radiation that can be utilized by green plants for photosynthesis is defined as PAR, also known as light intensity. PAR serves as the energy source for plant biomass and constitutes a crucial parameter for assessing plant photosynthetic potential (Zhou and Xiang, 1996). The current measurement methods for PAR include the energy system (W·m2) for determining PAR illuminance (QPAR) and the quantum system (μmol·m-2·s-1) for determining PAR density (UPAR). The PAR density is also known as the photosynthesis photon flux density (PPFD), presenting the number of photons incident on a unit surface per unit time (Sun et al., 2017). Under illumination by light sources with different spectral structures, the ratio between leaf photosynthetic rate and photosynthetically active quantum flux density exhibits minimal variation (McCree, 1972). Compared with the energy system, the quantum system for determining the photosynthetically active quantum flux density UPAR is more reasonable. Therefore, quantum measurement systems are increasingly prevalent in fields such as agriculture and ecology.
However, UPAR depends on wavelength and therefore cannot be derived directly from solar irradiance (Wang et al., 2021). Instruments specifically designed for directly measuring the light quantum flux UPAR are not widespread, and most meteorological stations lack regular observation platforms for PAR. As a result, UPAR is generally calculated in an indirect way, such as using UV-visible band fluxes to estimate (Sun et al., 2017), or using meteorological datasets to develop models (García-Rodríguez et al., 2021). On the meteorological conversion, the conventional unit for solar radiation in meteorological parameters is horizontal total radiation (W·m-2), which can be quantitatively converted into light quantum flux (μmol·m-2·s-1) (Wang et al., 2005). More importantly, meteorological research indicates a stable proportion of PAR in total solar radiation. Therefore, the meteorological conversion relationship involves calculations of the photosynthetically active coefficient and quantum conversion coefficient, which are usually calculated by the following empirical formula (Zhou et al., 1984).
where
The current annual average value of η in Eq. 6 is between 0.409 and 0.477 worldwide (Akitsu et al., 2022). Observational studies indicate that η is influenced by both astronomical and meteorological factors. Long-term continuous synchronous observations of Q and PAR in locations such as Beijing, Yantai, and Zhengzhou revealed the stability of η values (Wang and Shui, 1988). A suitable calculation formula for plains was derived as QPAR = 0.42 Q, where η = 0.42. Subsequent research on cities like Chengdu, Kunming, and Guangzhou yielded similar conclusions (Wang and Shui, 1990), and other scholars found similar results that η is 0.39 ± 0.04 (Zhou et al., 1984). Consequently, the quantum conversion coefficient for China can be established as 0.42.
There is no systematic climatological research result about the value of the quantum conversion factor μ. McCree concluded μ = 4.57 μmol J−1 (McCree, 1972), but the value of μ in Eq. 7 is inconsistent in different regions of China, and at present the intermediate value is 4.55 μmol J−1 (Dong et al., 2011) so based on Eq. 8 that the conversion relationship between Q and PAR is UPAR = μ×η = 4.55 × 0.42 Q = 1.911 Q.
3.3 Experimental procedure
Although no study has found a significant relationship between plant net photosynthetic rate and its size (Weissert et al., 2017), it is advisable to select healthy tree species with a planting age between 3 and 10 years for experiment. Since it is always challenging to measure the height of large deciduous trees using in-situ methods, auxiliary measurements are often carried out by tools such as cherry pickers and tower cranes (Chen et al., 2003; Zhao et al., 2008). However, this approach is applicable to only a few tree species with short measurement cycles. Given the diverse and scattered distribution of plant species in urban green spaces, as well as constraints posed by topography, the feasibility of this method is low. Alternatively, in vitro measurements are generally adopted. Whilst the photosynthetic rate of some plants may slightly decrease shortly after detachment, most tree species exhibit a high and stable photosynthetic rate within the first hour after detachment (Tang and Wang, 2011). As a result, the light response curves of plants measured within the first hour of leaf detachment can largely represent in situ measurements.
Currently, the main method for in vitro measurements is to restore the water supply to detached branches and leaves to alleviate water stress, thereby restoring their photosynthetic capacity to the in situ level (Qiang et al., 2017). Typically, plant branches are cut and immediately immersed in water, and the cut surface is maximized by making a second diagonal cut in the water, and subtracting excess foliage from the branches will reduce water loss (Xu, 2006). After measurements, the mechanism model of light response through photosynthesis such as leaf floating was adopted to fit formula (Ye et al., 2013), with the initial values of each parameter: α = 0.06, β = 0.002, γ = 0.01, and Rd = 1, and the limiting range of 0 < α < 0.1, 0.002 < β < 0.01, 0.01 < γ < 0.03, and 0 < Rd < 3. The measurement steps are as follows:
(1) Prune the middle branches of the plant canopy by pruning shears, and place the cut ends into water quickly. Afterwards, make another diagonal cut approximately 3 cm from the initial cut to increase the water absorption area of the branches, during which remove the majority of leaves or leaflets from the branches to minimize water loss from detached plant materials.
(2) Select the fifth to seventh mature leaves from the top of the branches and wipe them clean.
(3) Place the leaves in a controlled light chamber with an LED red-blue light source, and tight up the chamber to ensure airtightness.
(4) Install a CO2 injection system and set it to the same average concentration as the test area.
(5) Adjust the light intensity in the chamber to 1,600 μmol m−2·s−1 using the red-blue light source, and expose the leaves to internal illumination for approximately 10 min for activation.
(6) Control the light intensity sequentially to 1,600, 1,200, 800, 500, 200, 100, 50, 20 and 0 μmol m−2·s−1 using the light intensity controller. After adjusting the light intensity, allow the leaves to adapt for stabilizing about 3 minutes before recording the photosynthetic rate.
3.4 Calculation
3.4.1 Calculation of net assimilation
For the daily assimilation, it is defined as the area enclosed by the net photosynthetic rate curve and the time (Figure 6). The net assimilation refers to the difference between the organic substances formed during photosynthesis and those consumed during respiration within a unit of time, and this value is directly proportional to plant photosynthetic capacity and carbon sequestration (Chen, 2020). Assuming that the PAR is 10 h per day, the net assimilation of the plant on the day of measurement can be calculated by Eq. 9 (Han, 2005).
where P represents the net assimilation total per unit leaf area determined on the measurement day, with units of mmol·m-2·s-1;
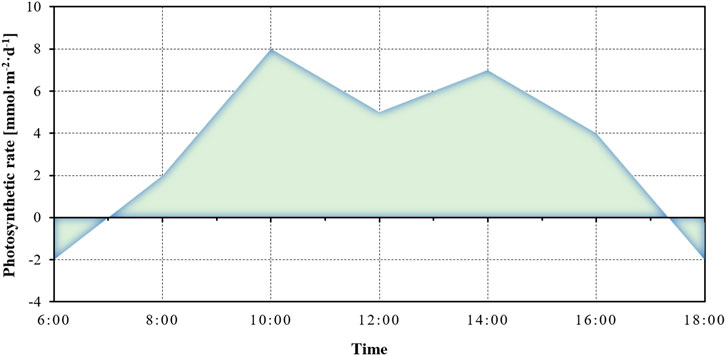
FIGURE 6. Daily assimilation of plant photosynthesis.
3.4.2 Daily carbon sequestration per unit leaf area of plants
Daily carbon sequestration per unit leaf area refers to the amount of carbon dioxide absorbed by a single leaf area in a unit of time, commonly expressed in kg·m−2·a−1. The nocturnal respiratory release of carbon dioxide is generally calculated as 20% of the assimilation amount during the day. The calculation of the daily carbon sequestration per unit leaf area, based on the reaction equation of photosynthesis (CO2+4H2O→CH2O+3H2O + O2), is expressed by Eq. 10.
where 44 represents the molar mass of carbon dioxide;
where PARi represents the instantaneous PAR at the initial moment [μmol·m−2·s−1]; PARi+1 represents the PAR at the next moment [μmol·m−2·s−1].
3.4.3 Carbon sequestration per unit land area by individual plants
Carbon sequestration per unit land area by an individual plant, also known as daily carbon sequestration per unit coverage area, represents the mass of carbon dioxide sequestrated by all leaves on the entire projected area of a landscaping plant in a unit of time, as described by Eq. 12.
where LAI is the leaf area index of a single plant; Qco2 is the amount of CO2 fixed per unit of land area per day by a single plant.
Most previous studies regarded the carbon sequestration benefits of plants as total biomass, including leaves, stem diameter, roots, and rhizomes. This benefit is often determined by measuring the absolute greenness of a certain area (Profous et al., 1988). However, the photosynthesis intensity primarily depends on the effective surface area of leaves involved in photosynthesis. Therefore, the LAI, the total plant leaf area per unit land area as a multiple of land area, is an important indicator reflecting the density of tree leaves and plant carbon sequestration capacity. A higher LAI indicates a greater leaf area per unit land area and a higher degree of leaf overlap (Ma et al., 2023). Plant growth and carbon sequestration increase with the LAI. The LAI determination can be influenced plant growth period and plant condition. In actual applications, three methods such as leaf area method, instrument measurement method, and regression equation method are commonly employed (Table 2).
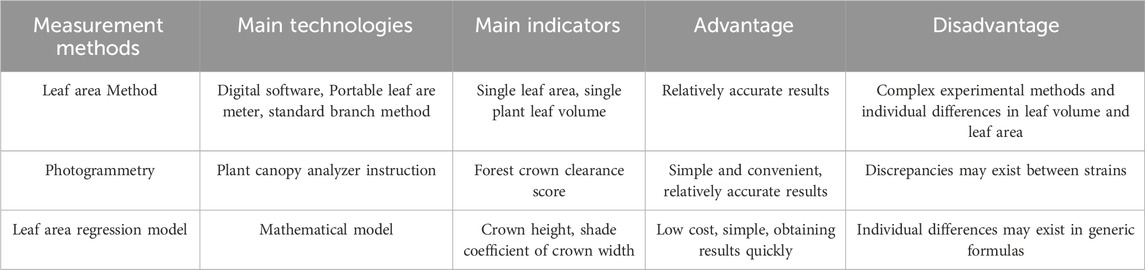
TABLE 2. Estimation methods for leaf area index of green urban vegetation.
The leaf area method calculates the average area of individual plant leaves using devices like portable leaf are meter. The standard single-leaf area should be obtained using the standard branch method based on the entire leaf quantity of an individual plant. Photogrammetry can directly calculate the LAI of plants using plant canopy analyzer instruction, typically selecting the average of the LAI values from multiple directions as the final LAI. The regression model is derived based on physiological indicators such as DBH and tree height (TH) to derive the total leaf area of individual plants (Goude et al., 2019). For example, the urban tree leaf area regression model for Chicago, which was developed on information based on multiple species, ages, DBH and TH, is generalizable because the overall error due to the parameters is not too large, and has been widely used in other regions as well (Mcpherson et al., 1994). Regression models specific to different regions have also been developed based on local tree species characteristics. For example, the LAI of 40 common garden plants in Beijing was determined by a canopy analyzer and a regression model of LAI was established based on the relationship between crown width, DBH, plant height and LAI (Shen, 2007).
3.4.4 Daily carbon sequestration of individual plants
Daily carbon sequestration of individual plants refers to the total amount of carbon dioxide sequestration by an individual plant within a daily time, as described by Eq. 13.
where
3.4.5 Daily carbon sequestration per unit of green space area
Urban green space is composed of a large number of individual plants so that daily carbon sequestration per unit of green space area can be calculated by the daily carbon sequestration of each individual plant within the unit of green space. Total carbon sinks in urban green spaces can be quantified using the methodology of plant communities, as expressed by Eq. 14 (Sultana et al., 2021).
where i represents the specification; j is the tree species; CSij is the sum of daily carbon sequestration per unit of green space area; CAij is the daily carbon sequestration by a single plant of the type; NSij is the number of plants of the type.
4 Discussion
4.1 Significance of accounting carbon sinks in urban green spaces
It is a consensus embraced by governments and organizations worldwide that urban green spaces are efficient natural carbon sinks and a crucial strategy for mitigating climate change. The loss of carbon sinks due to built-up area increase during urbanization should be compensated by urban green spaces (Nowak et al., 2013). In this context, the carbon offsetting capacity (COC), the ratio between carbon emissions from human activities and the carbon sink of green spaces, has been attracting attention (Chen, 2015). Accordingly, quantitative studies on urban green space carbon sinks not only elucidate their paramount significance for cities but also clarify their ecological value, providing a foundation for subsequent management endeavors. At present, research mainly focuses on the indirect quantification of carbon sinks, holding crucial implications for investigating carbon offset capabilities, as well as ecological and economic benefits. In comparison and more importantly, directly quantifying the individual carbon sequestration capacity of urban green space allows the identification of locally suitable high-efficiency carbon sequestration plants, which can guide future urban green space construction and maximize ecological benefits (Table 3). Despite urban green spaces contributing a fraction of carbon sink capacity compared to urban carbon emissions, appropriate design and management of vegetation, as the primary component of urban green spaces, can significantly enhance future carbon sink capacity. This enhancement must be based on an understanding of differences in carbon sequestration benefits among various plant species. In addition, the ecological benefits of plants, such as cooling and fire prevention, hold equal importance in climate change mitigation (Murray et al., 2018; Liu X. et al., 2023). In future research, integrating studies on plant carbon sequestration with quantifications of other ecological benefits may prove more advantageous for the sustainable development of cities.
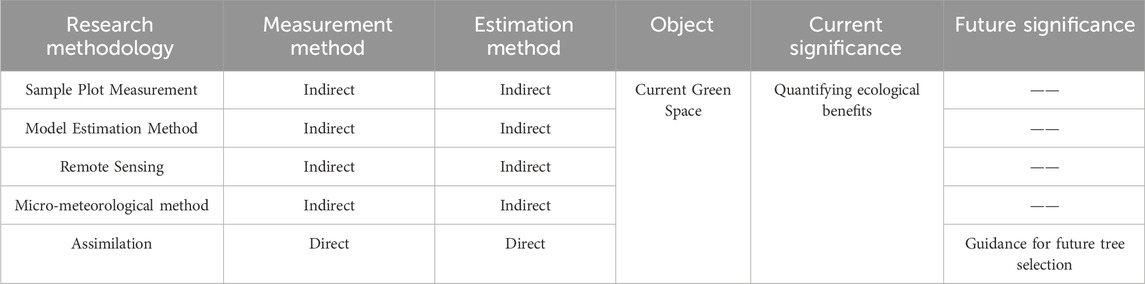
TABLE 3. Comparison of research methods for calculating carbon sinks in urban green spaces.
4.2 Trends in research methods for measuring greenfield carbon sinks
Methodologies for quantifying carbon sequestration in urban green spaces exhibit a diverse trend, and existing methods tailored to different scales and types of green spaces are predominantly concentrated in fields such as forests, grasslands, and agricultural areas. Concurrent studies are exploring the integration of various research methods. For instance, employing the accumulation method principle, directly utilized ArcGIS to estimate the carbon sequestration in Russian forests (Malysheva et al., 2018) and used the IUEMS carbon sequestration and oxygen release model to study forest carbon sequestration in the Qinling Mountains based on net ecosystem productivity (Ma et al., 2022). The CASA model was adopted to estimate the carbon sinks of greenfield vegetation in some major cities in China based on satellite images, meteorological data and vegetation data (Xu et al., 2023), or extracting plant species and leaf area indices from large green spaces by satellite and RS correlation techniques to estimate carbon sink benefits (Johnson et al., 2023). In future, more fusion methods should be explored for simpler and more accurate studies.
4.3 Limitations of the photosynthetic rate estimation
To address the challenges of experimental requirements in the assimilation method, this study proposes a method by establishing a model for estimating photosynthetic rate based on light-response curves. This involves measuring the net photosynthetic rate of plants under different levels of light intensity and utilizing mechanistic model of light-response of photosynthesis to fit the light -response curve. The actual hourly PAR is incorporated to simulate the plant’s hourly net photosynthetic rate on corresponding dates. The carbon sequestration of plants can be finally quantified using the formula for calculating plant carbon sequestration. This standardized external environment setting allows for the carbon sequestration comparison among different plants under the same conditions, enabling more accurate selection of plants with high carbon sink. The study presents controlled adjustments to the light intensity environment, CO2 concentration and other conditions in the leaf chamber of the photosynthesis measurement instrument to ensure a consistent experimental environment. Although light intensity and atmospheric CO2 concentration have the most significant impact on plant photosynthetic rates (Xiao et al., 2019), other external factors can also influence photosynthetic rates. Therefore, in future experiments, there is a need to control the other conditions to make the data more accurate.
There have been many models for net photosynthesis-light response curve fitting, and studies have shown that there are uncertainties in the fitting models (Fang et al., 2015). Moreover, the calculation results of some data of these models may be out of the normal range, this study, to use the light response curve fitting model, follows the mechanism model of photosynthesis response to light. It is a modified model for the rectangular hyperbolic model, having some advantages compared with previous models, and more accurate and real data can be obtained when calculating α. However, the data such as Pmax will be out of the normal physiological range under some circumstances (de Lobo et al., 2013), which should be overcome to increase the accuracy of the results in the future research. Finally, although the predicted net photosynthetic rate values based on the light response curve exhibit a strong correlation with the actually measured values, this does not mean that the results of the two experimental methods are consistent. The photosynthetic rate estimation method based on the light response curve is only applicable to preliminary research on quantifying carbon sequestration in a large number of urban green spaces. More precise carbon sequestration data requires actual hourly measurements.
4.4 Future research
Quantifying carbon sink in urban green spaces is crucial for guiding future urban green space planning and management efforts. Therefore, research should not only concentrate on the direct carbon sink capacity of plants but should also comprehensively explore aspects such as the reduction in carbon emissions, self-generated carbon emissions, and factors influencing carbon sink. This will provide clearer paths for the future construction of urban green space, and help to promote the limited urban green space to play the greatest carbon sink benefits. Regarding carbon emissions, urban green spaces, through shading and transpiration, can lower the overall temperature of the city, thereby reducing building energy consumption and indirectly decreasing urban carbon emissions (Dong and He, 2023). Studies indicate that trees in urban centers indirectly absorb more CO2 than they do directly (McHale et al., 2007). Concerning self-generated carbon emissions, although urban green space vegetation can sequester carbon through photosynthesis, the carbon emissions generated throughout its entire lifecycle, including production, transportation, and management can offset a portion of the carbon sequestration (Park et al., 2021). Deducting the total carbon emissions from the overall carbon sequestration quantity is meaningful for understanding the net carbon sequestration benefits of plants.
On carbon sinks, their influencing factors can be categorized into plants themselves, and planning and design. Regarding plants, indicators such as LAI, size, tree age, tree diameter, and tree height have a significant impact (Othman et al., 2019; Shadman et al., 2022). Moreover, the amount of carbon sequestered by plants varies geographically. Native plants can also show better carbon sequestration efficacy given their local adaptability that means small carbon emissions from maintenance management (Wang et al., 2015). Additionally, past research has predominantly focused on trees and shrubs, neglecting the substantial carbon sink role played by extensive lawns in urban green spaces (Amoatey and Sulaiman, 2020), thus necessitating a quantitative study. On planning and design, plants show different carbon sink abilities with different planting designs. Quantifying the carbon sink capacity variation under different planning and design schemes is important to provide guidance for optimization. Planting density of plant communities had a significant positive relationship with their carbon sequestration (O’Donoghue and Shackleton, 2013), but excessively high density can have opposite effects (Mexia et al., 2018). The proportion of trees and shrubs, plant community hierarchy, biodiversity and vegetation spatial types also significantly affect the carbon sink capacity. Meanwhile, there is a spatial correlation between human activities and greenfield carbon sinks (Dong et al., 2023). On management, digital means can be used to realize the analysis and accurate management of urban green spaces. For example, a digital platform for high carbon sequestering plant communities developed by Python and other programming software in Xi’an provided a scientific guidance for decision-making in plant community design (Wang et al., 2023).
Overall, increasing the carbon sink of green space cannot be only considered in an individual aspect, but should be considered comprehensively from the whole life cycle of plant selection, community design, and maintenance management. However, only from the construction perspective to study the carbon sink of urban green space has a temporary nature. In future, there is a need to study the influencing factors to optimization carbon sink of urban green space so that it can play long-term and better carbon sink benefits. It is also possible to form evaluation standards and systems related to carbon sinks on the basis of carbon sink measurement and quantification, so as to provide a practical basis for evaluating various types of urban green areas.
5 Conclusion
Carbon sink function is one of the most important ecological benefits of urban green space. The associated quantification is not only important for carbon sink measurement, but also important for the future construction of urban low-carbon green space. In this study, we clarified the existing green space carbon sink assessment methods, divided them into macro and micro scales, and analyzed their advantages and disadvantages. It is found that macroscopic methods can accurately estimate the carbon sink benefits of large-scale green spaces, but they cannot be completely applied to urban green spaces and cannot distinguish the carbon sequestration benefits of individual plants. The assimilation method as a research method of carbon sequestration by individual plants can make up for these shortcomings. The assimilation method is more favorable for quantifying the carbon sequestration benefits of individual plants in urban green space. This method can better support the construction of low carbon green space, and can be combined with other tools to accurately estimate carbon sequestration benefits of large-scale green space. However, the assimilation method is affected by the weather and the data comparability is limited by measurement conditions. Therefore, this study proposed to measure net photosynthesis-light response curves in a uniform experimental environment, estimate the net photosynthesis rate by using the photosynthesis-photorespiration-response model of leaf drift as a single-factor variable, and finally calculate carbon sequestered by plants. Moreover, future studies should in-depth explore plant indirect emission reduction benefits and the whole life cycle carbon emissions, and explore the impact of different plant community design and plant indicators on the carbon sink of urban green spaces. Overall, this paper is important to provide a good methodological reference for quantifying carbon sinks in urban green spaces.
Author contributions
LD: Funding acquisition, Methodology, Resources, Supervision, Writing–review and editing. YW: Conceptualization, Investigation, Writing–original draft. LA: Funding acquisition, Writing–review and editing. XC: Methodology, Writing–review and editing. YL: Writing–review and editing.
Funding
The author(s) declare financial support was received for the research, authorship, and/or publication of this article. This work was supported by the Chongqing city management academic project: Study on Optimization of Plant Configuration Patterns in Chongqing Residential Green Areas Based on High Carbon Sink Efficiency (Grant Number: Urban-Management Kezi 2023·No. (33)). Meanwhile, this work was supported by the Chongqing Graduate Student Research and Innovation Program Funding: Study on Optimization of Plant Configuration Patterns in Chongqing Residential Green Areas Based on High Carbon Sink Efficiency (Grant Number: CYS23513).
Acknowledgments
The authors would like to thank reviewers’ constructive comments in improving the paper quality.
Conflict of interest
The authors declare that the research was conducted in the absence of any commercial or financial relationships that could be construed as a potential conflict of interest.
Publisher’s note
All claims expressed in this article are solely those of the authors and do not necessarily represent those of their affiliated organizations, or those of the publisher, the editors and the reviewers. Any product that may be evaluated in this article, or claim that may be made by its manufacturer, is not guaranteed or endorsed by the publisher.
References
Akitsu, T. K., Nasahara, K. N., Ijima, O., Hirose, Y., Ide, R., Takagi, K., et al. (2022). The variability and seasonality in the ratio of photosynthetically active radiation to solar radiation: a simple empirical model of the ratio. Int. J. Appl. Earth Observation Geoinformation 108, 102724. doi:10.1016/j.jag.2022.102724
Alonzo, M., Bookhagen, B., and Roberts, D. A. (2014). Urban tree species mapping using hyperspectral and lidar data fusion. Remote Sens. Environ. 148, 70–83. doi:10.1016/j.rse.2014.03.018
Amoatey, P., and Sulaiman, H. (2020). Quantifying carbon storage potential of urban plantations and landscapes in Muscat, Oman. Environ. Dev. Sustain 22, 7969–7984. doi:10.1007/s10668-019-00556-5
Baly, E. C. C. (1997). The kinetics of photosynthesis. Proc. R. Soc. Lond. Ser. B - Biol. Sci. 117, 218–239. doi:10.1098/rspb.1935.0026
Bao, Z. (2011). On the design and construction of low-carbon plant landscape. Chin. Landsc. Archit. doi:10.3969/j.issn.1000-6664.2011.01.003
Bassman, J. H., and Zwier, J. C. (1991). Gas exchange characteristics of Populus trichocarpa, Populus deltoides and Populus trichocarpa x P. deltoides clones. Tree Physiol. 8, 145–159. doi:10.1093/treephys/8.2.145
Biswas, S., Bala, S., and Mazumdar, A. (2014). Diurnal and seasonal carbon sequestration potential of seven broadleaved species in a mixed deciduous forest in India. Atmos. Environ. 89, 827–834. doi:10.1016/j.atmosenv.2014.03.015
Chen, D., Li, Y., Luo, T., Chen, B., and Lin, M. (2003). Study on photosynthetic physiological ecology of Cryptocarya chinensis in tropical montane rain forest in Jianfengling, Hainan Island. For. Res. 16, 540–547. doi:10.1016/S0142-9418(02)00003-X
Chen, L. (2020). Study on carbon fixation and oxygen release ability of urban greening tree species based on spatial and temporal dynamic analysis. Glob. Energy Issues 42, 244–258. doi:10.1504/IJGEI.2020.108960
Chen, L., Li, P., Li, G., Su, D., and Yuan, Y. (2009). Application of CITYGREEN model in air purification, carbon fixation and oxygen release by greenbelt system of Shenzhen City. Acta Ecol. Sin. 29, 272–282. doi:10.3321/j.issn:1000-0933.2009.01.033
Chen, W. Y. (2015). The role of urban green infrastructure in offsetting carbon emissions in 35 major Chinese cities: a nationwide estimate. Cities 44, 112–120. doi:10.1016/j.cities.2015.01.005
de Lobo, F. A., de Barros, M. P., Dalmagro, H. J., Dalmolin, Â. C., Pereira, W. E., de Souza, É. C., et al. (2013). Fitting net photosynthetic light-response curves with Microsoft Excel - a critical look at the models. Photosynthetica 51, 445–456. doi:10.1007/s11099-013-0045-y
Dong, H., Chen, Y., and Huang, X. (2023). A new framework for analysis of the spatial patterns of 15-minute neighbourhood green space to enhance carbon sequestration performance: a case study in Nanjing, China. Ecol. Indic. 156, 111196. doi:10.1016/j.ecolind.2023.111196
Dong, X., and He, B.-J. (2023). A standardized assessment framework for green roof decarbonization: a review of embodied carbon, carbon sequestration, bioenergy supply, and operational carbon scenarios. Renew. Sustain. Energy Rev. 182, 113376. doi:10.1016/j.rser.2023.113376
Evans, J., and Santiago, L. (2011). Gas exchange and chlorophyll fluorescence Prometheus. Available at: https://prometheusprotocols.net/function/gas-exchange-and-chlorophyll-fluorescence/ (Accessed August 14, 2023).
Fang, L., Zhang, S., Zhang, G., Liu, X., Xia, X., Zhang, S., et al. (2015). Application of five light-response models in the photosynthesis of Populus x euramericana cv. “Zhonglin46” leaves. Appl. Biochem. Biotechnol. 176, 86–100. doi:10.1007/s12010-015-1543-0
Friedlingstein, P., O’Sullivan, M., Jones, M. W., Andrew, R. M., Bakker, D. C. E., Hauck, J., et al. (2023). Global carbon budget 2023. Earth Syst. Sci. Data 15, 5301–5369. doi:10.5194/essd-15-5301-2023
Gao, F., Wu, T., Zhang, J., Hu, A., and Meehl, G. A. (2021). Shortened duration of global warming slowdowns with elevated greenhouse gas emissions. J. Meteorol. Res. 35, 225–237. doi:10.1007/s13351-021-0134-y
Garcia-Gonzalo, J., Peltola, H., Zubizarreta Gerendiain, A., and Kellomäki, S. (2007). Impacts of forest landscape structure and management on timber production and carbon stocks in the boreal forest ecosystem under changing climate. For. Ecol. Manag. 241, 243–257. doi:10.1016/j.foreco.2007.01.008
García-Rodríguez, A., Granados-López, D., García-Rodríguez, S., Díez-Mediavilla, M., and Alonso-Tristán, C. (2021). Modelling Photosynthetic Active Radiation (PAR) through meteorological indices under all sky conditions. Agric. For. Meteorology 310, 108627. doi:10.1016/j.agrformet.2021.108627
Gates, D. M. (1977). Mathematical Models in plant physiology. A quantitative Approach to Problems in Plant and crop Physiology.J. H. M. Thornley. Q. Rev. Biol. 52, 97. doi:10.1086/409778
Giacomo, G., Elisa, V., Francesca, P., Lucia, C., and Federico, M. (2005). Seasonal and interannual variability of photosynthetic capacity in relation to leaf nitrogen in a deciduous forest plantation in northern Italy. Tree Physiol. 25, 349–360. doi:10.1093/treephys/25.3.349
Goude, M., Nilsson, U., and Holmström, E. (2019). Comparing direct and indirect leaf area measurements for Scots pine and Norway spruce plantations in Sweden. Eur. J. Forest. Res. 138, 1033–1047. doi:10.1007/s10342-019-01221-2
Gratani, L., Varone, L., and Bonito, A. (2016). Carbon sequestration of four urban parks in Rome. Power urban social-ecological Syst. 19, 184–193. doi:10.1016/j.ufug.2016.07.007
Grimmond, C. S. B., King, T. S., Cropley, F. D., Nowak, D. J., and Souch, C. (2002). Local-scale fluxes of carbon dioxide in urban environments: methodological challenges and results from Chicago. Environ. Pollut. 116, S243–S254. doi:10.1016/S0269-7491(01)00256-1
Gülin, D., and Bosch, C.C.K.V.D. (2021). Assessment of above-ground carbon storage by Urban trees using LiDAR Data: the case of a university campus. Forests. doi:10.3390/F12010062
Guo, X. (2012). Study on the evaluation method of carbon sequestration capacity of greening plants in residential areas. ChongQing: Chongqing University.
Han, H. (2005). Effect of carbon fixation and oxygen release about urban greening plants. J. Northeast For. Univ. 33, 68–70. doi:10.1360/biodiv.050121
Hardwick, R. C. (1977). Mathematical models in plant physiology. By J. H. M. Thornley. London: academic press (1976), PP. 331, £9.80. Exp. Agric. 13, 112. doi:10.1017/S0014479700007675
He, B.-J. (2023). Cause-related injustice, process-related injustice, effect-related injustice and regional heat action planning priorities: an empirical study in Yangtze River Delta and Chengdu-Chongqing urban agglomerations. Landsc. Urban Plan. 237, 104800. doi:10.1016/j.landurbplan.2023.104800
He, B.-J., Wang, J., Liu, H., and Ulpiani, G. (2021). Localized synergies between heat waves and urban heat islands: implications on human thermal comfort and urban heat management. Environ. Res. 193, 110584. doi:10.1016/j.envres.2020.110584
He, H. (2010). Study on the role of green space carbon sinks in residential areas in South China and its application to the evaluation of carbon P&L over the whole life cycle. ChongQing: Chongqing University.
Helfter, C., Famulari, D., Phillips, G. J., Barlow, J. F., Wood, C. R., Grimmond, C. S. B., et al. (2010). Controls of carbon dioxide concentrations and fluxes above central London. Atmos. Chem. Phys. 11, 1913–1928. doi:10.5194/acp-11-1913-2011
Henninger, S., and Kuttler, W. (2010). Near surface carbon dioxide within the urban area of Essen, Germany. Phys. Chem. Earth 35, 76–84. doi:10.1016/j.pce.2010.03.006
Holifield Collins, C. D., Emmerich, W. E., Moran, M. S., Hernandez, M., Scott, R. L., Bryant, R. B., et al. (2008). A remote sensing approach for estimating distributed daily net carbon dioxide flux in semiarid grasslands. Water Resour. Res. 44. doi:10.1029/2006WR005699
Houghton, R. A., Boone, R. D., Melillo, J. M., Palm, C. A., Woodwell, G. M., Myers, N., et al. (1985). Net flux of carbon dioxide from tropical forests in 1980. Nature 316, 617–620. doi:10.1038/316617a0
Idso, C. D., Idso, S. B., and Balling, R. C. (1998). The urban Co2 dome of Phoenix, Arizona. Phys. Geogr. 19, 95–108. doi:10.1080/02723646.1998.10642642
Intasen, M., Hauer, R. J., Larsen, E., and Werner, L. P. (2017). Urban forest assessment in Bangkok, Thailand. J. Sustain. For. 36, 148–163. doi:10.1080/10549811.2016.1265455
Intergovernmental Panel On Climate Change (IPCC) (2023). Climate change 2022 – impacts, adaptation and vulnerability: working group II contribution to the sixth assessment report of the intergovernmental Panel on climate change. 1st ed. Cambridge University Press. doi:10.1017/9781009325844
Johnson, A. J., Davidson, C. I., Cibelli, E., and Wojcik, A. (2023). Estimating leaf area index and coverage of dominant vegetation on an extensive green roof in Syracuse, NY. Nature-Based Solutions 3, 100068. doi:10.1016/j.nbsj.2023.100068
King, A. W., Hayes, D. J., Huntzinger, D. N., West, T. O., and Post, W. M. (2012). North American carbon dioxide sources and sinks: magnitude, attribution, and uncertainty. Front. Ecol. Environ. 10, 512–519. doi:10.1890/120066
Kiss, M., Takács, Á., Pogácsás, R., and Gulyás, Á. (2015). The role of ecosystem services in climate and air quality in urban areas: evaluating carbon sequestration and air pollution removal by street and park trees in Szeged (Hungary). Morav. Geogr. Rep. 23 (3), 36–46. doi:10.1515/mgr-2015-0016
Knyazikhin, Y., Schull, M., Stenberg, P., Myneni, R. B., Rautiainen, M., Yang, Y., et al. (2012). Hyperspectral remote sensing of foliar nitrogen content. Proc. Natl. Acad. Sci. U. S. A. 110, E185–E192. doi:10.1073/pnas.1210196109
Li, K., Liu, X., Zhang, H., Ma, J., and He, B.-J. (2023). Evaluating and improving the adaptability of commonly used indices for predicting outdoor thermal sensation in hot and humid residential areas of China. Dev. Built Environ. 16, 100278. doi:10.1016/j.dibe.2023.100278
Li, Q., Zhu, Y., and Zhu, Z. (2023). Calculation and optimization of the carbon sink benefits of green space plants in residential areas: a case study of suojin village in nanjing. Sustainability 15, 607. doi:10.3390/su15010607
Li, Y. (2010). The development path options and policy proposals of low-carbon economic in China. Urban Stud. doi:10.3969/j.issn.1006-3862.2010.02.008
Liu, C., Zhao, S., Li, L., Li, X., XingYuan, X., and Wei, W. (2008). Difference analysis of carbon fixation and pollution removal of urban forest in Shenyang. Chin. J. Appl. Ecol. doi:10.3724/SP.J.1005.2008.01033
Liu, H., Huang, B., Cheng, X., Yin, M., Shang, C., Luo, Y., et al. (2023). Sensing-based park cooling performance observation and assessment: a review. Build. Environ. 245, 110915. doi:10.1016/j.buildenv.2023.110915
Liu, X., He, J., Xiong, K., Liu, S., and He, B.-J. (2023). Identification of factors affecting public willingness to pay for heat mitigation and adaptation: evidence from Guangzhou, China. Urban Clim. 48, 101405. doi:10.1016/j.uclim.2022.101405
Liu, Y., Zhou, G., Du, H., Berninger, F., Mao, F., Li, X., et al. (2018). Response of carbon uptake to abiotic and biotic drivers in an intensively managed Lei bamboo forest. J. Environ. Manag. 223, 713–722. doi:10.1016/j.jenvman.2018.06.046
López, F. R., Rubio, E., and Moya, D. (2010). Los bosques como sumideros de co2: incertidumbre en los cálculos y necesidad de potenciar la investigación, 74–81.
Ma, H., Li, X., Ji, J., Cui, H., Shi, Y., Li, N., et al. (2023). Monitoring indicators for comprehensive growth of summer maize based on UAV remote sensing. Agronomy 13, 2888. doi:10.3390/agronomy13122888
Ma, X., Li, J., Zhao, K., Wu, T., and Zhang, P. (2022). Simulation of spatial Service range and value of carbon sink based on intelligent urban ecosystem management system and net present value models-an example from the qinling Mountains. Forests 13, 407. doi:10.3390/f13030407
Malysheva, N., Filipchuk, A., Tsyplenkov, A., and Zolina, T. (2018). “Gis support of carbon sequestration, emissions and balance assessment for Russian forests,” in International Conference on Cartography and GIS. Presented at the 8th International Conference on Cartography and GIS, Nessebar, BULGARIA.
McCree, K. J. (1972). Test of current definitions of photosynthetically active radiation against leaf photosynthesis data. Agric. Meteorol. 10, 443–453. doi:10.1016/0002-1571(72)90045-3
McHale, M. R., Gregory McPherson, E., and Burke, I. C. (2007). The potential of urban tree plantings to be cost effective in carbon credit markets. Urban For. Urban Green. 6, 49–60. doi:10.1016/j.ufug.2007.01.001
Mcpherson, E., Nowak, D., Gordon, H., Grimmond, C., Souch, C., Grant, R., et al. (1994). “Chicago’s urban forest ecosystem: results of the Chicago urban forest climate project,” in Proceedings of the 7th national urban forest conference.
Mcpherson, E. G., Simpson, J. R., Xiao, Q., and Wu, C. (2008). Los Angeles 1-Million tree canopy cover assessment. doi:10.2737/PSW-GTR-207
Mexia, T., Vieira, J., Príncipe, A., Anjos, A., Silva, P., Lopes, N., et al. (2018). Ecosystem services: urban parks under a magnifying glass. Environ. Res. 160, 469–478. doi:10.1016/j.envres.2017.10.023
Mohd Zaki, N.A., and Abd Latif, Z. (2017). Carbon sinks and tropical forest biomass estimation: a review on role of remote sensing in aboveground-biomass modelling. Geocarto. International. 32, 701–716. doi:10.1080/10106049.2016.1178814
Monteiro, M. V., Handley, P., and Doick, K. J. (2019). An insight to the current state and sustainability of urban forests across Great Britain based on i-Tree Eco surveys. For. J., 1–17. Estimating in situ maximum net photosynthetic rate of Larix olgensis based on abscised measurement. doi:10.1093/forestry/cpz054
Mu, X., and Chen, Y. (2021). The physiological response of photosynthesis to nitrogen deficiency. Plant Physiology Biochem. 158, 76–82. doi:10.1016/j.plaphy.2020.11.019
Murray, B. R., Martin, L. J., Colin Brown, D. W. K., Phillips, M. L., and Phillips, M. (2018). Selecting low-flammability plants as green firebreaks within sustainable urban garden design. Switzerl. 1, 15. doi:10.3390/fire1010015
Ning, Z. H., Chambers, R., and Abdollahi, K. (2016). Modeling air pollutant removal, carbon storage, and CO2 sequestration potential of urban forests in Scotlandville, Louisiana, USA. iForest - Biogeosciences For. 9, 860–867. doi:10.3832/ifor1845-009
Nowak, D. J., Crane, D. E., Stevens, J. C., and Ibarra, M. (2002). “Brooklyn’s urban forest,”. Gen. Tech. Rep. NE-290 (Newtown Square, PA: U. S. Department of Agriculture, Forest Service, Northeastern Forest Experiment Station), 290. doi:10.2737/NE-GTR-290
Nowak, D. J., Greenfield, E. J., Hoehn, R. E., and Lapoint, E. (2013). Carbon storage and sequestration by trees in urban and community areas of the United States. Environ. Pollut. 178, 229–236. doi:10.1016/j.envpol.2013.03.019
Nowak, D. J., Hirabayashi, S., Doyle, M., McGovern, M., and Pasher, J. (2018). Air pollution removal by urban forests in Canada and its effect on air quality and human health. Urban For. Urban Green. 29, 40–48. doi:10.1016/j.ufug.2017.10.019
O’Donoghue, A., and Shackleton, C. M. (2013). Current and potential carbon stocks of trees in urban parking lots in towns of the Eastern Cape, South Africa. Urban For. Urban Green. 12, 443–449. doi:10.1016/j.ufug.2013.07.001
Othman, R., Suid, S., Mohd Noor, N. F., Baharuddin, Z. M., Hashim, K. S. H. Y., and Lukman Hakim Mahamod, L. H. (2019). The influence of urban park green spaces, plant material specifications and spatial design organization and pattern towards carbon sequestration rate. Appl. Ecol. Environ. Res. 17, 8079–8088. doi:10.15666/aeer/1704_80798088
Ouyang, Z., Wang, X., and Miao, H. (1999). A primary study on Chinese terrestrial ecosystem services and their ecological-economic values. Acta Ecol. Sin. 5, 607–613. doi:10.1088/0256-307X/15/12/025
Park, H. M., Jo, H. K., and Kim, J. Y. (2021). Carbon footprint of landscape tree production in Korea. Sustainability 13, 5915. doi:10.3390/su13115915
Pataki, D. E., Alig, R. J., Fung, A. S., Golubiewski, N. E., Kennedy, C. A., Mcpherson, E. G., et al. (2006). Urban ecosystems and the North American carbon cycle. Glob. Change Biol. 12, 2092–2102. doi:10.1111/j.1365-2486.2006.01242.x
Paw U, K. T., Falk, M., Suchanek, T. H., Ustin, S. L., Chen, J., Park, Y. S., et al. (2004). Carbon dioxide exchange between an old-growth forest and the atmosphere. Ecosystems 7. doi:10.1007/s10021-004-0141-8
Piao, S., He, Y., Wang, X., and Chen, F. (2022). Estimation of China’s terrestrial ecosystem carbon sink: methods, progress and prospects. Sci. China-Earth Sci. 65, 641–651. doi:10.1007/s11430-021-9892-6
Profous, G. V., Rowntree, R. A., and Loeb, R. E. (1988). The urban forest landscape of athens, Greece: aspects of structure, planning and management. Arboric. Assoc. J. 12, 83–107. doi:10.1080/03071375.1988.9756380
Qiang, L., Feng-Ri, L. I., Wei, P., and University, N. F. (2017). Estimating in situ maximum net photosynthetic rate of Larix olgensis based on abscised measurement. Chin. J. Appl. Ecol. 28, 3208–3216. doi:10.13287/j.1001-9332.201710.020
Rana, G., Martinelli, N., Famulari, D., Pezzati, F., Muschitiello, C., and Ferrara, R. M. (2021). Representativeness of carbon dioxide fluxes measured by eddy covariance over a mediterranean urban district with equipment setup restrictions. Atmosphere 12, 197. doi:10.3390/atmos12020197
Reich, P. B., Walters, M. B., Kloeppel, B. D., and Ellsworth, D. S. (1995). Different photosynthesis-nitrogen relations in deciduous hardwood and evergreen coniferous tree species. Oecologia 104, 24–30. doi:10.1007/BF00365558
Richardson, J. J., and Moskal, L. M. (2014). Uncertainty in urban forest canopy assessment: lessons from Seattle, WA, USA. Urban For. Urban Green. 13, 152–157. doi:10.1016/j.ufug.2013.07.003
Rowntree, R. A., and Nowak, D. J. (1991). Quantifying the role of urban forests in removing atmospheric carbon dioxide. J. Arboric. 7, 269–275. doi:10.48044/jauf.1991.061
Russo, A., Escobedo, F. J., Timilsina, N., Schmitt, A. O., Varela, S., and Zerbe, S. (2014). Assessing urban tree carbon storage and sequestration in Bolzano, Italy. Int. J. Biodivers. Sci. Ecosyst. Serv. Manag. 10, 54–70. doi:10.1080/21513732.2013.873822
Schreyer, J., Jan, T., Lakes, T., and Churkina, G. (2014). Using airborne LiDAR and QuickBird data for modelling urban tree carbon storage and its distribution—a case study of berlin. Remote Sens. 6, 10636–10655. doi:10.3390/rs61110636
Shadman, S., Khalid, P. A., Hanafiah, M. M., Koyande, A. K., Islam, M. A., Bhuiyan, S. A., et al. (2022). The carbon sequestration potential of urban public parks of densely populated cities to improve environmental sustainability. Sustain. Energy Technol. Assessments 52, 102064. doi:10.1016/j.seta.2022.102064
Shen, P., and Zhao, S. (2024). Intensifying urban imprint on land surface warming: insights from local to global scale. iScience, 109110. doi:10.1016/j.isci.2024.109110
Shen, X. (2007). Researches on the model of Leaf Area Index of common Landscape Plants in Beijing. Beijing: Beijing Forestry University.
Singkran, N. (2022). Carbon sink capacity of public parks and carbon sequestration efficiency improvements in a dense urban landscape. Environ. Monit. Assess. 194, 750. doi:10.1007/s10661-022-10432-x
Soegaard, H., and Mller-Jensen, L. (2003). Towards a spatial CO2 budget of a metropolitan region based on textural image classification and flux measurements. Remote Sens. Environ. 87, 283–294. doi:10.1016/S0034-4257(03)00185-8
Sultana, R., Ahmed, Z., Hossain, M. D. A., and Begum, B. A. (2021). Impact of green roof on human comfort level and carbon sequestration: a microclimatic and comparative assessment in Dhaka City, Bangladesh. Urban Clim. 38, 100878. doi:10.1016/j.uclim.2021.100878
Sun, Z., Liang, H., Liu, J., and Shi, G. (2017). Estimation of photosynthetically active radiation using solar radiation in the UV–visible spectral band. Sol. Energy 153, 611–622. doi:10.1016/j.solener.2017.06.007
Tang, Y., and Wang, C.-K. (2011). A feasible method for measuring photosynthesis in vitro for major tree species in northeastern China: a feasible method for measuring photosynthesis in vitro for major tree species in northeastern China. Chin. J. Plant Ecol. 35, 452–462. doi:10.3724/SP.J.1258.2011.00452
Velasco, E., and Roth, M. (2010). Cities as net sources of CO2: review of atmospheric CO2 exchange in urban environments measured by eddy covariance technique. Geogr. Compass 4, 1238–1259. doi:10.1111/j.1749-8198.2010.00384.x
Wang, B., Liu, Z., Qi, Y., and Jin, G. (2014). Seasonal dynamics of leaf area index using different methods in the Korean pine plantation. Acta Ecol. Sin. 34. doi:10.5846/stxb201306181727
Wang, B., and Shui, Y. (1988). Study on the calculation of the photosynt- hetically active radiation. Acta Energiae Solaris Sin., 59–65. doi:10.19912/j.0254-0096.1988.01.010
Wang, B., and Shui, Y. (1990). Study on the calculation of the photosynthetically active radiation. J. Appl. Meteorological Sci. 6.
Wang, C., Du, J., Liu, Y., and Chow, D. (2021). A climate-based analysis of photosynthetically active radiation availability in large-scale greenhouses across China. J. Clean. Prod. 315, 127901. doi:10.1016/j.jclepro.2021.127901
Wang, J., Fan, L., Han, D., and Chen, L. (2023). Study on carbon-sink matrix quantization and allocation pattern of GreenSpace plants in xi’an under targets of carbon peak and carbon meutrality. Chin. Landsc. Archit. 39, 108–113. doi:10.19775/j.cla.2023.02.0108
Wang, J., Feng, L., Palmer, P. I., Liu, Y., Fang, S., Bösch, H., et al. (2020). Large Chinese land carbon sink estimated from atmospheric carbon dioxide data. Nature 586, 720–723. doi:10.1038/s41586-020-2849-9
Wang, Q., Chen, J., and Sun, Z. (2005). Application of quantum unit conversion in solar radiation measurement using Li-cor instruments. dbkxxb 21, 140–144. doi:10.3321/j.issn:1002-6819.2005.04.031
Wang, V., Gao, J., and Luitgard, S. (2020). Assessing changes of urban vegetation cover and aboveground carbon stocks using LiDAR and Landsat imagery data in Auckland, New Zealand. Int. J. Remote Sens. 41, 2140–2158. doi:10.1080/01431161.2019.1685716
Wang, X., Wang, X., Su, Y., and Zhang, H. (2019). Land pavement depresses photosynthesis in urban trees especially under drought stress. Sci. Total Environ. 653, 120–130. doi:10.1016/j.scitotenv.2018.10.281
Wang, Y., Liu, W., Ko, S., and Lin, J. (2015). Tree species diversity and carbon storage in air quality enhancement zones in taiwan. Aerosol Air Qual. Res. 15, 1291–1299. doi:10.4209/aaqr.2015.02.0110
Wang, Z. (2010). Research on vegetation quantity and carbon-fixing and oxygen-releasing effects of Fuzhou botanical garden. Chin. Landsc. Archit. doi:10.3969/j.issn.1000-6664.2010.12.001
Wei, G., Bi, M., Liu, X., Zhang, Z., and He, B.-J. (2023). Investigating the impact of multi-dimensional urbanization and FDI on carbon emissions in the belt and road initiative region: direct and spillover effects. J. Clean. Prod. 384, 135608. doi:10.1016/j.jclepro.2022.135608
Weissert, L. F., Salmond, J. A., and Schwendenmann, L. (2017). Photosynthetic CO2 uptake and carbon sequestration potential of deciduous and evergreen tree species in an urban environment. Urban Ecosyst. 20, 663–674. doi:10.1007/s11252-016-0627-0
Wilson, K., Goldstein, A., Falge, E., Aubinet, M., Baldocchi, D., Berbigier, P., et al. (2002). Energy balance closure at FLUXNET sites. Agric. For. Meteorology 113, 223–243. doi:10.1016/S0168-1923(02)00109-0
Xiao, M., Li, Y., and Lu, B. (2019). Response of net photosynthetic rate to environmental factors under water level regulation in paddy field. Pol. J. Environ. Stud. 28, 1433–1442. doi:10.15244/pjoes/81694
Xu, D. (2006). Some noteworthy problems in measurement and investigation of photosynthesis. Plant Physiol. Commun. 42, 1163–1167. doi:10.13592/j.cnki.ppj.2006.06.054
Xu, F. (2010). Effects of community structure on carbon fixation of urban forests in Shanghai, China. Chin. J. Ecol. 29, 439. doi:10.13292/j.1000-4890.2010.0090
Xu, F., Wang, X., and Li, L. (2023). NPP and vegetation carbon sink capacity estimation of urban green space using the optimized CASA model: a case study of five Chinese cities. Atmosphere 14, 1161. doi:10.3390/atmos14071161
Yang, S. (1996). Primary study on effect of C-O balance of afforestatal trees in cities. Urban Environ. Urban Ecol.
Ye, Z. (2007). A new model for relationship between irradiance and the rate of photosynthesis in Oryza sativa. Photosynthetica 45, 637–640. doi:10.1007/s11099-007-0110-5
Ye, Z., Suggett, D. J., Robakowski, P., and Kang, H. (2013). A mechanistic model for the photosynthesis–light response based on the photosynthetic electron transport of photosystem II in C3 and C4 species. New Phytol. 199, 110–120. doi:10.1111/nph.12242
Zhang, H., Feng, Z., Chen, P., and Chen, X. (2019). Development of a tree growth difference equation and its application in forecasting the biomass carbon stocks of Chinese forests in 2050. Forests 10, 582. doi:10.3390/f10070582
Zhang, J., Shi, Y., Zhu, Y., Liu, E., Li, M., Zhou, J., et al. (2013). The photosynthetic carbon fixation characteristics of common tree species in northern Zhejiang. Acta Ecol. Sin. 33, 1740–1750. doi:10.5846/stxb201207130989
Zhao, D., Cai, J., Xu, Y., Liu, Y., and Yao, M. (2023). Carbon sinks in urban public green spaces under carbon neutrality: a bibliometric analysis and systematic literature review. Urban For. Urban Green. 86, 128037. doi:10.1016/j.ufug.2023.128037
Zhao, X., Wang, C., and Huo, H. (2008). Variations in photosynthetic capacity and associated factors for Larix gmelinii from diverse origins. Shengtai Xuebao/ Acta Ecol. Sin. 28, 3798–3807. doi:10.3321/j.issn:1000-0933.2008.08.036
Zheng, Z., Yan, D., Wen, X., Wei, Z., Chou, J., Guo, Y., et al. (2022). The effect of greenhouse gases concentration and urbanization on future temperature over Guangdong-Hong Kong-Macao Greater Bay Area in China. Clim. Dyn. 58, 3369–3392. doi:10.1007/s00382-021-06103-1
Zhong, R., Song, S., Zhang, J., and Ye, Z. (2023). Spatial–temporal variation and temperature effect of urbanization in Guangdong Province from 1951 to 2018. Environ. Dev. Sustain. doi:10.1007/s10668-023-03113-3
Zhou, J., Zhuang, C., and Deng, Y. (2013). Urban forest carbon sink and its estimation methods: a review. Chin. J. Ecol. doi:10.13292/j.1000-4890.2013.0514
Zhou, Y., and Xiang, Y. (1996). Climatological estimation of quantum flux densities. ACTA METEOROL. SIN. doi:10.11676/qxxb1996.046
Zhou, Y., Xiang, Y., and Shan, F. (1984). A climatological study on the photosynthetically active radiation. Acta Meteorol. Sin. doi:10.11676/qxxb1984.046
Keywords: urban green space, carbon sinks accounting, photosynthetic rate estimation, net photosynthetic light-response curve, photosynthetically active radiation
Citation: Dong L, Wang Y, Ai L, Cheng X and Luo Y (2024) A review of research methods for accounting urban green space carbon sinks and exploration of new approaches. Front. Environ. Sci. 12:1350185. doi: 10.3389/fenvs.2024.1350185
Received: 05 December 2023; Accepted: 07 February 2024;
Published: 27 February 2024.
Edited by:
Chenxi Li, Xi’an University of Architecture and Technology, ChinaReviewed by:
Xiao Liu, South China University of Technology, ChinaLinghua Duo, East China University of Technology, China
Guoen Wei, Nanchang University, China
Copyright © 2024 Dong, Wang, Ai, Cheng and Luo. This is an open-access article distributed under the terms of the Creative Commons Attribution License (CC BY). The use, distribution or reproduction in other forums is permitted, provided the original author(s) and the copyright owner(s) are credited and that the original publication in this journal is cited, in accordance with accepted academic practice. No use, distribution or reproduction is permitted which does not comply with these terms.
*Correspondence: Lili Dong, ZG9uZ2xsQGNxanR1LmVkdS5jbg==
†These authors have contributed equally to this work