 Ankesh Tiwari
 Mohineeta Pandey1
 Sudhir Kumar Pandey
- 1Department of Botany, Guru Ghasidas Vishwavidyalaya, (A Central University) Koni, Bilaspur, India
- 2Department of Botany, Govt. Sant Rameshwar Gahira Guruji Mahavidyalaya, Rupsera, India
- 3Department of Chemistry LBS College, Baloda, India
Particulate matter (PM) stands as a predominant pollutant in developing countries, demanding effective source identification and remediation strategies. This review centers on the scanning electron microscopy (SEM) image-based methodology for PM analysis, particularly emphasizing the passive technique of utilizing plant leaves for PM capture. The SEM-image-based approach serves as a powerful tool for unraveling the morphological characteristics of PM, crucial for source identification. Additionally, SEM, when equipped with energy dispersive spectroscopy (EDS), enables chemical and mineralogical characterization, providing insights into the origin of PM. The first part of the review describes the plant as the best bio-sampler for PM. In this context, removal of PM from the environment through plant-based interventions is described. Subsequently, the application of SEM for size-based analysis using ImageJ and morphological analysis for source identification of PM is detailed. Following this, the PM chemical and mineralogical composition for source identification are described based on EDS analysis. Image-based techniques play a pivotal role in selecting the most effective plant species for PM removal from the air. The review comprehensively outlines the morphological, chemical, and mineralogical attributes utilized for PM source identification and their subsequent remediation by plants. Finally, the benefits of SEM-image-based techniques for PM analysis are elucidated. This review offers a holistic understanding of the SEM-EDS and plant-based approach, presenting a promising avenue for addressing PM pollution and enhancing environmental quality.
1 Introduction
Ambient air pollution is projected to cause approximately four million premature deaths each year, with levels of air pollution continuing to rise in most locations (Neira and Prüss-Ustün, 2016; Shaddick et al., 2020). The correlation between human disease and poor air quality has been recognized since antiquity. The major health effect of air pollution entered the world in the 20th century (Speak et al., 2012). Among air pollutants, airborne particulate matter (PM) is made up of extremely small particles and liquid droplets containing soil and dust particles and many harmful substances like organic chemicals, acids, and metals United States Environmental Protection Agency. In PM, dust, dirt, and soot are quite visible with the naked eye; however, some are very small and can only be seen with the help of microscopes. The presence of PM in ambient air, which comes in a variety of sizes and chemical and biological components, is a major scientific and policy issue (Ali et al., 2019). The composition of PM encompasses both inorganic and organic components. Inorganic PM may include minerals, metals, and salts, while organic PM consists of carbon containing compounds originating from different types of sources like biomass burning or industrial emissions (Jimenez et al., 2009). According to the World Health Organization (WHO), in 2021, approximately 58% of outdoor air pollution-related deaths were due to ischemic heart disease and stroke. Moreover, about 18% of deaths occurred due to cardiopulmonary and acute lower respiratory infection, and 6% of lung cancer deaths are attributed to PM globally (WHO, 2021).
Atmospheric PM play major contribution in shaping the impacts of air quality. These particles, suspended in air, exhibit diverse chemical compositions, originating from both natural and anthropogenic sources. PM can be broadly classified based on their origin, such as natural geogenic and anthropogenic. The PM derived from natural processes such as mineral dust, sea salt, aerosols, biogenic emissions, forest fires, dust storms, volcanoes, and aerosolized sea salt. In contrast anthropogenic sources contribute PM through industrial activities, combustion processes, tobacco smoke and vehicular emissions (Speak et al., 2012; Seinfeld and Pandis, 2016). PM in the atmosphere is generated through primary and secondary processes. Primary PMs are directly emitted in air, such as soot from combustion or soil erosion particles. Secondary PM are formed in the environment through complex chemical reaction between primary PM involving precursors gases leading to the formation of fine PM (Kanakidou et al., 2005).
In most developing countries, the PM level is higher than the permissible limit due to continuous increase in industrialization and the number of vehicles (Speak et al., 2012). PM is classified according to its aerodynamic diameter: (a) Total suspended particulate matter (TSPM), (b) coarse PM (≤10 μm), (c) fine PM (≤2.5 μm), and (d) ultra-fine PM (≤1 μm) (Muhammad et al., 2020; Xie et al., 2020). PM with a diameter larger than 10 μm has a somewhat small suspension half-life and is predominantly filtered by our nose and upper airways. In environmental air samples, the total number and total surface area of these PM increase exponentially as the diameter of the PM reduces. However, PM mass will also reduce with the diameter. According to size ranges, <11 μm PM can enter the nasal passages of the human respiratory system, 7–4.7 μm can enter the pharynx, 4.7–3.3 μm can enter the trachea. PM with an aerodynamic diameter of 3.3–2.1 μm can enter the primary bronchi, 2.1–1.1 μm can enter the bronchi branches, 1.1–0.65 μm can enter the bronchiole, and <0.65 μm particles can enter the alveoli regions (Londahl et al., 2006). Studies also showed an increase in illness and mortality related to PM exposure (Anderson et al., 2012; Chen et al., 2022; Liang et al., 2022; Liu et al., 2022). PM causes many health complications such as cardiovascular diseases, cancers, neurodegenerative diseases, respiratory diseases (asthma), and viral infections (Thangavel et al., 2022). Much evidence is recorded in China, which reveals PM can increase the mortality rate due to asthma (Liu et al., 2022). Epidemiological studies related to human mortality provide proof of the relationship between short-term ambient PM10 and PM2.5 exposure with cardiac ischemic heart disease mortality. PM10 and PM2.5 show a linear relationship with cardiac ischemic heart disease mortality (Liang et al., 2022). Various instruments are installed at various locations, especially in urban and industrial locations around the globe, for the continuous measurement of PM in different size fractions such as TSPM and respirable suspended PM (RSPM) and also in lower fractions. To control pollution, we need to have proper measurement of PM with respect to its concentration levels in various size ranges.
In recent decades, numerous research studies on PM and its associations have been published. To facilitate authentic data collection associated with PM, the Web of Science stands out as the best-built tool. A network visualization was conducted using the Web of Science’s built-in tool and VOSviewer software. This analysis provides a clearer understanding of PM studies and global trends. Figure 1 illustrates the network visualization of terms associated with PM in the last 10 years (2012–2022) with at least 25 occurrences of associated keywords. Approximately 433 keywords meet the threshold of having a minimum of 25 occurrences. It depicts current trends in research and development regarding PM studies in the Web of Science. The word frequency in articles and its associations with other keywords are displayed on the cloud map. Each term in the network is represented by a circle, the size of which corresponds to the number of publications in which the term appears. The thickness of the lines indicates the strength of connections between topic areas or keywords, and the length of the curved lines indicates the approximate connection frequency. Each colour represents a group of terms grouped into clusters, showing connections between various topics.
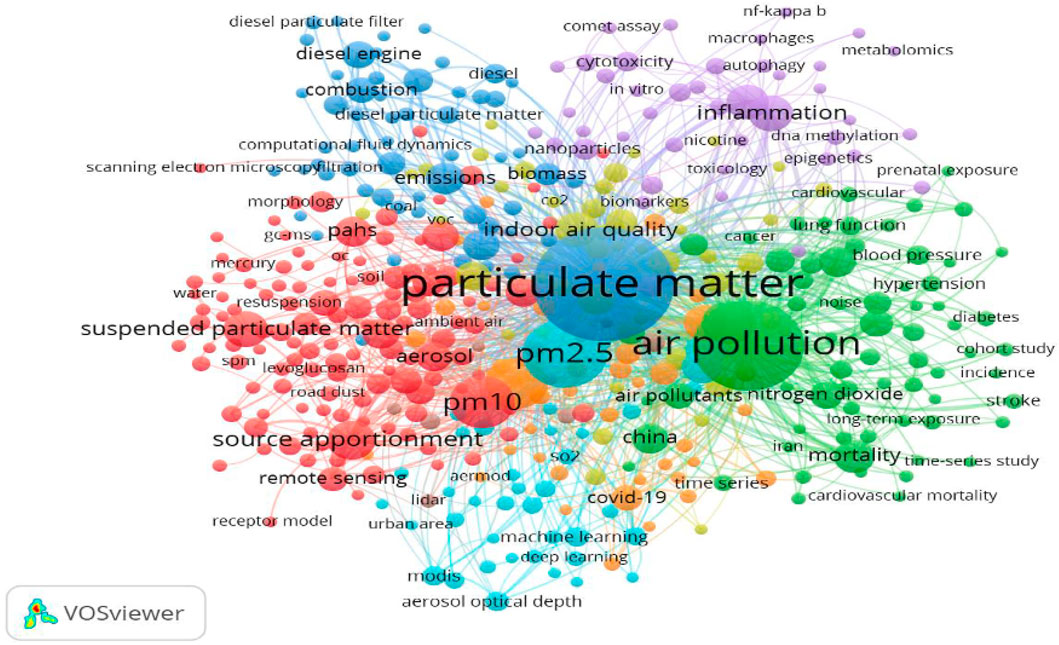
FIGURE 1. Network visualization of terms associated with PM.
The review work by Galvão et al. (2018) summarizes trends in analytical methods for the broad chemical characterization of PM from 1997 to 2018, and single-PM particle analysis has previously been addressed by Bzdek et al. (2012). Tiwari A. et al. (2022) discussed all possible methods for the study of PM based on the literature. It appears that the study of PM has primarily focused on its composition, particle size, and source apportionment. The morphology of PM unveils its origin, as each specific activity or source emitting PM exhibits distinct microscopic characteristics. (Liati et al., 2019; Zhang et al., 2022). SEM is an effective and easy tool for identifying the microscopic character of PM. The morphology of PM indicates the appearance, texture, and source of the particles. Consequently, SEM-based PM studies are crucial for accurately identifying particle characterization and composition (association with EDS). In context of SEM-EDS analysis, emphasis on mineral composition becomes paramount. Unlike other analytical technique like inductive coupled plasma (ICP), SEM-EDS provide insight into the morphological, elemental and mineralogical aspect of particles. This technique provides clear view on the source of PM. Mineral composition serves as a key indicator of their origin and generation processes (Fialová et al., 2017). However, a small number of studies have attempted to use SEM imaging to identify the PM shape. This review mainly focuses on the emerging approach of SEM-EDS based PM investigation and emphasizes how imaging of PM by SEM and chemical and mineralogical information by EDS is crucial for its source apportionment. SEM imaging methods for the study of PM have been shown as a schematic summary in Figure 2.
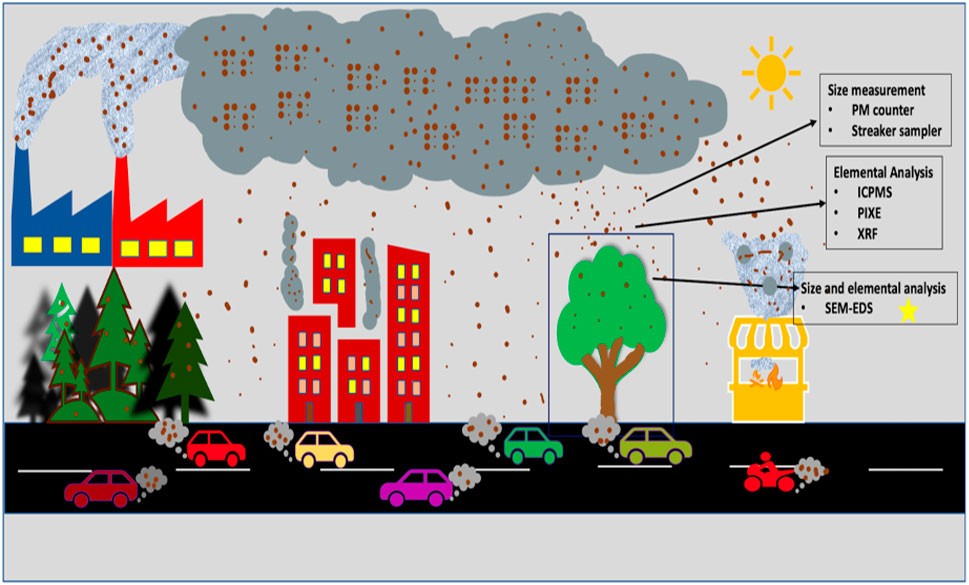
FIGURE 2. The source of PM in air and the most common SEM-based method adopted for their study.
2 Plant leaves as a bio-sampler of PMs
Studies have shown that plants are key points for filtering the air by absorbing PM on their leaves and remediating PM pollution (Escobedo et al., 2008; Cavanagh et al., 2009; Maher et al., 2022; Kim et al., 2023). PM is deposited on plant leaf surfaces by sedimentation under gravity and diffusion (i.e., Brownian motion) (Freer-Smith et al., 2005; Maher et al., 2022; Kim et al., 2023). Plants have the competence to retain PM on their surface through their micromorphological characters of leaves, macro structure of vegetation, and environmental variables like wind and temperature (Freer-Smith et al., 2005; Mo et al., 2015; Chen et al., 2017; Tiwari et al., 2022). The arrangement of leaves also plays a major role in enhancing PM deposition (Chaturvedi et al., 2013; Mo et al., 2015; Tiwari et al., 2022; Tiwari et al., 2023). Leaves are the best bio-samplers for PM sampling because many factors are responsible. The leaf morphology, leaf surface, leaf shape, leaf size, and foliage pattern of the leaf are responsible for the capturing of PM (Terzaghi et al., 2013; Wang et al., 2015; Corada et al., 2021).
In leaf morphology, trichomes were the most frequently cited leaf surface trait for capturing PM. Trichomes or leaf hairs have different variations in size and morphology and on leaf distribution pattern. Mostly they are present on the abaxial side of the leaves. Plants with a dense number of trichomes or leaf hairs on their adaxial surface are more efficient in capturing PM compared to those plants whose leaves are either glabrous (hairless) or have trichomes present on the abaxial surface and low-density trichomes (Saebo et al., 2012; Chen et al., 2017; Zhang et al., 2017; Li et al., 2019). Leaf roughness also influences PM capture. Leaves with rough surfaces are more efficient, and furrowed, ridged, and wrinkled surfaces can retain coarse PM (PM10) better than smooth leaves (Chaudhary and Rathore, 2018). Waxy coating also plays a major role in PM accumulation. Ultrafine particles become more enduringly absorbed in the leaf surface waxy coating (Hofman et al., 2014; Song, 2015). The shape and size of leaves also impact PM capture. Leaves with larger surface areas can intercept a greater volume of air, increasing the chances of PM deposition. Moreover, specific leaf shapes, such as compound leaves with multiple leaflets, can create additional surfaces for particle interception (Katoch, and Kulshrestha, 2022). Leaves have a special structure like stomata. Stomatal size, density, and guard cell area are special traits for PM capture. PM can be trapped in stomatal cavities and grooves, so large and dense stomata are more efficient at accumulating fine and ultra-fine PM (Chen et al., 2017; Zhang et al., 2017; Li et al., 2019). The entire leaf design of plants, including the arrangement and density of leaves, influences their ability to trap PM. Dense canopies with overlapping leaves can form a physical barrier that prevents airborne particles from passing directly through. Furthermore, differences in foliage density within a plant community might influence PM deposition patterns on leaves (Vardoulakis et al., 2003). Microscopic observation is commonly used to determine the amount of PM on leaves (Song et al., 2015; Sgrigna et al., 2016). It can quantify particles with original diameters of particles and by the shape and may indicate the source of particles (Stoffyn-Egli et al., 1997).
3 Scanning electron microscopy (SEM) based PM analysis
Microscopy can be used for measuring particle size distribution and the number of particles (Weber et al., 2014). SEM is commonly employed to visually quantify the PM captured by leaves and to identify the number, types, and sources of the PM (Deljanin et al., 2014; Manisha et al., 2016). The SEM images reveal the size, shape distribution, morphology, and chemistry of particles as small as a few nanometers. Consequently, it can provide information about a probable source that is not available through basic bulk chemical analysis (Tasić et al., 2006). Its capacity for greater magnification with appropriate resolution and a large depth of field makes it highly useful. SEM also has the ability to analyze the elemental composition of PM when combined with Energy Dispersive Spectroscopy (EDS) attached to the microscope (Kocic et al., 2014). However, the most commonly used method for SEM micrographs is to identify the size of PM and count PM using software-based analysis. Some studies have also utilized SEM micrographs in software for size distribution and quantification of particles. ImageJ software (Ottelé et al., 2010) was previously employed for quantifying PM in all size ranges (Gajbhiye et al., 2019; Tiwari et al., 2023).
3.1 Image based counting of PM by software
SEM images provide significant insights into the aggregation pattern and shape of PM. With the assistance of SEM images, the quantification of particles becomes possible. SEM micrographs are utilized for counting particles in different size fractions. Image-based software is employed for accurate measurement and counting of particles in various size fractions. The counting of PM10, PM2.5, and PM0.2 is achievable through SEM micrographs with the aid of ImageJ.
ImageJ is an image-based technique. To use this software, the image should be in binary (black and white) form. An electron microscope is used to take images of the PM sampling surface, such as plant leaves, filter papers, or another exposed surface of PM. The SEM images were captured at various magnifications (e.g., 100×, 250×, and 500×). After collecting the images, the particles are automatically quantified by this software package (Ottelé et al., 2010). With the help of SEM micrographs of sampled leaves, PM density is measured by this software package. Particle counting in all size ranges like PM10, PM2.5, PM1, and PM0.2 can be easily done (Song et al., 2015; Weerakkody et al., 2018b), and the average size of PM is also identified by this software (Zapata-Hernandez et al., 2020). For errorless data, an auto-threshold mechanism is applied to all the calculations (Ottelé et al., 2010). To explain any changes in PM accumulation due to variable edge effects, the leaf perimeter/leaf surface area ratio in each category was determined by this software. With the help of ImageJ software, we can identify the actual number of PMs in all size ranges (0.1–100 μm) and how much space they occupy on the leaf surface (Song et al., 2015; Zhang et al., 2022).
ImageJ software has two types of thresholding mechanisms (manual and automatic) built-in. Automatic thresholding is used for PM counting because it is not influenced by the user, but in manual thresholding, the user arranges the pixels by adjusting itself, creating biasness in counting PM. The watershed function in ImageJ was used to separate particles that were somewhat overlapping in a threshold image. Particles in this study, which are not circular, can still be counted (Ottelé et al., 2010). For better results, ×100 magnification images are used for >10 μm particles, 250× is used for PM10, and 500× magnification image is used for PM2.5. The magnifications of 250× and 500× were employed, respectively, 6.25 and 25 times, to make up for the loss in counting area caused by the zooming effect (Ottelé et al., 2010). The category of the particle (coarse, fine, or ultrafine) that is more prevalent on the surface of the leaves can also be determined by counting particles in various size ranges by ImageJ. After that, these results help in selecting those plants which are efficient in capturing fine and ultrafine particles (Shi et al., 2017). This software assists in recognizing the particle concentration on plant leaves, making it simple to correlate it with the atmospheric PM concentration of a specific area (Sternberg et al., 2010). Particle counting can also help identify the source of PM because smaller, and more numerous particles typically arise from industrial sources. If there are fewer, bigger particles present, they are likely to come from soil or other natural sources. Palma et al. (2017) studied the rural sites always had the least particles, whereas urban and industrial sites had the most. Another study which was based on SEM-image was able to reveal that PM concentration in the air is distinguishable between summer and winter seasons. As the summer season has more PM concentration in the air, it was evident from more accumulation on plant leaf surfaces as compared to the winter season when studied with SEM-ImageJ method (Kumar and Elumalai, 2018). So, it is sensitive enough to distinguish the seasonal variation.
The SEM-based imaging facility of PM on the plant leaf surface provides PM appearance with morphology and the pattern of accumulation on the leaf surface. ImageJ software analysis of SEM micrographs provided the distinct deposition pattern of PM on different leaf surfaces (adaxial Vs. abaxial) (Gajbhiye et al., 2019). Plant leaves have adaxial and abaxial surfaces, and both surfaces have different morphology with variable capture efficiency. For instance, in Calotropis procera, fine PM accumulation was higher at the abaxial surface, and larger PM accumulation was found at the adaxial surface (Gajbhiye et al., 2019). This pattern was observed by the SEM image of the sampled leaf of C. Procera, and counting was done by ImageJ software. This type of innovative method uses object-based image processing to automatically estimate PM on tree leaves from SEM micrographs. This method is very useful for the selection of plants for removing PM from the air (Li et al., 2021; Tiwari et al., 2023). Plant leaves can accumulate PM, and the SEM image of the plant leaves gives information about the accumulation pattern of PM in different size ranges. PM size, shape, and number were also identified if the SEM images are analyzed by ImageJ software. After the analysis (PM counting in different size ranges), the selection of better plants for removing PM in the respirable range from the air is possible. For instance, Tiwari et al. (2023) studied six plants for the selection of suitable plants for removing PM from the air. In this research, SEM images-based method was used incorporated with ImageJ and found that Dalbergia sissoo is the best-performing plant for removing air in the respirable range (Tiwari et al., 2023). As compared to leaves with rough surfaces and bigger trichomes, smooth leaves with smaller trichomes retain more fine and ultrafine particles (Tiwari et al., 2023). Smaller leaves, lobed shapes, hairy and rough leaf surface are more effective in retaining the PM on its surface (Weerakkody et al., 2017; 2018b). Another study was done by Weerakkody et al. (2019) in which they used SEM-ImageJ method and demonstrated that the arrangement of plants may also affect the PM retention capability. Findings of this study showed that planting with heterogeneous topography should enhance the PM retention ability compared to homogenous topography planting design (Weerakkody et al., 2019). SEM-ImageJ based study also used for the characterization of PM which was emitted from pyrolysis (burning in the absence of O2). For instance, pyrolysis of cashew nuts at 700°C emits smaller particles as compared to pyrolysis at 500°C (Kibet et al., 2017). Based on these findings and literature reviews, high-temperature cooking may potentially be a source of dangerous PM, molecular toxins, intermediates, and free radicals, which may be precursors to disease (Kibet et al., 2017; Chen et al., 2022; Liang et al., 2022).
4 Morphological analysis of PM by SEM images
SEM Microscopy can be used to observe the particle deposition pattern on plant leaves, and the capture of PM from the environment by plants is considered an important ecosystem service. The deposition of PM on plant leaves can occur in two ways. Firstly, plants have the ability to retain particles on the leaf surface through their micromorphological characteristics, such as stomata, trichomes, and epicuticular wax (Terzaghi et al., 2013). Secondly, particles deposited on the leaf surface may be temporary and can resuspend in the air when there is a change in air flow or an increase in wind speed. Thus, leaves possess special micromorphological characteristics to adhere particles to their surface (Nowak et al., 2014). Microscopy can be employed to measure the size and shape of PM. SEM is commonly used to visualize particles and identify types of PM. With this approach, significant information about the size and shape characteristics of the particles captured on leaves can be collected. The characteristics of particles, such as roundness, compactness, and shape index, provide insights into the source of the particles (Slezakova et al., 2008; Makkonen et al., 2010; McDonald and Biswas, 2012).
Morphological studies of PM facilitate comparative research on the PM capturing efficiency of different plant species and source apportionment of PM based on their morphological characteristics. This method can also provide insights for species selection for specific pollutant reduction (Yan et al., 2016). Particles can be divided into fifteen subcategories based on their shape, size, and general appearance (Freer-Smith et al., 1997). Smooth sphere, agglomerate round and ovoid, agglomerate flat, agglomerate free shape, nodules like, hollow sphere, and hollow irregular-shaped are considered inorganic particles. Cylindrical dehydrated spores, symmetrical spores, rough spherical, and sheet material often curled are considered organic particles (Freer-Smith et al., 1997). Hollow sphere particles are assumed to be incomplete combustion products. Probably inorganic materials are amorphous and free-shaped. Some particles are not distinguishable because they do not show similarity to the classified categories, so they are not assigned to any group. Most of the amorphous inorganic particles probably come from the soil, mainly containing silicon, iron, and aluminum (Breed et al., 2002; Almeida et al., 2006; Castanheiro et al., 2020). Beckett et al. (2000) also categorized particles similarly to Freer-Smith et al. (1997). However, they divided inorganic amorphous particles based on their size (<2.5 μm and >2.5 μm), with inorganic and amorphous particles smaller than 2.5 μm assumed to be of anthropogenic origin (Guevara, 2016), as the majority of particles in this size range are present in the air.
Morphological analysis is always appreciated for the ability to link particles back to their origin. For instance, particles of hollow carbonaceous sphere shape are emitted from the burning of fossil fuels. It is difficult to assign the source of agglomerated particles and mass of mixed materials. They mostly come from anthropogenic sources. The average size of anthropogenic PM is less than 10 μm. It can also be observed that particles emitted by anthropogenic sources are generally smaller than those produced from natural sources (Beckett et al., 2000). According to Sagnotti et al. (2009), particles rich in iron, with a size range of 0.1–5 μm, of which 1–2 μm is more common. The iron-rich particles have variable shapes, ranging from rounded to irregular, and were found in high traffic squares in Rome metropolitan areas. These particles showed a distinctive rough, moss-like surface composed of adjoined or aggregated, sub-round particles typically about 50–60 nm in size (Sagnotti et al., 2009). Tasić et al. (2006) classified particles into two categories using SEM-based PM morphology in the urban area of Belgrade. First, materials of organic origin were among the particles of natural origin (pollens, bacteria, fungal spores). Suspended soil dust (mostly minerals) and angular-shaped objects were also included in this group. Second, particles from anthropogenic sources were defined by their special shape and smooth surface, which were usually emitted by high-temperature combustion processes (Tasić et al., 2006). A large amount of PM is emitted from iron and steel-based industries. These types of industries emit two types of PM: stack PM and fugitive PM (Zhang et al., 2022). In recent research, it was found that fugitive PM emitted by the steel industry has five forms based on their microscopic morphology: spherical, irregular blocky, chain, lamellar, and flocculent particles (Zhang et al., 2022). Spherical particles are Si, Al, and Fe-rich and come from high-temperature combustion. Irregular blocky particles are Fe, Si, Ca, and Mg-rich and mostly produced by mechanical processes (crushing, belt conveying, unloading, and dropping) in iron industries. Chain and flocculent particles are composed of volatile minerals and lamellar particles are carbon-rich (Zhang et al., 2022). Airborne fiber PM has its special morphological characters and appearance, providing insights into the source of PM (Li et al., 2020). Microplastic fiber particles show spiral forms with a smooth surface, natural organic fibers show regular fibrous and elongated shapes. Man-made mineral fibers are regular fibers with a bar-shape, asbestos shows needle-like morphology, calcium sulfate fibers appear with a smooth strip-like surface, and metal fibers are regular to irregular fibrous shapes observed in SEM images (Li et al., 2020). Some possible PM morphology with sources is shown in Table 1.
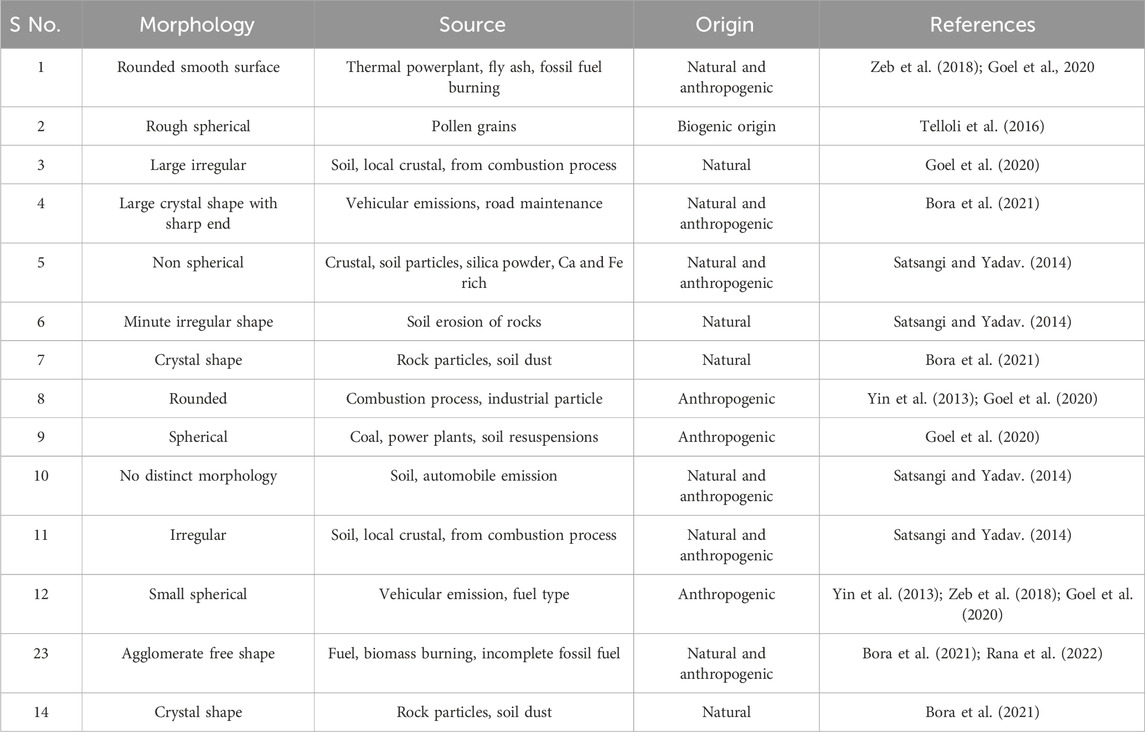
TABLE 1. Source identification of PM by their morphological character.
5 Particle chemical characterization by SEM-EDS
For source identification, the characterization of PM and the identification of its chemical composition are required. The elemental composition of airborne PM deposited on plant leaf surfaces has been shown to be strongly linked to pollution sources (Umbrìa et al., 2004; Canepari et al., 2008; Thorpe and Harrison, 2008; Sgrigna et al., 2016; Baldacchini et al., 2017; Baldacchini et al., 2019). SEM analysis combined with EDS can now offer a full characterization of PM deposited on plant leaves (Castanheiro et al., 2016; Weerakkody et al., 2018a; Castanheiro et al., 2020). These methods primarily provide information on the quantity, morphology, and elemental content of PM. SEM-EDS was used to investigate PM samples to determine their composition, making an effort to differentiate whether the PM came from anthropogenic or natural sources.
Based on SEM-EDS observations, particles can also be classified into anthropogenic, geogenic, and biogenic particles (Usman et al., 2022). Anthropogenic particles are mostly produced by industrial, vehicular, and fossil fuel combustion, among others. Carbonaceous particles are those with a content of C and O greater than 92% (Cong et al., 2009; Tumolva et al., 2010; Deka and Hoque, 2014; Bhuyan et al., 2018). The concentration of carbon in the air increases due to incomplete burning of biomass and fuels (Sahu et al., 2012). Sulfur in the PM indicates its origin from sulfur included in the fuel during the combustion process and is most often associated with secondary formation. (Pósfai et al., 2003; Jimenez et al., 2009; Agarwal et al., 2011; Seinfeld and Pandis, 2016). Biogenic particles were quantified using the technique used by Matthias-Maser and Jaenicke (Matthias-Maser and Jaenicke, 1994). Many scientists have discovered that particles of biological origin (living or dead) include tiny amounts of Na, Mg, K, P, Si, Fe, Cl, Al, and Ca in various sizes and shapes (Artaxo and Hansson, 1995; Matthias-Maser et al., 2000a; 2000b; Pófsai and Buseck, 2010; Kaur et al., 2022). The composition of biogenic PM is relatively different from others, showing O and C concentrations less than 75%, K more than 1%, and P and Cl less than 10%. These particles include plant debris, animal matter, bacteria, viruses, pollens, and spores (Iordanidis et al., 2008; Coz et al., 2010; Malli Mohan et al., 2019; Tiwari et al., 2022). Particles generated by natural crust are termed as geogenic particles. This particle mainly includes aluminosilicate, calcium-rich, and quartz (Al, Ca, C, Fe, Mg, O, K, Si, and Na). Aluminosilicate makes up to 72% of all chemical compounds found in the Earth’s crust (Davidovits, 1994; Cong et al., 2009). Bioaerosol also identified by their chemical compositions. Bioaerosols mainly includes virus, bacteria, pollen grains, animal and plant debris, and spores. The concentration of O and C is more than 75% and Cl, Ca, S, P were present in minimum amount (e.g., Chen et al., 2012; Usman et al., 2022).
The composition of PM provides more information regarding pollution sources. Some particles have specific characteristics and compositions. Thus, using SEM-EDS, the elemental composition of particles was determined, and the origin of the particles can be better understood. It can be seen that the most abundant element found in the PM was Si, which has been found to be a marker of soil particle origin (Chow et al., 1996). Similarly, a high amount of S and P marks the presence of particles from anthropogenic combustion sources (Fung and Wong, 1995). Higher calcium concentration in PM is due to the presence of chalky soils (Beckett et al., 2000). Agglomerated particles with elements attributed to diesel (C, Na, Mg, K, Al, Si, P, and Cl), coal (Al, Si, Fe, Ca, S, Na) and coal ash (C, Al, Si, K, Ca) are generated by high traffic at roadside plants of industrial area (Searle, 2001; Tomasevic and Anicic, 2010). The C, O, Si, Ca, Na, and Mg in the PM could have derived from natural sources. Particles containing Pb, Br, Fe, Cd, Ni, Zn and Cl, on the other hand, could be the product of anthropogenic activity (Ottelé et al., 2010; González et al., 2018). According to Tomasevic and Anicic, (2010), such PM with the composition Si, Al, Fe, Mg, N, S, Ca, K, and Cl are the soil dust. On the other hand, PM emitted from fuel burning were rich in Al, Si, Ca, Ni, Fe, V, and Pb. PM with an irregular shape and a high concentration of Fe, O, Si, Mg, and Al could have derived from soil dust resuspension, with a diameter of less than 3 μm (Song et al., 2015; Engelbrecht et al., 2016). PM with a diameter of around 10 μm and a spherical shape, as well as a significant concentration of Pb and Br, and presence of S, Ca, Na, Mg, and Cl could have come from vehicle exhaust (e.g., Nor et al., 2022). Fe particles with 86% of Fe weight originated from iron industries. PM including C, O, Si, Fe, and Ca came mostly from natural sources and to a lesser extent from human activities (Goudie, 2009; Wang et al., 2012). PM2.5 (fine particles) were almost emitted from anthropogenic sources with a total content of C 50.18% and O 31.74% (accounting for 81.92%). The PM with Pb rich and composition with Fe, Zn, Ni, and Cu are the characteristics of PM emitted from local industrial processes (Tomasevic and Anicic, 2010; Daellenbach et al., 2020) and Fe rich with composition of Cu, Zn, Pb, Ni, an Cr are emitted form traffic sources (Moreno et al., 2003; Slezakova et al., 2008). The content of Mg, Al, Si, Cl, Ca, Fe, and Pb were higher, and these components were related to diesel fumes and coal dust (Ottelé et al., 2010). Some possible sources of elements are shown in Table 2. Recent studies related to PM source identification by its composition show different observations. For instance, condensable PM is a mixture of several gases (from coal industries), and its character shows both morphological and elemental composition evidence (Oroumiyeh et al., 2022). Condensable PM exhibits a spherical morphology in SEM and is characterized by the presence of elements such as Hg, As, Se, and Sb in its composition. PM emitted by heavy traffic has some special characteristics, such as containing Ba, Cr, Cu, Mo, Pd, Zn, and Zr in both PM10 and PM2.5; however, Fe, Li, Mn, Bi, Mo and Ti were mainly associated with PM2.5 in traffic emissions (Oroumiyeh et al., 2022; Alves et al., 2023). Some PM emitted from quarries, burning fossil fuels have a mixture of Ca, Si, Pb, Ca, Fe, Ti, and Al possible metals (Zapata-Hernandez et al., 2020).
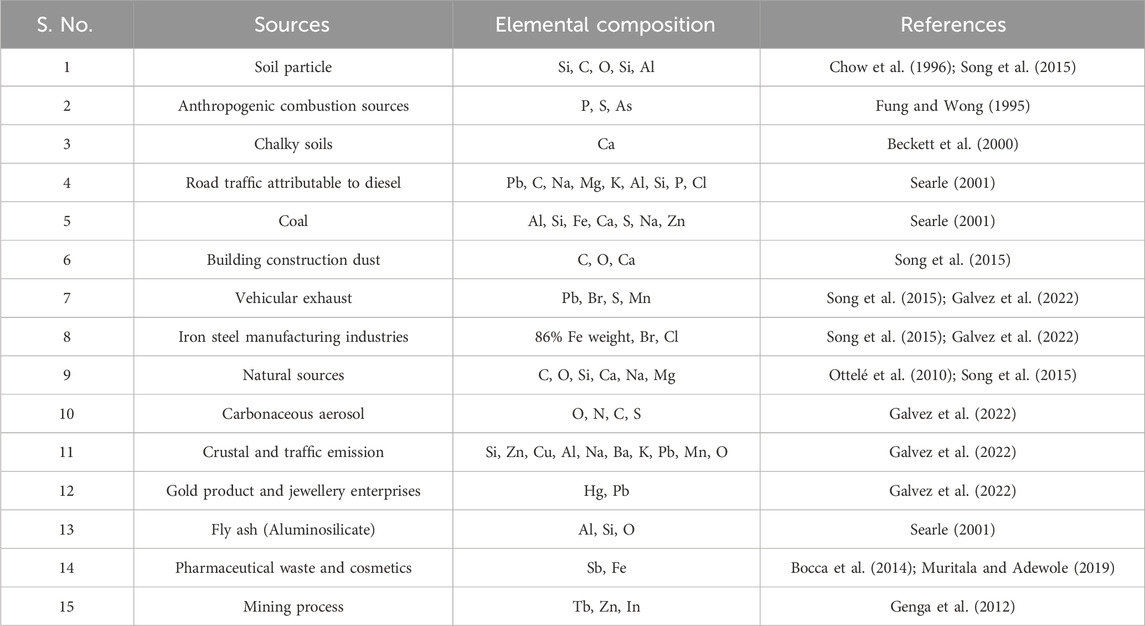
TABLE 2. Source identification of PM by their elemental composition.
6 Mineralogical composition of PM based on SEM-EDS
Atmospheric PM is composed of various solid and liquid substances. Classification of atmospheric PM according to their size, with respect to their mineralogical character, indicates their potential to affect human health and source identification (Pope and Dockery, 2006). Mineral dust PM plays a major part in atmospheric aerosols, contributing 35%–40% of global aerosols from different natural sources (Ramanathan et al., 2001). Additionally, mineral dust particles aid in reducing ambient ozone levels by approximately 5% (Soler et al., 2016). These particles, when carried by dust storms, can be transported over long distances, leading to impacts at regional and even global scales (Weinzierl et al., 2017). Therefore, understanding the dynamics of mineral dust aerosols is essential for comprehending their role in atmospheric processes and their potential environmental implications. Most of the mineral dust PM are found with irregular shapes or amorphous (Bora et al., 2021).
A recent work by Górka et al. (2020) focused on atmospheric PM characterization. They divided the PM according to their mineralogical composition into three groups. Group 1 primarily reflects industrial activities, showcasing a prevalence of Si/Al particles (58.2%), often containing toxic metals (34%). These particles are found across all size fractions (PM10, PM2.5, and PM0.2), indicating widespread industrial emissions. Group 2, on the other hand, highlights urban influences, with terrigenous particles dominating the composition, along with sulfides and Ca/P/K spherules, originating from various urban sources like chemical plants and agricultural practices. Lastly, Group 3 predominantly consists of particles derived from natural geological processes, particularly from the local areas, featuring terrigenous phases like quartz (42.9%) alongside other mineral components (Górka et al., 2020). Particles with the composition of some elements (Al, Ca, Fe, Mg, Mn, Ni, and Si) showed the presence of alumina silicate, mica, quartz-like materials. This mineralogical composition denotes that PM generated from resuspension of dust from soil and other anthropogenic particles emitted from the burning of fossil fuels and biomass (Pipal et al., 2014; Bhardwaj et al., 2017; Sonwani and Kulshrestha, 2018). Teper (2009) also classified particles based on their origin of mineral components, which include tailing pond components (Pb, Zn, Fe sulfides; Pb, Zn carbonates; Fe sulfates), natural components from rock and soil erosion (aluminosilicates, quartz, Ca-Mg, Ca carbonates), and other pollutants from various airborne sources (aluminosilicate glass, Fe-Zn oxides, Fe oxides). However, overlap of some components between groups occurs due to shared components like carbonates and aluminosilicates, and some pollutants can also originate from natural sources (Teper, 2009).
Mineral-rich atmospheric PM inhaled by humans is very toxic, causing silicosis, tuberculosis, lung cancer, and chronic bronchitis (Merget et al., 2002). Clay mineral-rich PM has been reported to have minimal or no toxic effect (Carretero et al., 2006). SEM-EDS results showed the mineralogical information of PM. The detection of elements on EDS like Al, Si, O, Mg, C, Ca, Na, and Fe has clearly confirmed the presence of quartz and aluminosilicate. The presence of high silicon and oxygen (Si + O = >50%) content in PM denotes the presence of quartz (SiO2). These particles come into the environment by both natural and anthropogenic processes (Pachauri et al., 2013; Satsangi and Yadav, 2014). Silica is widely present in the earth’s crust and a major component of granite and sandstone. Furthermore, silica is widely used in construction processes such as ceramics, cements, bricks, clays, and glass. So, this type of PM is emitted from the construction and renovation of buildings (Pachauri et al., 2013). The size range of silica particles is near about 0.2–0.5 μm (Usman et al., 2022). If in PM EDS analysis Al, Si, Ca, O present in higher percentage, it confirms the presence of biotite, almandine, and grossular minerals (Pachauri et al., 2013; Usman et al., 2022). Aluminosilicate is also widely present in the earth’s crust (70%) (Cong et al., 2009). These particles are made up of oxides of Al and Si, with varying quantities of Fe, Mg, Na, Ca, and K. The average size of these particles ranges from 2.5 to 30 μm (Usman et al., 2022). These types of PM show sharp angular structures and have been identified as Na-feldspar (albite), K-feldspar (K aluminosilicate), Mg-Fe aluminosilicate, and Ca-Mg aluminosilicate (Satsangi and Yadav, 2014; Anake et al., 2016; Usman et al., 2022). By the help of elemental composition of SEM-EDS analysis, some particles are nitrate-rich with irregular shapes (Matsuki et al., 2005). Nitrate particles are present in the form of NaNO3, HNO3, and other nitrogenous compounds (Teinilä et al., 2000). With the help of SEM-EDS, Lu et al. (2007) identified the mineral composition of PM present in the air in Beijing, China. They found different minerals such as illite, smectite, chlorite, quartz, feldspar, calcite, gypsum, kaolinite, present in the form of respirable PM (Lu et al., 2007). In a recent study by Bartz et al. (2021), PM was categorized by their mineral compositions into 11 different groups. Three groups were associated with natural sources, while others were emitted from anthropogenic sources like smelter industries. The presence of Si and Al elements in respirable PM indicates the involvement of anthropogenic activity (Bartz et al., 2021). Terrigenous minerals (quartz, feldspar, mica) and clay minerals are emitted from natural sources or the earth’s crust (Bartz et al., 2021). Other minerals such as halite, rutile, amphibole, apatite, sulfides (Zn, Cu, Pb, Fe), carbonates (dolomite, calcite, siderite), and gypsum are emitted from most anthropogenic sources (Table 3) (Song et al., 2014; Bartz et al., 2021). Geogenic particles identified by their mineralogical compositions include aluminosilicates, quartz, fly ash, chloride particles, iron-silicon alloys, and calcium carbonate particles. These particles originate from sources such as soil sediment, biomass burning, construction activities, and windblown dust, contributing to the composition of PM in the atmosphere (Ahmad et al., 2023).
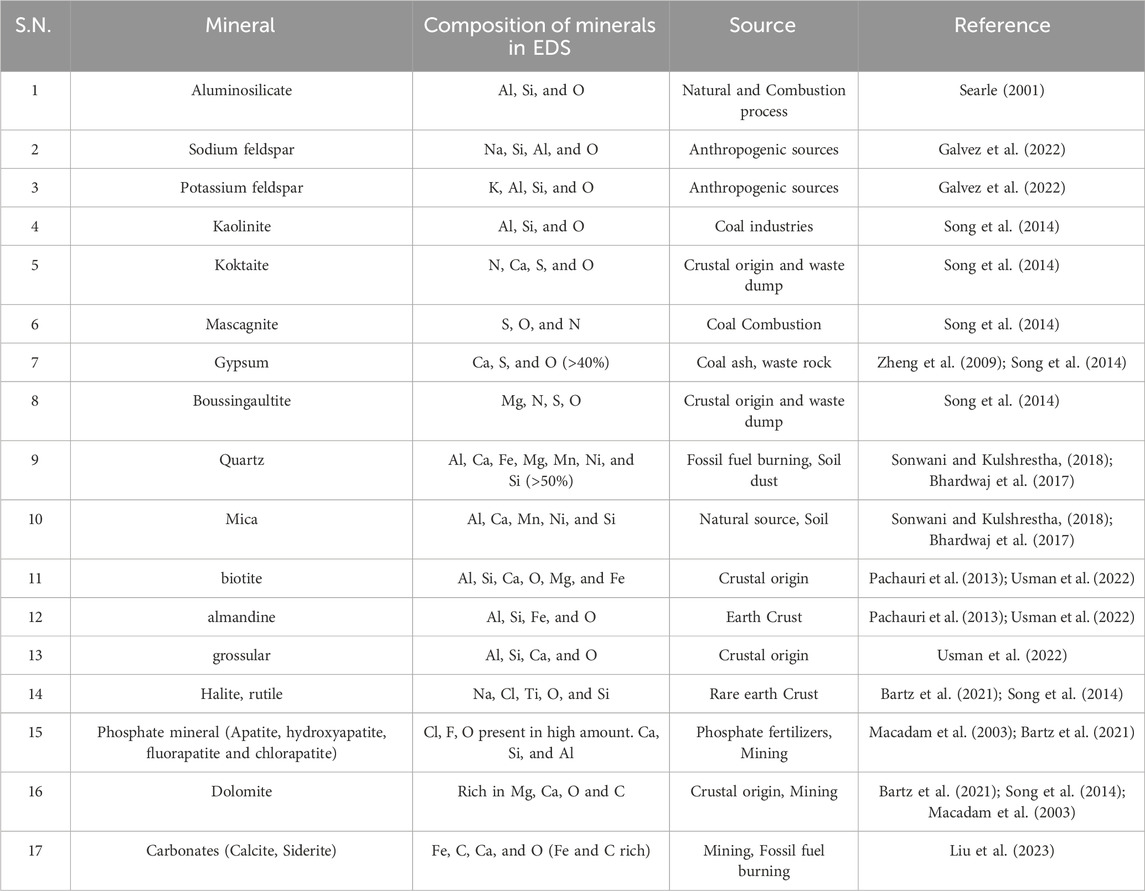
TABLE 3. Source identification of PM by their mineralogical composition.
The mineralogical composition of PM varies with the source of origin and the size of the PM. Hematite (Fe2O3) is associated with larger-sized PM emitted from industrial emissions from iron ore handling (Machemer, 2004). Magnetite (Fe3O4) and pyrite (FeS2) are associated with coarse particles and emitted from coal combustion and steelmaking (Gürdal et al., 2015; Jabłońska and Janeczek, 2019). These PM were identified by EDS analysis to contain high amounts of Fe and O (>50%) (Trechera et al., 2020; Galvão et al., 2022). Metallic iron and iron silicate are also associated with coarse particles (Tugrul et al., 2009). Carbonaceous particles are associated with coal and coke emissions. Silicates decrease with particle size, and sulfates are more abundant in PM2.5, with primary industrial emissions contributing significantly (Galvão et al., 2022). SEM-EDS-based analysis of PM mineralogical composition facilitates the identification of sources, whether they are anthropogenic, geogenic, or natural. This composition also reveals chemical alterations in primary pollutants and provides insight into secondary airborne pollutants. Once sources are identified, it becomes easier to devise strategies for reducing PM emissions through source modifications.
7 Concluding remarks
Airborne PM poses a significant health risk due to its association with various harmful substances. The majority of PM is within the respirable range for humans (<10 μm), causing adverse effects on health. Numerous studies have linked ambient PM pollution to over four million premature deaths, contributing to a range of ailments from cardiovascular diseases and respiratory disorders to cancers and viral infections. Addressing this issue requires the development of effective techniques for source identification and remediation.
In this review, an SEM-image-based method is described for PM source apportionment and their counting on the leaf surface using ImageJ software. The review focuses on the use of SEM as an efficient tool for PM analysis, coupled with EDS, providing detailed information about the morphological and chemical and mineralogical composition of PM, thus aiding in source identification. Furthermore, the inclusion of network visualization provides a clear representation of terms associated with PM on a global research platform. The review also highlights the role of ImageJ software in the SEM-based micrograph study of PM, showcasing its importance.
The combined use of both techniques allows for accessing the PM accumulation pattern on different plant leaf surfaces, along with the counting of PM in various size ranges and source identification by their chemical and mineralogical composition. This approach also assists in selecting suitable plant species for the removal of PM from the air. In summary, the review emphasizes the multifaceted nature of the relationship between PM and human health, incorporating aspects of pollution measurement, plant-mediated remediation, advanced imaging techniques, and data analysis tools. As research in this field progresses, a holistic understanding of PM dynamics will be crucial for developing targeted interventions to combat the alarming health implications of ambient air pollution.
Author contributions
AT: Conceptualization, Visualization, Writing–original draft, Writing–review and editing. MP: Writing–review and editing. AsT: Writing–review and editing. ArT: Writing–review and editing. RD: Writing–review and editing. SP: Supervision, Validation, Writing–review and editing.
Funding
The author(s) declare that no financial support was received for the research, authorship, and/or publication of this article.
Acknowledgments
The authors acknowledge the support received by the Guru Ghasidas Vishwavidyalaya for fellowship and workspace.
Conflict of interest
The authors declare that the research was conducted in the absence of any commercial or financial relationships that could be construed as a potential conflict of interest.
The author(s) declared that they were an editorial board member of Frontiers, at the time of submission. This had no impact on the peer review process and the final decision.
Publisher’s note
All claims expressed in this article are solely those of the authors and do not necessarily represent those of their affiliated organizations, or those of the publisher, the editors and the reviewers. Any product that may be evaluated in this article, or claim that may be made by its manufacturer, is not guaranteed or endorsed by the publisher.
References
Agarwal, A. K., Gupta, T., and Kothari, A. (2011). Particulate emissions from biodiesel vs diesel fuelled compression ignition engine. Renew. Sustain. Energy Rev. 15 (6), 3278–3300. doi:10.1016/j.rser.2011.04.002
Ahmad, S., Zeb, B., Ditta, A., Alam, K., Shahid, U., Shah, A. U., et al. (2023). Morphological, mineralogical, and biochemical characteristics of particulate matter in three size fractions (PM10, PM2. 5, and PM1) in the urban environment. ACS omega 8 (35), 31661–31674. doi:10.1021/acsomega.3c01667
Ali, M. U., Liu, G., Yousaf, B., Ullah, H., Abbas, Q., and Munir, M. A. M. (2019). A systematic review on global pollution status of particulate matter-associated potential toxic elements and health perspectives in urban environment. Environ. Geochem. Health 41, 1131–1162. doi:10.1007/s10653-018-0203-z
Almeida, S. M., Pio, C. A., Freitas, M. C., Reis, M. A., and Trancoso, M. A. (2006). Approaching PM2. 5 and PM2. 5− 10 source apportionment by mass balance analysis, principal component analysis and particle size distribution. Sci. Total Environ. 368 (2 3), 663–674. doi:10.1016/j.scitotenv.2006.03.031
Alves, C., Evtyugina, M., Vicente, E., Vicente, A., Rienda, I. C., de la Campa, A. S., et al. (2023). PM2. 5 chemical composition and health risks by inhalation near a chemical complex. J. Environ. Sci. 124, 860–874. doi:10.1016/j.jes.2022.02.013
Anake, W. U., Ana, G. R., and Benson, N. U. (2016). Study of surface morphology, elemental composition and sources of airborne fine particulate matter in Agbara industrial estate, Nigeria. Int. J. Appl. Environ. Sci. 11 (4), 881–890.
Anderson, J. O., Thundiyil, J. G., and Stolbach, A. (2012). Clearing the air: a review of the effects of particulate matter air pollution on human health. J. Med. Toxicol. 8 (2), 166–175. doi:10.1007/s13181-011-0203-1
Artaxo, P., and Hansson, H. C. (1995). Size distribution of biogenic aerosol particles from the Amazon Basin. Atmos. Environ. 29 (3), 393–402. doi:10.1016/1352-2310(94)00178-N
Baldacchini, C., Castanheiro, A., Maghakyan, N., Sgrigna, G., Verhelst, J., Alonso, R., et al. (2017). How does the amount and composition of PM deposited on Platanus acerifolia leaves change across different cities in Europe? Environ. Sci. Technol. 51 (3), 1147–1156. doi:10.1021/acs.est.6b04052
Baldacchini, C., Sgrigna, G., Clarke, W., Tallis, M., and Calfapietra, C. (2019). An ultra-spatially resolved method to quali-quantitative monitor particulate matter in urban environment. Environ. Sci. Pollut. Res. 26 (18), 18719–18729. doi:10.1007/s11356-019-05160-8
Bartz, W., Górka, M., Rybak, J., Rutkowski, R., and Stojanowska, A. (2021). The assessment of effectiveness of SEM-EDX and ICP-MS methods in the process of determining the mineralogical and geochemical composition of particulate matter deposited on spider webs. Chemosphere 278, 130454. doi:10.1016/j.chemosphere.2021.130454
Beckett, K. P., Freer-Smith, P. H., and Taylor, G. (2000). The capture of particulate pollution by trees at five contrasting urban sites. Arboric. J. 24 (2-3), 209–230. doi:10.1080/03071375.2000.9747273
Bhardwaj, P., Singh, B. P., Pandey, A. K., Jain, V. K., and Kumar, K. (2017). Spatial variation of aerosol optical depth and solar irradiance over Delhi -ncr during summer season. Int. J. Appl. Environ. Sci. 12 (5), 389–395. doi:10.12944/cwe.12.2.22
Bhuyan, P., Deka, P., Prakash, A., Balachandran, S., and Hoque, R. R. (2018). Chemical characterization and source apportionment of aerosol over mid Brahmaputra Valley, India. Environ. Pollut. 234, 997–1010. doi:10.1016/j.envpol.2017.12.009
Bocca, B., Pino, A., Alimonti, A., and Forte, G. (2014). Toxic metals contained in cosmetics: a status report. Regul. Toxicol. Pharmacol. 68 (3), 447–467. doi:10.1016/j.yrtph.2014.02.003
Bora, J., Deka, P., Bhuyan, P., Sarma, K. P., and Hoque, R. R. (2021). Morphology and mineralogy of ambient particulate matter over mid-Brahmaputra Valley: application of SEM–EDX, XRD, and FTIR techniques. SN Appl. Sci. 3, 137–215. doi:10.1007/s42452-020-04117-8
Breed, C. A., Arocena, J. M., and Sutherland, D. (2002). Possible sources of PM10 in Prince George (Canada) as revealed by morphology and in situ chemical composition of particulate. Atmos. Environ. 36 (10), 1721–1731. doi:10.1016/S1352-2310(01)00500-3
Bzdek, B. R., Pennington, M. R., and Johnston, M. V. (2012). Single particle chemical analysis of ambient ultrafine aerosol: a review. J. Aerosol Sci. 52, 109–120. doi:10.1016/j.jaerosci.2012.05.001
Canepari, S., Perrino, C., Olivieri, F., and Astolfi, M. L. (2008). Characterisation of the traffic sources of PM through size-segregated sampling, sequential leaching and ICP analysis. Atmos. Environ. 42 (35), 8161–8175. doi:10.1016/j.atmosenv.2008.07.052
Carretero, M. I., Gomes, C. S. F., and Tateo, F. (2006). Chapter 11.5 clays and human health. Dev. Clay Sci. 1, 717–741. doi:10.1016/S1572-4352(05)01024-X
Castanheiro, A., Hofman, J., Nuyts, G., Joosen, S., Spassov, S., Blust, R., et al. (2020). Leaf accumulation of atmospheric dust: biomagnetic, morphological and elemental evaluation using SEM, ED-XRF and HR-ICP-MS. Atmos. Environ. 221, 117082. doi:10.1016/j.atmosenv.2019.117082
Castanheiro, A., Samson, R., and De Wael, K. (2016). Magnetic-and particle-based techniques to investigate metal deposition on urban green. Sci. Total Environ. 571, 594–602. doi:10.1016/j.scitotenv.2016.07.026
Cavanagh, J. A. E., Zawar-Reza, P., and Wilson, J. G. (2009). Spatial attenuation of ambient particulate matter air pollution within an urbanised native forest patch. Urban For Urban Green 8 (1), 21–30. doi:10.1016/j.ufug.2008.10.002
Chaturvedi, A., Kamble, R., Patil, N. G., and Chaturvedi, A. (2013). City–forest relationship in Nagpur: one of the greenest cities of India. Urban For Urban Green 12 (1), 79–87. doi:10.1016/j.ufug.2012.09.003
Chaudhary, I. J., and Rathore, D. (2018). Suspended particulate matter deposition and its impact on urban trees. Atmos. Pollut. Res. 9 (6), 1072–1082. doi:10.1016/j.apr.2018.04.006
Chen, L., Zou, R., Yang, M., and Zhang, Z. (2017). Variation in tree species ability to capture and retain airborne fine particulate matter (PM2.5). Sci. Rep. 7 (1), 3206. doi:10.1038/s41598-017-03360-1
Chen, Q., Chen, Q., Wang, Q., Xu, R., Liu, T., Liu, Y., et al. (2022). Particulate matter and ozone might trigger deaths from chronic ischemic heart disease. Ecotoxicol. Environ. Saf. 242, 113931. doi:10.1016/j.ecoenv.2022.113931
Chen, X., Ran, P., Ho, K., Lu, W., Li, B., Gu, Z., et al. (2012). Concentrations and size distributions of airborne microorganisms in Guangzhou during summer. Aerosol Air Qual. Res. 12 (6), 1336–1344. doi:10.4209/aaqr.2012.03.0066
Chow, J. C., Watson, J. G., Lowenthal, D. H., and Countess, R. J. (1996). Sources and chemistry of PM10 aerosol in santa barbara county, CA. Atmos. Environ. 30 (9), 1489–1499. doi:10.1016/1352-2310(95)00363-0
Cong, Z., Kang, S., Dong, S., and Zhang, Y. (2009). Individual particle analysis of atmospheric aerosols at Nam Co, Tibetan Plateau. Aerosol Air Qual. Res. 9 (3), 323–331. doi:10.4209/aaqr.2008.12.0064
Corada, K., Woodward, H., Alaraj, H., Collins, C. M., and de Nazelle, A. (2021). A systematic review of the leaf traits considered to contribute to removal of airborne particulate matter pollution in urban areas. Enviro. Pollut. 269, 116104. doi:10.1016/j.envpol.2020.116104
Coz, E., Artíñano, B., Clark, L. M., Hernandez, M., Robinson, A. L., Casuccio, G. S., et al. (2010). Characterization of fine primary biogenic organic aerosol in an urban area in the northeastern United States. Atmos. Environ. 44 (32), 3952–3962. doi:10.1016/j.atmosenv.2010.07.007
Daellenbach, K. R., Uzu, G., Jiang, J., Cassagnes, L. E., Leni, Z., Vlachou, A., et al. (2020). Sources of particulate-matter air pollution and its oxidative potential in Europe. Nature 587 (7834), 414–419. doi:10.1038/s41586-020-2902-8
Davidovits, J. (1994). Geopolymers: man-made rock geosynthesis and the resulting development of very early high strength cement. J. Mater. Educ. 16, 91.
Deka, P., and Hoque, R. R. (2014). Incremental effect of festive biomass burning on wintertime PM10 in Brahmaputra Valley of Northeast India. Atmos. Environ. 143, 380–391. doi:10.1016/j.atmosres.2014.03.003
Deljanin, I. V., Tomašević, M. N., Urošević, M. P. A., Antanasijević, D. Z., Perić-Grujić, A. A., and Ristić, M. Đ. (2014). Lead isotopic composition in tree leaves as tracers of lead in an urban environment. Ecol. Indic. 45, 640–647. doi:10.1016/j.ecolind.2014.05.027
Engelbrecht, J. P., Moosmüller, H., Pincock, S., Jayanty, R. K. M., Lersch, T., and Casuccio, G. (2016). Mineralogical, chemical, morphological, and optical interrelationships of mineral dust re-suspensions. Atmos. Chem. Phys. 16 (17), 10809–10830. doi:10.5194/acp-16-10809-2016
Escobedo, F. J., Wagner, J. E., Nowak, D. J., De la Maza, C. L., Rodriguez, M., and Crane, D. E. (2008). Analyzing the cost effectiveness of Santiago, Chile's policy of using urban forests to improve air quality. J. Environ. Manage. 86 (1), 148–157. doi:10.1016/j.jenvman.2006.11.029
Fialová, D., Skoupý, R., Drozdová, E., Paták, A., Piňos, J., Šín, L., et al. (2017). The application of scanning electron microscopy with energy-dispersive X-ray spectroscopy (SEM-EDX) in ancient dental calculus for the reconstruction of human habits. Microsc. Microanal. 23 (6), 2056–2057. doi:10.1017/S1431927616011119
Freer-Smith, P. H., Beckett, K. P., and Taylor, G. (2005). Deposition velocities to Sorbus aria, Acer campestre, Populus deltoides× trichocarpa ‘Beaupré’, Pinus nigra and× Cupressocyparis leylandii for coarse, fine and ultra-fine particles in the urban environment. Environ. Pollut. 133 (1), 157–167. doi:10.1016/j.envpol.2004.03.031
Freer-Smith, P. H., Holloway, S., and Goodman, A. (1997). The uptake of particulates by an urban woodland: site description and particulate composition. Environ. Pollut. 95 (1), 27–35. doi:10.1016/S0269-7491(96)00119-4
Fung, Y. S., and Wong, L. W. Y. (1995). Apportionment of air pollution sources by receptor models in Hong Kong. Atmos. Environ. 29 (16), 2041–2048. doi:10.1016/1352-2310(94)00239-H
Gajbhiye, T., Pandey, S. K., Lee, S. S., and Kim, K. H. (2019). Size fractionated phytomonitoring of airborne particulate matter (PM) and speciation of PM bound toxic metals pollution through Calotropis procera in an urban environment. Ecol. Indic. 104, 32–40. doi:10.1016/j.ecolind.2019.04.072
Galvão, E. S., Santos, J. M., Lima, A. T., Reis, N. C., Orlando, M. T. D. A., and Stuetz, R. M. (2018). Trends in analytical techniques applied to particulate matter characterization: a critical review of fundaments and applications. Chemosphere 199, 546–568. doi:10.1016/j.chemosphere.2018.02.034
Galvão, E. S., Santos, J. M., Reis JuniorFeroni, N. C. R. D. C., and Orlando, M. T. D. A. (2022). The mineralogical composition of coarse and fine particulate material, their fate, and sources in an industrialized region of southeastern Brazil. Environ. Monit. Assess. 194, 88. doi:10.1007/s10661-021-09710-x
Galvez, M. C. D., Vallar, E., Castilla, R. M., Mandia, P., Branzuela, R., Rempillo, O., et al. (2022). Principal component analysis of heavy metals in atmospheric aerosols from meycauayan, bulacan, Philippines. Global assessment of the environmental burden of disease. Toxicol. Lett. 259, S1. doi:10.20944/preprints202202.0120.v1
Genga, A., Baglivi, F., Siciliano, M., Siciliano, T., Tepore, M., Micocci, G., et al. (2012). SEM-EDS investigation on PM10 data collected in Central Italy: principal component analysis and hierarchical cluster analysis. Chem. Cent. J. 6 (2), S3–S15. doi:10.1186/1752-153X-6-S2-S3
Goel, V., Mishra, S. K., Ahlawat, A., Kumar, P., Senguttuvan, T. D., Sharma, C., et al. (2020). Insights into coarse particle optics based on field evidence of particle morphology, chemical composition and internal structure. Atmos. Environ. 232, 117338. doi:10.1016/j.atmosenv.2020.117338
González, L. T., Longoria-Rodríguez, F. E., Sánchez-Domínguez, M., Leyva-Porras, C., Acuña-Askar, K., Kharissov, B. I., et al. (2018). Seasonal variation and chemical composition of particulate matter: a study by XPS, ICP-AES and sequential microanalysis using Raman with SEM/EDS. J. Environ. Sci. 74, 32–49. doi:10.1016/j.jes.2018.02.002
Górka, M., Bartz, W., Skuridina, A., and Potysz, A. (2020). Populus nigra italica leaves as a valuable tool for mineralogical and geochemical interpretation of inorganic atmospheric aerosols’ genesis. Atmosphere 11 (10), 1126. doi:10.3390/atmos11101126
Goudie, A. S. (2009). Dust storms: recent developments. J. Environ. Manage. 90 (1), 89–94. doi:10.1016/j.jenvman.2008.07.007
Guevara, M. (2016). “Emissions of primary particulate matter, airborne particulate matter: sources, atmospheric processes and health,” in Book series: issues in environmental science and technology (London, UK: The Royal Society of Chemistry), 1–34.
Gürdal, G., Hoşgörmez, H., Özcan, D., Li, X., Liu, H., and Song, W. (2015). The properties of Çan Basin coals (Çanakkale—Turkey): spontaneous combustion and combustion by-products. Int. J. Coal Geol. 138, 1–15. doi:10.1016/j.coal.2014.12.004
Hofman, J., Wuyts, K., Van Wittenberghe, S., and Samson, R. (2014). On the temporal variation of leaf magnetic parameters: seasonal accumulation of leaf-deposited and leaf-encapsulated particles of a roadside tree crown. Sci. Total Environ. 493, 766–772. doi:10.1016/j.scitotenv.2014.06.074
Iordanidis, A., Buckman, J., Triantafyllou, A. G., and Asvesta, A. (2008). ESEM–EDX characterisation of airborne particles from an industrialised area of northern Greece. Environ. Geochem Health 30 (5), 391–405. doi:10.1007/s10653-007-9124-y
Jabłońska, M., and Janeczek, J. (2019). Identification of industrial point sources of airborne dust particles in an urban environment by a combined mineralogical and meteorological analyses: a case study from the Upper Silesian conurbation, Poland. Atmos. Pollut. Res. 10 (3), 980–988. doi:10.1016/j.apr.2019.01.006
Jimenez, J. L., Canagaratna, M. R., Donahue, N. M., Prevot, A. S. H., Zhang, Q., Kroll, J. H., et al. (2009). Evolution of organic aerosols in the atmosphere. science 326 (5959), 1525–1529. doi:10.1126/science.1180353
Kanakidou, M., Seinfeld, J. H., Pandis, S. N., Barnes, I., Dentener, F. J., Facchini, M. C., et al. (2005). Organic aerosol and global climate modelling: a review. Atmos. Chem. Phys. 5 (4), 1053–1123. doi:10.5194/acp-5-1053-2005
Katoch, A., and Kulshrestha, U. C. (2022). Assessment of indoor air pollution through fine particle capturing potential and accumulation on plant foliage in Delhi, India. Aerosol Air Qual. Res. 22 (9), 220014. doi:10.4209/aaqr.220014
Kaur, P., Rahaman, M., and Guha, A. (2022). Elemental characterization and morphological analysis of atmospheric aerosols in a rural-continental environment of Northeast India. Arab. J. Geosci. 15 (24), 1752. doi:10.1007/s12517-022-11013-5
Kibet, J., Rono, N., and Mutumba, M. (2017). Particulate emissions from high temperature pyrolysis of cashew nuts. Eurasian J. Anal. Chem. 12 (3), 237–243. doi:10.12973/ejac.2017.00166a
Kim, J., Kim, J., Kim, Y., Go, T., and Lee, S. J. (2023). Accelerated settling velocity of airborne particulate matter on hairy plant leaves. J. Environ. Manage. 332, 117313. doi:10.1016/j.jenvman.2023.117313
Kocic, K., Spasic, T., Urosevic, M. A., and Tomasevic, M. (2014). Trees as natural barriers against heavy metal pollution and their role in the protection of cultural heritage. J. Cult. Herit. 15, 227–233. doi:10.1016/j.culher.2013.05.001
Kumar, A., and Elumalai, S. P. (2018). Influence of road paving on particulate matter emission and fingerprinting of elements of road dust. Arch. Environ. Contam. Toxicol. 75, 424–435. doi:10.1007/s00244-018-0546-6
Li, X., Zhang, T., Sun, F., Song, X., Zhang, Y., Huang, F., et al. (2021). The relationship between particulate matter retention capacity and leaf surface micromorphology of ten tree species in Hangzhou, China. Sci. Total Environ. 771, 144812. doi:10.1016/j.scitotenv.2020.144812
Li, Y., Shao, L., Wang, W., Zhang, M., Feng, X., Li, W., et al. (2020). Airborne fiber particles: types, size and concentration observed in Beijing. Sci. Total Environ. 705, 135967. doi:10.1016/j.scitotenv.2019.135967
Li, Y., Wang, S., and Chen, Q. (2019). Potential of thirteen urban greening plants to capture particulate matter on leaf surfaces across three levels of ambient atmospheric pollution. Int. J. Environ. Res. Public Health 16, 402. doi:10.3390/ijerph16030402
Liang, R., Chen, R., Yin, P., van Donkelaar, A., Martin, R. V., Burnett, R., et al. (2022). Associations of long-term exposure to fine particulate matter and its constituents with cardiovascular mortality: a prospective cohort study in China. Environ. Int. 162, 107156. doi:10.1016/j.envint.2022.107156
Liati, A., Schreiber, D., Lugovyy, D., Gramstat, S., and Eggenschwiler, P. D. (2019). Airborne particulate matter emissions from vehicle brakes in micro-and nano-scales: morphology and chemistry by electron microscopy. Atmos. Environ. 212, 281–289. doi:10.1016/j.atmosenv.2019.05.037
Liu, W., Wei, J., Cai, M., Qian, Z., Long, Z., Wang, L., et al. (2022). Particulate matter pollution and asthma mortality in China: a nationwide time-stratified case-crossover study from 2015 to 2020. Chemosphere 308, 136316. doi:10.1016/j.chemosphere.2022.136316
Liu, Z., Lv, C., Wang, F., and Hu, S. (2023). Recent advances in carbonatable binders. Cem. Concr. Res. 173, 107286. doi:10.1016/j.cemconres.2023.107286
Löndahl, J., Pagels, J., Swietlicki, E., Zhou, J., Ketzel, M., Massling, A., et al. (2006). A set-up for field studies of respiratory tract deposition of fine and ultrafine particles in humans. J. Aerosol Sci. 37 (9), 1152–1163. doi:10.1016/j.jaerosci.2005.11.004
Lu, S., Luan, Q., Jiao, Z., Wu, M., Li, Z., Shao, L., et al. (2007). Mineralogy of inhalable particulate matter (PM 10) in the atmosphere of Beijing, China. Water Air Soil Pollut. 186, 129–137. doi:10.1007/s11270-007-9470-5
Macadam, X. M. B., del Prado, A., Merino, P., Estavillo, J. M., Pinto, M., and González-Murua, C. (2003). Dicyandiamide and 3, 4-dimethyl pyrazole phosphate decrease N2O emissions from grassland but dicyandiamide produces deleterious effects in clover. J. Plant Physiol. 160 (12), 1517–1523. doi:10.1078/0176-1617-01006
Machemer, S. D. (2004). Characterization of airborne and bulk particulate from iron and steel manufacturing facilities. Environ. Sci. Technol. 38 (2), 381–389. doi:10.1021/es020897v
Maher, B. A., Gonet, T., Karloukovski, V. V., Wang, H., and Bannan, T. J. (2022). Protecting playgrounds: local-scale reduction of airborne particulate matter concentrations through particulate deposition on roadside ‘tredges’(green infrastructure). Sci. Rep. 12 (1), 14236. doi:10.1038/s41598-022-18509-w
Makkonen, U., Hellén, H., Anttila, P., and Ferm, M. (2010). Size distribution and chemical composition of airborne particles in south-eastern Finland during different seasons and wildfire episodes in 2006. Sci. Total Environ. 408, 644–651. doi:10.1016/j.scitotenv.2009.10.050
Malli Mohan, G. B., Stricker, M. C., and Venkateswaran, K. (2019). Microscopic characterization of biological and inert particles associated with spacecraft assembly cleanroom. Sci. Rep. 9 (1), 14251. doi:10.1038/s41598-019-50782-0
Manisha, H., Pandian, E. S., and Pal, A. K. (2016). Determining the contribution of nearby power plants to deposited foliar dust: a case study of BTPS, Bokaro. Arch. Environ. Contam. Toxicol. 71 (4), 485–499. doi:10.1007/s00244-016-0309-1
Matsuki, A., Iwasaka, Y., Shi, G., Zhang, D., Trochkine, D., Yamada, M., et al. (2005). Morphological and chemical modification of mineral dust: observational insight into the heterogeneous uptake of acidic gases. Geophys. Res. Lett. 32 (22). doi:10.1029/2005GL024176
Matthias-Maser, S., and Jaenicke, R. (1994). Examination of atmospheric bioaerosol particles with radii> 0.2 μm. J. Aerosol Sci. 25 (8), 1605–1613. doi:10.1016/0021-8502(94)90228-3
Matthias-Maser, S., Obolkin, V., Khodzer, T., and Jaenicke, R. (2000a). Seasonal variation of primary biological aerosol particles in the remote continental region of Lake Baikal/Siberia. Atmos. Environ. 34 (22), 3805–3811. doi:10.1016/S1352-2310(00)00139-4
Matthias-Maser, S., Reichert, K., and Jaenicke, R. (2000b). Primary biological aerosol particles at the high alpine site of Jungfraujoch/Switzerland. J. Aerosol Sci. 31, 955–956. doi:10.1016/s0021-8502(00)90965-0
McDonald, R., and Biswas, P. (2012). A methodology to establish the morphology of ambient aerosols. J. Air Waste Manag. Assoc. 54 (9), 1069–1078. doi:10.1080/10473289.2004.10470986
Merget, R., Bauer, T., Küpper, H., Philippou, S., Bauer, H., Breitstadt, R., et al. (2002). Health hazards due to the inhalation of amorphous silica. Arch. Toxicol. 75, 625–634. doi:10.1007/s002040100266
Mo, L., Ma, Z., Xu, Y., Sun, F., Lun, X., Liu, X., et al. (2015). Assessing the capacity of plant species to accumulate particulate matter in Beijing, China. Plos one 10 (10), e0140664. doi:10.1371/journal.pone.0140664
Moreno, T., Gibbons, W., Jones, T., and Richards, R. (2003). The geology of ambient aerosols: characterising urban and rural/coastal silicate PM10− 2.5 and PM2. 5 using high-volume cascade collection and scanning electron microscopy. Atmos. Environ. 37 (30), 4265–4276. doi:10.1016/S1352-2310(03)00534-X
Muhammad, S., Wuyts, K., and Samson, R. (2020). Immobilized atmospheric particulate matter on leaves of 96 urban plant species. Environ. Sci. Pollut. Res. 27, 36920–36938. doi:10.1007/s11356-020-09246-6
Muritala, K. B., and Adewole, J. K. (2019). Technical challenges in pharmaceuticals and cosmetics industries in Nigeria: a review of the roles of membrane technology. Int. J. Membr. Sci. Techno. 9 (1).
Neira, M., and Prüss-Ustün, A. (2016). Preventing disease through healthy environments: a global assessment of the environmental burden of disease. Toxicol. Lett. 259 (259), S1. doi:10.1016/j.toxlet.2016.07.028
Nor, M. A. M., Abd Wahid, N. B., Ramli, S., Jamaludin, A. A., and Pratama, A. T. (2022). Composition of surfactants and ionic elements from diesel and petrol exhaust particulate matter. Malays. J. Microsc. 18 (1).
Nowak, D. J., Hirabayashi, S., Bodine, A., and Greenfield, E. (2014). Tree and forest effects on air quality and human health in the United States. Environ. Pollut. 193, 119–129. doi:10.1016/j.envpol.2014.05.028
Oroumiyeh, F., Jerrett, M., Del Rosario, I., Lipsitt, J., Liu, J., Paulson, S. E., et al. (2022). Elemental composition of fine and coarse particles across the greater Los Angeles area: spatial variation and contributing sources. Environ. Pollut. 292, 118356. doi:10.1016/j.envpol.2021.118356
Ottelé, M., van Bohemen, H. D., and Fraaij, A. L. (2010). Quantifying the deposition of particulate matter on climber vegetation on living walls. Ecol. Eng. 36 (2), 154–162. doi:10.1016/j.ecoleng.2009.02.007
Pachauri, T., Singla, V., Satsangi, A., Lakhani, A., and Kumari, K. M. (2013). SEM-EDX characterization of individual coarse particles in Agra, India. Aerosol Air Qual. Res. 13 (2), 523–536. doi:10.4209/aaqr.2012.04.0095
Palma, A., Capozzi, F., Spagnuolo, V., Giordano, S., and Adamo, P. (2017). Atmospheric particulate matter intercepted by moss-bags: relations to moss trace element uptake and land use. Chemosphere 176, 361–368. doi:10.1016/j.chemosphere.2017.02.120
Pipal, A. S., Jan, R., Satsangi, P. G., Tiwari, S., and Taneja, A. (2014). Study of surface morphology, elemental composition and origin of atmospheric aerosols (PM2. 5 and PM10) over Agra, India. Aerosol Air Qual. Res. 14 (6), 1685–1700. doi:10.4209/aaqr.2014.01.0017
Pope, C. A., and Dockery, D. W. (2006). Health effects of fine particulate air pollution: lines that connect. Air Waste Manag. Assoc. 56 (6), 709–742. doi:10.1080/10473289.2006.10464485
Pósfai, M., and Buseck, P. R. (2010). Nature and climate effects of individual tropospheric aerosol particles. Annu. Rev. Earth Planet Sci. 38, 17–43. doi:10.1146/annurev.earth.031208.100032
Pósfai, M., Simonics, R., Li, J., Hobbs, P. V., and Buseck, P. R. (2003). Individual aerosol particles from biomass burning in southern Africa: 1. Compositions and size distributions of carbonaceous particles. J. Geophys. Res. Atmos. 108, 8483. doi:10.1029/2002JD002291
Ramanathan, V. C. P. J., Crutzen, P. J., Kiehl, J. T., and Rosenfeld, D. (2001). Aerosols, climate, and the hydrological cycle. science 294 (5549), 2119–2124. doi:10.1126/science.1064034
Rana, S., Saxena, M. R., and Maurya, R. K. (2022). A review on morphology, nanostructure, chemical composition, and number concentration of diesel particulate emissions. Environ. Sci. Pollut. Res. 29 (11), 15432–15489. doi:10.1007/s11356-021-15999-5
Saebo, A., Popek, R., Nawrot, B., Hanslin, H. M., Gawronska, H., and Gawronski, S. W. (2012). Plant species differences in particulate matter accumulation on leaf surfaces. Sci. Total Environ. 427-428, 347–354. doi:10.1016/j.scitotenv.2012.03.084
Sagnotti, L., Taddeucci, J., Winkler, A., and Cavallo, A. (2009). Compositional, morphological, and hysteresis characterization of magnetic airborne particulate matter in Rome, Italy. Italy. geochem. geophys. 10 (8). doi:10.1029/2009GC002563
Sahu, L. K., Kondo, Y., Moteki, N., Takegawa, N., Zhao, Y., Cubison, M. J., et al. (2012). Emission characteristics of black carbon in anthropogenic and biomass burning plumes over California during ARCTAS-CARB 2008. J. Geophys. Res. Atmos. 117, 15302. doi:10.1029/2011JD017401
Satsangi, P. G., and Yadav, S. (2014). Characterization of PM 2.5 by X-ray diffraction and scanning electron microscopy–energy dispersive spectrometer: its relation with different pollution sources. Int. J. Environ. Sci. Technol. 11, 217–232. doi:10.1007/s13762-012-0173-0
Searle, D. E. (2001). “The comparative effects of diesel and coal particulate matter on the deterioration of Hollington sandstone and Portland limestone,” (United Kingdom: University of Wolverhampton). Doctoral dissertation.
Seinfeld, J. H., and Pandis, S. N. (2016). Atmospheric chemistry and physics: from air pollution to climate change. United States: John Wiley and Sons.
Sgrigna, G., Baldacchini, C., Esposito, R., Calandrelli, R., Tiwary, A., and Calfapietra, C. (2016). Characterization of leaf-level particulate matter for an industrial city using electron microscopy and X-ray microanalysis. Sci. Total Environ. 548, 91–99. doi:10.1016/j.scitotenv.2016.01.057
Shaddick, G., Thomas, M. L., Mudu, P., Ruggeri, G., and Gumy, S. (2020). Half the world’s population are exposed to increasing air pollution. npj Clim. Atmos. 3 (1), 23. doi:10.1038/s41612-020-0124-2
Shi, J., Zhang, G., An, H., Yin, W., and Xia, X. (2017). Quantifying the particulate matter accumulation on leaf surfaces of urban plants in Beijing, China. Atmos. Pollut. Res. 8 (5), 836–842. doi:10.1016/j.apr.2017.01.011
Slezakova, K., Pires, J. C. M., Pereira, M. C., Martins, F. G., and Alvim-Ferraz, M. C. (2008). Influence of traffic emissions on the composition of atmospheric particles of different sizes—Part 2: SEM–EDS characterization. J. Atmos. Chem. 60, 221–236. doi:10.1007/s10874-008-9117-y
Soler, R., Nicolás, J. F., Caballero, S., Yubero, E., and Crespo, J. (2016). Depletion of tropospheric ozone associated with mineral dust outbreaks. Environ. Sci. Pollut. Res. 23, 19376–19386. doi:10.1007/s11356-016-7134-y
Song, X., Shao, L., Zheng, Q., and Yang, S. (2014). Mineralogical and geochemical composition of particulate matter (PM10) in coal and non-coal industrial cities of Henan Province, North China. Atmos. Res. 143, 462–472. doi:10.1016/j.atmosres.2014.03.015
Song, Y., Maher, B. A., Li, F., Wang, X., Sun, X., and Zhang, H. (2015). Particulate matter deposited on leaf of five evergreen species in Beijing, China: source identification and size distribution. Atmos. Environ. 105, 53–60. doi:10.1016/j.atmosenv.2015.01.032
Sonwani, S., and Kulshrestha, U. (2018). Morphology, elemental composition and source identification of airborne particles in Delhi, India. J. Indian Geophys Union 22 (6), 607–620.
Speak, A. F., Rothwell, J. J., Lindley, S. J., and Smith, C. L. (2012). Urban particulate pollution reduction by four species of green roof vegetation in a UK city. Atmos. Environ. 61, 283–293. doi:10.1016/j.atmosenv.2012.07.043
Sternberg, T., Viles, H., Cathersides, A., and Edwards, M. (2010). Dust particulate absorption by ivy (Hedera helix L) on historic walls in urban environments. Sci. Total Environ. 409 (1), 162–168. doi:10.1016/j.scitotenv.2010.09.022
Stoffyn-Egli, P., Potter, T. M., Leonard, J. D., and Pocklington, R. (1997). The identification of black carbon particles with the analytical scanning electron microscope: methods and initial results. Sci. Total Environ. 198 (3), 211–223. doi:10.1016/S0048-9697(97)05464-8
Tasić, M., Đurić-Stanojević, B., Rajšić, S., Mijić, Z., and Novaković, V. (2006). Physico-chemical characterization of PM 10 and PM 2.5 in the belgrade urban area. Acta Chim. Slov. 53 (3).
Teinilä, K., Kerminen, V. M., and Hillamo, R. (2000). A study of size-segregated aerosol chemistry in the Antarctic atmosphere. J. Geophys. Res. Space Phys. 105 (D3), 3893–3904. doi:10.1029/1999JD901033
Telloli, C., Chicca, M., Leis, M., and Vaccaro, C. (2016). Fungal spores and pollen in particulate matter collected during agricultural activities in the Po Valley (Italy). J. Environ. Sci. 46, 229–240. doi:10.1016/j.jes.2016.02.014
Teper, E. (2009). Dust-particle migration around flotation tailings ponds: pine needles as passive samplers. Environ. Monit. Assess. 154, 383–391. doi:10.1007/s10661-008-0405-4
Terzaghi, E., Wild, E., Zacchello, G., Cerabolini, B. E., Jones, K. C., and Di Guardo, A. (2013). Forest filter effect: role of leaves in capturing/releasing air particulate matter and its associated PAHs. Atmos. Environ. 74, 378–384. doi:10.1016/j.atmosenv.2013.04.013
Thangavel, P., Park, D., and Lee, Y. C. (2022). Recent insights into particulate matter (PM2. 5)-mediated toxicity in humans: an overview. Int. J. Environ. Res. Public Health 19 (12), 7511. doi:10.3390/ijerph19127511
Thorpe, A., and Harrison, R. M. (2008). Sources and properties of non-exhaust particulate matter from road traffic: a review. Sci. Total Environ. 400 (1-3), 270–282. doi:10.1016/j.scitotenv.2008.06.007
Tiwari, A., Gajbhiye, T., Pandey, M., Tirkey, A., Kim, K. H., and Pandey, S. K. (2023). A practical option for the selection of suitable plants for the management of airborne particulate matter (PM). Int. J. Environ. Sci. Technol. 20, 11537–11548. doi:10.1007/s13762-022-04579-w
Tiwari, A., Pandey, M., Tirkey, A., Pandey, S. K., and Kim, K.-H. (2022a) ‘Methods for the analysis of airborne particulate matter’, Interdiscip. Environ. Rev. 22, 18–42. doi:10.1504/IER.2022.122999
Tiwari, S., Gajbhiye, T., Tiwari, A., Pandey, M., Tirkey, A., Sahu, R. L., et al. (2022b). Phytomonitoring of hazardous metals in air. Interdiscip. Environ. Rev. 22 (3-4), 232–256. doi:10.1504/IER.2022.128143
Tomašević, M., and Aničić, M. (2010). Trace element content in urban tree leaves and SEM-EDAX characterization of deposited particles. FU Phys. Chem. Tech. 8 (1), 1–13. doi:10.2298/FUPCT1001001T
Trechera, P., Moreno, T., Córdoba, P., Moreno, N., Zhuang, X., Li, B., et al. (2020). Mineralogy, geochemistry and toxicity of size-segregated respirable deposited dust in underground coal mines. J. Hazard. Mater. 399, 122935. doi:10.1016/j.jhazmat.2020.122935
Tugrul, N., Derun, E. M., Pişkin, M. B., and Ekerim, A. (2009). A study on the structural behavior of reduced pyrite ash pellets by XRD and XRF analysis. Waste Manag. Res. 27 (3), 281–287. doi:10.1177/0734242X08090404
Tumolva, L., Park, J. Y., Kim, J. S., Miller, A. L., Chow, J. C., Watson, J. G., et al. (2010). Morphological and elemental classification of freshly emitted soot particles and atmospheric ultrafine particles using the TEM/EDS. Aerosol Sci. Technol. 44 (3), 202–215. doi:10.1080/02786820903518907
Umbria, A., Galán, M., Munoz, M. J., and Martín, R. (2004). Characterization of atmospheric particles: analysis of particles in the Campo de Gibraltar. Atmósfera 17 (4), 191–206.
Usman, F., Zeb, B., Alam, K., Huang, Z., Shah, A., Ahmad, I., et al. (2022). In-depth analysis of physicochemical properties of particulate matter (PM10, PM2. 5 and PM1) and its characterization through FTIR, XRD and SEM–EDX Techniques in the Foothills of the Hindu Kush Region of Northern Pakistan. Atmosphere 13 (1), 124. doi:10.3390/atmos13010124
Vardoulakis, S., Fisher, B. E., Pericleous, K., and Gonzalez-Flesca, N. (2003). Modelling air quality in street canyons: a review. Atmos. Environ. 37 (2), 155–182. doi:10.1016/S1352-2310(02)00857-9
Wang, J., Wang, X. K., Zhang, H. X., Lu, F., and Hou, P. (2012). Comparison of PM2. 5 concentrations and elemental compositions in two typical sites in Beijing urban area. Acta Sci. Circumst. 32, 74–80.
Wang, Y., Li, J., Jing, H., Zhang, Q., Jiang, J., and Biswas, P. (2015). Laboratory evaluation and calibration of three low-cost particle sensors for particulate matter measurement. Aerosol Sci. Technol. 49 (11), 1063–1077. doi:10.1080/02786826.2015.1100710
Weber, F., Kowarik, I., and Säumel, I. (2014). Herbaceous plants as filters: immobilization of particulates along urban street corridors. Environ. Pollut. 186, 234–240. doi:10.1016/j.envpol.2013.12.011
Weerakkody, U., Dover, J. W., Mitchell, P., and Reiling, K. (2017). Particulate matter pollution capture by leaves of seventeen living wall species with special reference to rail-traffic at a metropolitan station. Urban For Urban Green 27, 173–186. doi:10.1016/j.ufug.2017.07.005
Weerakkody, U., Dover, J. W., Mitchell, P., and Reiling, K. (2018a). Quantification of the traffic-generated particulate matter capture by plant species in a living wall and evaluation of the important leaf characteristics. Sci. Total Environ. 635, 1012–1024. doi:10.1016/j.scitotenv.2018.04.106
Weerakkody, U., Dover, J. W., Mitchell, P., and Reiling, K. (2018b). Evaluating the impact of individual leaf traits on atmospheric particulate matter accumulation using natural and synthetic leaves. Urban For Urban Green 30, 98–107. doi:10.1016/j.ufug.2018.01.001
Weerakkody, U., Dover, J. W., Mitchell, P., and Reiling, K. (2019). Topographical structures in planting design of living walls affect their ability to immobilise traffic-based particulate matter. Sci. Total Environ. 660, 644–649. doi:10.1016/j.scitotenv.2018.12.292
Weinzierl, B., Ansmann, A., Prospero, J. M., Althausen, D., Benker, N., Chouza, F., et al. (2017). The Saharan aerosol long-range transport and aerosol–cloud-interaction experiment: overview and selected highlights. Bull. Am. Meteorol. Soc. 98 (7), 1427–1451. doi:10.1175/BAMS-D-15-00142.1
WHO (2021). World health organisation. Available at: https://www.who.int/news-room/fact-sheets/detail/ambient-(outdoor)-air-quality-and-health (Assessed on April, 2022).
Xie, Y., Zhao, M., He, J., Chen, Z., and Zhao, J. (2020). Dust-retening ability of Picea wilsonii and Pinus tabulformis forest with different diameter classes. J. Northwest Fores. Univ. 35 (6), 17–24.
Yan, J., Lin, L., Zhou, W., Ma, K., and Pickett, S. T. (2016). A novel approach for quantifying particulate matter distribution on leaf surface by combining SEM and object-based image analysis. Remote Sens. Environ. 173, 156–161. doi:10.1016/j.rse.2015.11.033
Yin, H., Mu, S., Zhao, L., Qi, X., and Pan, X. (2013). Microscopic morphology and elemental composition of size distributed atmospheric particulate matter in Urumqi, China. Environ. Earth Sci. 69, 2139–2150. doi:10.1007/s12665-012-2043-y
Zapata-Hernandez, C., Durango-Giraldo, G., Tobón, C., and Buitrago-Sierra, R. (2020). Physicochemical characterization of airborne particulate matter in medellín, Colombia, and its use in an in silico study of ventricular action potential. Water Air Soil Pollut. 231, 508–514. doi:10.1007/s11270-020-04884-5
Zeb, B., Alam, K., Sorooshian, A., Blaschke, T., Ahmad, I., and Shahid, I. (2018). On the morphology and composition of particulate matter in an urban environment. Aerosol Air Qual. Res. 18 (6), 1431. doi:10.4209/aaqr.2017.09.0340
Zhang, H., Sun, W., Li, W., and Wang, Y. (2022a). Physical and chemical characterization of fugitive particulate matter emissions of the iron and steel industry. Atmos. Pollut. Res. 13 (1), 101272. doi:10.1016/j.apr.2021.101272
Zhang, W., Wang, B., and Niu, X. (2017). Relationship between leaf surface characteristics and particle capturing capacities of different tree species in beijing. Forests 8 (3), 92. doi:10.3390/f8030092
Zhang, Z., Gong, J., Li, Y., Zhang, W., Zhang, T., Meng, H., et al. (2022b). Analysis of the influencing factors of atmospheric particulate matter accumulation on coniferous species: measurement methods, pollution level, and leaf traits. Environ. Sci. Pollut. Res. 29 (41), 62299–62311. doi:10.1007/s11356-022-20067-7
Keywords: particulate matter (PM), SEM-EDS, source apportionment, elemental composition, image-J
Citation: Tiwari A, Pandey M, Tirkey A, Tiwari A, Dubey R and Pandey SK (2024) Image based analytical approaches for study of particulate matter (PM) in air. Front. Environ. Sci. 12:1362422. doi: 10.3389/fenvs.2024.1362422
Received: 28 December 2023; Accepted: 04 March 2024;
Published: 19 March 2024.
Edited by:
David Widory, Université du Québec à Montréal, CanadaReviewed by:
Maciej Górka, University of Wrocław, PolandManousos-Ioannis Manousakas, Paul Scherrer Institut (PSI), Switzerland
Copyright © 2024 Tiwari, Pandey, Tirkey, Tiwari, Dubey and Pandey. This is an open-access article distributed under the terms of the Creative Commons Attribution License (CC BY). The use, distribution or reproduction in other forums is permitted, provided the original author(s) and the copyright owner(s) are credited and that the original publication in this journal is cited, in accordance with accepted academic practice. No use, distribution or reproduction is permitted which does not comply with these terms.
*Correspondence: Sudhir Kumar Pandey, c2twYmh1QGdtYWlsLmNvbQ==, cGFuZGV5LnN1ZGhpckBnZ3UuYWMuaW4=