 Yihan Wu
 Fucang Qin1,2,3*†
- 1College of Desert Control Science and Engineering, Inner Mongolia Agricultural University, Hohhot, China
- 2Forestry College, Inner Mongolia Agricultural University, Hohhot, China
- 3Institute of Forestry Sciences of Inner Mongolia Autonomous Region, Hohhot, China
- 4Key Laboratory of State Forest Administration for Desert Ecosystem Protection and Restoration, Hohhot, China
Introduction: Creating an ecological space network is essential for safeguarding the core structure of ecological space.
Methods: Morphological spatial pattern analysis was used to locate ecological sources in the Kuye River Basin. Using the least cumulative resistance model and gravity model, the resistance surface, ecological corridor, and ecological space management network are determined.
Results and discussion: The study revealed that in 2022, the predominant land use types in the Kuye River Basin were wood land and grassland, cultivated land, and construction land. MSPA model software identifies a substantial portion of the landscape pattern as consisting of core and marginal areas, which encompass 30324.05 hm2 and 15088.24 hm2. High ecological resistance surface factors dominate the socioeconomically vibrant zone and northern regions. Resistance values ranging from 0.02 to 0.87, and high and law resistance zones alternate. The minimal cumulative resistance approach found 171 ecological corridors. And gravity model using the interaction matrix of 19 primary ecological sources discovered 8 first-level ecological corridors with the highest interaction force. There are 137 core and 23 subsidiary ecological corridors with significant affects. Overlying the road factors and ecological corridors of national highways, provincial roads, railways, and high-speed roads creates a total of 38 ecological breakpoints, each characterized by specific barrier effects and legal ecological stability.
1 Introduction
The rapid progress of socio-economic development and irresponsible human actions in recent years have caused a variety of ecological degradation problems, resulting in significant changes in the ecological landscape (Lin et al., 2009). Reversing urban problems during urbanisation is difficult, and the ecosystem is under unprecedented stress (Yin et al., 2011; Chen et al., 2021). Ecological protection and restoration are global priorities (Farage et al., 2021). The Yellow River Basin (YRB), a major cultural center in China, is an ecological barrier and socio-economic region that provides vital ecosystem services (Song et al., 2022). The basin’s fragile ecological condition and major people-land conflict remain severe due to human activities and natural calamities (Chen et al., 2020; Yan et al., 2022).The Kuye River Basin, a significant Yellow River Basin tributary, is crucial to northern China’s energy and ecological security. It oversees the national strategic goal of “high-quality development and ecological protection of the Yellow River Basin.” And the city is resource-rich and resource-based. However, long-term economic activity is threatening the environment and ecosytem. Due to the rapid development of the mining industry and massive expansion of construction land, soil erosion, habitat fragmentation, and serious ecological problems have increased (Chen et al., 2022; Wei et al., 2022; Zeng et al., 2023). The “14th Five-Year Plan” of the Yellow River Basin is a crucial time to promote both superior growth and ecological conservation. How to identify ecological sources, build significant corridors, and restore and plan ecosystems under sustainable economic development in basin counties and cities is a research topic and scientific issue. These difficulties relate to Yellow River Basin ecological protection and high-quality development as national strategic needs.
In contrast, ecological networks were introduced in Europe in the 1980s as a scientific method of nature conservation and spatial planning to prevent regional patches from becoming isolated and maintain or restore natural ecosystem connectivity (Nie et al., 2021; Jin et al., 2022). Ecological networks, which include ecological springs and potential ecological corridors (Salviano et al., 2021), can efficiently improve connectivity between isolated patches in a region, facilitate material and energy movement, and improve network structure and function (Fath et al., 2007). The services of regional natural systems are significantly enhanced (Chen et al., 2011; Chen et al., 2017). Jongman et al. (2004) define an ecological network as a network of nature reserves with core areas, corridors, buffer zones and restoration areas. Landscape ecology principles are used to repair and preserve natural environments. Many scientists have since conducted considerable investigation from many aspects (Wang et al., 2022a; Wang et al., 2022b). Thus, ecological networks have expanded from habitat conservation to ecosystem integrity. These networks now incorporate landscape planning, greenway networks, and ecological environmental governance (Li et al., 2022; Wang et al., 2022b; Mao et al., 2023). Recently, research on ecological network design has moved towards a paradigm called “source extraction-resistance surface construction-corridor simulation.” Logical ecological network development requires efficient resource extraction. Recently developed stratigies for identifying ecological sources are more objective than subjective ways like picking nature reserves or ecosystems. Morphological Spatial Pattern Analysis (MSPA) and the Patch Importance Index (dPC) from landscape graph theory are used in these methods. Using MSPA and dPC techniques can identify crucial patches that sustain landscape connectivity (Clerici and Vogt, 2013; Ordóñez-Gómez et al., 2015). These methods have helped construct urban ecological networks (Huang et al., 2021; Liu et al., 2023b) and forest conservation areas (Barbati et al., 2013; Wang et al., 2021). Researchers can realistically model organisms’ environmental challenges by including geography, land use, roads, water, and human activities. Using a holistic approach, we can better comprehend ecological interconnection and the connections between numerous ecological processes (Peng et al., 2018; Wang S. et al., 2022). Huang et al. (2021) examined Wuhan City ecological network development from environmental and socioeconomic perspectives. Many considerations were considered. They gained a better understanding of how natural processes such as habitat fragmentation and human actions like urbanization and infrastructure development affect ecological resilience by integrating these factors. This comprehensive research illusminates biological corridors’ resilience to human-induced pressures and environmental changes. In addition, the Minimum Cumulative Resistance (MCR) model is now the most widely used approach to simulate ecological corridors. This quantitative analytical model measures ecological patches separation and identifies the best species migration path via space (Fu et al., 2024). When combined with gravity model, this model appropriatelt compares ecological corridor importance. It may also evaluate ecological corridor hierarchies between patches (Luo et al., 2023). However, it is important to emphasise that ecological network construction goes beyond MSPA and MCR (Yang et al., 2023). Other methods and models have also advanced the field (Li et al., 2017). The global spread of species has been predicted via species distribution models (SDMs). However, MSPA and MCR are still commonly utilized in ecological network research and construction (Xu et al., 2024). The combination of the two methods provides a more powerful, effective and comprehensive methodology for ecological network construction, making it the preferred option for both research and practical applications.
This research studies the Kuye River Basin and employs Morphological Spatial Pattern Analysis method to identify the significant ecological source sites. Scientifically combining patch importance, likely connectivity, and total connectivity index achieves this. And elevation, slope, land use type, road traffic, water system and natural and socio-economic characteristics were used to build resilient zones (Ma et al., 2011). The basin’s ecological spatial network design was constructed by merging the gravity and MCR model, then identified and extracted the ecological corridors. Aims to explore the direction of ecological network optimisation to improve the overall biodiversity (Kumaraswamy and Udayakumar, 2011) of the watershed and ecosystem, taking into account the current phenomenon of rapid urbanisation. It does so by considering multiple perspectives and using scientific methods.
2 Study area
Originating in Zhashu Village, Chaideng Township, Dongsheng District, Ordos City, Inner Mongolia Autonomous Region, the Kuye River Basin (109° 28′-110° 45′E, 38° 22′-39° 50′N) is a tributary of the middle reaches of the Yellow River (Figure 1). With two tributaries from the Ulan Mulun River and the Niuchuan River, it is a principal tributary of the Yellow River. Primary stream covers 8,706 km2 and 242 km long. The basin has diverse landforms, severe soil erosion, frequent droughts, rainstorms, dust storms, and a large supply of coarse silt to the Yellow River. Shenfu Dongsheng super-large coalfield crosses across the basin, making it the heart of China’s cross-cicurity “Shanxi-Shaanxi-Inner Mongolia energy and heavy chemical base” construction (Wei et al., 2023b). The acceleration of urbanization, industrial and mining development and construction, population, and predatory management has caused the significant conflict between people and land, soil erosion, the sharp decline in biodiversity, function, and value of ecosystem services, and ecological landscape fragmentation.
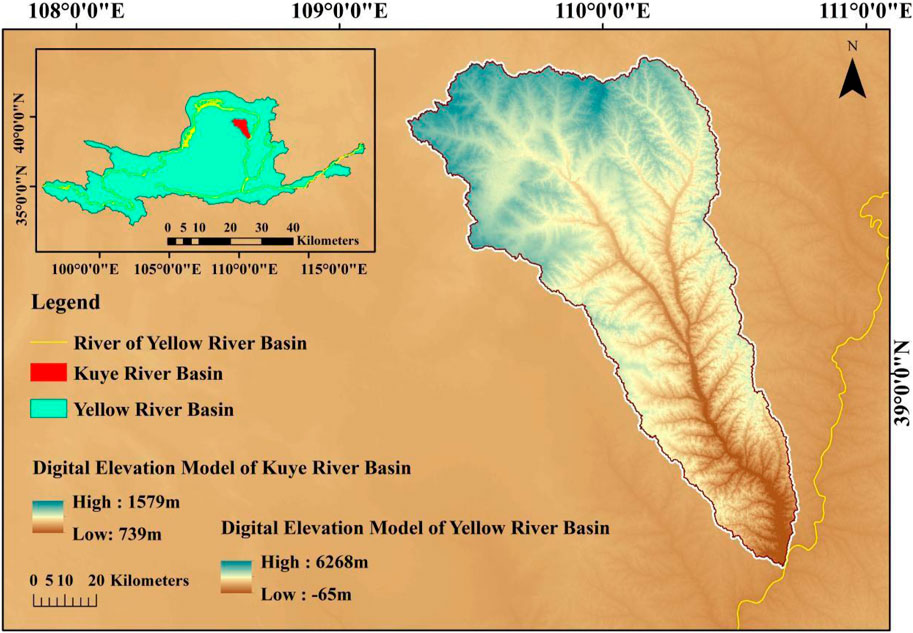
Figure 1. Overview of study area.
3 Data sources and research methods
3.1 Data sources
This study made use of digital elevation data, socioeconomic data, and images from remote sensing. More precisely, this encompasses the subsequent elements (Table 1).

Table 1. Summary table of data sources.
3.2 Research method
3.2.1 Land use dynamic degree
The quantitative shift in land use types over a given time period, mostly reflecting regional variations in land use change rate and intensity, is called “land use dynamic degree” and has two categories: comprehensive and single (Li et al., 2022). Equation 1 calculate the dynamic degree of single land use, which shows the change rate of a land use type in a region over time (Liu et al., 2023a). The dynamic degree of land use (Equation 2) is used to assess land use transfer between categories during the study (Chen et al., 2022; Wei et al., 2023a). It can illustrate regional comprehensive land use change intensity and compare local and whole area change.
Where LUT now-before reflects the area of a land use type at the start and end of the study period, while LUT previous represents its dynamic degree. Time (study duration), LUTsynthesize (land use dynamic degree), LUTx (number of beginning land use types), △LUTx-y (area of x-type land transformed to other land types) are all represented.
3.2.2 Morphological spatial pattern analysis
Morphological Spatial Patterning Analysis (MSPA) is a classification approach for raster image processing. Vogt et al. (2009), Soille and Vogt (2009) presented it using expansion, corrosion, and open/close arithmetic. It is distinguishes itself from existing identification approaches that merely choose ecological sources from patch regions or extract patches and corridors for connectivity analysis. It avoids subjective bias by treating each patch as a coherent unit when assessing landscape connectedness (Liu et al., 2023a).
For morphological spatial pattern analysis to determine the ecological source, we used ArcGIS software’s ArcToolbox-Spatial anlyst-Reclass module. Foreground data was 2022 Kuye River Basin wood land usage (assignment 2). Background data—water, construction, grassland, agricultural, and other land uses—is used to generate binary grid 8-bit Tiff data (assignment 1). Guidos’ eight-neighborhood image refining methodology was used to examine the binary data. The seven landscape features discovered background, edge, branch, islet, core, loop, perforation, and bridege in edge (Lu et al., 2017; Hong et al., 2023). To verify that the data accurately reflect the structural elements like corridors and core area (Table2).
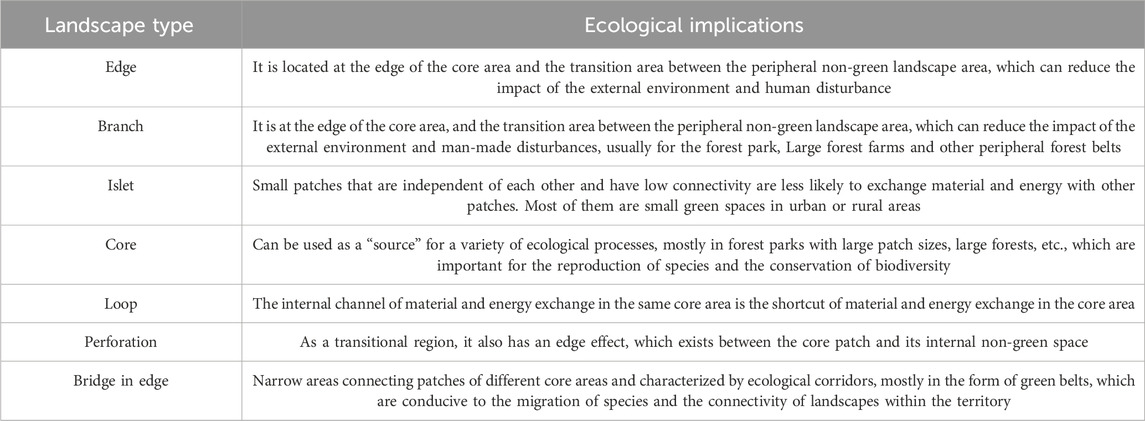
Table 2. Landscape Types and Ecological Implications of morphological spatial pattern analysis.
3.2.3 Ecological source identification
Ecological source sites in the Kuye River Basin are important ecological and economic assets that must be protected (Lin et al., 2009; Han et al., 2023). Ecological source areas are tracts of land with diverse landscapes that provide important ecological functions. Offer vital ecological services. Keeps landscape ecosystem stable and intect. The ecological core is crucial to the ecosystem. Ecological advantages may spread to the surrounding ecosystem (Guan et al., 2023). Landscape connectedness is the extent to which natural areas in a region are linked. Ecological services and biodiversity depend on it (Mitchell et al., 2013). Overall connectivity (IIC), probable connectivity (PC) and patch importance (dI) can assess regional landscape connection and patch relevance. Landscape pattern and function assessment and ecological source identification depend on these measures (Saura and Pascual-Hortal, 2007).
According to the United States Department of Agriculture (USDA) regulations (Bentrup, 2008), plants, birds and mammals need at least 5 hm2 of suitable habitat in urban areas, as supported by relevant studies. Considering this law and the Kuye River Basin’s urban growth characteristics, we choose core areas greater than 5 hm2. We used the Confer software to evaluate landscape connectedness using IIC (Equation 3), PC (Equation 4) and dI indices (Equation 5). This evaluation helped us to rank the Kuye River Basin center areas’ value. We then selected ecological source areas greater than 5 hm2 for our investigation.
Where IIC is the overall connection index; PC is the probable connectivity index; and dl is the patch importance value. Sa and Sb are the areas of patches a and b; nlab is the number of links between them; AL is the total area; and p*ab is the greatest probability of organisms propagating between a and b. I, IIC, PC, and Iremove is the value of the landscape connectivity index after removing the landscape connectivity index value after patch a.
3.2.4 Construction of ecological resistance surface
Ecological source sits in the Kuye River Basin are important ecological and economic assets that must be protected (Yang et al., 2024). The ease of navigating landscapes and the variety of landscapes between source locations might also affect landscape resistance (Peterman et al., 2014; Cao et al., 2022). Landscape resistance measures how easily organisms can move between landscape units (Liu et al., 2021). Due to the mountainous, ecological corridors need established in gradual slopes. Likewise, traffic primarily follows the river valley. In order to prevent the ecological corridors from being located on top of main roads, a road resistance factor is incorporated based on the types of land use. The Kuye River Basin is a typical resource-dependent city. However, long-term mining has severely affected the river’s ecology. Rapid mining boom, substantial building, and increasing urbanization have put pressure on the Kuye River ecology. We chose seven elements to design a resistance surface for the research region based on the Kuye River Basin’s natural and socio-economic development. Land use structure, digital elevation model, slope, vegetation cover, road, water, and population density are considerations (Figure 2).
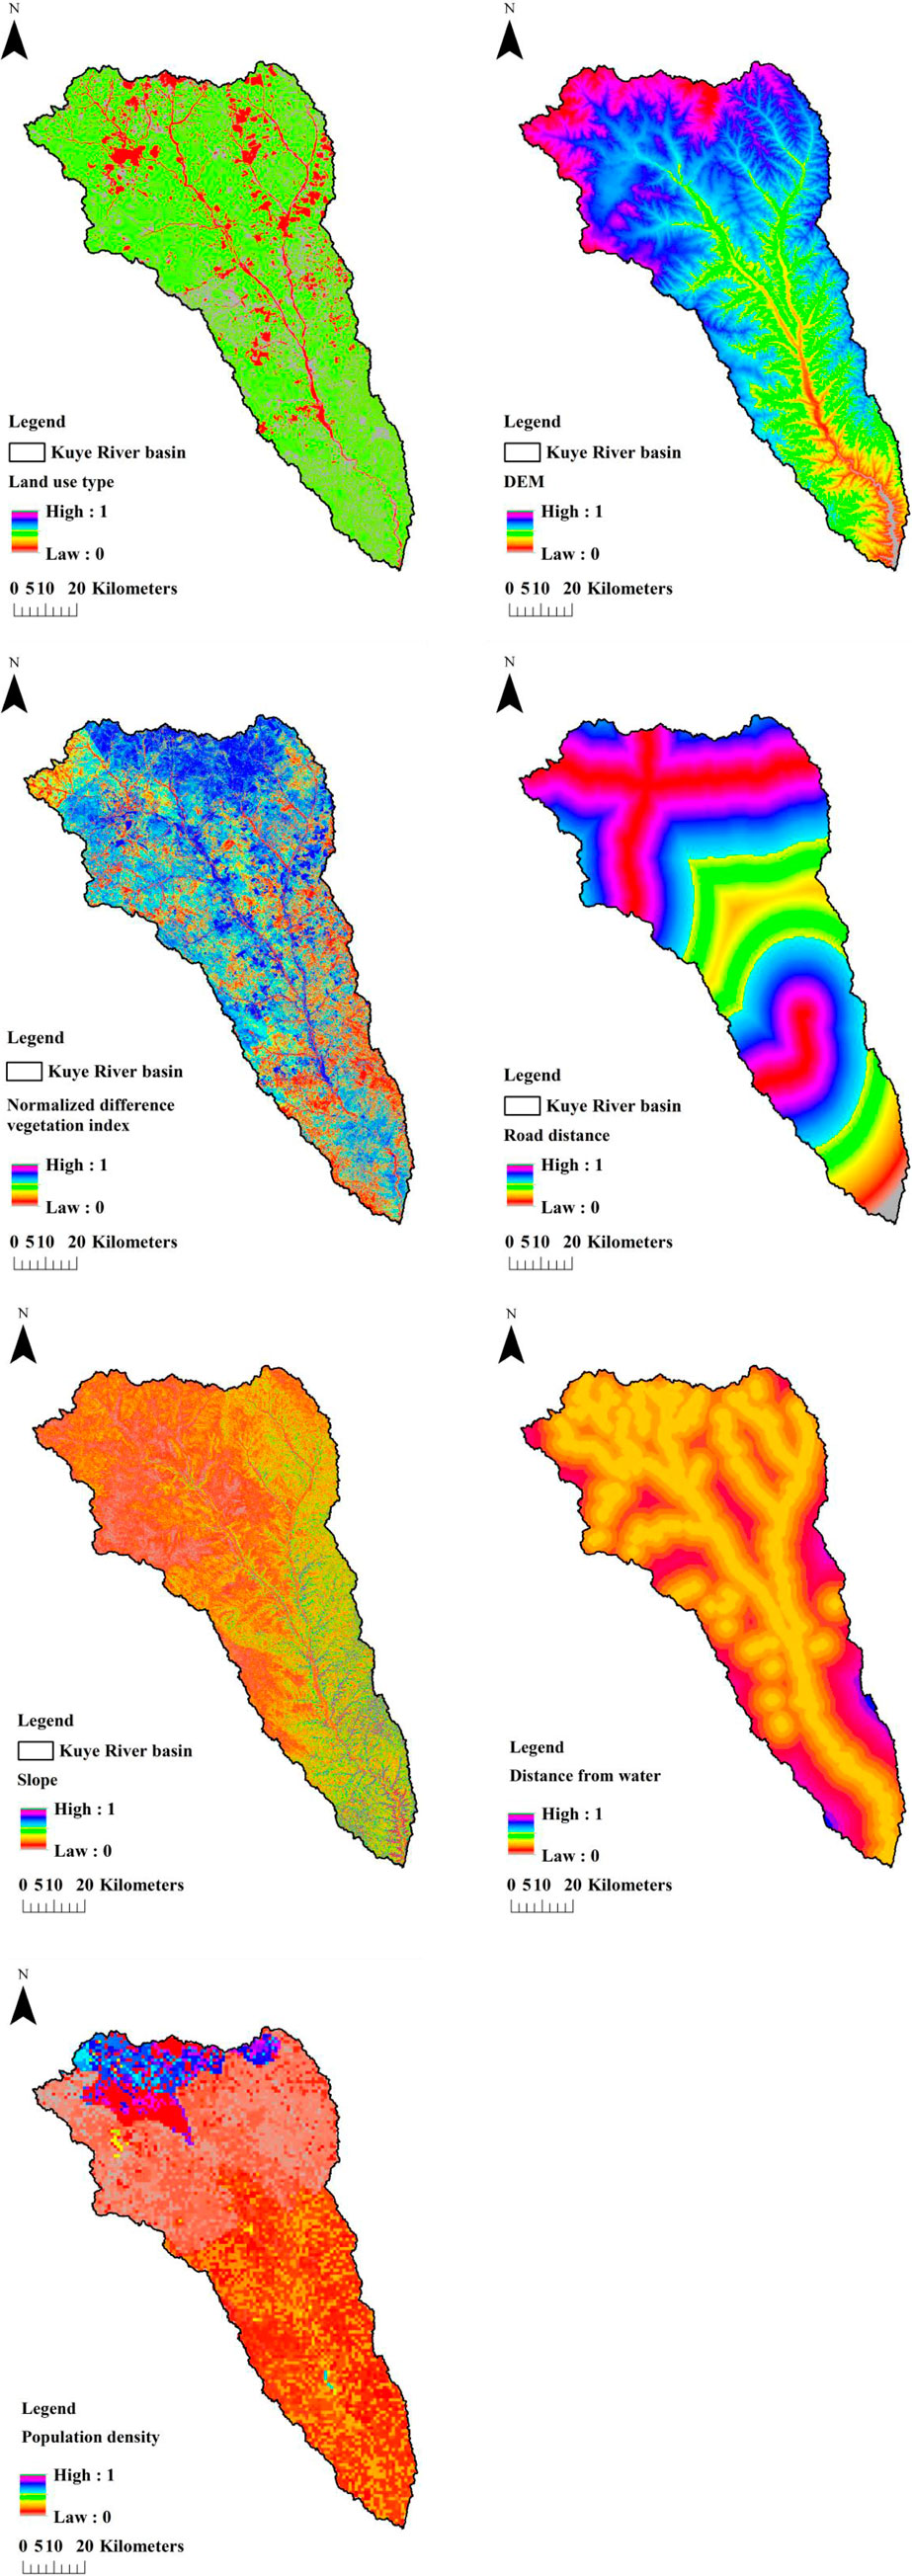
Figure 2. Ecological resistance surface factor.
Then determine the weight assigned to each resistance factor after selecting them based on Kuye River Basin. Each resistance element’s influence must be assessed and quantified (Kang et al., 2021). The entropy value approach estimates indicator weights. Because it avoid unpredictability and guesswork, this strategy is better than subjective assignment. It also effectively addresses indicator variable overlap (Wang et al., 2014). Entropy was used to calculate the weights of the seven ecological landscape resistance variables. Combining the weights of seven indicators (raster data) in ArcGIS created an integrated resistance surface data. Land use structure, elevation, slope, vegetation cover, distance from roads, distance from water, and population density are indications. The results are shown in Table 3.
(1) Standardisation of evaluation indicators
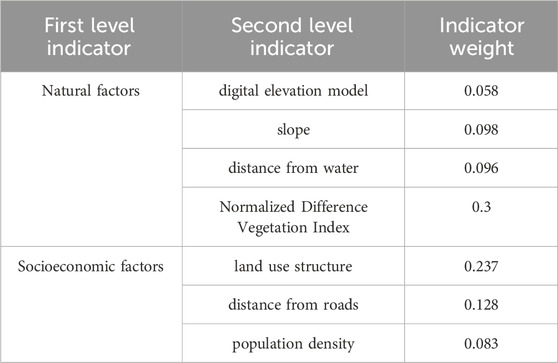
Table 3. Ecological resistance factors and weight settings.
Standardizing the data first was necessary due to the indicator’s diferent scales. Equation 6 standardised positive indications. Equation 7 standardised negatives. Resistance rises with positive indicator values. Resistance decreases as negetive indication value rises.
Where yij denotes the standardised value of the ith grid cell of the jth evaluation indicator; xij denotes the original value of the ith grid cell of the jth evaluation indicator; max(xij) and min(xij) denote the maximum and minimum values of all grid cells of the jth evaluation indicator, respectively.
(2) Assignment of indicator weights
The indicator weight method (Zhang et al., 2020a) uses the entropy weight method in objective assignment to improve accuracy and objectivity while reducing subjectivity and uncertainty. First, calculate the entropy of m evaluation items and n evaluation indicators under the theory of entropy weight approach. Let pij (Equation 8) be the weight of the ith evaluated indication under the jth indicator and ei (Equation 9) its entropy value.
When Pij = 0, PijlnPij = 0, after the entropy value of the indicator is determined, the entropy weight Wi of the ith indicator can be determined according to the Equation 10.
3.2.5 Ecological network construction
(1) Identification of ecological corridors
Ecological corridors, characterized by their varied ecological roles, play a crucial role in facilitating the life, mobility, and migration of various species. It creates and maintains corridors across fragmented habitats, allowing creatures to freely migrate (Wang and Zhang, 2005; Qin et al., 2024). It also links fragmented ecosystems to form a strong biological network. The Kuye River Basin maintains ecosystem structure and ecological processes. This creates a consistent basin ecological security pattern (Feng et al., 2023). This research uses the MCR model to demonstrate resistance over different terrains from the “source” to the objective (Equation 11). Research found the Kuye River Basin pathways with the least cumulative resistance between the main patches using this information.
The formula expresses the positive association between a point’s minimal resistance and its distance from all sources, as well as the features of the landscape base, by using an unknown monotonically increasing function, denoted by f. Dij is the spatial distance of the base plane i of a landscape that the species travels across from source j to a specific place in space. m is the number of landscape units i, n is the number of ecological sources j. Ri is the landscape’s resistance to a species’ migration.
(2) Identification of crucial ecological corridors
The gravity model quantifies habitat patches interaction. This proves ecological corridors and emphasizes patche connection. In a given area, patches or corridors with higher quality habitats may make migration and dispersal easier and increase special survival (Zhang et al., 2020b; Zhang et al., 2023). By combining the gravity model and interaction matrix between the ecological source patches, the Kuye River Basins’ ecological corridors may be identifies and each plate’s relative quantified. The precise computation procedure is as follows (Equation 12):
The force of interaction between patches i and j is represented by Gij. Ni and Nj, indicate the weight values of two patches, while Dij represents the standardized potential ecological resistance between patches i and j. The overall ecological resistance value between patches i and j is Lij, the greatest is Lmax, and patch i’s is Pi. Si is patch i’s area, patch j’s is Pj. Sj is patch j’s area.
(3) Identification of ecological breakpoints
Ecological nodes in the landscape matrix help species spread (Chen et al., 2006). Previous ecological studies have called regions with considerable human activity and traffic “breakpoints”. The occurrence of “fracture points” may fragment the watershed ecosystem, affecting biodiversity (Louder and Wyborn, 2020) and the functioning and value of ecosystem services. Thus, study analyzes the distribution map of the key transportation routes in the study region to estimate ecological breakpoints.
4 Results and analysis
4.1 Land use structure change
The essay highlights the strong correlation between land use change and social, economic, and ecological issues in the Kuye River Basin. Land use play a crucial role in altering both natural landscapes and human social contexts. The study found that the Kuye River Basin was dominated by wood land and grassland, cultivated land, and construction land in 2022 (Figure 3). Which accounted for 85.37% of the region. The spatial distribution covers much of the basin, including the north, middle, and south sections. The basin has a distinct land use landscape pattern gue to higher idensity in the west of the northwestern and central parts This phenomena is mostly driven by social and environmental variables. The policy to turn farms into forests and ban mountain grazing has societal consequences (Xue, 2023). This has led to a significant increase of wood land and grassland. Additionally, large areas of steep slopes and wasteland in the basin have been transformed into wood land, leading to an enhancement in the hierarchy of the plant community (Lu et al., 2022). Furthermore, this suggests that wood land is the prevailing landscape types in the watershed. And, the policy of reforesting cultivated land has resulted it.
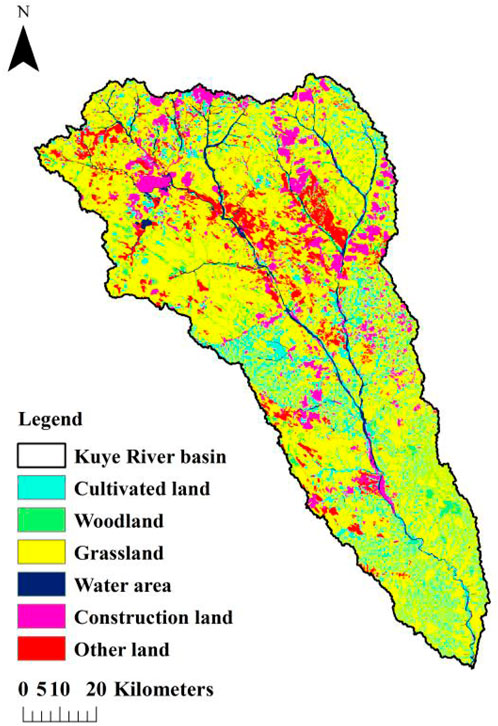
Figure 3. Spatial and temporal distribution of land use in Kuye River basin.
In addition, the Kuye River Basin serves as a significant mining region for Shenfu and other coal fields. The provision of residential land for coal miners is the main driver of other development land expansion. Other construction land has grown significantly due to the increase of production and living facilities, including transportation and supporting services (Pontius et al., 2008; Chen et al., 2022). Furthermore, urban land and rural settlements have grown due to socioeconomic growth and urbanization. Construction land is mostly in the central, northern, and northeastern watersheds.
4.2 Landscape pattern distribution characteristics
The ecological source areas maintain the research area’s natural ecological environment and limit human expansion and construction. Based on the calculations made by the MSPA, calculated the Kuye River Basin’s ecological source areas as 30,324.05 h m2, 64.13% of biological landscape. Meaning basin’s ecological space is dominated by big core patches (Figure 4).
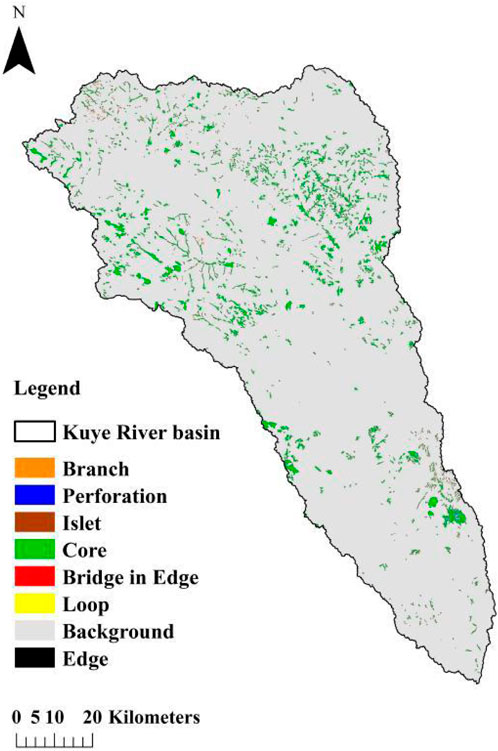
Figure 4. Analysis of landscape pattern in Kuye River Basin by morphological spatial pattern analysis method.
The primary region in the northern part is predominantly focused in the northwest. The northeast region has a low population density and poor terrain connectivity, which hampers species and materials mobility between core areas. The primary region in the southern part is mostly focused in the southeastern area. Mountains and rivers steep slopes and less human intervention are more common in the south section. The central region’s main cities are along the Ulamurun River. As a resource-based metropolis, the Kuye River Basin focuses on long-term mining and the expansion of construction land have accelerated urbanization, largely due to human activity. The ceore region’s thiness and division creating a “fracture zone” that affects north-south flow. Furthermore, the fringe zone, with the highest height and percentage, cover 31.91% of the landscape ecological area. The fringe zone protects the core area from the outer area, and its stability is essential.
The edge effect influences the impact of external disturbances on the ecosystem and biodiversity (Squires, 2014), perhaps lessening their effects on the edge. Branch (known as Table 1), is a type of landscape that originates from a boundary of a watershed (either a marginal zone or pore) or a connecting portion (such as a bridging or loop channel). It is only connected to the boundary or connecting portion at one end. The main function of a branch is to facilitate the dispersal of species and the exchange of energy with peripheral landscapes. Branches are primarily found in the northern region of the basin. Furthermore, the bridge area comprise 1.05% of the entire foreground area. The interhange of material and energy between core patches in the study region is crucial. The edge is a boundary zone that sepatares the central region from the surrounding non-green environment. It spans an area of 15,088.24 h m2. The edge effect may reduce the impact of external disruptions on the ecosystem and biodiversity.
4.3 Ecological network structure
4.3.1 Ecological network structure
Based on the comprehensive resistance surface depicted in Figure 5, the resistance values are dispersed throughout the rage of 0.02 to 0.87. And in the center, northern and northestern resistance is high. The resistance elements indicates that this location is a vibrant socio-economic hub due to its high population density, broad road network, and abundant developed land. The low resistance zone is mostly situated in the south and has a sparse population, less human disturbance, extensive forest and grass covers, and higher elevation and slope. The MCR model identified ecological corridors based on ecological source and resistance surface. After removing redundant and overlapping corridors, 171 ecological corridors were found (Figure 6).
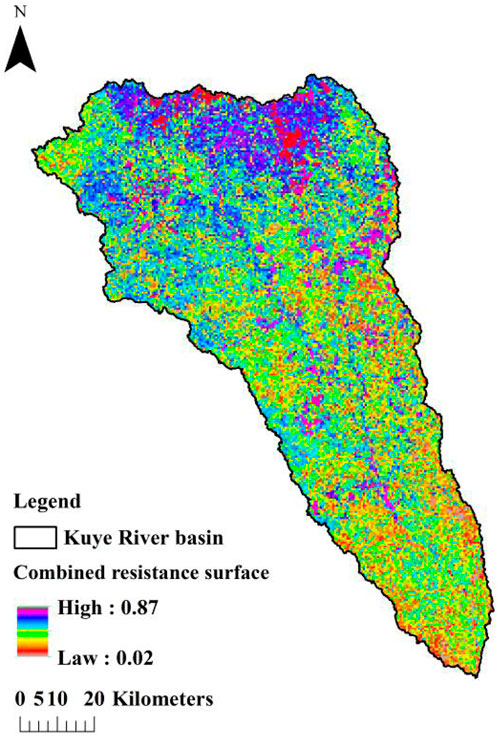
Figure 5. Ecological resistance surface.
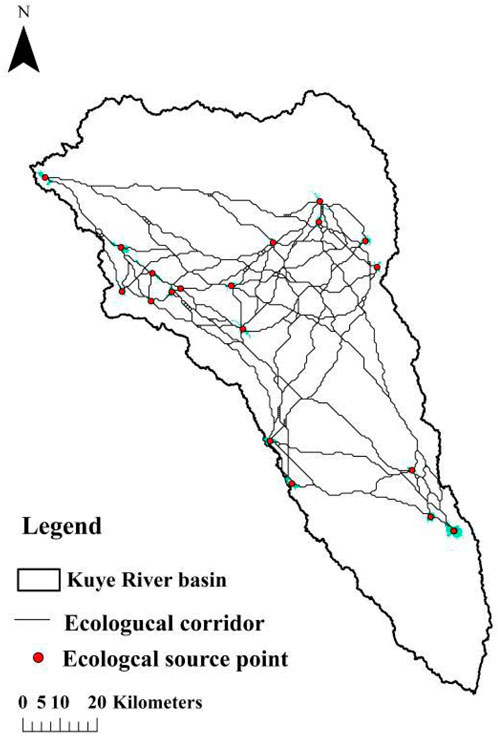
Figure 6. Ecological corridor extraction results.
In general, the research site’s conter has better interconnectedness and more ecological corridors. The south region of the research area is economically underdeveloped due to its vast vegetation, concentrated biological resources, and low human density. Thus, natural corridors are short and sparse. Furthermore, the ecological corridors have cleaer topography and geomorphology, but their connectivity within the watershed system is inadequate.
4.3.2 Ecological corridors and crucial ecological corridors
Ecological corridor creation and management become more economical as source interaction force increases, as does species material-energy exchange. This work created 137 general, 23 second-level, and 11 first-level ecological corridors (Table 4; Figure 7). Close proximity to ecological sources, which have minimal terrain resistance, facilitates organism mobility and material exchange. Next are ecological source sites 12 and 13, then 16 and 19, then 8 and 12, and finally 10, 13, and 11. We calculated the interaction force between Kuye River Basin biological source sites using the gravity model. Based on our investigation, ecological source site 9 and 12 have the strongest contact force. The two habitat patches between ecological corridors with stronger interaction forces have better environmental quality. Close proximity to ecological sources, which have minimal terrain resistance, facilitates organism mobility and material exchange. Next are ecological source sites 12 and 13, then 16 and 19, then 8 and 12, and finally 10, 13, and 11.

Table 4. . The interaction force matrix of ecological source in Kuye River Basin under gravity model.
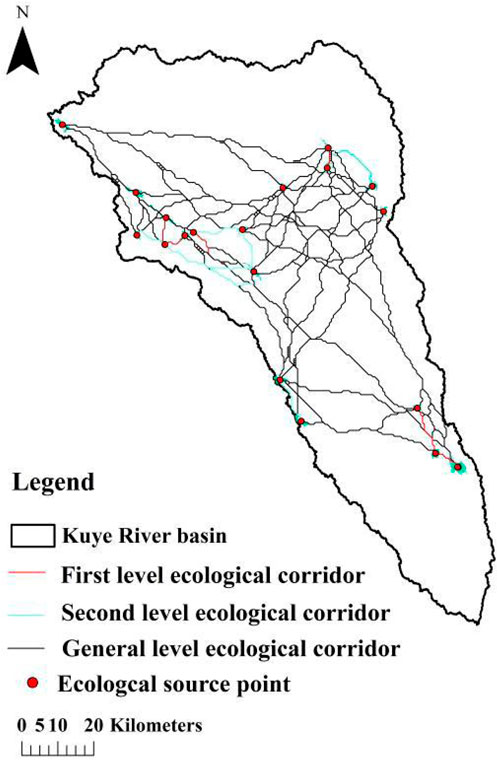
Figure 7. Ecological corridor classification results.
The distance between ecological source site 1 and 15, 16, 17, 18, and 19 limits circulation. It is difficult to link ecological source site 1 in ecological source sites 15, 16, 17, 18, 19 in the northwest. Connecting the north and south regions for material and energy exchange is required to ensure landscape connectedness of the study area. Hence, the corridor connecting patches 1 and 15–19 is important.
4.3.3 Ecological breakpoints
The presence of a traffic road network in the ecological corridor hinders biological migration and information exchange due to its tendency to promote fragmentation. ArcGIS’ linkage mapper tools and data management features helped us find 38 biological breakpoints in the Kuye River Basin. The road layer and corridor layer of national, provincial, railway, and high-speed highways were overlaid (Figure 8). The ecological breakpoints were mostly in the north of the research area. The landscape resistance component showed flat topography, a large concentration of development land, a dense population, and a well-developed road network. This means the area is densely populated and full of human activity.
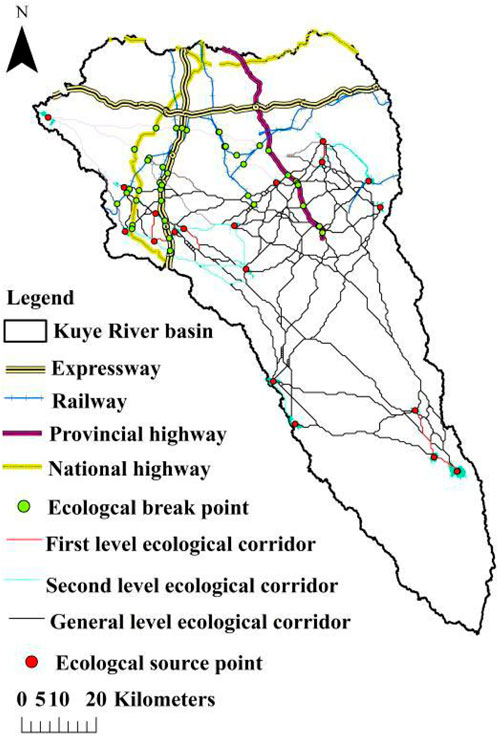
Figure 8. Ecological break point.
These biological breakpoints hindered the spread of ecological effects within the ecological corridor, and were strategic points that indicate the key areas of concern for ecological management.
5 Discussion
5.1 Land use structure and planning
An examination of the existing land use type indicates that the main key ecological areas predominantly concentrate in the center urban building land zone of the research area. Despite being few in number, these areas are of utmost ecological importance in the region, since they play a crucial role in maintaining overall resilience. It is crucial to prioritize the cultivation and advancement of ecological areas, such as forests and grasslands, in order to prevent excessive future growth.Urban construction land is highly vulnerable to external interruptions induced by human-made construction operations. It is advisable to establish urban development boundaries in a sensible manner, exercise scientific control over the amount of land used for construction, and apply methods to decrease human-caused disruptions.
5.2 Ecological networking and resistance surface construction
The ecological network was created by integrating different components of the ecosystem, with a particular focus on the watershed as the level of analysis. The Kuye River Basin ecological patch pattern indicated that ecological sources are mainly found in area with high biomass, gentle slopes, low topographic relief, infrequent soil erosion, and minimal geologic hazards. Conversely, human affected areas have fractured landscapes. The ecological patches exhibited a diminutive size and lacked adequate connectivity, resulting in an imbalanced spatial distribution of ecological sources. Wang et al. (2024) study of Erhai Lake Basin’s ecological network supports this result, demonstrating the ecological benefits of ecological sources. In contrast, we did not select nature reserves, national parks, or a specific terrain as ecological sources. Instead, we employed the MSPA approach and conducted a landscape connectivity overlay analysis to enhance the scientific objectivity of extracting ecological sources.
This study is a significant advance above previous research. Most previous investigations assigned a score using expert scoring or land use categories. However, including the physical surroundings and human interference reduced subjectivity in this investigation. The elements are standardized and calculated using indicator-specific procedures. We ended up with separate weights. After creating the cost resistance surface, the minimal cost path value connecting ecological sources and other target sources is calculated to produce an ecologically acceptable biological circulation corridor. Reduces subjectivity and inaccuracies when determining resistance levels with this method. Resistance level determination is more objective and error-free with this method.
5.3 Ecological planning recommendations
Through our empirical investigation of the Kuye River Basin, we have found distinct nodes and corridors. These apparently inconsequential elements were demonstrated to be crucial to the network’s robustness and efficiency. If these crucial areas experienced a malfunction, the network would be adversely affected. These nodes and corridors play a crucial role as biological hubs and connections, influencing the migration of species and the transmission of energy.
The study determined that future ecological protection and construction efforts should prioritize the planning, construction, and maintenance of natural vegetation protection zones alongside transportation roads. Additionally, it suggests the creation of three-dimensional ecological greenways at ecological breakpoints to facilitate the migration of biological species and the exchange of materials. It is crucial to focus on restoring ecological breakpoints and to consider implementing specific solutions such as underpasses, tunnels, flyovers, and other methods when constructing high-quality highways. To mitigate the hindrance of roads to species migration and ensure the unimpeded movement of organisms.
6 Conclusion
This study focused on the Kuye River Basin, which is the central area of China’s “Jin-Shaan-Mongolia Energy and Heavy Chemical Industry Base” and has a highly fragmented ecological landscape. The research analyzed the land use structure and landscape ecological pattern, identified ecological source sites, constructed landscape ecological resistance surfaces (Ye et al., 2015), and extracted and analyzed ecological corridors for the migration of living organisms and species. Ultimately, we examined the ecological thresholds that impede the movement of living organisms and the transfer of materials. By conducting an impartial assessment, we have developed an ecological network for the Kuye River Basin. This network serves as a reliable and practical reference for landscape ecological planning in the Kuye River Basin and other basins that share similar natural and socio-economic characteristics.
Upon detailed investigation, we found an imbalanced spatial organization of the ecological network in the Kuye River Basin, stressing the need to increase internal intricacy. The Kuye River Basin’ ecological security pattern must be optimized, especially in the north where human activities affect resource allocation. Hence, safeguarding crucial ecological resources, including 11 primary ecological corridors, 23 ecological corridors, and 137 general ecological corridors, as well as 38 ecological breaks in the economically advanced northern districts of the watershed, is essential for enhancing the efficiency of the watershed’s ecological network and overall ecosystem services.
Data availability statement
The original contributions presented in the study are included in the article/supplementary material, further inquiries can be directed to the corresponding author.
Author contributions
YW: Writing–original draft. FQ: Writing–review and editing. LL: Writing–review and editing. XD: Writing–review and editing.
Funding
The author(s) declare that financial support was received for the research, authorship, and/or publication of this article. Evolution of ecosystem structure and function and its impact on water and sediment processes in the watershed (Funder: Agricultural, Livestock and Water Resources Business Development Centre, Kangbashi District, Ordos City, China, Funding number: 2022EEDS KJXM005-01), Study on Gully Slope Erosion Mechanism in Pisha Sandstone Area of Yellow River Basin (Funder: Department of Science and Technology of the Inner Mongolia Autonomous Region, Funding number: 2021SHZR2545), Study on Erosion Process of Bare Bedrock-soil Composite Slope in Pisha Sandstone Area (Funder: National Natural Science Foundation of China, Funding number: 41967008).
Conflict of interest
The authors declare that the research was conducted in the absence of any commercial or financial relationships that could be construed as a potential conflict of interest.
Publisher’s note
All claims expressed in this article are solely those of the authors and do not necessarily represent those of their affiliated organizations, or those of the publisher, the editors and the reviewers. Any product that may be evaluated in this article, or claim that may be made by its manufacturer, is not guaranteed or endorsed by the publisher.
References
Bentrup, G. (2008). “Conservation Buffers—Design guidelines for buffers, corridors, and greenways,” in General Technical Report - Southern Research Station, USDA Forest Service 109. doi:10.2737/SRS-GTR-109
Barbati, A., Corona, P., Salvati, L., and Gasparella, L. (2013). Natural forest expansion into suburban countryside: gained ground for a green infrastructure?. Urban For. Urban Greening 12 (1), 36–43. doi:10.1016/j.ufug.2012.11.002
Cao, X. F., Liu, Z. S., Li, S. J., Gao, Z. J., Sun, B. W., and Li, Y. X. (2022). Identification of key areas for ecological restoration of national land space based on ecological security pattern—Taking Songyuan City, Jilin Province as an example. China Environ. Sci. 42 (6), 2779–2787. doi:10.19674/j.cnki.issn1000-6923.20220211.004
Chen, C. L., Shi, L., Lu, Y., Yang, S., and Liu, S. F. (2020). The optimization of urban ecological network planning based on the Minimum Cumulative Resistance Model and Granularity Reverse Method: a case study of Haikou, China. IEEE Access 8, 43592–43605. doi:10.1109/ACCESS.2020.2976548
Chen, L. D., Fu, B. J., and Zhao, W. W. (2006). Landscape theory of “source” and “sink” and its ecological significance. Chin. J. Ecol. 5, 1444–1449.
Chen, L. T., Cai, H. S., Zhang, T., Zhang, X. L., and Zeng, H. (2022). Multi-scenario simulation analysis of land use in Raohe River Basin based on Markov-FLUS model. J. Ecol. 42 (10), 3947–3958. doi:10.5846/stxb202106271705
Chen, N. N., Kang, S. Z., Zhao, Y. H., Zhou, L. J., Yan, J., and Lu, Y. R. (2021). Construction of mountain ecological network in Qinling Mountains (Shaanxi section) based on mspa and mcr models. J. Appl. Ecol. 32, 1545–1553. doi:10.13287/j.1001-9332.202105.012
Chen, S. Q., Fath, B., Chen, B., and Su, M. R. (2011). Evaluation of the changed properties of aquatic animals after dam construction using ecological network analysis. Int. Workshop Int. Congr. Environ. Model. Softw. 5 (5), 114–119. doi:10.1016/j.proenv.2011.03.056
Chen, Z. A., Kuang, D., Wei, X. J., and Zhang, L. T. (2017). Developing ecological networks based on MSPA and MCR: a case study in Yujiang County. Resour. Environ. Yangtze Basin 26, 1199–1207. doi:10.11870/cjlyzyyhj201708010
Chen, Z. Y., Guo, Q. L., Han, Y. Y., and Wang, B. R. (2022). The influence of precipitation and land use change on runoff in the Kuye River Basin. Hydropower Energy Sci. 40, 14–18. doi:10.20040/j.cnki.1000-7709.2022.20211935
Clerici, N., and Vogt, P. (2013). Ranking European regions as providers of structural riparian corridors for conservation and management purposes. Int. J. Appl. Earth Observation Geoinformation 21, 477–483. doi:10.1016/j.jag.2012.07.001
Farage, C., Edler, D., Eklöf, A., Rosvall, M., and Pilosof, S. (2021). Identifying flow modules in ecological networks using Infomap. Methods Ecol. Evol. 12, 778–786. doi:10.1111/2041-210X.13569
Fath, B. D., Scharler, U. M., Ulanowicz, R. E., and Hannon, B. (2007). Ecological network analysis: network construction. Ecol. Model. 208, 49–55. doi:10.1016/j.ecolmodel.2007.04.029
Feng, M., Zhao, W. M., and Zhang, T. (2023). Construction and optimization strategy of county ecological infrastructure network based on MCR and Gravity Model-A case study of Langzhong County in Sichuan Province. Sustainability 15, 8478. doi:10.3390/su15118478
Fu, H. X., Zhang, T., and Wang, J. G. (2024). Evaluating suitability of development and construction with of minimum cumulative resistance model for a mountain scenic area in Jinyun Xiandu, China. Ecol. Eng. 202, 107240. doi:10.1016/j.ecoleng.2024.107240
Guan, H. Y., Bai, Y. P., Tang, Y. Y., Zhang, C. Y., and Zou, J. C. (2023). Spatial identification and optimization of ecological network in desert-oasis area of Yellow River Basin, China. Ecol. Indic. 147, 109999. doi:10.1016/j.ecolind.2023.109999
Han, Y. M., Wang, J., Yu, S. T., Cheng, S., and Li, Y. L. (2023). Construction and optimization of ecological network in Saihanba Region. Resour. Environ. Arid Regions 37 (5), 112–121. doi:10.13448/j.cnki/jalre.2023.119
Hong, T. T., Huang, X. H., Deng, X. P., Yang, Y. W., and Tang, X. (2023). Research on the relationship between urban green infrastructure and thermal environment based on MSPA — take the central urban area of Fuzhou as an example. Chin. Gard. 39, 97–103. doi:10.19775/j.cla.2023.10.0097
Huang, X. X., Wang, H. J., Shan, L. Y., and Xiao, F. T. (2021). Constructing and optimizing urban ecological network in the context of rapid urbanization for improving landscape connectivity. Ecol. Indic. 132, 108319. doi:10.1016/j.ecolind.2021.108319
Jin, A. B., Zhang, S. Y., and Wang, X. R. (2022). Research on spatio-temporal pattern and optimization of Greenland ecological network in Ningshao Plain. J. Ecol. Rural Environ. 38, 1415–1426. doi:10.19741/j.issn.1673-4831.2022.0481
Jongman, R. H. G., Külvik, M., and Kristiansen, I. (2004). European ecological networks and greenways. Landsc. Urban Plan. 68, 305–319. doi:10.1016/S0169-2046(03)00163-4
Kang, J. M., Zhang, X., Zhu, X. W., and Zhang, B. L. (2021). Ecological security pattern: a new idea for balancing regional development and ecological protection. A case study of the Jiaodong Peninsula, China. Glob. Ecol. Conservation 26, e01472. doi:10.1016/j.gecco.2021.e01472
Kumaraswamy, S., and Udayakumar, M. (2011). Biodiversity banking: a strategic conservation mechanism. Biodivers. Conservation 20, 1155–1165. doi:10.1007/s10531-011-0020-5
Li, A. L., Niu, L. D., and Zhou, Y. (2022). Prediction method of construction land expansion speed of ecological city based on BP neural network. Int. J. Environ. Technol. Manag. 25, 108–121. doi:10.1504/IJETM.2022.120722
Li, F. Z., Liang, P. S., Li, X., and Shang, N. (2017). Characteristics of multi-scale greenway network layout and construction of a quantitative system for route selection. Urban Dev. Res. 24, 17–24.
Lin, T., Lin, J. Y., Cui, S. H., and Cameron, S. (2009). Using a network framework to quantitatively select ecological indicators. Ecol. Indic. 9, 1114–1120. doi:10.1016/j.ecolind.2008.12.009
Liu, D., Liu, T. A., Zheng, Y., and Zhang, Q. (2023a). The construction efficiency study of China National Ecological Civilization Pilot Zone with network SBM model: a city-based analysis. Environ. Sci. Pollut. Res. 30, 47685–47698. doi:10.1007/s11356-023-25578-5
Liu, X. P., Li, X. Y., Li, Y. M., Zhao, S. T., Dai, Z. Y., and Duan, M. J. (2023b). Construction and optimization of ecological networks in rapid urbanization areas: a case study of daxing district, Beijing. J. Ecol. 43 (20), 8321–8331. doi:10.20103/j.stxb.202209132620
Liu, X. Y., Wei, M., Zeng, J., and Zhang, S. (2021). Ecological network analysis and construction: a case study of the urban agglomeration of the Min River Delta, China. Resour. Sci. 43 (2), 357–367. doi:10.18402/resci.2021.02.13
Louder, E., and Wyborn, C. (2020). Biodiversity narratives: stories of the evolving conservation landscape. Environ. Conserv. 47, 251–259. doi:10.1017/S0376892920000387
Lu, C., Qi, X., Zheng, Z. S., and Jia, K. (2022). PLUS-Model based Multi-Scenario land space simulation of the lower Yellow River Region and its ecological effects. Sustainability 14, 6942. doi:10.3390/su14116942
Lu, X., Wang, J. M., Li, X. F., and Feng, Y. (2017). Construction of ecological network for land improvement based on minimum cost distance. Soil Water Conservation Bull. 37, 143–149+346. doi:10.13961/j.cnki.stbctb.2017.04.024
Luo, L. Z., Yang, C. X., Chen, R. R., and Liu, W. P. (2023). Comprehensive land consolidation zoning based on Minimum Cumulative Resistance Model-A case study of Chongqing, southwest China. Land 12, 1935. doi:10.3390/land12101935
Ma, Y. L., Gao, Y. J., Wang, L., and Xu, J. H. (2011). Analysis of the reasons for the sharp decrease in measured water and sediment volume in the Kuye River Basin. People's Yellow River 33, 12–13. doi:10.3969/j.issn.1000-1379.2011.11.005
Mao, Y. Y., Xu, F., Gao, Y. X., Huang, K., Li, X., and Hu, H. (2023). Construction and planning application of blue-green ecological network in Ruzhou City based on morphological spatial pattern analysis (MSPA). J. Appl. Ecol. 34, 2226–2236. doi:10.13287/j.1001-9332.202308.025
Mitchell, M. G. E., Bennett, E. M., and Gonzalez, A. (2013). Linking landscape connectivity and ecosystem service provision: current knowledge and research gaps. Ecosystems 16 (5), 894–908. doi:10.1007/s10021-013-9647-2
Nie, W. B., Shi, Y., Siaw, M. J., Yang, F., Wu, R. W., Wu, X., et al. (2021). Constructing and optimizing ecological network at county and town Scale: the case of Anji County, China. Ecol. Indic. 132, 108294. doi:10.1016/j.ecolind.2021.108294
Ordóñez-Gómez, J. D., Arroyo-Rodríguez, V., Nicasio-Arzeta, S., and Cristóbal-Azkarate, J. (2015). Which is the appropriate scale to assess the impact of landscape spatial configuration on the diet and behavior of spider monkeys? Am. J. Primatology 77, 56–65. doi:10.1002/ajp.22310
Peng, J., Pan, Y. J., Liu, Y. X., Zhao, H. J., and Wang, Y. L. (2018). Linking ecological degradation risk to identify ecological security patterns in a rapidly urbanizing landscape. Habitat Int. 71, 110–124. doi:10.1016/j.habitatint.2017.11.010
Peterman, W. E., Connette, G. M., Semlitsch, R. D., and Eggert, L. S. (2014). Ecological resistance surfaces predict fine-scale genetic differentiation in a terrestrial woodland salamander. Mol. Ecol. 23, 2402–2413. doi:10.1111/mec.12747
Pontius, R. G., Boersma, W., Castella, J. C., Clarke, K., de Nijs, T., Dietzel, C., et al. (2008). Comparing the input, output, and validation maps for several models of land change. Ann. Regional Sci. 42 (1), 11–37. doi:10.1007/s00168-007-0138-2
Qin, J. Z., Dai, J. P., Li, S. H., Zhang, J. Z., and Peng, J. S. (2024). Construction of ecological network in Qujing city based on MSPA and MCR models. Sci. Rep. 14, 9800. doi:10.1038/s41598-024-60048-z
Salviano, I. R., Gardon, F. R., and dos Santos, R. F. (2021). Ecological corridors and landscape planning: a model to select priority areas for connectivity maintenance. Landsc. Ecol. 36, 3311–3328. doi:10.1007/s10980-021-01305-8
Saura, S., and Pascual-Hortal, L. (2007). A new habitat availability index to integrate connectivity in landscape conservation planning: comparison with existing indices and application to a case study. Landsc. Urban Plan. 83 (2-3), 91–103. doi:10.1016/j.landurbplan.2007.03.005
Soille, P., and Vogt, P. (2009). Morphological segmentation of binary patterns. Pattern Recognit. Lett. 30 (4), 456–459. doi:10.1016/j.patrec.2008.10.015
Song, S., Wang, S., Wu, X. T., Huang, Y. Y., and Fu, B. J. (2022). Decreased virtual water outflows from the Yellow River Basin are increasingly critical to China. Hydrology Earth Syst. Sci. 26, 2035–2044. doi:10.5194/hess-26-2035-2022
Squires, D. (2014). Biodiversity conservation in asia. Asia & Pac. Policy Stud. 1, 144–159. doi:10.1002/app5.13
Vogt, P., Ferrari, J. R., Lookingbill, T. R., Gardner, R. H., Riitters, K. H., and Ostapowicz, K. (2009). Mapping functional connectivity. Ecol. Indic. 9 (1), 64–71. doi:10.1016/j.ecolind.2008.01.011
Wang, F. X., Mao, A. H., Li, H. L., and Jia, M. L. (2014). Quality measurement and regional difference of urbanization in Shandong Province based on the entroy method. Sci. Geogr. Sin. 33 (11), 1323–1329. doi:10.13249/j.cnki.sgs2013011.1323
Wang, H. Z., and Zhang, L. Q. (2005). Ecological network planning for Xiamen island based on GIS, landscape pattern and network analysis. J. Plant Ecol. 1, 144–152. doi:10.17521/cjpe.2005.0019
Wang, J. Q., Li, X. R., Wang, M., and Ge, J. W. (2021). Urban waterfront habitat network construction and optimization strategy based on waterbird habitat conservation: a case study of Kunshan City. Landsc. Archit. 28, 76–81. doi:10.14085/j.fjyl.2021.06.0076.06
Wang, Q. X., Li, Y. Z., Qu, Z. C., Yu, J. B., Wang, X. H., Zhou, D., et al. (2022a). Construction and evaluation of wetland ecological network in the Yellow River Estuary. Ecol. Sci. 41, 105–113. doi:10.14108/j.cnki.1008-8873.2022.06.013
Wang, S., Wu, M. Q., Hu, M. M., and Xia, B. C. (2022b). Integrating ecosystem services and landscape connectivity into the optimization of ecological security pattern: a case study of the Pearl River Delta, China. Environ. Sci. Pollut. Res. 29, 76051–76065. doi:10.1007/s11356-022-20897-5
Wang, T. W., Huang, Y. C., Cheng, J. H., Xiong, H., Ying, Y., Feng, Y., et al. (2024). Construction and optimization of watershed-scale ecological network based on complex network method: a case study of Erhai Lake Basin in China. Ecol. Indic. 160, 111794. doi:10.1016/j.ecolind.2024.111794
Wang, Y. Z., Li, J. L., Gu, K. K., and Lu, L. (2022). Optimization of urban green infrastructure network pattern based on Morphological Spatial Pattern Analysis: a case study of Hefei City. J. Ecol. 42, 2022–2032. doi:10.5846/stxb202007301988
Wei, C. J., Wang, Y. F., and Cai, X. S. (2023a). Research on the dynamic evolution of land use and ecological environment in Shandong Province. J. Appl. Basic Eng. Sci. 31, 1183–1189. doi:10.16058/j.issn.1005-0930.2023.05.010
Wei, J. C., Li, Z. H., and Dong, Y. Y. (2023b). Study on the legalization of the environmental safety evaluation system in the Yellow River Basin based on the pressure-state-response model. China Environ. Monit. 39, 19–28. doi:10.19316/j.issn.1002-6002.2023.01.03
Wei, Q. Q., Halike, A., Yao, K. X., Chen, L. M., and Balati, M. (2022). Construction and optimization of ecological security pattern in Ebinur Lake Basin based on MSPA-MCR models. Ecol. Indic. 138, 108857–108913. doi:10.1016/j.ecolind.2022.108857
Xu, C. L., Chen, X., Yu, Q., Avirmed, B., Zhao, J. K., Liu, W., et al. (2024). Relationship between ecological spatial network and vegetation carbon use efficiency in the Yellow River Basin, China. Giscience and Remote Sens. 61, 1. doi:10.1080/15481603.2024.2318070
Xue, J. C. (2023). Impact of the new round of returning farmland to forests and grasslands project on land use efficiency: an empirical study based on the Yellow River Basin. Soil Water Conservation Bull. 43 (6), 155–164. doi:10.13961/j.cnki.stbctb.223.06.020
Yan, W. C., Wang, Y. Y., Chaudhary, P., Ju, P. J., Zhu, Q. A., Kang, K. M., et al. (2022). Effects of climate change and human activities on net primary production of wetlands on the Zoige Plateau from 1990 to 2015. Global Ecol. Conserv. 35. doi:10.1016/j.gecco.2022.e02052
Yang, H. T., Chen, J., Zhu, B., Jiang, C., and He, Y. X. (2023). Urban ecological space optimization based on MSPA and MCR models: a case study of Jiangyou City, Sichuan. J. Mianyang Normal Coll. 42, 105–111. doi:10.16276/j.cnki.cn51-1670/g.2023.08.015
Yang, L. J., Zhang, F. N., and Qin, L. S. (2024). Construction and stability evaluation of ecological networks in the Loess Plateau. Ecol. Indic. 159, 111697. doi:10.1016/j.ecolind.2024.111697
Ye, Y. Y., Su, Y. X., Zhang, H. O., Liu, K., and Wu, Q. T. (2015). Construction of an ecological resistance surface model and its application in urban expansion simulations. J. Geogr. Sci. 25, 211–224. doi:10.1007/s11442-015-1163-1
Yin, H. W., Kong, F. H., Qi, Y., Wang, H. Y., Zhou, Y. N., and Qin, Z. M. (2011). Construction and optimization of ecological network of urban agglomeration in Hunan Province. Ecology 31, 2863–2874.
Zeng, C., Liu, P. L., and Huang, L. Q. (2023). Measurement of architectural landscape fragmentation in traditional villages from the perspective of landscape diversity and heterogeneity. Geoscience 43, 1973–1982. doi:10.13249/j.cnki.sgs.2023.11.010
Zhang, C. C., Wang, P., Xiong, P. S., and Zhang, Y. (2020a). Time-series evaluation of land ecological security based on PSR model-entropy weight method—Taking Hengyang city as an example. J. Hengyang Normal Coll. 41 (3), 111–116. doi:10.13914/j.cnki.cn43-1453/z.2020.03.021
Zhang, L. A., Qiang, Z., and Xu, E. R. (2023). Improving the ecological network optimization with landscape connectivity: a case study of Neijiang City, Sichuan Province. Environ. Sci. Pollut. Res. 30, 54753–54769. doi:10.1007/s11356-023-26197-w
Keywords: land use type, morphological spatial patterning analysis, ecological resistance surface, minimum cumulative resistance model, ecological corridor, ecological breakpoint
Citation: Wu Y, Qin F, Li L and Dong X (2024) Construction and optimisation of watershed scale ecological network: a case study of kuye river basin. Front. Environ. Sci. 12:1364568. doi: 10.3389/fenvs.2024.1364568
Received: 09 January 2024; Accepted: 02 August 2024;
Published: 26 August 2024.
Edited by:
Luis Gomez, University of Las Palmas de Gran Canaria, SpainReviewed by:
Jose Navarro Pedreño, Miguel Hernández University of Elche, SpainJieming Kang, Shandong Normal University, China
Copyright © 2024 Wu, Qin, Li and Dong. This is an open-access article distributed under the terms of the Creative Commons Attribution License (CC BY). The use, distribution or reproduction in other forums is permitted, provided the original author(s) and the copyright owner(s) are credited and that the original publication in this journal is cited, in accordance with accepted academic practice. No use, distribution or reproduction is permitted which does not comply with these terms.
*Correspondence: Fucang Qin, cWluZmNAMTI2LmNvbQ==
†ORCID: Fucang Qin, orcid.org/0009-0008-0431-6615; Long Li, orcid.org/0000-0001-7536-3728; Xiaoyu Dong, orcid.org/0009-0000-7167-0544