 Guozhi Li
 Mengying Jiang
- School of Business, Wenzhou University, Wenzhou, China
Supply chain carbon abatement is an important way to promote low-carbon transformation of the social economy and address global climate change. This paper analyzes the issue of supply chain carbon abatement under different power structures, as well as the effect of consumers’ low-carbon preference and carbon tax rate on the optimal decisions. This paper constructs five different models, namely ML-NO model, ML-CS model, RL-NO model, RL-CS model and VI model. The research finds that VI model is the most ideal model for promoting supply chain carbon abatement. The optimal abatement efforts, market demand, and total profits in the VI model are all the largest among the five models. Whether the supply chain leader is the manufacturer or the retailer, cost sharing contract can enhance optimal abatement efforts, market demand, and profits of both parties. In any model, the leader in Supply chain earns higher profits than the follower. When consumers’ low-carbon preference increases, the optimal abatement efforts, market demand, and profits of both parties will all increase, and the growth rate is gradually accelerating. For the manufacturer with high carbon emissions, when the carbon tax rate increases, the optimal abatement efforts first increase and then decrease. For the manufacturer with low carbon emissions, when the carbon tax rate increases, the optimal abatement efforts will also increase.
1 Introduction
In recent years, environmental issues have received widespread attention from countries around the world, and the goal of global warming within 1.5°C was reiterated at the 27th United Nations Climate Conference (Masood et al., 2022). Global warming is mainly attributed to greenhouse gas emissions caused by human activities. According to IEA (2023), global carbon emissions associated with energy consumption increased by 0.9% in 2022, reaching a historic high of 36.8 billion tons. One important reason is that enterprises increase their consumption of fossil fuels significantly in pursuit of maximizing profit, leading to negative environmental externality (Xiao et al., 2018). To enhance enterprises’ enthusiasm for carbon abatement, governments around the world have introduced a large number of policies, mainly including carbon subsidy policy, carbon tax policy, cap-and-trade system, etc (Dechezleprêtre et al., 2023; Adekunle and Oseni, 2021; Chen et al., 2020). At the same time, with the upgradation of consumers’ living standards and low-carbon awareness, in order to gain competitive advantages, enterprises themselves must also increase their low-carbon investment, and produce more low-carbon products to meet the need of consumers (Lukas and Welling, 2014).
In practice, enterprises are not isolated individuals, and almost all enterprises are a node in the supply chain. Therefore, the carbon abatement decision of an enterprise is inevitably influenced by upstream and downstream enterprises. Under different power structures, the decision order of supply chain members varies, resulting in significant differences in the optimal decision outcome and profits distribution (Liu et al., 2017; Li et al., 2022). In addition, the existence and level of cooperation among supply chain members can also have a significant impact on their decisions (Li H. et al., 2019; Wang et al., 2021). Supply chain members often maximize their profits through cost sharing, revenue sharing, collaborative decision (Sharma and Jain, 2021; Heydari et al., 2017). Therefore, this paper incorporates both power structure and cost sharing contract into supply chain carbon abatement decisions, in order to draw some valuable conclusions.
This paper constructs five models, which are defined as follows:
(1) Manufacturer-led Stackelberg with no contract (ML-NO): The manufacturer, as the leader of the supply chain, makes decisions first and there is no abatement cooperation contract between the manufacturer and the retailer.
(2) Manufacturer-led Stackelberg with cost sharing contract (ML-CS): The manufacturer, as the leader of the supply chain, makes decisions first and the retailer shares a portion of abatement costs of the manufacturer.
(3) Retailer-led Stackelberg with no contract (RL-NO): The retailer, as the leader of the supply chain, makes decisions first and there is no abatement cooperation contract between the manufacturer and the retailer.
(4) Retailer-led Stackelberg with cost sharing contract (RL-CS): The retailer, as the leader of the supply chain, makes decisions first and the retailer shares a portion of abatement costs of the manufacturer.
(5) Vertical integration (VI): The manufacturer and the retailer make decisions as a whole with the goal of maximizing the profits throughout the supply chain (hereinafter referred to as total profits).
In the above models, models (1) to (4) represent decentralized decision, while model (5) represents centralized decision.
This paper is going to address the following research questions:
(1) Which of the above five models has the highest carbon abatement efforts and supply chain profits? Can centralized decision and cost sharing contract improve carbon abatement efforts and supply chain profits?
(2) How does consumers’ low-carbon preference affect the decisions of supply chain members? Are there any significant differences among different models?
(3) How does carbon tax rate affect the decisions of supply chain members? Are there any significant differences among different models?
To answer the above questions, this paper solves the equilibrium solutions of each model through mathematical derivation on one hand, and visually displays the differences between different models through numerical simulation on the other hand. The remainder of this paper is structured as follows. Section 2 provides a literature review. Section 3 constructs five models and solves them. Section 4 compares the equilibrium solutions of the five models. Section 5 conducts numerical simulations. Finally, Section 6 summarizes the research conclusions.
2 Literature review
This section will review existing literature. Specifically, it mainly includes three aspects of literature: 1) Carbon abatement decision and coordination in various types of supply chains, 2) the impact of power structure on supply chain performance, and 3) the effect of consumers’ low-carbon preference and carbon policies.
2.1 Carbon abatement decision and coordination in various types of supply chains
In recent years, the issue of supply chain carbon abatement has attracted the attention of scholars. Benjaafar et al. (2013) is one of the earlier literature to incorporate carbon emissions into supply chain operational decision. Afterwards, scholars conducted extensive research on carbon abatement in various supply chains. For example, Taleizadeh et al. (2018), Guo and Xi (2022) and Halat et al. (2021) discussed carbon abatement decisions in two-echelon, three-echelon, and multi-echelon supply chain, respectively; Zhou and Ye (2018) analyzed the dynamic pricing and carbon reduction strategies in dual channel supply chain; Taleizadeh et al. (2019), Cheng et al. (2022) and Mishra et al. (2020) discussed carbon reduction and product recovery issues in closed-loop supply chain.
In terms of carbon reduction cooperation, supply chain contracts have become a hot research topic for scholars as an efficient way of coordination. Cost sharing and revenue sharing are the most important ways for different members to collaborate on carbon reduction. Ghosh and Shah (2015) discussed the influence of cost sharing contract and bargaining power on product greenness, price, and profit; Sharma and Jain (2021) debated the optimality of cost sharing contract with different parameter ranges in a two-stage supply chain; Liu et al. (2021) found that carbon reduction cost sharing contract increases the order volume and profit of the retailer. Peng et al. (2018) and Li T. et al. (2019) analyzed the role of revenue sharing contract in supply chain coordination. In addition, quantity discount contract (Heydari et al., 2017), two-part pricing contract (Swami and Shah, 2013), option contract (Peng et al., 2020), and repurchase contract (Taleizadeh et al., 2018) can also effectively achieve supply chain coordination. Compared to other contracts, the two-part pricing contract is more robust (Bai et al., 2017). In addition, some scholars have found that the symmetry of information among members has prominent effects on supply chain coordination and contract design (Ma et al., 2018; Xia et al., 2023).
2.2 Impact of power structure on supply chain performance
There are significant differences in the decision-making order and profit distribution of supply chain members under different power structures and cooperation level among members. Some scholars have explored this issue. Ji and Huang (2022) established single carbon reduction models and cooperative carbon reduction models under different power structures. Sun et al. (2023) constructed a centralized and three decentralized decision models with different channel power structures. Jiang et al. (2021a) found that the centralized model has the best emission reduction effect and the highest supply chain profit without fairness concern, while the general contractor’s Stackelberg model has the best emission reduction effect and the highest supply chain profit with fairness concern. Li et al. (2022) believed the carbon emissions reduction levels and profits of the supply chain were always the highest in the Nash model, while the overall economic and environmental benefits of the supply chain were the lowest in the manufacturer-led Stackelberg model. Gong and He (2023) found that the streamer’s profit is optimal in the resale mode, while the manufacturer’s profit is optimal in the commission mode when under the streamer-led structure. Zhang and Yu (2023) found that the government subsidy rates are dependent on the power status between manufacturers and retailers, and the weaker party will get higher subsidy rate. Liu et al. (2017) believed that the Stackelberg leaders always perform better than their corresponding followers before emission reduction, while they may not necessarily yield more benefits after emission reduction. Wang et al. (2019) summarized that dominant supply chain members always benefited and that whole supply chain gained the most profits in the Nash model. Huang et al. (2023) established three low-carbon supply chain models under different power structures, namely manufacturer-led, retailer-led and power pairs between two parties. They found that when supply chain enterprises have equal power, the supply chain will have greater social welfare and market demand, but not necessarily greater supply chain profits. Jiang et al. (2021b) found that supply chain pricing was different in different power structures but it had no influence on carbon emissions reduction decisions.
2.3 Effect of consumers’ low-carbon preference and carbon policies
The green attitude of consumers is an important factor affecting their purchasing behavior. With the enhancement of consumers’ environmental awareness, their desire to purchase low-carbon products will increase (Krass et al., 2013). Some literature has discussed the effect of consumers’ environmental awareness and low-carbon preference on supply chain carbon reduction. For example, Hammami et al. (2018) explored the optimal decision of enterprises based on consumers’ environmental awareness; Hu and Wang (2022) believed that the consumers’ low-carbon preference imposes a significant effect on the producers’ decision; Mantovani and Vergari (2017) believed that as consumers’ low-carbon preference increases, the social welfare will also increase; Huo et al. (2022) believed that consumers’ environmental awareness can accelerate cooperation among different members to reduce carbon emissions.
The effect of carbon policies is a focal issue of academic concern. Carbon policies mainly include cap-and-trade system, carbon tax policy, and carbon subsidy policy, etc. In cap-and-trade system, the initial quota and carbon price are the most core factors (Blumberg and Sibilla, 2023). In the early stage of carbon market development in many countries, the initial quota is often free, which restricts the effectiveness of carbon reduction (Zhang et al., 2019); Ji et al. (2020) found that excessive carbon quotas may harm the profit of the producer; Majumdar et al. (2023) and Leroutier (2022) found that as the carbon price increases, the gross profit initially decreases and then stabilises; Qu et al. (2021) derived a negative correlation between carbon trading price and carbon reduction of the product.
Many studies have shown that carbon tax policy can enhance manufacturers’ enthusiasm for carbon reduction, thereby reducing supply chain carbon emissions level (Zhang et al., 2021; Halat et al., 2021), but the marginal carbon reduction effect is showing a downward trend (Guo and Xi, 2022). As the carbon tax rate increases, the profit of the retailer first slightly increase and then rapidly decrease, while the profit of the manufacturer continue to decline, indicating that carbon tax increase the burden on supply chain enterprises (Wu et al., 2022). Moreover, carbon tax will also cause retail price to rise, leading to a decrease of social welfare (Feng et al., 2020; Li and Wang, 2023). Therefore, the carbon tax rate should be set within a appropriate range. Some scholars have proposed differentiated carbon tax policy, which means setting different tax rates for different products and supply chain members (Yu Z. et al., 2023; Shen et al., 2022).
Government subsidies can promote the total profit of the supply chain while suppressing carbon emissions (Yang and Xu, 2019), but the effects of different subsidy policies vary. For example, Yu L. et al. (2023) compared the effects of the unified rate policy, linear growth policy, and two-step subsidy policy, and found that the uniform rate policy has the best effect. There are also some literature comparing the effects of different carbon policies, but the conclusions are not the same. Meng et al. (2022) found that there is almost no difference in the impact of carbon tax policy and cap-and-trade system on supply chain carbon reduction, while literature such as Cheng et al. (2022), Sun and Yang (2021), and Li et al. (2021) all believed that the carbon reduction performance of cap-and-trade system is better than that of carbon tax policy and carbon subsidy policy.
2.4 Differences from existing literature
(1) This paper incorporates both power structure and cost sharing contract into supply chain carbon abatement decision, and constructs five different models for comparison. However, existing literature usually only analyzes the impact of power structure or cooperative contracts on supply chain performance separately.
(2) In ML-CS model and RL-CS model, this paper divides the solving process into two stages: the first stage is to find the Stackelberg equilibrium, and the second stage is to find the optimal cost allocation ratio. However, existing literature generally only calculates the Stackelberg equilibrium.
(3) This paper has found some different conclusions, suggesting that the impact of carbon tax rate on abatement efforts is related to the initial carbon emissions of the manufacturer. When the initial carbon emissions are high, the abatement efforts of the manufacturer first increase and then decrease with the increase of carbon tax rate. When the initial carbon emissions are low, the abatement efforts increase with the increase of carbon tax rate.
3 Model construction and solution
3.1 Parameters and variables
This paper considers a two-echelon supply chain consisting of a single manufacturer and a single retailer. The manufacturer only produces a single product and sells it all to the retailer, who then sells it all to consumers. The manufacturer determines the abatement efforts and wholesale price per unit product, while the retailer determines the retail price (or marginal profit) per unit product. The notations for the parameters and variables used in this paper are summarized in Table 1.
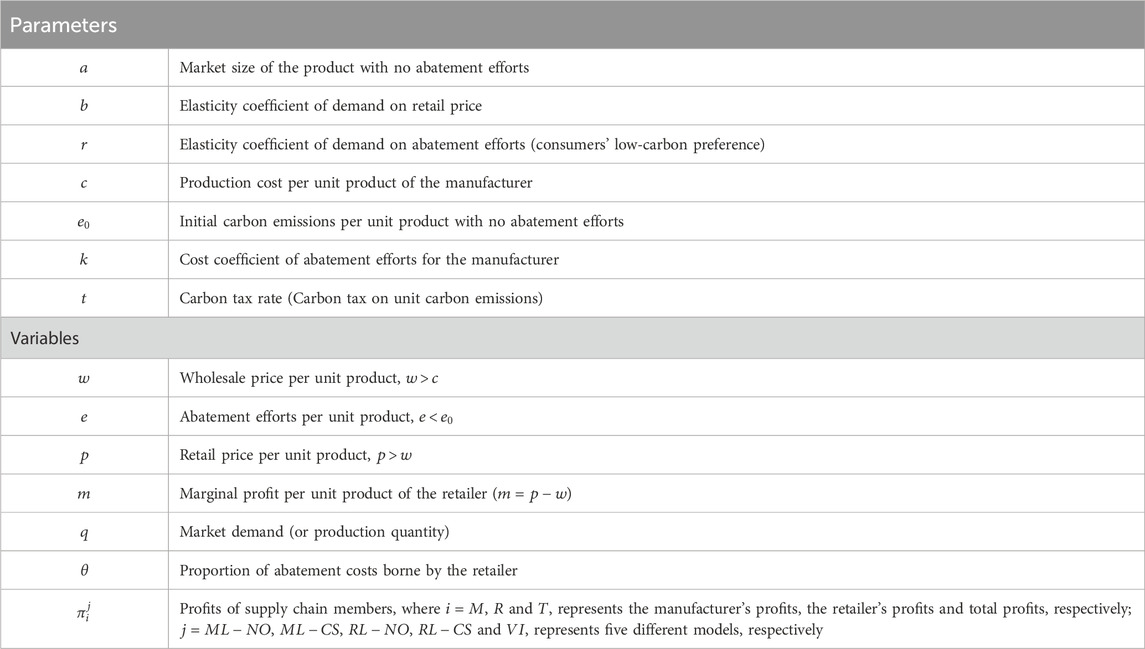
Table 1. Notations and meanings for the parameters and variables.
3.2 Hypotheses
(1) According to Yuan et al. (2022), assume that both the manufacturer and the retailer are risk neutral and entirely rational, with symmetrical information between them, and their decision goal is to maximize their own profits. The manufacturer has sufficient production capacity, and the production quantity equals the retailer’s order quantity. The retailer can fully meet market demand, regardless of shortage and inventory costs.
(2) Consumers have low-carbon preference, and the manufacturer’s abatement efforts can effectively enhance market demand. According to Li and Gong (2020) and Kouvelis and Zhao (2015), assume that market demand is linearly related to the retail price and the abatement efforts, i.e.,
(3) The initial carbon emissions per unit product with no abatement efforts are
(4) According to Ghosh and Shah (2012), Chen et al. (2019) and Yuan et al. (2022), the cost function of abatement efforts will meet
(5) To strengthen the abatement efforts, the government imposes carbon tax on the manufacturer, and the carbon tax per unit carbon emissions (carbon tax rate) is
(6) The production cost per unit product of the manufacturer is
(7) To simplify the writing, let
3.3 Model solution
3.3.1 Manufacturer-led Stackelberg with no contract (ML-NO)
In ML-NO model, the manufacturer, as the leader, first determines
Proposition 1. In ML-NO model, the optimal
Proof. Solving
Substituting
Adding
3.3.2 Manufacturer-led Stackelberg with cost sharing contract (ML-CS)
In ML-CS model, the solution of equilibrium is divided into two stages. In the first stage, just like ML-NO model, the manufacturer first determines
Proposition 2. In the first stage of ML-CS model, the optimal
Proof. Solving
Substituting
Proposition 3. Compared to ML-NO model, Pareto improvement can be achieved in ML-CS model when
Proof. Solving
Proposition 4. In the second stage of ML-CS model, the optimal
Proof. Solving
It can be observed that
Adding
3.3.3 Retailer-led Stackelberg with no contract (RL-NO)
In RL-NO model, the retailer, as the leader, first determines
Proposition 5. In RL-NO model, the optimal
Proof. Solving equation group
Substituting
Adding
3.3.4 Retailer-led Stackelberg with cost sharing contract (RL-CS)
In RL-CS model, the solution of equilibrium is divided into two stages. In the first stage, just like RL-NO model, the retailer first determines
Proposition 6. In the first stage of RL-CS model, the optimal
Proof. Solving equation group
Substituting
Proposition 7. Compared to RL-NO model, Pareto improvement can be achieved in RL-CS model when
Proof. Solving
Proposition 8. In the second stage of RL-CS model, the optimal
Proof. Solving
It can be observed that
Adding
3.3.5 Vertical integration (VI)
In VI model, the manufacturer and the retailer are considered as a whole and jointly determine
Proposition 9. In VI model, the optimal
Proof. Solving equation group
Substituting
4 Model analysis
4.1 Comparison of equilibrium solutions in different models
4.1.1 Differences in main variables
Proposition 10. The comparison of the main variables in each model is as follows:
(i)
Proof. Subtracting the optimal
According to conclusions (i) to (iii) in Proposition 10, the optimal abatement efforts, market demand and total profits in VI model are all the largest among the five models, while they are all the smallest in ML-NO model. It indicates that centralized decision can effectively improve supply chain performance, while stimulating the manufacturer’s abatement efforts and market demand for low-carbon products, making it the most ideal decision model. When making decentralized decisions, both the manufacturer and the retailer pursue their own maximum profits. The effect of “double marginalization” makes it difficult to maximize total profits, and also leads to lower abatement efforts and market demand. Compared to the manufacturer-led models, the retailer-led models have higher abatement efforts, market demand, and total profits. The main reason is that the retailer will use its dominant power to influence the manufacturer’s decisions, enabling the manufacturer to produce products with higher abatement efforts to meet market demand while increasing the total profits of both parties. This is similar to the conclusions of Jiang et al. (2021a) and Li et al. (2022), where Jiang et al. (2021a) believed that centralized model has the best emission reduction effect, Li et al. (2022) found the overall economic were the lowest in the manufacturer-led Stackelberg model.
According to conclusions (iv) to (v) in Proposition 10, whether in the manufacturer-led model and the retailer-led model, when the retailer shares the manufacturer’s carbon abatement costs, the profits of both parties will increase. It means that cost sharing contract can effectively achieve Pareto improvement, which confirms the previous conclusion. According to conclusion (vi) in Proposition 10, regardless of whether there is a cost sharing contract or who is dominant in the supply chain, the profit of the leader is higher than that of the follower. This is different from the conclusion of Liu et al. (2017). According to Liu et al. (2017), the profits of Stackelberg leaders are higher than that of followers before emission reduction, but it may not necessarily be the case after emission reduction.
Proposition 11. Among the two cost sharing models, the proportion of abatement costs borne by the retailer is as follows:
Proof.
According to Proposition 11, when the retailer is dominant, it is willing to bear a higher proportion of abatement costs. The main reason is that when this retailer is dominant, it can gain higher profits from the manufacturer’s abatement efforts, and is therefore willing to share more costs to incentivize the manufacturer’s abatement efforts.
4.1.2 Conditions for achieving vertical integration through profits distribution
As mentioned earlier, vertical integration is the most ideal model to maximize the manufacturer’s abatement efforts and total profits. However, in practice, both the manufacturer and the retailer make decisions based on maximizing their own profits, and “double marginalization” leads to inefficient resource allocation. Therefore, it is difficult for both players to spontaneously form a comprehensive cooperation, and a certain incentive contract must be established. Existing literature has conducted extensive research on this topic (Sharma and Jain, 2021; Li T. et al., 2019; Swami and Shah, 2013; Heydari et al., 2017). This paper will no longer analyze the specific contract and coordination effectiveness, but only provide the basic conditions that need to be met to achieve vertical integration.
Obviously, to achieve vertical integration, it is necessary to ensure that the manufacturer and the retailer earn more profits in VI model. Assuming that in VI model, the profit sharing ratios of the manufacturer and the retailer are
Proposition 12. The condition for vertical integration is
Proof. To achieve vertical integration, it is necessary to meet
According to Proposition 12, to achieve vertical integration, the maximum profit sharing ratio of the manufacturer is 0.5, and the minimum is related to consumers’ low-carbon preference and carbon tax rate. Due to
4.2 Impact of consumers’ low-carbon preference and carbon tax rate
Proposition 13. The impact of consumers’ low-carbon preference on supply chain decisions is as follows:
(i)
Proof. Taking the first-order partial derivative of
According to Proposition 13, in any model, the first-order partial derivative of
Compared to other models, in VI model, the marginal abatement effect of consumers’ low-carbon preference is the largest. The main reason is that the enhancement of consumers’ low-carbon preference can effectively stimulate the market demand for low-carbon products. In order to meet market demand and reduce carbon tax expenditure, the manufacturer will continuously strengthen the abatement efforts. Meanwhile, due to the increase of market demand, the profits of both the manufacturer and the retailer will also increase. When the manufacturer and the retailer make decisions as a whole (VI model), the marginal profit of consumers’ low-carbon preference is also the largest among all models. Furthermore, when implementing decentralized decision, the marginal effect of consumers’ low-carbon preference in the retailer-led model is higher than that in the manufacturer-led model, and the cost sharing contract can also amplify the marginal effect of consumers’ low-carbon preference.
Proposition 14. The impact of carbon tax rate on supply chain decisions is as follows:
(i) If
Proof. Taking the first-order partial derivative of
According to conclusions (i) in Proposition 14, when the carbon tax rate is below a certain threshold, the first-order partial derivative of
According to conclusions (ii) to (iii) in Proposition 14, in any model, the first-order derivatives of
5 Numerical simulation
To more intuitively display the impact of consumers’ low-carbon preference and carbon tax rate on supply chain decisions in different models, we will conduct numerical simulations in this section. Due to the difficulty in finding a true and accurate case, this paper will set parameter values based on the conditions in the research hypothesis, which is often used in existing literature (Jiang et al., 2021a; Li et al., 2022; Gong and He, 2023; Zhang and Yu, 2023). According to
5.1 Numerical simulation of the impact of consumers’ low-carbon preference
Assuming the assignment of other parameters remains unchanged, it can be determined that the range of
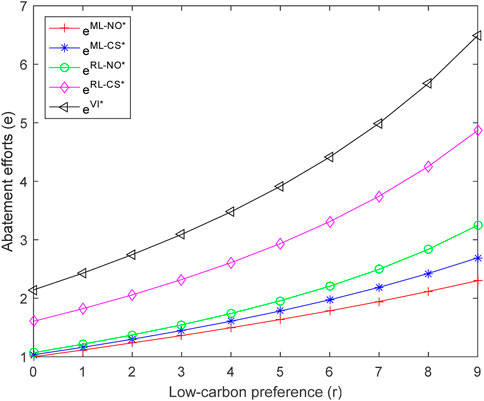
Figure 1. The impact of
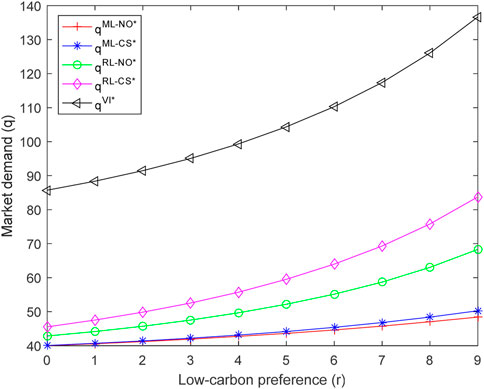
Figure 2. The impact of
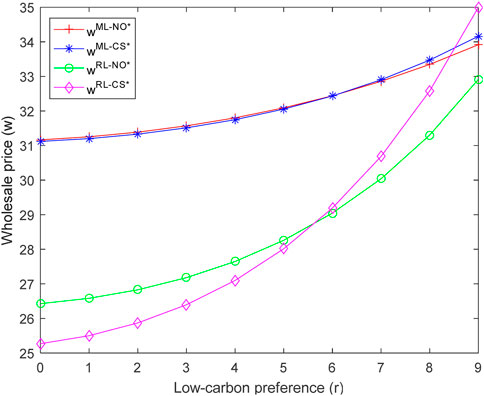
Figure 3. The impact of
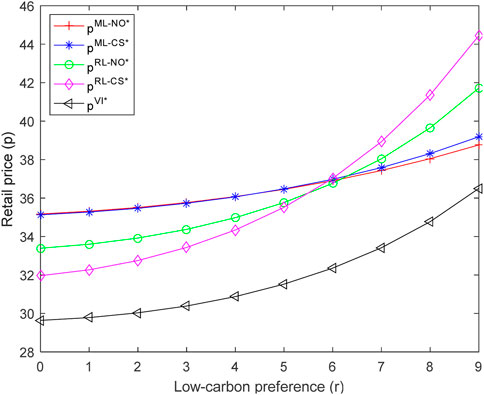
Figure 4. The impact of
From Figures 1, 2, it can be seen that consumers’ low-carbon preference has a similar impact on abatement efforts and market demand. Let’s take Figure 1 as an example for analysis. According to Figure 1, we can see in any model, as consumers’ low-carbon preference increases, the abatement efforts show an increasing trend, and the growth rate becomes faster and faster. Based on the position and shape of each curve, it can be determined that
From Figures 3, 4, we can find that consumers’ low-carbon preference has a similar impact on wholesale and retail price. In any model, both wholesale price and retail price increase with the increase of consumers’ low-carbon preference, and the growth rate becomes faster and faster. The main reason is that when consumers’ low-carbon preference increase, the demand for low-carbon products will also increase, leading to a bidding effect and an increase in wholesale price and retail price. Moreover, due to the exponential growth of abatement costs and production capacity limitation of the manufacturer, the growth rate of wholesale price and retail price is gradually accelerating.
From the comparison of different models, when consumers’ low-carbon preference is low, the wholesale price and retail price in the retailer-led model are lower than those in the manufacturer-led model. When consumers have a greater preference for low-carbon, the situation is exactly the opposite. Similarly, when consumers’ low-carbon preference is low, the wholesale price and retail price in the cost-sharing model are lower than those in the non cost-sharing model, and vice versa. In addition, the retail price in the VI model is the lowest among all models, mainly because integrated decision aims to maximize the total profits, and will choose to obtain greater market demand at a lower price.
5.2 Numerical simulation of the impact of carbon tax rate
Assuming the assignment of other parameters remains unchanged, it can be determined that the range of
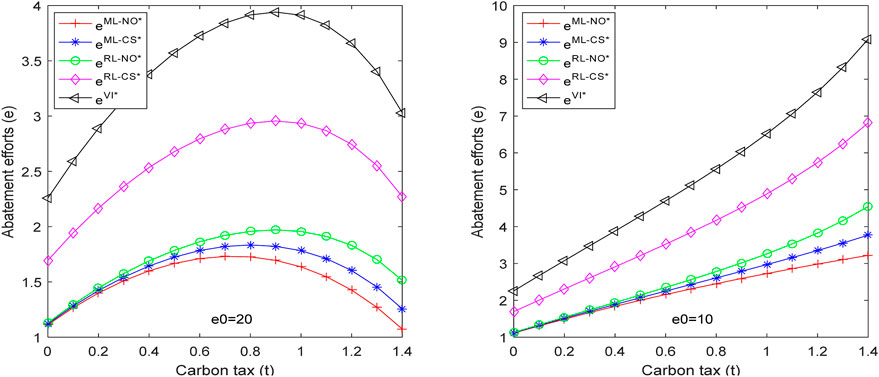
Figure 5. The impact of
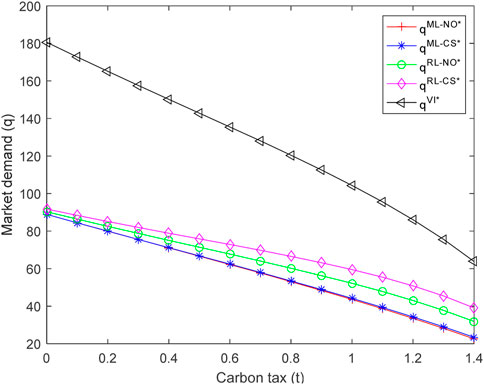
Figure 6. The impact of
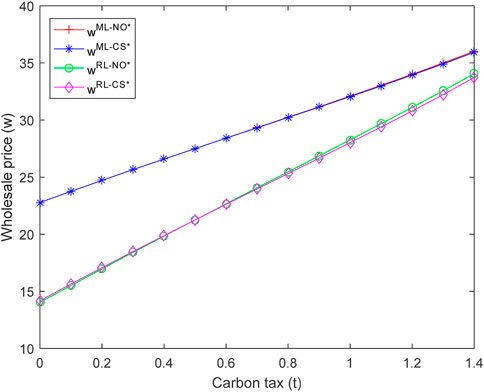
Figure 7. The impact of
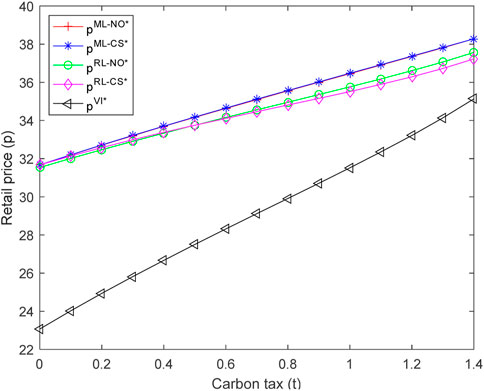
Figure 8. The impact of
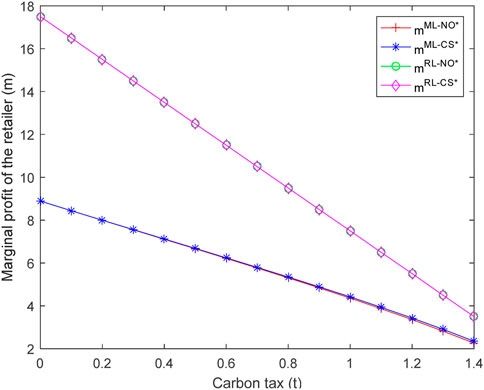
Figure 9. The impact of
According to Figure 5, when the initial carbon emissions per unit product are large (e0 = 20), as the carbon tax rate increases, the abatement efforts of the manufacturer show a trend of first increasing and then decreasing. When the initial carbon emissions per unit product are small (e0 = 10), the abatement efforts of the manufacturer increase with the increase of carbon tax rate. It can be explained as in the early stage of low-carbon transformation, the manufacturer has lower abatement costs, so when carbon tax rate increases, the manufacturer will strengthen its abatement efforts to reduce carbon taxes. With the deepening of low-carbon transformation, the abatement costs of the manufacturer are increasing exponentially and far exceeds the carbon taxes. Therefore, when the carbon tax rate increases, the manufacturer will prefer to bear the carbon taxes and weaken abatement efforts.
From Figures 6–8, it can be seen that as carbon tax rate increases, market demand decreases, while both wholesale price and retail price increase. The main reason is that the increase of carbon tax rate has led to increased operating costs for the manufacturer. In order to ensure its own profits, the manufacturer will pass on some of the costs to the retailer, who will continue to pass on some costs to consumers, resulting in an increase in wholesale price and retail price, further suppressing market demand. Feng et al. (2020) and Li and Wang (2023) hold similar views, believing that carbon tax will cause retail price to rise and lower social welfare.
According to Figure 9, as carbon tax rate increases, the marginal profits of the retailer will decrease. The main reason is that although both wholesale price and retail price increase, the increase in wholesale price exceeds the increase in retail price, leading to a decrease in marginal profits of the retailer. It means that the increased carbon taxes will be shared by the manufacturer, the retailer and consumers. Compared to manufacturer-led model, the marginal profits of the retailer in retailer-led model is higher, which is caused by the leading advantage.
5.3 Impact of consumers’ low-carbon preference and carbon tax rate on supply chain profits
Furthermore, we analyze the impact of simultaneous changes in consumers’ low-carbon preference and carbon tax rate on supply chain profits, and the numerical simulation results are shown in Figures 10–12.
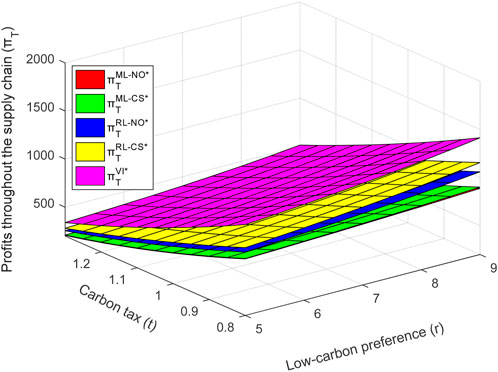
Figure 10. The effect of
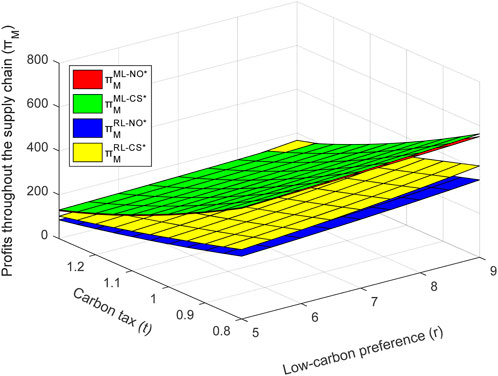
Figure 11. The effect of
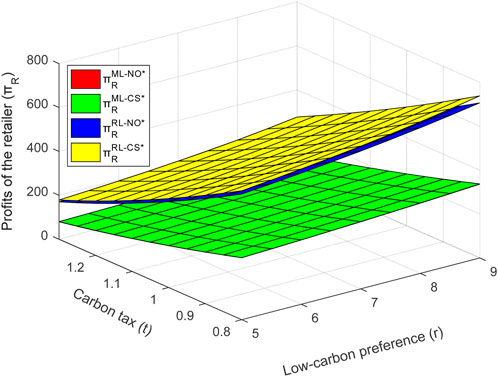
Figure 12. The effect of
From Figures 10–12, we can observe that in any model, as consumers’ low-carbon preference increase, the manufacturer’s profits, the retailer’s profits and total profits will all increase (i.e.,
6 Conclusion and prospect
The main conclusions are as follows:
(1) Promote cooperative decision in the supply chain. This study finds that VI is the most ideal model. In VI model, the optimal abatement efforts, market demand, and total profits are all the largest among all models. When the profit distribution ratio meets certain conditions, the manufacturer and the retailer can form vertical integration and cooperative decision. Moreover, when consumers’ low-carbon preference or carbon tax rate increases, cooperative decision is easier to achieve.
(2) Sign cost sharing contract. This study finds that cost sharing contract can achieve Pareto improvement in both manufacturer-led model and retailer-led model. Moreover, in the retailer-led model, the retailer is willing to bear a higher proportion of abatement costs. Similarly, according to Sharma and Jain (2021) and Li T. et al. (2019), supply chain members can also achieve a “win-win” situation through other contracts, such as revenue sharing contract, two-part pricing contract, etc.
(3) Strengthen consumers’ low-carbon preference. This study finds that consumers’ low-carbon preference can enhance abatement efforts, market demand, and total profits, with marginal effects gradually increasing. Some measures can be adopted to strengthen consumers’ low-carbon preference, such as carbon labeling, carbon credits, and carbon subsidies (Yang and Xu, 2019).
(4) Implement differentiated carbon tax rate. Note that Yu Z. et al. (2023) and Shen et al. (2022) have proposed similar suggestions. This study finds that carbon tax rate provides different abatement incentives for the manufacturer with different initial carbon emissions. For a low carbon emission manufacturer, higher carbon tax rate can be implemented. For a high carbon emission manufacturer, the carbon tax rate should not be too high, and can be incentivized through cap-and-trade system.
It should be pointed out that although this paper has drawn some valuable conclusions, there are still some expandable content. 1) This paper only considers the case of a single cycle and is based on linear demand for research. In the future, we can conduct research based on multi cycle and stochastic demand to verify the robustness of the research results. 2) This paper only studies a two-echelon supply chain comprised of a manufacturer and a retailer. In the future, more complicated supply chain systems, such as three-echelon or even multi-echelon supply chain, can be studied.
Data availability statement
The original contributions presented in the study are included in the article/supplementary material, further inquiries can be directed to the corresponding author.
Author contributions
GL: Conceptualization, Writing–original draft. MJ: Visualization, Writing–review and editing. YY: Methodology, Writing–review and editing. XC: Supervision, Writing–review and editing. DF: Resources, Writing–review and editing.
Funding
The author(s) declare financial support was received for the research, authorship, and/or publication of this article. This research is supported by the National Social Science Foundation of China (No. 22BJY126), and the special project of social science planning of Zhejiang Province “The 20th National Congress of the CPC and the Second Plenary Session of the 15th Zhejiang Provincial Party Committee” (pre approved project).
Acknowledgments
The authors would like to thank the reviewers and the editor for their insightful and constructive comments.
Conflict of interest
The authors declare that the research was conducted in the absence of any commercial or financial relationships that could be construed as a potential conflict of interest.
Publisher’s note
All claims expressed in this article are solely those of the authors and do not necessarily represent those of their affiliated organizations, or those of the publisher, the editors and the reviewers. Any product that may be evaluated in this article, or claim that may be made by its manufacturer, is not guaranteed or endorsed by the publisher.
References
Adekunle, I. A., and Oseni, I. O. (2021). Fuel subsidies and carbon emission: evidence from asymmetric modelling. Environ. Sci. Pollut. Res. 28, 22729–22741. doi:10.1007/s11356-021-12384-0
Bai, Q., Chen, M., and Xu, L. (2017). Revenue and promotional cost-sharing contract versus two-part tariff contract in coordinating sustainable supply chain systems with deteriorating items. Int. J. Prod. Econ. 187, 85–101. doi:10.1016/j.ijpe.2017.02.012
Benjaafar, S., Li, Y., and Daskin, M. (2013). Carbon footprint and the management of supply chains: insights from simple models. IEEE Trans. Automation Sci. Eng. 10 (1), 99–116. doi:10.1109/tase.2012.2203304
Blumberg, G., and Sibilla, M. (2023). A carbon accounting and trading platform for the UK construction industry. Energies 16 (4), 1566. doi:10.3390/en16041566
Chen, X., Wang, X., and Zhou, M. (2019). Firms’ green R&D cooperation behaviour in a supply chain: technological spillover, power and coordination. Int. J. Prod. Econ. 218, 118–134. doi:10.1016/j.ijpe.2019.04.033
Chen, Y., Wang, C., Nie, P., and Chen, Z. r. (2020). A clean innovation comparison between carbon tax and cap-and-trade system. Energy Strategy Rev. 29, 100483. doi:10.1016/j.esr.2020.100483
Cheng, P., Ji, G., Zhang, G., and Shi, Y. (2022). A closed-loop supply chain network considering consumer's low carbon preference and carbon tax under the cap-and-trade regulation. Sustain. Prod. Consum. 29, 614–635. doi:10.1016/j.spc.2021.11.006
Dechezleprêtre, A., Nachtigall, D., and Venmans, F. (2023). The joint impact of the European Union emissions trading system on carbon emissions and economic performance. J. Environ. Econ. Manag. 118, 102758. doi:10.1016/j.jeem.2022.102758
Feng, Y., Shen, J., and Li, X. (2020). Pricing and carbon emission reduction decisions in a supply chain with a risk-averse retailer under carbon tax regulation. Math. Problems Eng. 2020, 1–9. doi:10.1155/2020/5351867
Ghosh, D., and Shah, J. (2012). A comparative analysis of greening policies across supply chain structures. Int. J. Prod. Econ. 135, 568–583. doi:10.1016/j.ijpe.2011.05.027
Ghosh, D., and Shah, J. (2015). Supply chain analysis under green sensitive consumer demand and cost sharing contract. Int. J. Prod. Econ. 164, 319–329. doi:10.1016/j.ijpe.2014.11.005
Gong, Y., and He, G. (2023). Research on low-Carbon strategies of supply chains, considering livestreaming marketing modes and power structures. Processes 11 (5), 1505. doi:10.3390/pr11051505
Guo, J., and Xi, M. (2022). Greening, pricing and marketing coordination for a complex three-level supply chain under the carbon tax in China. IEEE Access 10, 76895–76905. doi:10.1109/access.2022.3192838
Halat, K., Hafezalkotob, A., and Sayadi, M. K. (2021). Cooperative inventory games in multi-echelon supply chains under carbon tax policy: vertical or horizontal? Appl. Math. Model. 99, 166–203. doi:10.1016/j.apm.2021.06.013
Hammami, R., Nouira, I., and Frein, Y. (2018). Effects of customers' environmental awareness and environmental regulations on the emission intensity and price of a product. Decis. Sci. 49 (6), 1116–1155. doi:10.1111/deci.12302
Heydari, J., Govindan, K., and Jafari, A. (2017). Reverse and closed loop supply chain coordination by considering government role. Transp. Res. Part D 52, 379–398. doi:10.1016/j.trd.2017.03.008
Hu, Z., and Wang, S. (2022). An evolutionary game model between governments and manufacturers considering carbon taxes, subsidies, and consumers’ low-carbon preference. Dyn. Games Appl. 12, 513–551. doi:10.1007/s13235-021-00390-3
Huang, F., Hu, H., Song, H., Li, H., Zhang, S., and Zhai, J. (2023). Allocation of the carbon emission abatement target in low carbon supply chain considering power structure. Sustainability 15, 10469. doi:10.3390/su151310469
Huo, H., Liu, H., Bao, X., and Cui, W. (2022). Game analysis of supply chain enterprises' choice of carbon emission reduction behavior under environmental regulation and consumers' low carbon preference. Discrete Dyn. Nat. Soc. 2022, 3013289. doi:10.1155/2022/3013289
IEA (2023). Global CO2 emissions rose less than initially feared in 2022 as clean energy growth offset much of the impact of greater coal and oil use. Available at: https://www.iea.org/news.
Ji, J., and Huang, J. (2022). Research on single/cooperative emission reduction strategy under different power structures. Environ. Sci. Pollut. Res. Int. 29 (36), 55213–55234. doi:10.1007/s11356-022-19603-2
Ji, T., Xu, X., Yan, X., and Yu, Y. (2020). The production decisions and cap setting with wholesale price and revenue sharing contracts under cap-and-trade regulation. Int. J. Prod. Res. 58 (1), 128–147. doi:10.1080/00207543.2019.1641239
Jiang, W., Liu, M., Gan, L., and Wang, C. (2021b). Optimal pricing, ordering, and coordination for prefabricated building supply chain with power structure and flexible cap-and-trade. Mathematics 9, 2426. doi:10.3390/math9192426
Jiang, W., Pu, L., Huang, T., Yuan, L., and Gan, L. (2021a). The effect of fairness concern on carbon emission reduction and revenue distribution in construction supply chain: power structure perspective. Discrete Dyn. Nat. Soc. 2021, 1–20. doi:10.1155/2021/8118220
Kouvelis, P., and Zhao, W. (2015). Supply chain contract design under financial constraints and bankruptcy costs. Manag. Sci. 62 (8), 2341–2357. doi:10.1287/mnsc.2015.2248
Krass, D., Nedorezov, T., and Ovchinnikov, A. (2013). Environmental taxes and the choice of green technology. Prod. Operations Manag. 22 (5), 1035–1055. doi:10.1111/poms.12023
Leroutier, M. (2022). Carbon pricing and power sector decarbonization: evidence from the UK. J. Environ. Econ. Manag. 111, 102580. doi:10.1016/j.jeem.2021.102580
Li, C., Gao, J., Guo, J., and Wang, J. (2022). Low-carbon supply chain decisions considering carbon emissions right pledge financing in different power structures. Energies 15, 5721. doi:10.3390/en15155721
Li, H., Wang, C., Shang, M., Ou, W., and Qin, X. (2019a). Cooperative decision in a closed-loop supply chain considering carbon emission reduction and low-carbon promotion. Environ. Prog. and Sustain. Energy 38 (1), 143–153. doi:10.1002/ep.13092
Li, J., and Gong, S. (2020). Coordination of closed-loop supply chain with dual-source supply and low-carbon concern. Complexity 2020, 7506791–7506814. doi:10.1155/2020/7506791
Li, T., Zhang, R., Zhao, S., and Liu, B. (2019b). Low carbon strategy analysis under revenue-sharing and cost-sharing contracts. J. Clean. Prod. 212, 1462–1477. doi:10.1016/j.jclepro.2018.11.282
Li, Y., and Wang, J. (2023). Pricing strategy and social welfare in a supply chain with different rights structure under carbon tax policy. IEEE Access 11, 65105–65116. doi:10.1109/access.2023.3277631
Li, Z., Pan, Y., Yang, W., Ma, J., and Zhou, M. (2021). Effects of government subsidies on green technology investment and green marketing coordination of supply chain under the cap-and-trade mechanism. Energy Econ. 101, 105426. doi:10.1016/j.eneco.2021.105426
Liu, B., Li, T., and Sai, S. B. (2017). Low carbon strategy analysis of competing supply chains with different power structures. Sustainability 9, 835. doi:10.3390/su9050835
Liu, M., Li, Z., Anwar, S., and Zhang, Y. (2021). Supply chain carbon emission reductions and coordination when consumers have a strong preference for low-carbon products. Environ. Sci. Pollut. Res. 28, 19969–19983. doi:10.1007/s11356-020-09608-0
Lukas, E., and Welling, A. (2014). Timing and economic efficiency of climate-friendly investments in supply chains. Eur. J. Operational Res. 233 (2), 448–457. doi:10.1016/j.ejor.2013.03.017
Ma, X., Ho, W., Ji, P., and Talluri, S. (2018). Contract design with information asymmetry in a supply chain under an emissions trading mechanism. Decis. Sci. 49 (1), 121–153. doi:10.1111/deci.12265
Majumdar, A., Singh, S. P., Jessica, J., and Agarwal, A. (2023). Network design for a decarbonised supply chain considering cap-and-trade policy of carbon emissions. Ann. Operations Res. doi:10.1007/s10479-023-05481-5
Mantovani, A., and Vergari, C. (2017). Environmental vs hedonic quality: which policy can help in lowering pollution emissions? Environ. Dev. Econ. 22 (3), 274–304. doi:10.1017/s1355770x16000371
Masood, E., Tollefson, J., and Irwin, A. (2022). COP27 climate talks: what succeeded, what failed and what’s next. Nature 612, 16–17. doi:10.1038/d41586-022-03807-0
Meng, C., Zhang, R., and Liu, B. (2022). Energy performance contracting in a supply chain under cap-and-trade regulation and carbon tax policy. Int. Trans. Electr. Energy Syst. 2022, 1–10. doi:10.1155/2022/1716380
Mishra, M., Hota, S. K., Ghosh, S. K., and Sarkar, B. (2020). Controlling waste and carbon emission for a sustainable closed-loop supply chain management under a cap-and-trade strategy. Mathematics 8 (4), 466. doi:10.3390/math8040466
Peng, H., Pang, T., and Cong, J. (2018). Coordination contracts for a supply chain with yield uncertainty and low-carbon preference. J. Clean. Prod. 205, 291–302. doi:10.1016/j.jclepro.2018.09.038
Peng, Q., Wang, C., and Xu, L. (2020). Emission abatement and procurement strategies in a low-carbon supply chain with option contracts under stochastic demand. Comput. and Industrial Eng. 144, 106502. doi:10.1016/j.cie.2020.106502
Qu, S., Yang, H., and Ji, Y. (2021). Low-carbon supply chain optimization considering warranty period and carbon emission reduction level under cap-and-trade regulation. Environ. Dev. Sustain. 23, 18040–18067. doi:10.1007/s10668-021-01427-8
Sharma, A., and Jain, D. (2021). Game theoretic analysis of green supply chain under cost-sharing contract with fairness concerns. Int. game theory Rev. 23 (2), 2050017. doi:10.1142/s0219198920500176
Shen, L., Lin, F., and Cheng, T. C. E. (2022). Low-carbon transition models of high carbon supply chains under the mixed carbon cap-and-trade and carbon tax policy in the carbon neutrality era. Int. J. Environ. Res. Public Health 19 (18), 11150. doi:10.3390/ijerph191811150
Sun, H., and Yang, J. (2021). Optimal decisions for competitive manufacturers under carbon tax and cap-and-trade policies. Comput. and Industrial Eng. 156, 107244. doi:10.1016/j.cie.2021.107244
Sun, J., Yang, L., Shao, T., and Yao, F. (2023). Modelling low-carbon closed-loop supply chain considering channel power structures and cross-shareholding. RAIRO Operations Res. 57, 609–629. doi:10.1051/ro/2023002
Swami, S., and Shah, J. (2013). Channel coordination in green supply chain management. J. Operational Res. Soc. 64 (3), 336–351. doi:10.1057/jors.2012.44
Taleizadeh, A. A., Alizadeh-Basban, N., and Niaki, S. T. A. (2019). A closed-loop supply chain considering carbon reduction, quality improvement effort, and return policy under two remanufacturing scenarios. J. Clean. Prod. 232, 1230–1250. doi:10.1016/j.jclepro.2019.05.372
Taleizadeh, A. A., Alizadeh-Basban, N., and Sarker, B. R. (2018). Coordinated contracts in a two-echelon green supply chain considering pricing strategy. Comput. and Industrial Eng. 124, 249–275. doi:10.1016/j.cie.2018.07.024
Wang, J. C., Wang, Y. Y., and Lai, F. (2019). Impact of power structure on supply chain performance and consumer surplus. Int. Trans. Operational Res. 26 (5), 1752–1785. doi:10.1111/itor.12466
Wang, Y., Xu, X., and Zhu, Q. (2021). Carbon emission reduction decisions of supply chain members under cap-and-trade regulations:a differential game analysis. Comput. and Industrial Eng. 162, 107711. doi:10.1016/j.cie.2021.107711
Wu, H., Sun, Y., Su, Y., Chen, M., Zhao, H., and Li, Q. (2022). Which is the best supply chain policy: carbon tax, or a low-carbon subsidy? Sustainability 14 (10), 6312. doi:10.3390/su14106312
Xia, L., Kong, Q., Li, Y., and Qin, J. (2023). Effect of equity holding on a supply chain’s pricing and emission reduction decisions considering information sharing. Ann. operations Res. 329, 619–656. doi:10.1007/s10479-021-03930-7
Xiao, X., Zhu, Z., Fu, Z., Mu, W., and Zhang, X. (2018). Carbon footprint constrained profit maximization of table grapes cold chain. Agronomy 8 (7), 125. doi:10.3390/agronomy8070125
Yang, Y., and Xu, X. (2019). A differential game model for closed-loop supply chain participants under carbon emission permits. Comput. and Industrial Eng. 135, 1077–1090. doi:10.1016/j.cie.2019.03.049
Yu, L., Sun, J., Liu, W., Zhang, W., and Wu, J. (2023b). Policy analysis of biomass recycling supply chain considering carbon and pollution emission reduction-Taking China's straw subsidy policy for example. Systems 11 (7), 343. doi:10.3390/systems11070343
Yu, Z., Lin, Y., Wang, Y., and Goh, M. (2023a). Closed-loop supply chain coalitional cooperation and coordination under differentiated carbon tax regulation. J. Clean. Prod. 392, 136239. doi:10.1016/j.jclepro.2023.136239
Yuan, X., Bi, G., Li, H., and Zhang, B. (2022). Stackelberg equilibrium strategies and coordination of a low-carbon supply chain with a risk-averse retailer. Int. Trans. Operational Res. 29 (6), 3681–3711. doi:10.1111/itor.13140
Zhang, C., Liu, Y., and Han, G. (2021). Two-stage pricing strategies of a dual-channel supply chain considering public green preference. Comput. and Industrial Eng. 151, 106988. doi:10.1016/j.cie.2020.106988
Zhang, S., Wang, C., Yu, C., and Ren, Y. (2019). Governmental cap regulation and manufacturer’s low carbon strategy in a supply chain with different power structures. Comput. and Industrial Eng. 134, 27–36. doi:10.1016/j.cie.2019.05.026
Zhang, Z., and Yu, L. (2023). Dynamic decision-making and coordination of low-carbon closed-loop supply chain considering different power structures and government double subsidy. Clean Technol. Environ. Policy 25, 143–171. doi:10.1007/s10098-022-02394-y
Keywords: supply chain carbon abatement, power structure, consumers’ low-carbon preference, carbon tax policy, cost allocation contract
Citation: Li G, Jiang M, Yuan Y, Chen X and Fu D (2024) Supply chain carbon abatement under different power structures: impact of consumers’ low-carbon preference and carbon tax policy. Front. Environ. Sci. 12:1376970. doi: 10.3389/fenvs.2024.1376970
Received: 29 January 2024; Accepted: 23 August 2024;
Published: 13 September 2024.
Edited by:
Baogui Xin, Shandong University of Science and Technology, ChinaReviewed by:
Biswajit Sarkar, Yonsei University, Republic of KoreaChih-Te Yang, Tamkang University, Taiwan
Copyright © 2024 Li, Jiang, Yuan, Chen and Fu. This is an open-access article distributed under the terms of the Creative Commons Attribution License (CC BY). The use, distribution or reproduction in other forums is permitted, provided the original author(s) and the copyright owner(s) are credited and that the original publication in this journal is cited, in accordance with accepted academic practice. No use, distribution or reproduction is permitted which does not comply with these terms.
*Correspondence: Guozhi Li, MjAyMDA2OTdAd3p1LmVkdS5jbg==