 Robin van der Ploeg1*
 Martin Haigh2
- 1Shell Global Solutions International B.V., Amsterdam, Netherlands
- 2Shell International Limited, London, United Kingdom
Nature-based solutions (NBS), in the form of active ecosystem conservation, restoration and improved land management, represent a pathway to accelerate net-zero emissions (NZE) strategies and support biodiversity. Meaningful implementation and successful accounting depend on the ability to differentiate between anthropogenic and natural carbon fluxes on land. The United Nations Framework Convention on Climate Change (UNFCCC) land carbon accounting methods currently incorporate all CO2 fluxes on managed land in country inventories without distinguishing between anthropogenic and natural components. Meanwhile, natural land carbon sinks are modelled by earth system models but are mostly reported at global level. Here we present a simple yet novel methodology to estimate the present and future progression of natural land sinks at the country and regional level. Forests dominate the uptake of CO2 on land and as such, our analysis is based on allocating global projections of the natural land carbon flux to individual countries using a compilation of forest land areas for a historic and scenario range spanning 1960–2100. Specifically, we use MIT’s carbon cycle model simulations that are set in the context of emissions pathways from the Shell Energy Security Scenarios (2023). Our natural land carbon flux estimates for individual countries and regions such as the European Union (EU) show generally good agreement with independent estimates from recent land-use harmonisation studies for 2000–2020. Hence, our approach may also provide a simple, first-order exploration of future natural land fluxes at country level—a potential that other studies do not yet offer. In turn, this enables better understanding of the anthropogenic and natural components contributing to country NZE targets under different scenarios. Nevertheless, our findings also suggest that models such as the Shell World Energy Model (WEM) would benefit from further improvements in the apportionment of land carbon sources and sinks to evaluate detailed actions to meet country targets. More importantly, uncertainties remain regarding the resilience of land ecosystems and their capacity to store increasing amounts of carbon under progressive global warming. Therefore, we recommend that the carbon cycle modelling and energy modelling research communities continue to collaborate to develop a next generation of relevant data products to distinguish anthropogenic from natural impacts at local, regional and national levels.
1 Introduction
Anthropogenic carbon emissions have increased atmospheric CO2 concentrations from ∼277 ppm in 1760 to ∼412 ppm in 2020 (Friedlingstein et al., 2022). At present, the natural land and ocean carbon sinks respectively remove ∼29% and ∼26% of anthropogenic CO2 emissions, leaving the remaining ∼46% to accumulate in the atmosphere (Friedlingstein et al., 2022). As such, these natural carbon sinks mitigate the rate of greenhouse gas-driven climate change. Increasing CO2 concentrations have been attributed as the leading driver of this land carbon sink through a mechanism known as CO2 fertilisation (Ruehr et al., 2023), but other global change factors, including land-use change and recovery, nutrient cycles and climate change, all have confounding effects on land ecosystem carbon storage (Keenan and Williams, 2018; Denning, 2022). Given the increasing importance of land-based climate mitigation in country policies (Roe et al., 2019; Roe et al., 2021), particularly for low-emissions pathways (Hasegawa et al., 2021), it is crucial to develop an understanding of the Earth system dynamics involved, the spatiotemporal scales at which they operate, and the associated uncertainties and knowledge gaps (Denning, 2022; Mo et al., 2023). Furthermore, the resilience of land carbon sinks under progressive global warming is important in the context of tipping points in the Earth System (Duffy et al., 2021; Ritchie et al., 2021), especially in temperature overshoot scenarios.
Good model representation of natural land fluxes at the regional and country level is thus key for the evaluation of country progress towards net-zero emissions climate targets and the associated contributions from energy and land. Earth system models (ESMs) with a terrestrial biosphere component and dynamic global vegetation models (DGVMs) are generally best equipped to simulate the future responses of land ecosystem productivity to global change perturbations. However, these models currently do not resolve future changes in natural land fluxes very well at the regional level and models may even disagree on the sign of change for large parts of the world depending on the emissions pathways used to drive the simulations (Canadell et al., 2021). Furthermore, the land carbon accounting methods from the United Nations Framework Convention on Climate Change (UNFCCC), which countries use in their national greenhouse gas inventories (NGHGIs), were shown to be not fully consistent with estimates from integrated assessment models (IAMs) because of conceptual and methodological differences (Grassi et al., 2017; Grassi et al., 2018). Specifically, country reports count all CO2 emissions and removals on managed land as anthropogenic, without distinguishing between direct effects (land use and land use change) and indirect effects (human-induced environmental change including, e.g., CO2 fertilisation), whereas IAMs count indirect anthropogenic effects towards natural emissions and removals. Recent studies have tried to reconcile these model-based and report-based differences through a series of forest-based land adjustments, in which indirect fluxes due to environmental change on managed lands are reclassified from natural to anthropogenic (Grassi et al., 2021). This approach was able to effectively reduce the model-report gaps both at the global level (Grassi et al., 2021) and even at the country level for selected countries (Schwingshackl et al., 2022; Grassi et al., 2023), although the latter remains limited to recent history. Similarly, this adjustment approach also shows promise for improving the global alignment between NGHGIs and future mitigation pathways as assessed by the Intergovernmental Panel on Climate Change (IPCC) (Gidden et al., 2023).
Here, we aim to augment these efforts by presenting a simple but effective methodology that allows both past and future estimates of the global natural land sink from ESMs to be allocated to regional and country levels of interest, using averaged natural land fluxes and a compilation of country forest land areas. This methodology was developed in the context of the new Shell Energy Security Scenarios (Shell, 2023), in which the relevant representations of the carbon cycle and land use have been aligned as best as possible with both historical data from the Global Carbon Project (Friedlingstein et al., 2022) and future projections from MIT’s earth systems model (Sokolov et al., 2018) based on the narratives prescribed by the Shell Scenarios pathways. Our forest-based approach allows for a direct comparison of all anthropogenic land fluxes (including both land-use emissions and nature-based solutions; NBS) and natural land fluxes on a like-for-like basis for all 234 countries included in the Shell Scenarios modelling workflow and can be deepened or adapted for other purposes.
2 Literature review
Summarised below are selected findings from recent land carbon literature that provide context for the analysis presented in this paper. This section may be of particular interest for a diverse, general readership.
2.1 The terrestrial carbon cycle
Carbon in terrestrial ecosystems is stored in multiple forms, most notably in vegetation above ground, in soils and in permafrost. Over the 2013–2023 period, global vegetation is estimated to contain about 450 Gt C, whereas permafrost contains 1,400 Gt C and soils contain up to 1700 Gt C (Friedlingstein et al., 2023). For comparison, the atmosphere presently holds 875 Gt C and estimated fossil reserves for gas, oil and coal combined are 905 Gt C (Friedlingstein et al., 2023). Photosynthesis and respiration are the two main processes that control the exchange of carbon between the atmosphere and the biosphere. Within the biosphere, a series of interactions between autotrophic and heterotrophic organisms results in further cycling of organic and inorganic carbon across various food levels and ecosystems. Although the carbon fluxes associated with photosynthesis and respiration are approximately in balance at the global scale [∼130 Gt C/year; (Friedlingstein et al., 2023)], the amount of carbon stored in the biosphere grows and shrinks over a range of timescales, from daily and seasonal cycles to inter-annual variability over decades or longer. Some of this terrestrial carbon is sequestered on timescales of centuries to millennia, after which it can eventually be respired or transferred to the geological carbon cycle for burial and storage over millions of years. Given the relative sizes of the various terrestrial carbon reservoirs and differences in their permanence, even slight changes in the amount of carbon stored in soils could have an impact on global atmospheric CO2 concentrations (Longbottom et al., 2022). At the same time, this implies that strategies aimed at enhancing land carbon storage should focus comprehensively on both vegetation and soils to successfully combat climate change.
Historically, the land carbon reservoir has been considered distinct from the ocean carbon reservoir, with rivers acting as a pathway between the two. However, it has become increasingly clear that there is no clear divide between these reservoirs and that in reality they are connected across the land-to-ocean aquatic continuum [LOAC; (Regnier et al., 2022)]. In this updated continuum view, it becomes apparent that there are two additional short-range loops that carry carbon from land ecosystems to inland waters and from tidal wetlands to the open ocean. The analysis by Regnier et al. (2022) shows that while the majority of the carbon that is fixed by “terra firme” ecosystems becomes part of vegetation and soil carbon stocks, the rest is leached into the LOAC loops and is either outgassed back to the atmosphere or subsequently stored in sediments and the ocean. In future studies of carbon budgets, such evolving insights could result in a different apportionment between land and ocean sinks. However, because the sedimentary and oceanic reservoirs are more stable carbon repositories than biomass and soil carbon, these findings might be beneficial for carbon sequestration in the longer term.
There are four main groups of processes that control the strength of the present-day land carbon sink (Keenan and Williams, 2018; and references therein): 1) direct climate effects through changes in precipitation and temperature (e.g., Jung et al., 2017); 2) atmospheric composition effects such as CO2 fertilisation and nutrient deposition (e.g., Keenan et al., 2023); 3) land-use change effects including deforestation, reforestation and agricultural management practices (e.g., Yue et al., 2020); and 4) natural disturbance effects from storms, wildfires and pests (e.g., Walker et al., 2019). If any of these processes change over time, land carbon fluxes can change significantly. Notably, increased carbon sequestration on land is generally thought to be beneficial for land-based ecosystems because it promotes soil health (Keenan and Williams, 2018). This contrasts with the impacts of the increasing ocean carbon sink, which are unequivocally negative for marine ecosystems, leading to reduced metabolic rates in marine organisms and widespread coral bleaching caused by ocean acidification (Hughes et al., 2018).
2.2 Quantification of carbon fluxes
The terrestrial carbon sink would be most accurately quantified by considering the net ecosystem carbon balance (NECB) at the scale of interest (Chapin et al., 2006). This balance encompasses net ecosystem production (NEP), defined as gross primary productivity (GPP) minus ecosystem respiration (RE), discounted for additional carbon losses through fire, land-use change emissions and transfer to aquatic ecosystems. However, NECB is difficult to quantify and the conceptual separation between direct and indirect anthropogenic influences on natural ecosystems poses additional problems. As a result, most studies focus on a metric known as the residual land carbon sink, which is estimated by mass balance as the residual of all anthropogenic emissions minus the oceanic sink and atmospheric CO2 growth. Consequently, the uncertainties associated with the residual land carbon sink are relatively large. This methodology is also employed by the Global Carbon Project and subsequently compared to mean estimates from an ensemble of process-based DGVMs (Friedlingstein et al., 2023).
Data is obtained from a large and increasingly advanced range of technologies, including satellite and near-surface remote sensing methods, distributed and coordinated measurement networks, repeated national inventories, atmospheric observations, inversion capabilities and new modelling strategies (Keenan and Williams, 2018). The eddy-covariance technique is an atmospheric measurement technique that is used for direct, high-frequency measurements of the exchange of carbon, water and energy between ecosystems and the atmosphere, and is particularly important because it has the potential to reduce gaps between field observations, remote sensing and models (Upton et al., 2024).
2.3 Drivers of land carbon change
2.3.1 CO2 fertilisation effect
Elevated atmospheric CO2 concentrations are shown to result in increased photosynthesis in many environments, with the potential to increase the total amount of carbon stored in organic matter at the ecosystem scale on decadal to centennial timescales (Canadell et al., 2021). This has led scientists to propose the “CO2 fertilisation hypothesis,” in which photosynthesis responds to increasing CO2 and acts as a negative feedback mechanism to atmospheric CO2 growth (see Walker et al., 2021 and references therein). For this hypothesis to be valid, net ecosystem production must be positive on global scales, i.e., gross primary production must exceed the sum of respiration and other losses.
The size of the CO2-driven increase in land carbon storage and the associated predictive understanding of this process has long remained elusive due to a range of study methods and contrasting outcomes (Walker et al., 2021). Part of the problem is that the size of this global photosynthesis flux cannot be observed directly—instead, it must be estimated by terrestrial biosphere models, predicted from indirect satellite measurements or inferred from proxies (e.g., ice core records of carbonyl sulphide, deuterium isotopomers in plants and seasonal changes in atmospheric CO2). A recent study (Keenan et al., 2023) was able to partially resolve the wide range of estimates of historic global changes in photosynthesis by extracting an emerging constraint from an ensemble of models.
2.3.2 Temperature and tipping points
Increasing temperature has a negative effect on the strength of the land carbon sink (Penuelas et al., 2017). Over the past 20–30 years, the sensitivity of the land carbon sink to CO2 has been much stronger than to temperature (Fernández-Martínez et al., 2018), leading to an overall positive effect—but this could deteriorate in the future under sustained warming. In particular, tipping points in the Earth System involving the biosphere may lead to a reduction or even a reversal of the land carbon sink in critical regions such as the Amazon basin (Gatti et al., 2021). A new synthesis suggests that global warming beyond 1.5 °C could already trigger multiple climate tipping points, although the thresholds of biosphere-related tipping points varies substantially between regions depending on the ecosystems and processes involved (Armstrong McKay et al., 2022).
Furthermore, a recent study (Duffy et al., 2021) constructed temperature response curves for global land carbon uptake using a large-scale carbon flux monitoring network and found that the temperature limit for global photosynthesis in the warmest quarter of the year has already been reached in the past decade. This suggests that further warming may lead to a sharp decline in photosynthesis and an increase in respiration on global scales, for instance through forest dieback. Forest dieback is an example of a fast-onset tipping element compared to, e.g., ice sheet melt, which means that forests are relatively resistant to slow and sustained warming but much more vulnerable to rapid and extreme warming, even if both scenarios would eventually converge at the same temperature. This highlights the importance of timescales and the distinction between fast-onset and slow-onset tipping points in future pathways (Ritchie et al., 2021), particularly when overshoot scenarios are considered.
3 Materials and methods
3.1 Model context
The global carbon cycle and climate evaluations of the Shell Energy Security Scenarios (Shell, 2023) performed by the MIT Joint Program on the Science and Policy of Global Change (Sokolov et al., 2023) are used as the starting point of this analysis. The full narratives for the Archipelagos and Sky 2050 scenarios including all aspects of global change are described in detail in the associated publication (Shell, 2023). In short, the Sky 2050 scenario explores economic development and transformation of the energy system in line with a global CO2 NZE target by 2050, whereas the Archipelagos scenario is less far-reaching because of short-term geopolitical tensions and security imperatives. Climate model simulations of these scenarios are run on the MIT Integrated Global System Model (IGSM), of which the MIT Earth System Model (MESM) is part (Sokolov et al., 2018). This modelling framework was also used to assess the carbon cycle and climate implications of the Shell Energy Transformation Scenarios Waves, Islands and Sky 1.5 (Paltsev et al., 2021). In addition, the MIT IGSM has been used in a dedicated study to explore land-use competition under 1.5 °C climate stabilisation for the Sky 2050 scenario (Gurgel et al., 2024).
Earth system parameters included in the climate evaluation of these Shell scenarios are modelled from 1850 to 2100 and are reported at the global level; the relevant carbon cycle parameters include atmospheric CO2 concentrations (in ppm), anthropogenic carbon emissions from fossil fuels, industrial processes and land-use, respectively, and carbon uptake by the land and ocean through natural sinks, respectively (all in Gt C yr-1). Although the land and ocean components of the MESM simulate processes at a resolution of several degrees latitude and longitude (Sokolov et al., 2018), the current model design does not allow for a breakdown and reporting of these carbon cycle fluxes at the country level. Rather than performing additional simulations with other ESMs, we set out to design a simple but effective method to spatially allocate the global natural land sink as modelled by the MESM for use in the Shell World Energy Model (WEM) framework. Hence, the first step in our analysis is identifying the relevant ecosystem processes and data types that would help us to derive averaged natural land fluxes and spatially allocate them in a meaningful way.
3.2 Forests as a proxy for natural land sink allocation
Globally, terrestrial biomass (defined as above-ground and below-ground, including shallow soils) occurs primarily in forest, grassland and peatland ecosystems, with a comparatively small fraction residing in mangroves, seagrasses and marshes. Forests have a typical carbon density of approximately 200–250 t C ha−1, which is intermediate between grasslands (50–100 t C ha−1) and peatlands (500 t C ha−1) (Goldstein et al., 2020). Notably, forests represent ∼61% of all land ecosystems with terrestrial biomass by area and ∼70% by global carbon stocks (Goldstein et al., 2020) (Figure 1). Grasslands have the second-largest areal extent of land ecosystems (∼29%) but have small global carbon stocks by comparison (∼8%), whereas peatlands represent only a small fraction (∼9%) of land ecosystems by area but have substantial global carbon stocks (∼20%) (Goldstein et al., 2020). Carbon cycling across all these ecosystems has been extensively studied, but peatland areal extent has not been mapped to the same extent as forests and grasslands owing to inherent difficulties in observation (Crezee et al., 2022). Modelling studies with DGVMs estimate that forests contributed as much as 81% to the global natural land sink in recent history (Friedlingstein et al., 2022; Schwingshackl et al., 2022). Moreover, the IPCC writes in AR6 WG1 Chapter 5 that, although uncertain, future land carbon sinks are primarily expected to occur in regions with present-day forests (Canadell et al., 2021). Taken together, these lines of evidence would indeed suggest that forest ecosystems are a solid first-order candidate for exploratory natural land sink allocation across the world, but we also explore the effects that an alternative allocation based on peatlands would have on our analysis.
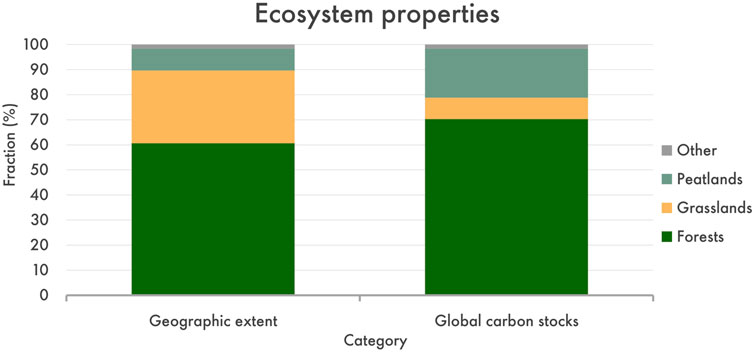
Figure 1. Geographic extent and global carbon stocks of major terrestrial ecosystems. Adapted from data reported in Goldstein et al. (2020).
3.3 Forest land area data compilation
As a first step, we compiled a forest land cover dataset as a proxy for natural land sink allocation. For recent historical years (1990–2020), we use forest land data sourced from the Food and Agriculture Organisation of the United Nations (FAO) and Global Forest Watch. The FAO dataset is valuable because it has comprehensive coverage of forest land areas and other forest resource parameters for virtually all countries and regions worldwide, assessed in a consistent and transparent reporting process. However, the FAO dataset is updated every 5 years only, its temporal coverage is limited to the 1990–2020 period and a few small countries and regions do not have data entries. By contrast, the Global Forest Watch dataset offers real-time high-resolution forest cover data since the year 2000, based in part on Landsat satellite observations at 30-metre resolution (Hansen et al., 2013). An alternative data resource that could be explored is the LUH2 dataset (Hurtt et al., 2020), which presents harmonised land-use data for the 850–2100 period at a resolution of 0.25° × 0.25° for use in climate model simulations but requires detailed expertise and processing to unlock beyond the global aggregate values. Considering that our study is aimed primarily at understanding country-level changes, we consider the FAO database to be the most pragmatic point of departure. According to the FAO database, global total forest land cover in 2020 was approximately 4,060 Mha of which primary forest cover was approximately 1,280 Mha, respectively equivalent to 38% and 12% of all habitable land (10,600 Mha). We prefer total forest land cover as the method to allocate the natural land sink, but we also discuss the potential implications of using only primary forest land cover.
Primary forests generally have a higher ecosystem integrity than non-primary forests, and have a larger carbon carrying capacity for a given forest ecosystem type (Keith et al., 2024). In this context, depending on the collective land-use histories and the potential differences therein between countries and regions, it may be better to view primary forests as forests that display a high level of maturity with many old-growth characteristics, rather than forests that have never been impacted by human disturbance (Keith et al., 2024). Although primary forests clearly account for a much smaller land fraction than total forest land, a natural land sink allocation method based on primary forests would minimise the chance of including managed forest lands in the allocation, because carbon fluxes on managed lands should, in principle, be reported as gross sources and sinks in anthropogenic land-use emissions instead of being counted towards the natural sinks (Grassi et al., 2018; Grassi et al., 2021). Using only primary forests for allocation would further allow us more clearly to set the natural sink apart from NBS potentials at the country level, as primary forests can be protected from deforestation through an NBS avoidance pathway but they cannot be targeted for enhanced carbon uptake through an NBS sequestration pathway. Ultimately, the quality of such an analysis depends on how gross sources and sinks are accounted for, either on the anthropogenic side or on the natural side, and how consistent this approach is between countries (Keith et al., 2021).
3.3.1 Country forest land areas for 1990–2020
In the FAO annual forest land cover database, total forest land areas are available from 1990 to 2020 and primary forest land areas are available from 1990 to 2017. This database was accessed via https://www.fao.org/faostat/en/#data/ and data were last downloaded on 27 September 2022 using the following filters: Countries = ALL; Elements = Area; Items = Primary Forest, Forest Land; Years = 1961–2020. Total forest land data could be successfully extracted from the FAO database for 230 out of 234 countries and regions included in the Shell energy modelling workflow using their corresponding ISO3 codes. Data for the remaining 4 countries and regions were added manually from Global Forest Watch (Hong Kong, Macau and Kosovo) or from the literature (Taiwan) (Tsai, 2020). Primary forest land data had additional data gaps for the following countries and regions: Curaçao, Sint Maarten, Monaco and the Vatican. All countries and regions were assigned a dominant ecosystem classification (boreal, temperate or tropical) based on their prevailing climate regimes. Next, reported forest land cover data were extrapolated outside of the reported FAO range (1990–2020) to cover the full historical and scenario range from 1960 to 2100. A summary of our methods and assumptions is given in Table 1 and explained in detail in the subsequent sections.
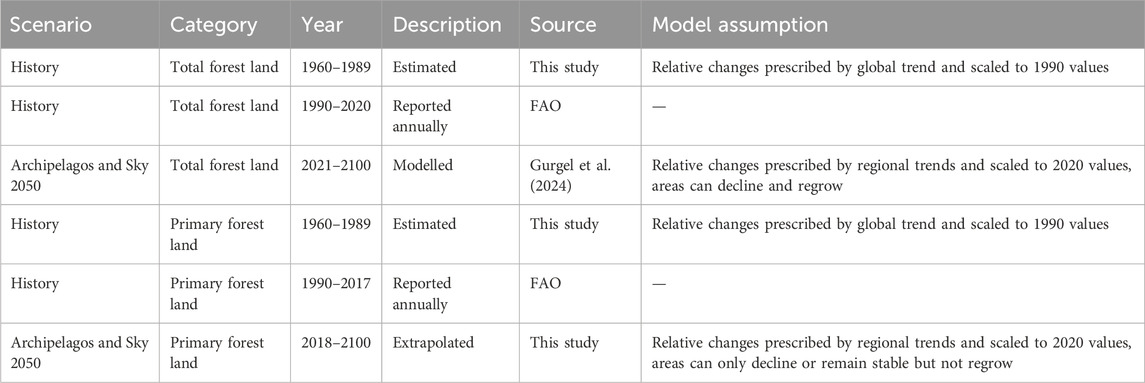
Table 1. Data and logic applied for compilation and extrapolation of individual country total forest land areas.
3.3.2 Country forest land areas for 2020–2100
For the years 2020–2100, we use forest land areas that were modelled with the MIT IGSM specifically for the Sky 2050 scenario (Gurgel et al., 2024) and are therefore consistent with the climate model simulations of Sokolov et al. (2023). The estimated evolution of forest land areas in Sky 2050 (Gurgel et al., 2024) was obtained for the 18 model regions of the global economy included in the MIT IGSM (Chen et al., 2016). All 234 countries and regions included in the Shell WEM were mapped to their corresponding MIT IGSM model regions, after which future changes in forest land areas were prescribed for all individual countries based on the relative changes occurring in their respective model regions. By design of the MIT IGSM, large countries that are modelled individually (e.g., Brazil and India) have unique timeseries of forest land areas, whereas countries that are modelled as part of an aggregate model region (e.g., Europe or Africa) have shared timeseries of forest land areas. Because of small offsets in absolute values of land areas between the FAO data and the data used by Gurgel et al. (2024), all future changes for 2020–2100 were normalised to the year 2020 (the last historical year with reported FAO data) as a model baseline. We apply this approach to both total forest areas and primary forest areas, with the distinction that total forest areas are allowed to regrow over time according to the outcomes of Gurgel et al. (2024) for each region, whereas primary forest areas are conservatively only allowed to decline or remain stable but not regrow.
Given the scope of the study by Gurgel et al. (2024), the future evolution of forest land areas was only modelled for Sky 2050 and not for Archipelagos. Hence, for simplicity we set the country-level forest land area datasets of Archipelagos to be identical to those of Sky 2050. We consider this approach a reasonable compromise for the purpose of natural land sink allocation because both scenarios invoke minimal global reductions in future forest land cover, despite their different land-use narratives. Moreover, using a shared country forest land area dataset for both scenarios allows for a better comparison of the first-order differences in carbon cycle impacts between the scenarios that were collectively modelled in the MESM. However, additional country-level complexity could be added in future revisions of our forest land area data compilation, for instance based on the presence or absence of NBS avoidance pathways for forest protection and differences in the phasing of deforestation, as well as NBS sequestration pathways for reforestation—all depending on the scenarios used. Examples of compiled total forest land areas for the eight largest countries are shown in Figure 2.
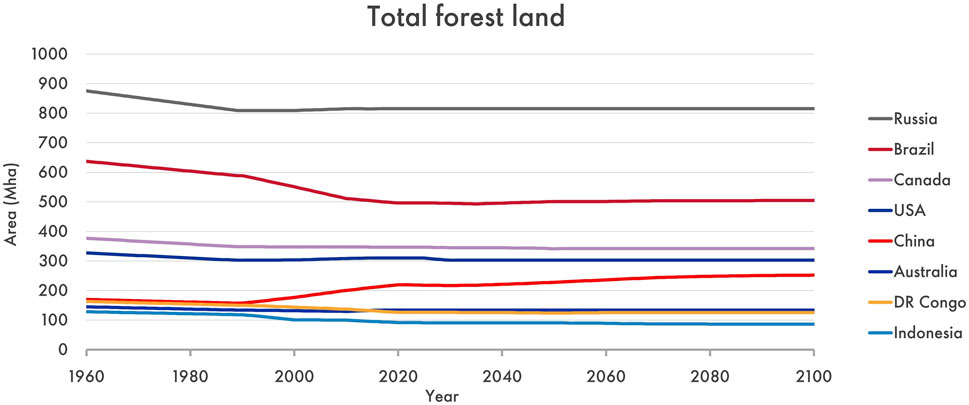
Figure 2. Model timeseries of total forest land cover for the top eight countries, representing ∼63% of the global total in 2020.
3.3.3 Country forest land areas for 1960–1990
For the years 1960–1990, forest land areas for individual countries and regions are not accessible at the same level of quality as for the more recent historical period of 1990–2020. Consequently, for simplicity, we prescribed the forest land areas in all countries and regions to follow the same trends for 1960–1990 as the global forest land area timeseries that is available from Our World in Data. The history of primary forest cover is less well constrained than for total forest cover, but at the global level the fraction of primary forest relative to total forest appears to be stable at ∼0.31 across all years for which the FAO report overlapping data. This fraction also appears to be broadly consistent with the harmonised forest areas presented in the LUH2 dataset of Hurtt et al. (2020) for the 1960–1990 period. Hence, we used this fraction of ∼0.31 to derive global primary forest land areas from global total forest land areas for 1960–1990, assuming this fraction has stayed constant through time. The complete timeseries for global primary and total forest land areas for 1960-2100 are shown in Figure 3.
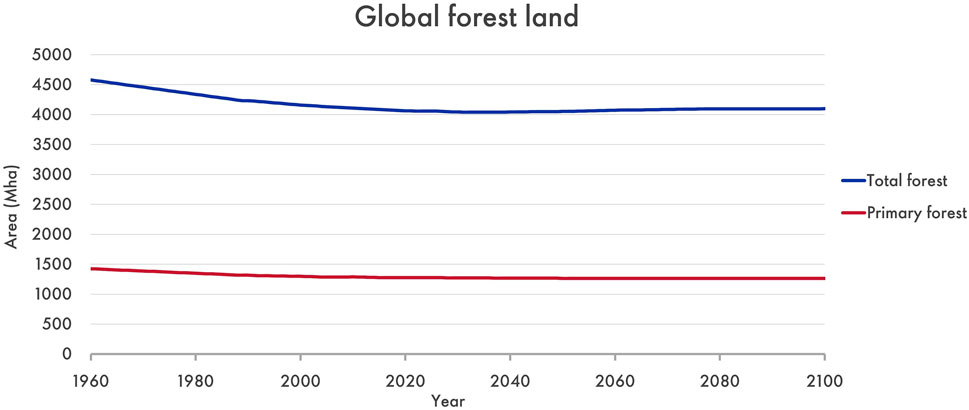
Figure 3. Model timeseries of global total forest (blue) and primary forest (red) land cover for the full historic and scenario range of 1960–2100. The timeseries used for Sky 2050 and Archipelagos are identical.
3.4 Averaged natural land fluxes for 1960–2100
Forest land areas from all individual countries and regions were summed in order to obtain an internally consistent timeseries of global forest land areas for the full historical and scenario range of 1960–2100. Next, MIT’s model timeseries for global natural land fluxes in Archipelagos and Sky 2050 were divided by the respective timeseries of global forest land areas to obtain averaged natural land fluxes, first for the baseline year 2020 and subsequently for the two scenarios from 1960 to 2100 (Figure 4). For the year 2020, using a global natural land sink of ∼5,790 Mt CO2 (Sokolov et al., 2023), we calculated an averaged natural land flux of −1.4 t CO2 ha−1 yr−1 based on total forest land and −4.5 t CO2 ha−1 yr−1 based on primary forest land. Because the same global sink value is distributed over land areas of different sizes depending on the allocation method, the averaged fluxes based on total forest land are approximately one-third of the averaged fluxes based on primary forest land. Interestingly, we note that the baseline values of the averaged fluxes using primary forest allocation match well with carbon flux estimates for mature forests on the ecosystem level (Anderson-Teixeira et al., 2021; Table 2). However, because total forest land is representative of a much larger land surface area and data is available for a substantially higher number of countries, we favour that allocation method. It also aligns better with estimates in mainly developed countries with little to no primary forest remaining but demonstrating net natural land carbon uptake today, such as in the European Union (EU). For most countries that have both primary forest and total forest data, there is also a fairly good correlation between the two, suggesting that the allocation method does not impact the overall land sink estimates at the country level too much. Lastly, we combine the calculated, averaged natural land fluxes with forest land areas per country to generate country-specific timeseries of natural land sinks for all countries in the WEM for Archipelagos and Sky 2050.
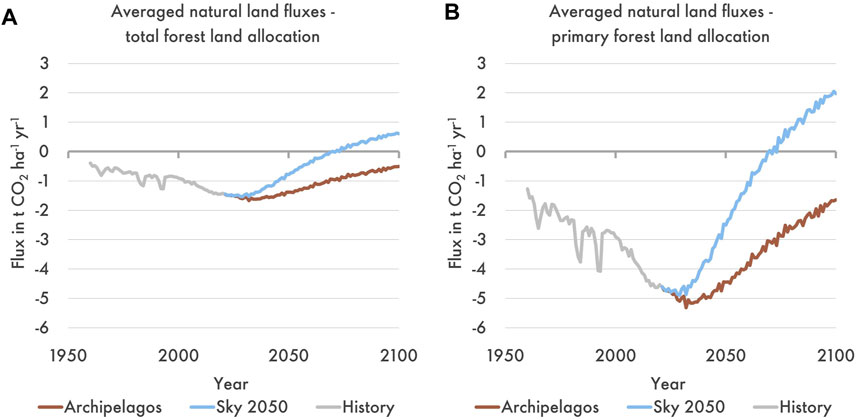
Figure 4. Averaged natural land fluxes (in t CO2 ha−1 yr−1) for Archipelagos and Sky 2050 using total forest land allocation (A) and primary forest land allocation (B). Flux is relative to the atmosphere, so that a negative sign represents a net sink and a positive sign represents a net source.
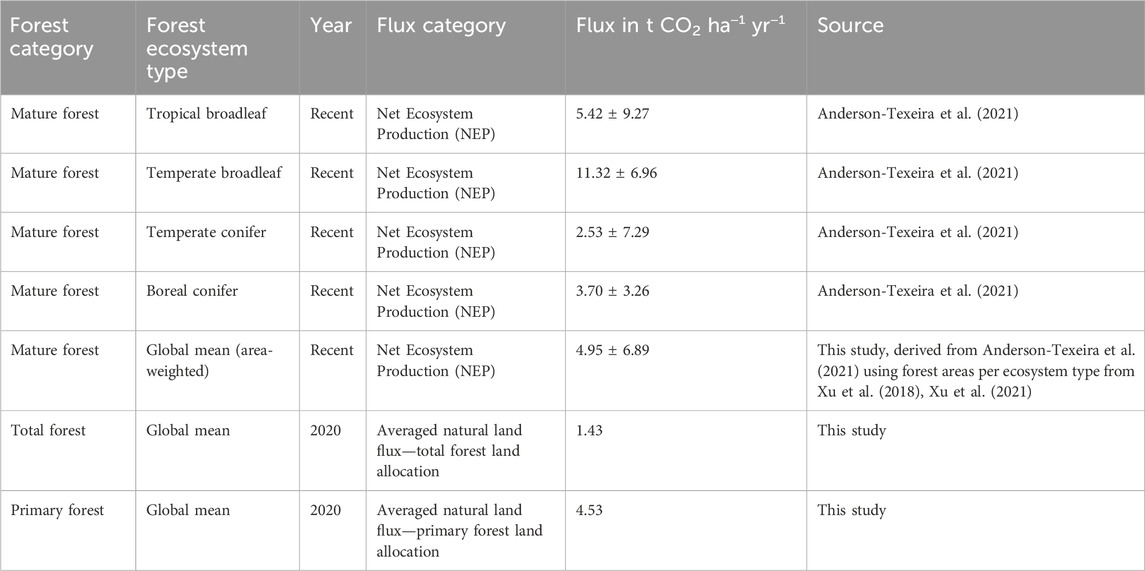
Table 2. Overview of carbon flux estimates for global mature forests per ecosystem type adapted from data reported in Anderson-Teixeira et al. (2021) and comparison to the averaged natural land sinks presented here.
3.5 Method sensitivities and limitations
We performed a sensitivity analysis to see if distributing the natural land sink based on peatlands would result in a different outcome compared to using forest land. Peatland areas were compiled for as many countries as possible from the literature (Page et al., 2011; Gumbricht et al., 2017; Xu et al., 2018; Crezee et al., 2022), but peatland cover data is significantly sparser than forest cover data. We find that peatland allocation would produce relatively similar results for most countries, as countries with a higher share of forest land typically also have a higher share of peatlands (Figure 5). The two main exceptions to this relationship are Canada and Russia, which harbour a disproportionately large fraction of global peatlands. However, because of their large country and forest land areas, these countries would receive a sizeable share of the natural land sinks in any case. Although peatland extent in tropical countries may not be fully mapped, it is encouraging for the validation of the method that countries such as the Democratic Republic of the Congo and Indonesia plot relatively close to the 1:1 relationship.
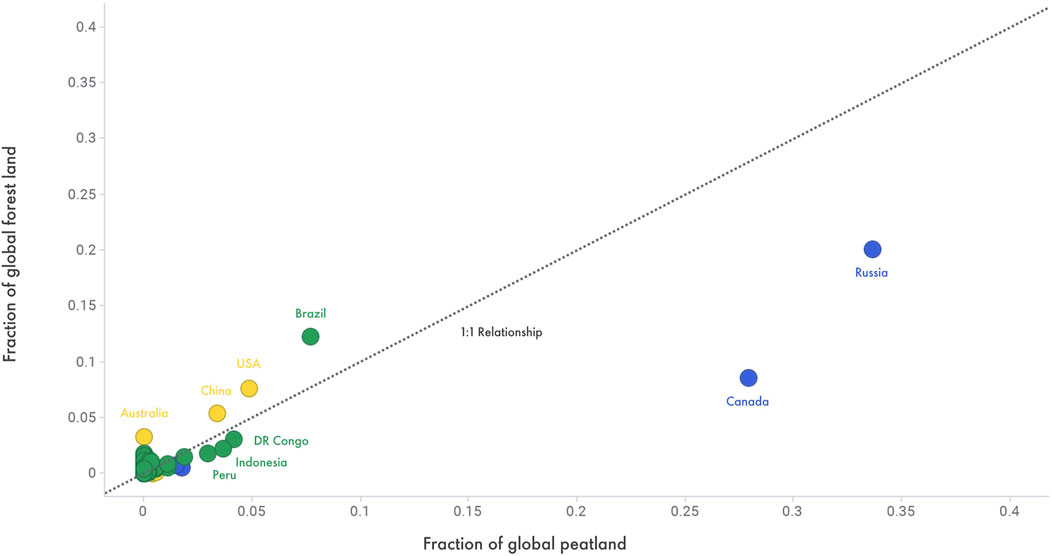
Figure 5. Comparison of country fractions of global peatland versus country fractions of global total forest land.
We note that our methods are inherently simplified, because we assume that a single flux value can be used to represent carbon sinks in boreal, temperate and tropical forests. However, at first order, this appears to be consistent with a global forest ecosystem review that did not find significant differences in net ecosystem production in mature forests between boreal, temperate and tropical biomes (Anderson-Teixeira et al., 2021; Table 2). Secondly, our method implies that all countries with total forest cover will have a net natural land flux of the same sign and same direction of change as the modelled global natural land flux for any given year. By extension, this also means that countries without present-day forest cover will have a natural land sink equal to 0 for all model years. (Note, however, that if the country undertakes NBS, then the CO2 impact will be accounted for in the anthropogenic land-use timeseries of the Shell WEM). Although there is growing evidence that the direction of change in natural land sinks will vary between regions (Canadell et al., 2021; Fernández-Martinez et al., 2023), for instance sinks in the tropics are predicted to diminish whereas sinks in the high-latitudes are predicted to grow—here we maintain the assumption of a uniform evolution of the natural land sink so as to stay consistent with the global aggregate values as modelled by MIT (Sokolov et al., 2023). Consequently, our approach may lead to an overestimation of future natural land sinks in tropical countries and an underestimation of future natural land sinks in boreal countries. Going forward, our analysis could be expanded to better represent such regional differences and their driving mechanisms in a more advanced model context. In any case, we see our dataset as a contribution to an increasingly important research area for both the carbon cycle modelling and energy system modelling research communities and thus we recommend that these communities continue to collaborate to further advance similar data products.
4 Results and discussion
4.1 Scenario outcomes for natural land fluxes
The main trends we observe in our averaged natural land sinks for Archipelagos and Sky 2050 (Figure 4) are inherited directly from the respective trends at the global level (Shell, 2023). As such, only key aspects relating to land use emissions and natural land sinks are described here. In Sky 2050, as a result of concerted action to follow through on the Glasgow Deforestation Pledge to halt global deforestation by 2023 (Reference), land-use emissions decrease rapidly through a combination of NBS avoidance and sequestration pathways, followed by global total land-use CO2 emissions reaching net-zero around 2030, and subsequently becoming net-negative. As atmospheric CO2 growth slows and levels off, the figure for the natural land carbon sink reaches a plateau by ∼2030 and then starts to gradually decline. At the global level, MIT’s modelling shows that the natural land sink would be expected to transition to a net source by ∼2070 because of sustained net-negative emissions and a reversal of the biosphere buffering capacity, as carbon in natural forests is rereleased to the atmosphere—the unwinding of the CO2 fertilisation effect. This implies that by 2100, negative anthropogenic land-use emissions will be partially offset by positive emissions from natural land ecosystems. Conversely, in Archipelagos, land-use emissions become negative at a slower pace, but total anthropogenic CO2 emissions never reach net-zero. As a result, enhanced and prolonged atmospheric CO2 growth yields a stronger natural land sink until ∼2040 and natural land ecosystems are not expected to become a net source of CO2 by 2100 at the global level.
Our new dataset allows for the evaluation of natural land sinks between different scenarios for any region of interest, or between different countries or regions in a single scenario (Figures 6, 7; Supplementary Data S1, S2). In our analysis, the natural land sink is dominated by a small number of large countries: Russia, Brazil, Canada, United States and China together account for approximately 54% of the global value because of their equally large share in total forest land area.
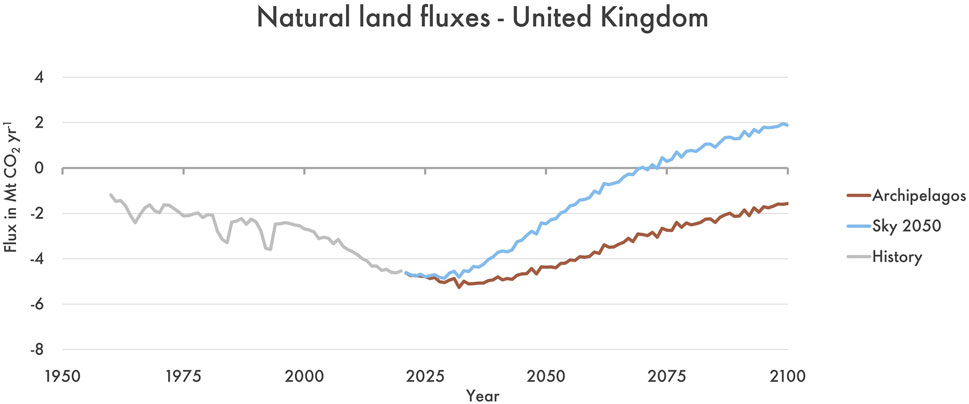
Figure 6. Modelled natural land fluxes (in Mt CO2 yr−1) for the United Kingdom in Archipelagos and Sky 2050 using total forest land allocation.
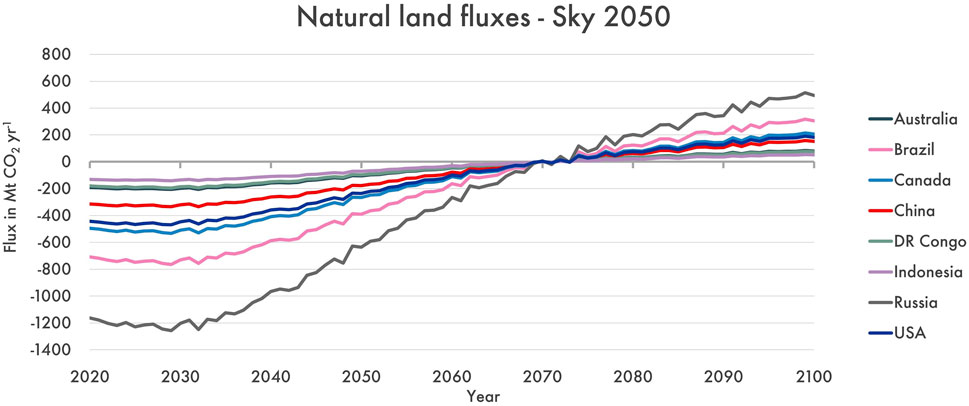
Figure 7. Modelled natural land fluxes (in Mt CO2 yr−1) for the top eight countries in Sky 2050 using total forest land allocation.
4.2 Integration of anthropogenic and natural land fluxes
With a full representation of natural land fluxes at the country level in the WEM, we are now able to compare the evolution of anthropogenic land-use emissions, including NBS pathways, with natural land sinks on spatial and temporal scales of interest and between scenarios. This allows us to compare our modelled results with the emissions that individual countries report, for instance as part of their National Greenhouse Gas Inventories (NGHGIs), as well as their land-based carbon sequestration targets in the years leading up to achieving net-zero emissions. We demonstrate this by adding up the anthropogenic land-use emissions and the natural land sinks to arrive at a total net land flux for each country in the WEM, which we then compare to individual country entries for historic emissions as compiled by the land-use flux harmonisation study of Grassi et al. (2023). Based on averages for the period of 2000–2020 for which both studies overlap, we find a generally good match between natural land fluxes allocated using our methodology and the natural land fluxes estimated from an ensemble of DGVMs as presented in Grassi et al. (2023) (Figures 8, 9). This comparison suggests that our approach may work well for boreal and temperate countries, but we observe an apparent underestimation of natural land fluxes in many tropical countries (e.g., DR Congo, Indonesia and Angola, but notably excluding Brazil). This could point to additional non-forest land carbon sinks in tropical countries that we currently do not account for in our simple modelling workflow. Nevertheless, the overall agreement is encouraging and suggests that our method may indeed be valuable for exploration of future natural land fluxes at country level.
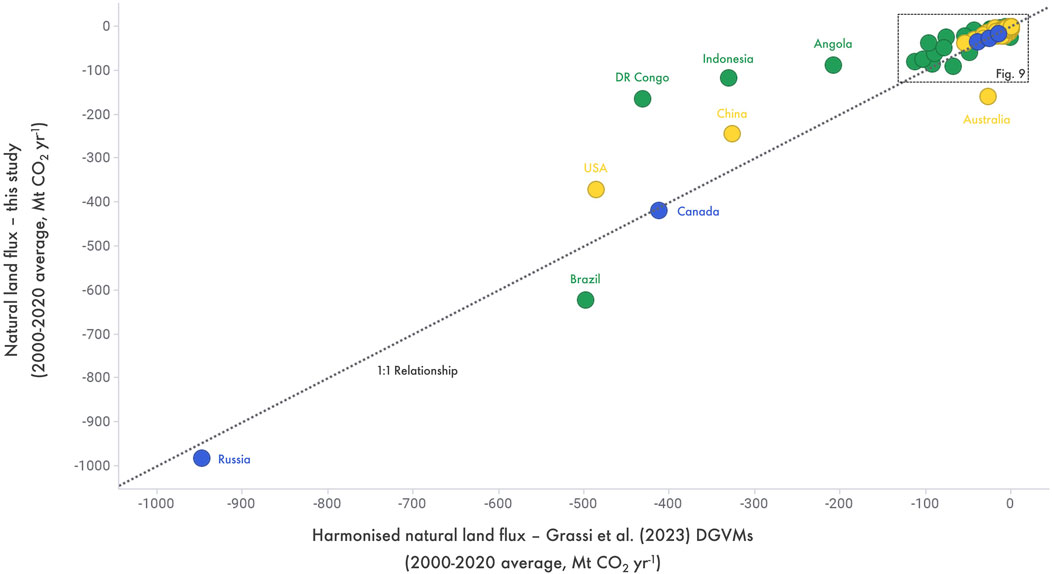
Figure 8. Comparison of natural land fluxes for individual countries as modelled in the Shell scenarios and as reported in the land-use flux harmonisation study of Grassi et al. (2023), based on averages for the 2000–2020 period. All units are in Mt CO2 yr−1. Colours represent the dominant ecosystem classification for each country (green = tropical, yellow = temperate, blue = boreal). The black line represents a 1:1 relationship, which would represent a perfect calibration. Data points in the dashed rectangle are shown in Figure 9 at higher resolution.
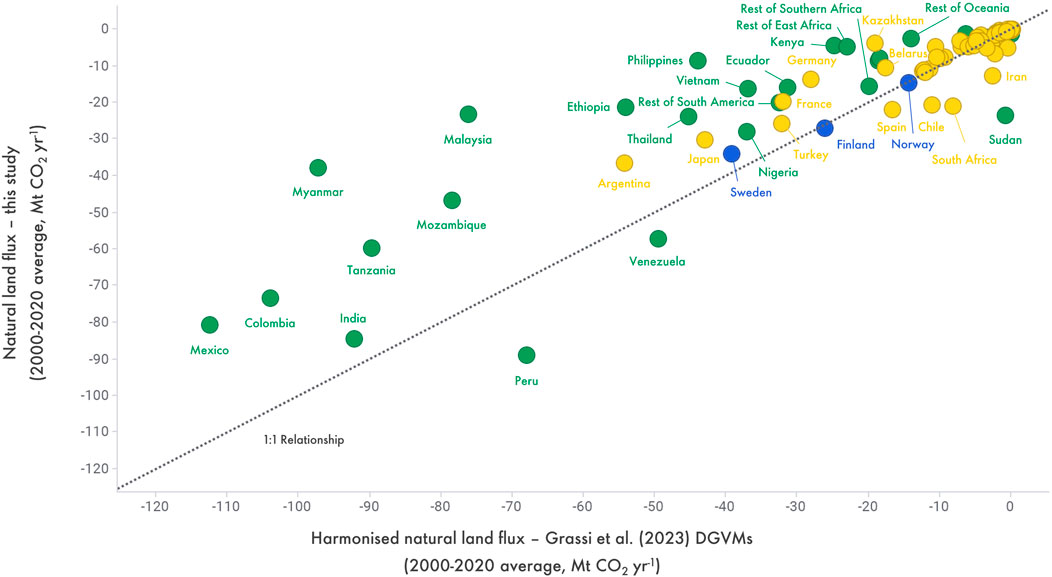
Figure 9. Comparison of natural land fluxes for individual countries as modelled in the Shell scenarios and as reported in the land-use flux harmonisation study of Grassi et al. (2023), based on averages for the 2000–2020 period. All units are in Mt CO2 yr−1. Colours represent the dominant ecosystem classification (green = tropical, yellow = temperate, blue = boreal). The black line represents a 1:1 relationship, which would represent a perfect calibration. Data are identical to Figure 8, but axes are adjusted for visual clarity.
We find that our combined estimates of net anthropogenic and natural land emissions also display a reasonable agreement with the available land-use harmonisation estimates (Figures 10, 11). Here we specifically compare our net land fluxes with the summed flux estimates of bookkeeping models (BMs) and DGVMs for non-intact forests of Grassi et al. (2023), the modelling metric that is thought to be most compatible to country NGHGI reporting. In our analysis, we find a moderately good agreement between both data sources for the largest countries (Figure 10), but for many smaller countries we observe that our methodology results in slightly higher net land fluxes compared to the estimates of Grassi et al. (2023) (Figure 11). Below we specifically discuss the example of the European Union (EU) in more detail.
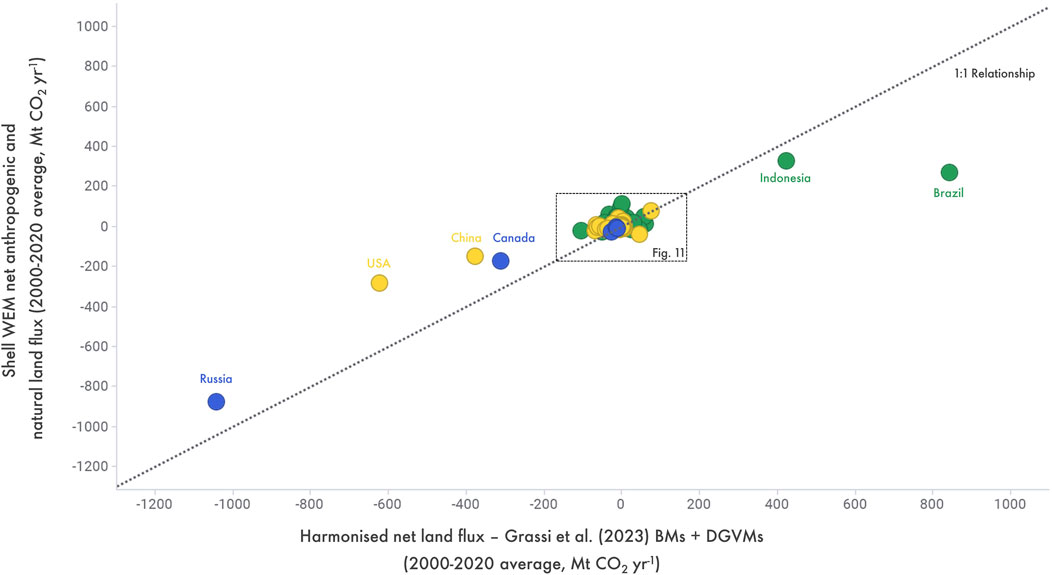
Figure 10. Comparison of net land carbon fluxes for individual countries as modelled in the Shell scenarios and as reported in the land-use flux harmonisation study of Grassi et al. (2023), based on averages for the 2000–2020 period. All units are in Mt CO2 yr−1. Colours represent the dominant ecosystem classification for each country (green = tropical, yellow = temperate, blue = boreal). The black line represents a 1:1 relationship, which would represent a perfect calibration. Data points in the dashed rectangle are shown in Figure 11 at higher resolution.
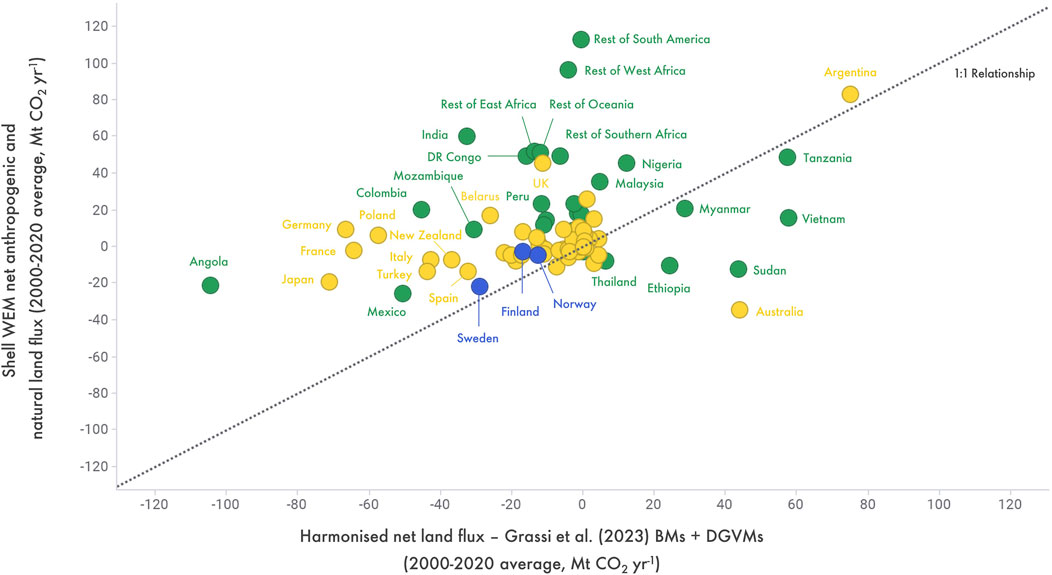
Figure 11. Comparison of net land carbon fluxes for individual countries as modelled in the Shell scenarios and as reported in the land-use flux harmonisation study of Grassi et al. (2023), based on averages for the 2000–2020 period. All units are in Mt CO2 yr−1. Colours represent the dominant ecosystem classification for each country (green = tropical, yellow = temperate, blue = boreal). The black line represents a 1:1 relationship, which would represent a perfect calibration. Data are identical to Figure 10, but axes are adjusted for visual clarity.
The EU report a value of −250 Mt CO2 yr−1 for land-use, land-use change and forestry (LULUCF) emissions for the year 2020 (Grassi et al., 2023). Because this is a negative number, the LULUCF sector is already considered as a net land carbon sink for the EU. By 2030, the EU have the ambition to further increase the magnitude of this net land carbon sink to −310 Mt CO2 yr−1 through NBS (Reference), although this is lower than the 2000–2020 average value of −320 Mt CO2 yr−1 (Grassi et al., 2023). By contrast, the land-use emissions for the EU as estimated in Shell modelling of anthropogenic land-use emissions are +121 Mt CO2 yr−1 in 2020 and +10 Mt CO2 yr−1 in 2030 (based on Sky 2050). Notably, these are positive values as they are based only on the anthropogenic components of land-use emissions estimates, whereas the reported EU numbers include both anthropogenic and natural components. We note that the 2020 values of the natural land flux estimates are strikingly similar between both methods [−227 Mt CO2 yr−1 in our analysis and −251 Mt CO2 yr−1 in Grassi et al. (2023)]. This also makes sense conceptually because the two approaches are both forest-based and considering that virtually all forests in the EU can be classified as non-intact. Hence, inclusion of the natural land sink estimates presented here should allow for a more consistent comparison of the two datasets. Our net land fluxes, i.e., the sum of anthropogenic and natural sources and sinks, are estimated at −106 Mt CO2 yr−1 in 2020 and −226 Mt CO2 yr−1 in 2030 at the EU level (Table 3). As such, our net land fluxes for the year 2020 differ substantially from the BMs + DGVMs estimate in Grassi et al. (2023), which is potentially because the apportionment of world land-use emissions in the Shell WEM, which is based on avoidance potentials across NBS types, gives significant land-use emissions in the blue carbon and wetland categories for its model baseline, whereas the EU report negligible numbers for these categories. Yet, for 2020, our net land estimates of −106 Mt CO2 yr−1 appear to be closer to the actual LULUCF fluxes reported in the NGHGIs (−250 Mt CO2 yr−1) than those compiled in Grassi et al. (2023) (−446 Mt CO2 yr−1). This improvement could be a coincidence owing to the various uncertainties and methodological differences, and our estimate is still a factor of 2x different from the NGHGI reporting. However, it suggests that our methodology may indeed be effective for the integrated evaluation of land carbon sources and sinks in the context of country-specific NZE targets, particularly if the anthropogenic land-use emissions apportionment in the Shell WEM can also be further improved going forward.
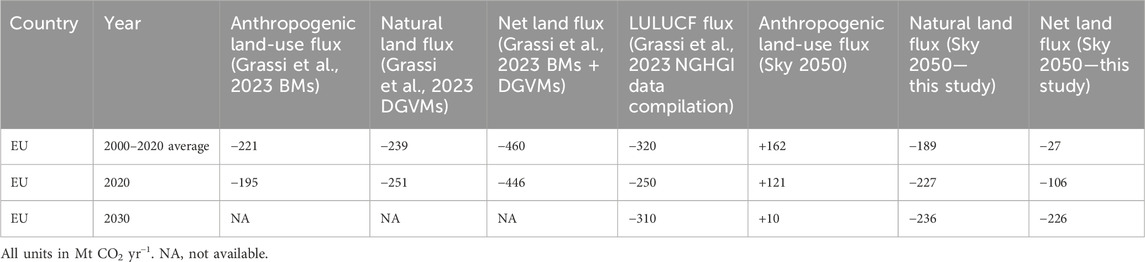
Table 3. Comparison of land carbon fluxes as reported in land-use flux harmonisation study of Grassi et al. (2023) and as modelled by the Shell scenarios for the European Union (EU).
4.3 Outlook for policymakers
To the best of our knowledge, there are no other data products available that allow countries to track their land carbon ambitions with such a first-order evaluation of future natural land flux trends at their respective level. Hence, we see the ability to be able to explore future natural land carbon scenarios as the largest added value for policymakers. Our methodology could also be easily adapted for scenarios developed by other parties or institutes because our approach based on forest land area effectively allocates global projections from earth system model simulations to regions of interest. More generally, our analysis speaks to the role of land in NZE target definitions and whether the NZE scope should include anthropogenic and/or natural land-based carbon removals. The meaning of NZE as a concept is actively being debated at the interface of academia, policy and business, and the exact definitions of NZE targets have important implications for their effectiveness in addressing the causes and consequences of climate change (Fankhauser et al., 2021; Rogelj et al., 2021; Allen et al., 2022). In Article 4 of the Paris Agreement, all parties aim “… to achieve a balance between anthropogenic emissions by sources and removals by sinks of greenhouse gases …”. We note that this ambition only covers anthropogenic fluxes and does not consider natural land sinks. Based on our results and in line with global carbon budget studies we argue that carbon accounting methods for NZE targets should differentiate effectively between anthropogenic and natural effects where possible, to avoid the potential for entities to wrongly claim natural removals as if they were achieved through anthropogenic actions, for instance through NBS. Most NGHGIs cannot fully separate human-induced and natural effects, so it is imperative that pragmatic advances are being made to reconcile different methodologies and provide more complete and transparent reporting (Grassi et al., 2023). Distinguishing between anthropogenic and natural land contributions to land fluxes would also eliminate the risk of inconsistencies across countries in classification of land as “managed” for NGHGI accounting. In our analysis of the Energy Security Scenarios (Shell, 2023), we find that if natural land sinks were allowed to be included in a global NZE target for CO2, this would accelerate the time needed to reach global NZE by approximately 2 years compared to only counting anthropogenic emissions and removals (total fluxes from energy, anthropogenic land and industrial process combined) (Figure 12). In other words, inclusion of natural land fluxes in the NZE definition in Sky 2050 would result in reaching global NZE by 2048 instead of 2050, which is not a trivial difference. This outcome is consistent with previous work (Gidden et al., 2023). Similarly, NZE for all greenhouse gases would be reached 2–3 years earlier if natural land fluxes were to be included in that NZE definition. In any case, we argue that land-based carbon removals have an important role to play in NZE ambitions. However, whilst reaching NZE is a highly worthwhile—and highly challenging—pursuit in its own right, it should not be forgotten that sustaining net-negative emissions would be the ambition for at least the second half of this century from a planetary sustainability perspective.
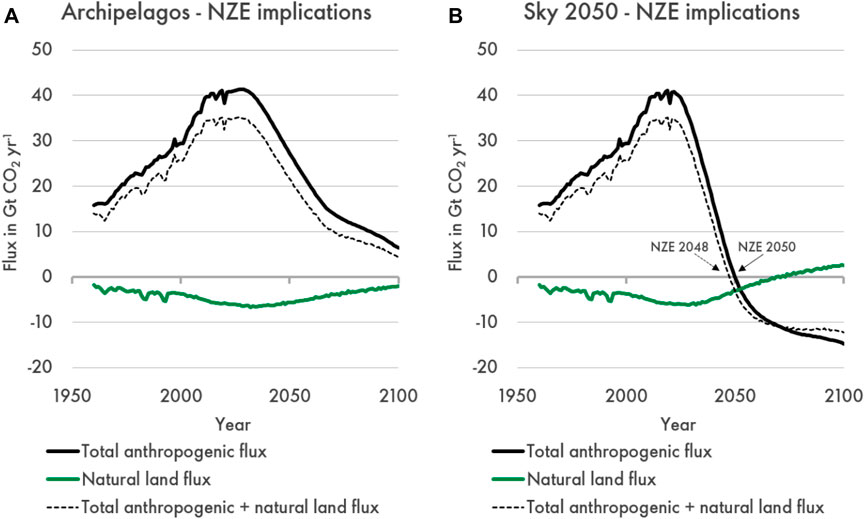
Figure 12. The impact of including natural land in a global NZE target for Archipelagos (A) and Sky 2050 (B). In Archipelagos, NZE is not reached within the model timeline, whereas in Sky 2050, NZE is reached in 2050 or 2048 depending on the NZE target definition.
5 Conclusion
This study presents a novel methodology to evaluate the future progression of natural land carbon sinks at the regional and country level, developed in the context of the new Shell Energy Security Scenarios (Shell, 2023). We allocate global projections from earth system model simulations to regions of interest using a compilation of forest land areas sourced from the FAO and other model sources for a historic and scenario range spanning 1960–2100. Our new dataset allows for the evaluation of natural land sinks between different scenarios for any region of interest, or between different countries or regions in a single scenario, which we demonstrate for the Shell scenarios Sky 2050 and Archipelagos. We compare our results to the findings of other studies, including the land-use flux harmonisation study of Grassi et al. (2023), and find a remarkably good match in natural land sink estimates for recent history for individual countries and regions such as the EU. Our total net land flux estimates, combining anthropogenic land-use emissions from the Shell World Energy Model and natural land flux estimates arising from the present study, show a reasonable match for large countries but also show substantial scatter for many smaller countries. This suggests that the allocation of anthropogenic land-use emissions in the Shell World Energy Model (WEM) may potentially be further improved. Lastly, we discuss the importance of accurate land carbon accounting and demonstrate that including natural land fluxes as part of NZE definitions would accelerate reaching global NZE by approximately 2 years in Sky 2050. Given the importance of land carbon in mitigating climate change, we recommend that the carbon cycle modelling and energy modelling research communities continue to collaborate to develop relevant data and methods to distinguish anthropogenic and natural land CO2 fluxes at country level, for both present and future.
Data availability statement
The original contributions presented in the study are included in the article/Supplementary Material, further inquiries can be directed to the corresponding author.
Author contributions
RvP: Conceptualization, Data curation, Formal Analysis, Investigation, Methodology, Visualization, Writing–original draft, Writing–review and editing. MH: Conceptualization, Formal Analysis, Funding acquisition, Methodology, Supervision, Writing–review and editing.
Funding
The authors declare financial support was received for the research, authorship, and/or publication of this article. This research was financially supported by Shell Global Solutions International B.V. and Shell International Limited.
Acknowledgments
We gratefully acknowledge Andy Robertson and Martine Ruigrok for technical discussions on NBS potentials and their implementation in the Shell WEM, as well as Sergey Paltsev, Angelo Gurgel and the other staff at the MIT Joint Program on the Science and Policy of Global Change for their comments on the work and the ongoing collaboration in the climate evaluation of Shell Scenarios. The methods and results remain the responsibility of the authors. Lastly, we acknowledge three independent reviewers for their comments that have improved the quality of the manuscript.
Conflict of interest
The authors declare that financial support was received for the research, authorship and/or publication of this article.
This research was financially supported by Shell Global Solutions International B.V. and Shell International Limited, both wholly owned subsidiaries of Shell plc. The funder was involved in the study design and the decision to submit it for publication.
Publisher’s note
All claims expressed in this article are solely those of the authors and do not necessarily represent those of their affiliated organizations, or those of the publisher, the editors and the reviewers. Any product that may be evaluated in this article, or claim that may be made by its manufacturer, is not guaranteed or endorsed by the publisher.
Supplementary material
The Supplementary Material for this article can be found online at: https://www.frontiersin.org/articles/10.3389/fenvs.2024.1379046/full#supplementary-material
References
Allen, M. R., Friedlingstein, P., Girardin, C. A. J., Jenkins, S., Malhi, Y., Mitchell-Larson, E., et al. (2022). Net zero: science, origins, and implications. Annu. Rev. Environ. Resour. 47 (1), 849–887. doi:10.1146/annurev-environ-112320-105050
Anderson-Teixeira, K. J., Herrmann, V., Banbury Morgan, R., Bond-Lamberty, B., Cook-Patton, S. C., Ferson, A. E., et al. (2021). Carbon cycling in mature and regrowth forests globally. Environ. Res. Lett. 16 (5), 053009. doi:10.1088/1748-9326/abed01
Armstrong McKay, D. I., Staal, A., Abrams, J. F., Winkelmann, R., Sakschewski, B., Loriani, S., et al. (2022). Exceeding 1.5°C global warming could trigger multiple climate tipping points. Science 377 (6611), eabn7950. doi:10.1126/science.abn7950
Canadell, J. G., Monteiro, P. M. S., Costa, M. H., Cunha, L. C. d., Cox, P. M., Eliseev, A. V., et al. (2021). “Global carbon and other biogeochemical cycles and feedbacks,” in Climate change 2021: the physical science basis. Contribution of working group I to the sixth assessment report of the intergovernmental Panel on climate change. Editors V. Masson-Delmotte, P. Zhai, A. Pirani, S. L. Connors, C. Péan, S. Bergeret al. (Cambridge University Press), 673–816.
Chapin, F. S., Woodwell, G. M., Randerson, J. T., Rastetter, E. B., Lovett, G. M., Baldocchi, D. D., et al. (2006). Reconciling carbon-cycle concepts, terminology, and methods. Ecosystems 9 (7), 1041–1050. doi:10.1007/s10021-005-0105-7
Chen, Y. H. H., Paltsev, S., Reilly, J. M., Morris, J. F., and Babiker, M. H. (2016). Long-term economic modeling for climate change assessment. Econ. Model. 52, 867–883. doi:10.1016/j.econmod.2015.10.023
Crezee, B., Dargie, G. C., Ewango, C. E. N., Mitchard, E. T. A., Emba B, O., Kanyama T, J., et al. (2022). Mapping peat thickness and carbon stocks of the central Congo Basin using field data. Nat. Geosci. 15 (8), 639–644. doi:10.1038/s41561-022-00966-7
Denning, A. S. (2022). Where has all the carbon gone? Annu. Rev. Earth Planet. Sci. 50 (1), 55–78. doi:10.1146/annurev-earth-032320-092010
Duffy, K. A., Schwalm, C. R., Arcus, V. L., Koch, G. W., Liang, L. L., and Schipper, L. A. (2021). How close are we to the temperature tipping point of the terrestrial biosphere? Sci. Adv. 7 (3), eaay1052. doi:10.1126/sciadv.aay1052
Fankhauser, S., Smith, S. M., Allen, M., Axelsson, K., Hale, T., Hepburn, C., et al. (2021). The meaning of net zero and how to get it right. Nat. Clim. Change 12 (1), 15–21. doi:10.1038/s41558-021-01245-w
Fernández-Martinez, M., Penuelas, J., Chevallier, F., Ciais, P., Obersteiner, M., Rodenbeck, C., et al. (2023). Diagnosing destabilization risk in global land carbon sinks. Nature 615, 848–853. doi:10.1038/s41586-023-05725-1
Fernández-Martínez, M., Sardans, J., Chevallier, F., Ciais, P., Obersteiner, M., Vicca, S., et al. (2018). Global trends in carbon sinks and their relationships with CO2 and temperature. Nat. Clim. Change 9 (1), 73–79. doi:10.1038/s41558-018-0367-7
Friedlingstein, P., Jones, M. W., O'Sullivan, M., Andrew, R. M., Bakker, D. C. E., Hauck, J., et al. (2022). Global carbon budget 2021. Earth Syst. Sci. Data 14 (4), 1917–2005. doi:10.5194/essd-14-1917-2022
Friedlingstein, P., O'Sullivan, M., Jones, M. W., Andrew, R. M., Bakker, D. C. E., Hauck, J., et al. (2023). Global carbon budget 2023. Earth Syst. Sci. Data 15 (12), 5301–5369. doi:10.5194/essd-15-5301-2023
Gatti, L. V., Basso, L. S., Miller, J. B., Gloor, M., Gatti Domingues, L., Cassol, H. L. G., et al. (2021). Amazonia as a carbon source linked to deforestation and climate change. Nature 595 (7867), 388–393. doi:10.1038/s41586-021-03629-6
Gidden, M. J., Gasser, T., Grassi, G., Forsell, N., Janssens, I., Lamb, W. F., et al. (2023). Aligning climate scenarios to emissions inventories shifts global benchmarks. Nature 624 (7990), 102–108. doi:10.1038/s41586-023-06724-y
Goldstein, A., Turner, W. R., Spawn, S. A., Anderson-Teixeira, K. J., Cook-Patton, S., Fargione, J., et al. (2020). Protecting irrecoverable carbon in Earth’s ecosystems. Nat. Clim. Change 10 (4), 287–295. doi:10.1038/s41558-020-0738-8
Grassi, G., House, J., Dentener, F., Federici, S., den Elzen, M., and Penman, J. (2017). The key role of forests in meeting climate targets requires science for credible mitigation. Nat. Clim. Change 7 (3), 220–226. doi:10.1038/nclimate3227
Grassi, G., House, J., Kurz, W. A., Cescatti, A., Houghton, R. A., Peters, G. P., et al. (2018). Reconciling global-model estimates and country reporting of anthropogenic forest CO2 sinks. Nat. Clim. Change 8 (10), 914–920. doi:10.1038/s41558-018-0283-x
Grassi, G., Schwingshackl, C., Gasser, T., Houghton, R. A., Sitch, S., Canadell, J. G., et al. (2023). Harmonising the land-use flux estimates of global models and national inventories for 2000–2020. Earth Syst. Sci. Data 15 (3), 1093–1114. doi:10.5194/essd-15-1093-2023
Grassi, G., Stehfest, E., Rogelj, J., van Vuuren, D., Cescatti, A., House, J., et al. (2021). Critical adjustment of land mitigation pathways for assessing countries’ climate progress. Nat. Clim. Change 11 (5), 425–434. doi:10.1038/s41558-021-01033-6
Gumbricht, T., Roman-Cuesta, R. M., Verchot, L., Herold, M., Wittmann, F., Householder, E., et al. (2017). An expert system model for mapping tropical wetlands and peatlands reveals South America as the largest contributor. Glob. Chang. Biol. 23 (9), 3581–3599. doi:10.1111/gcb.13689
Gurgel, A., Morris, J., Haigh, M., Robertson, A. D., Van der Ploeg, R., and Paltsev, S. (2024). Land-Use Competition in 1.5C Climate Stabilization: is there enough land for all potential needs? Front. Environ. Sci. [Preprint].
Hansen, M. C., Potapov, P. V., Moore, R., Hancher, M., Turubanova, S. A., Tyukavina, A., et al. (2013). High-resolution global maps of 21st-century forest cover change. Science 342 (6160), 850–853. doi:10.1126/science.1244693
Hasegawa, T., Fujimori, S., Frank, S., Humpenöder, F., Bertram, C., Després, J., et al. (2021). Land-based implications of early climate actions without global net-negative emissions. Nat. Sustain. 4 (12), 1052–1059. doi:10.1038/s41893-021-00772-w
Hughes, T. P., Anderson, K. D., Connolly, S. R., Heron, S. F., Kerry, J. T., Lough, J. M., et al. (2018). Spatial and temporal patterns of mass bleaching of corals in the Anthropocene. Science 359 (6371), 80–83. doi:10.1126/science.aan8048
Hurtt, G. C., Chini, L., Sahajpal, R., Frolking, S., Bodirsky, B. L., Calvin, K., et al. (2020). Harmonization of global land use change and management for the period 850–2100 (LUH2) for CMIP6. Geosci. Model. Dev. 13 (11), 5425–5464. doi:10.5194/gmd-13-5425-2020
Jung, M., Reichstein, M., Schwalm, C. R., Huntingford, C., Sitch, S., Ahlstrom, A., et al. (2017). Compensatory water effects link yearly global land CO(2) sink changes to temperature. Nature 541 (7638), 516–520. doi:10.1038/nature20780
Keenan, T. F., Luo, X., Stocker, B. D., De Kauwe, M. G., Medlyn, B. E., Prentice, I. C., et al. (2023). A constraint on historic growth in global photosynthesis due to rising CO2. Nat. Clim. Change 13 (12), 1376–1381. doi:10.1038/s41558-023-01867-2
Keenan, T. F., and Williams, C. A. (2018). The terrestrial carbon sink. Annu. Rev. Environ. Resour. 43 (1), 219–243. doi:10.1146/annurev-environ-102017-030204
Keith, H., Kun, Z., Hugh, S., Svoboda, M., Mikoláš, M., Adam, D., et al. (2024). Carbon carrying capacity in primary forests shows potential for mitigation achieving the European Green Deal 2030 target. Commun. Earth Environ. 5 (1), 256. doi:10.1038/s43247-024-01416-5
Keith, H., Vardon, M., Obst, C., Young, V., Houghton, R. A., and Mackey, B. (2021). Evaluating nature-based solutions for climate mitigation and conservation requires comprehensive carbon accounting. Sci. Total Environ. 769, 144341. doi:10.1016/j.scitotenv.2020.144341
Longbottom, T., Wahab, L., Min, K., Jurusik, A., Moreland, K., Dolui, M., et al. (2022). What’s soil got to do with climate change? GSA Today 32 (5), 4–10. doi:10.1130/gsatg519a.1
Mo, L., Zohner, C. M., Reich, P. B., Liang, J., de Miguel, S., Nabuurs, G. J., et al. (2023). Integrated global assessment of the natural forest carbon potential. Nature 624 (7990), 92–101. doi:10.1038/s41586-023-06723-z
Page, S. E., Rieley, J. O., and Banks, C. J. (2011). Global and regional importance of the tropical peatland carbon pool. Glob. Change Biol. 17 (2), 798–818. doi:10.1111/j.1365-2486.2010.02279.x
Paltsev, S., Sokolov, A., Haigh, M., Hone, D., and Morris, J. (2021). Changing the global energy system: temperature implications of the different storylines in the 2021 Shell energy transformation scenarios. Jt. Program Rep. Ser. Rep. 348 (February), 20.
Penuelas, J., Ciais, P., Canadell, J. G., Janssens, I. A., Fernandez-Martinez, M., Carnicer, J., et al. (2017). Shifting from a fertilization-dominated to a warming-dominated period. Nat. Ecol. Evol. 1 (10), 1438–1445. doi:10.1038/s41559-017-0274-8
Regnier, P., Resplandy, L., Najjar, R. G., and Ciais, P. (2022). The land-to-ocean loops of the global carbon cycle. Nature 603 (7901), 401–410. doi:10.1038/s41586-021-04339-9
Ritchie, P. D. L., Clarke, J. J., Cox, P. M., and Huntingford, C. (2021). Overshooting tipping point thresholds in a changing climate. Nature 592 (7855), 517–523. doi:10.1038/s41586-021-03263-2
Roe, S., Streck, C., Beach, R., Busch, J., Chapman, M., Daioglou, V., et al. (2021). Land-based measures to mitigate climate change: potential and feasibility by country. Glob. Chang. Biol. 27 (23), 6025–6058. doi:10.1111/gcb.15873
Roe, S., Streck, C., Obersteiner, M., Frank, S., Griscom, B., Drouet, L., et al. (2019). Contribution of the land sector to a 1.5 °C world. Nat. Clim. Change 9 (11), 817–828. doi:10.1038/s41558-019-0591-9
Rogelj, J., Geden, O., Cowie, A., and Reisinger, A. (2021). Net-zero emissions targets are vague: three ways to fix. Nature 591 (7850), 365–368. doi:10.1038/d41586-021-00662-3
Ruehr, S., Keenan, T. F., Williams, C., Zhou, Y., Lu, X., Bastos, A., et al. (2023). Evidence and attribution of the enhanced land carbon sink. Nat. Rev. Earth Environ. 4 (8), 518–534. doi:10.1038/s43017-023-00456-3
Schwingshackl, C., Obermeier, W. A., Bultan, S., Grassi, G., Canadell, J. G., Friedlingstein, P., et al. (2022). Differences in land-based mitigation estimates reconciled by separating natural and land-use CO2 fluxes at the country level. One Earth 5 (12), 1367–1376. doi:10.1016/j.oneear.2022.11.009
Sokolov, A., Kicklighter, D., Schlosser, A., Wang, C., Monier, E., Brown-Steiner, B., et al. (2018). Description and evaluation of the MIT earth system model (MESM). J. Adv. Model. Earth Syst. 10 (8), 1759–1789. doi:10.1029/2018ms001277
Sokolov, A., Paltsev, S., Gurgel, A., Haigh, M., Hone, D., and Morris, J. (2023). Temperature implications of the 2023 Shell energy security scenarios: Sky 2050 and Archipelagos. Jt. Program Rep. Ser. Rep. 364 (3), 17.
Tsai, W.-T. (2020). Forest resource management and its climate-change mitigation policies in taiwan. Climate 9 (1), 3. doi:10.3390/cli9010003
Upton, S., Reichstein, M., Gans, F., Peters, W., Kraft, B., and Bastos, A. (2024). Constraining biospheric carbon dioxide fluxes by combined top-down and bottom-up approaches. Atmos. Chem. Phys. 24 (4), 2555–2582. doi:10.5194/acp-24-2555-2024
Walker, A. P., De Kauwe, M. G., Bastos, A., Belmecheri, S., Georgiou, K., Keeling, R. F., et al. (2021). Integrating the evidence for a terrestrial carbon sink caused by increasing atmospheric CO2. New Phytol. 229 (5), 2413–2445. doi:10.1111/nph.16866
Walker, X. J., Baltzer, J. L., Cumming, S. G., Day, N. J., Ebert, C., Goetz, S., et al. (2019). Increasing wildfires threaten historic carbon sink of boreal forest soils. Nature 572 (7770), 520–523. doi:10.1038/s41586-019-1474-y
Xu, (2021). Changes in global terrestrial live biomass over the 21st century. Sci. Adv. 7, eabe9829. doi:10.1126/sciadv.abe9829
Xu, J., Morris, P. J., Liu, J., and Holden, J. (2018). PEATMAP: refining estimates of global peatland distribution based on a meta-analysis. Catena 160, 134–140. doi:10.1016/j.catena.2017.09.010
Keywords: carbon cycle, greenhouse gases, climate change, CO2 fertilisation, natural land carbon sink, net-zero emissions, nature-based solutions
Citation: van der Ploeg R and Haigh M (2024) The importance of natural land carbon sinks in modelling future emissions pathways and assessing individual country progress towards net-zero emissions targets. Front. Environ. Sci. 12:1379046. doi: 10.3389/fenvs.2024.1379046
Received: 30 January 2024; Accepted: 28 June 2024;
Published: 09 August 2024.
Edited by:
Chenxi Li, Xi’an University of Architecture and Technology, ChinaReviewed by:
Licheng Liu, University of Minnesota Twin Cities, United StatesEtsushi Kato, Institute of Applied Energy, Japan
Copyright © 2024 van der Ploeg and Haigh. This is an open-access article distributed under the terms of the Creative Commons Attribution License (CC BY). The use, distribution or reproduction in other forums is permitted, provided the original author(s) and the copyright owner(s) are credited and that the original publication in this journal is cited, in accordance with accepted academic practice. No use, distribution or reproduction is permitted which does not comply with these terms.
*Correspondence: Robin van der Ploeg, ci52YW5kZXJwbG9lZ0BzaGVsbC5jb20=