 Xiaona Ma
 Pengcheng Yan2*
- 1School of Spatial Informatics and Geomatics Engineering, Anhui University of Science and Technology, Huainan, China
- 2School of Electrical and Information Engineering, Anhui University of Science and Technology, Huainan, China
Mine water inrush disaster can quickly cause significant economic losses and casualties because of its strong concealing and rapid burst speed. Quickly identifying the source of mine water inrush is of great practical significance. Compared with the traditional hydrochemical analysis method, the laser-induced fluorescence (LIF) technology has fast reaction speed, high sensitivity, and strong stability, which makes up for the shortcomings of the traditional method. As an integrated algorithm, random forest (RF) has the advantage of high accuracy. A combination of LIF technology and RF algorithm is proposed to identify mine water inrush source rapidly. The experimental samples were collected from a coal mine in Hainan City, Anhui Province, and a total of 525 sets of water samples to be tested for experiments by mixing goaf water and sandstone water into A-G7 species according to different proportions. Moving average smoothing (MA), Savitzky-Golay Smoothing (SG), First derivative (FD), and Second derivative (SD) methods are used to preprocess the original spectral data to reduce the noise and interference information existing in the original spectral data. By comparison, the Moving average smoothing (MA) method has high classification accuracy and is the final method for noise reduction. Then, the RF algorithm is used to delete the less critical spectrum after noise reduction and select the characteristic wavelength with the minimum classification error of 0. Finally, SVM, PCA-SVM, MA-SVM, MA-PCA-SVM, and MA-RF algorithm recognition models were established, respectively. Comparing the prediction accuracy of the test set, the accuracy of the MA-RF algorithm in the five groups of models reached 100
1 Introduction
Currently, mine water inrush is one of the most threatening disasters in the coal mine production process. The disaster has strong concealment and fast burst speed, easy to cause substantial economic losses and heavy casualties. Zhang et al. (2009) Therefore, identifying water inrush sources quickly and taking adequate preventive measures is the key to mine water disaster control.
The chemical composition of groundwater is relatively complex, and water quality analysis is the basic means of studying the chemical composition of groundwater. At present, the traditional methods of water inrushing source identification include hydrochemical characteristics analysis Li et al. (2014), isotope tracer Huang and Wang (2018), The water chemical characteristics of the aquifers are analyzed with computer drawn Piper three-line diagram. Fuzzy comprehensive evaluation and systematic clustering analysis are applied to analyze, compare and determine the water inrush source. The discrimination accurate rate is about 80
The traditional method dynamic change analysis of water Parras-Berrocal et al. (2022), and methods based on GIS and water quality and temperature Oseke et al. (2021). The variation of groundwater level in different coal seams presents different characteristics, with some dynamic changes being serrated and others being wavy. Li et al. (2015) Conduct a systematic three-dimensional search and identification of potential water inrush layers in coal seams, and determine calculation parameters based on GIS data and indoor experiments. Evaluate and compare the water level stability under normal and abnormal working conditions. Wu et al. (2011) Dynamic change analysis is greatly influenced by the geological environment, with a long data analysis cycle and low accuracy. GIS requires data processing and analysis before monitoring and prediction, so the process is relatively long, slow, and inefficient.
Based on previous research, some scholars have studied identification method based on coupled principal component analysis. According to the difference between the chemical components of water sources, the identification index variables of water inrush sources were determined. According to the difference between the chemical components of water sources, the identification index variables of water inrush sources were determined. The correlation between the water source groups was obtained through coupling principal component analysis. The combination of covariance matrix and Fisher discrimination, coupled with principal component analysis, can improve the recognition rate of water inrush sources to 90
Laser-induced fluorescence (LIF) technology refers to the method of detecting the fluorescence emission after laser irradiation of a sample. It has the advantages of fast response, low interference, and high sensitivity. In recent years, LIF technology has been widely used in various fields. Hu et al. (2019) For example, Bukin et al. (2020) used LIF technology to detect soil oil pollutants, and Ghasemi et al. (2017) applied LIF technology to the medical field to conduct specific screening of breast tumors. Si-ying et al. (2022) used LIF technology to study the classification and recognition of Manuka honey adulterated with syrup. It can be seen that the LIF technology in the food field is also widely used. In the identification of mine water inrush source, there are some applications and research results, but it still needs to be improved and perfected.
Random forest (RF) is a supervised ensemble learning model for classification and regression Mantas et al. (2019). Its essence is an integrated learning algorithm with the advantages of processing high dimensional data, high accuracy, and reasonable decision rules. Stevens, Stevens et al. (2015) conducted a study of regional population distribution patterns and influence mechanisms using RF models. Ceccato et al. (2021) used RF models to assess car-sharing switching rates for traditional transportation modes. Zhu et al. (2017) conducted rapeseed pest detection based on the RF model. Paing et al. (2020) established RF models for classifying benign and malignant lung nodules. RF algorithms are widely used in various industries, such as big data analytics, bioinformatics, financial risk control, and healthcare.
In this paper, firstly, the original spectral data is preprocessed using MA, SG, FD, and SD methods. Choose the MA method with the best classification accuracy as the final denoising method. Then, the RF algorithm is used to remove the spectra with lower importance after denoising, and the feature wavelengths with the minimum classification error of 0 are selected. Finally, five algorithm recognition models were constructed, including SVM, PCA-SVM, MA-SVM, MA-PCA-SVM, and MA-RF. The MA-RF algorithm with the highest accuracy was selected to quickly and accurately predict mine water inrush.
2 Materials and methods
This paper aims to identify the source of mine water inrush. Firstly, the fluorescence spectrum of the mine water source is obtained by the LIF system, and then the original fluorescence spectrum is pretreated. Then RF is used to identify the fluorescence spectrum of mine water source, and finally, the type of mine water source is identified. In particular, a desktop computer configured with Intel(R) Core(TM) i7-10700K was used as the data processing platform, and Matlab R2021a was used to complete the fluorescence spectrum analysis.
2.1 Experimental materials
Goaf water is acidic, corrosive, and usually rich in high concentrations of harmful gases such as hydrogen sulfide. Goaf water is the most important and harmful source of water inrush in coal mines. This experiment mainly takes goaf water mixed with sandstone water as the research object. The experimental material was goaf water and sandstone water from a coal mine in Huainan City, Anhui Province, in July 2022. The goaf water and sandstone water were mixed at different volume ratios. 75 water samples were selected from each group to form the following sample set: 1) Group A: Mixed water with a volume ratio of goaf water and sandstone water of 4:1. 2) Group B: mixed water with a volume ratio of 3:1 between goaf water and sandstone water. 3) Group C: mixed water with a 2:1 volume ratio of goaf water and sandstone water. 4) Group D: mixed water with a 1:1 volume ratio of goaf water and sandstone water. 5) Group E: mixed water with a volume ratio 1:2 of goaf water and sandstone water. 6) Group F: mixed water with a volume ratio of goaf water and sandstone water of 1:3. 7) Group G: mixed water with a volume ratio of 1:4 of goaf water and sandstone water.
In order to ensure that the experimental data is more accurate and reliable, the water samples collected at the site are placed in a dark room, sealed, and stored away from light. According to the different mixing ratios, a total of 525 sets of spectral data were obtained as experimental samples.
2.2 Lif spectroscopy acquisition
The structure of the multispectral acquisition system adopted in this paper is shown in Figure 1. The main components of the system include laser, spectrometer, fluorescence probe, and a computer equipped with spectral acquisition software. A 405 m semiconductor laser (Beijing Huayuan Toda Laser Technology Co., LTD.) was used to excite the fluorescence of the mine water source. The spectrometer is a USB200+ mini-spectrometer (Ocean Optics, United States), which is equipped with a 2048-dimensional linear CCD for fluorescence spectra measurement. The immersion micro-fluorescent probe model FPB-405-V3 (Guangdong Koskai Company) can be inserted into the sample to obtain fluorescence signals. Spectra Suite software is installed on the computer for the acquisition, display, and saving of fluorescence spectra. The algorithm simulation is run in Matlab R2021a environment.
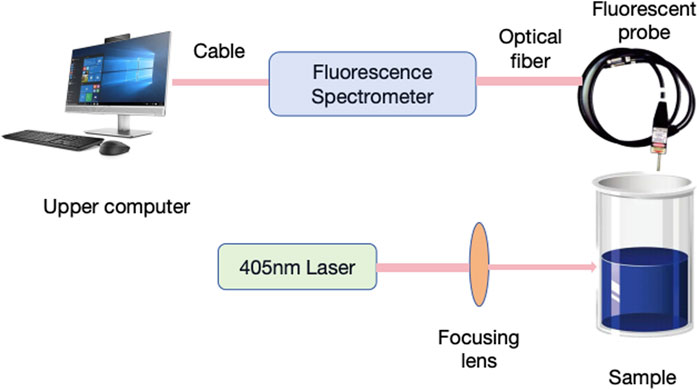
Figure 1. Schematic diagram of LIF spectral system.
The fluorescence spectrum of mine water source is collected in the same environment to reduce the interference of external factors on the fluorescence spectrum. During the experiment, the power of the laser was set to 100 mW, the spectrum acquisition range of the spectrometer was set to 340–1,021 nm, and the integration time was set to 1 ms. After the equipment was ready, the fluorescence spectra of mine water source samples were collected by the LIF system, and 75 fluorescence spectra of seven kinds of mine water sources were obtained, totaling 525 mine water fluorescence spectra. In the process of establishing the mine water source identification model, 60 samples of each mine water sample are randomly selected as the training set and the rest as the test set. That is, the training set contains a total of 420 mine water fluorescence spectrum samples, and the test set contains a total of 105 mine water fluorescence spectrum samples. In addition, in the process of establishing the fluorescence spectrum identification model of mine water source, ten-fold cross validation is introduced to make the classification model more reliable.
2.3 Pretreatment of fluorescence spectra
Due to the interference of system noise and external noise in the collection process of laser-induced fluorescence spectrum, the original fluorescence spectrum of mine water source collected contains useless noise interference information, which has a great impact on the experimental results. Therefore, it is necessary to preprocess the original fluorescence spectral data. Common spectral preprocessing methods include Moving average smoothing (MA), Savitzky-Golay smoothing (SG) Schettino et al. (2016), First derivative (FD)Jin et al. (2012) and Second derivative (SD) Czarnecki (2015). These methods are used to denoise the fluorescence spectral data. According to the evaluation index of the selected classification model, the prediction ability of the original spectrum and the denoised spectrum is compared, and the appropriate denoising method is selected.
2.4 Random forest for fluorescene spectrum analysis
Random forest consists of many decision trees. It is a supervised algorithm for classification and regression, also known as Classified And Regression Tree (CART), which was proposed by Breiman Parcha et al. (2007). The random forest algorithm process is shown in Figure 2. In the calculation process, the binary tree segmentation rule is used to divide the trained sample set into two subsample sets each time, and each non-leaf node has two branches. The subsample set repeats the action until it can no longer split. The randomness of the random forest is reflected in the fact that when training each tree from the full sample size of N, a dataset that may have repetitions of the same size of N is selected. We call it Bootstrap sampling. At each node, a subset of all features is randomly selected to calculate the optimal segmentation method Goehry et al. (2021). Bagging is a put-back sampling technique based on Bootstrap. According to the sampling probability, about 36.79
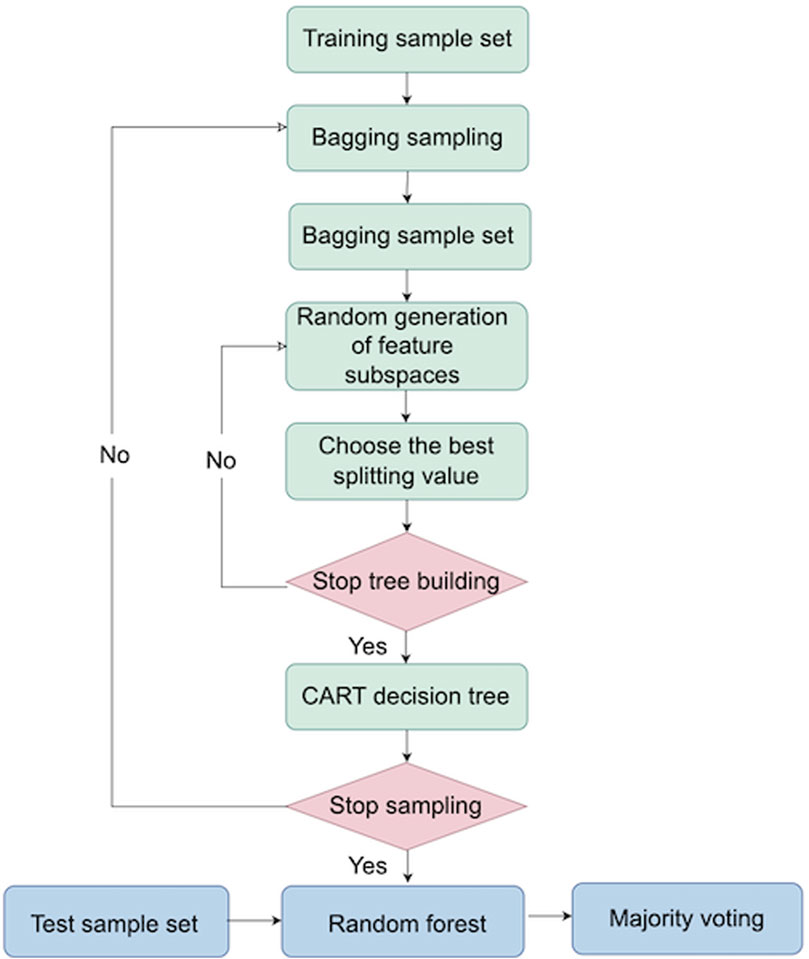
Figure 2. Random forest algorithm process.
In the random forest model, the feature importance can be measured by the OOB error. For each decision tree, the corresponding out-of-bag data error is recorded as errOOB1. Then, randomly add noise interference to the feature x of all samples of the OOB data, calculate the error of the data outside the bag again, and record it as errOOB2. If there are N trees in the random forest, The importance of feature x W is expressed as
3 Results and discussion
3.1 The original fluorescene spectrum of mine water source
In order to ensure that no other factors affect the results of the experiment, the experiment was conducted in a laboratory without a light source and at a constant temperature. The fluorescence spectrum data of mine water source was collected by micro-optical fiber and fluorescence spectrometer. After laser irradiation, the fluorescent substances in mine water source absorb light energy, stimulate and release energy, produce fluorescence, and form fluorescence spectrum. The spectrum peaks between 420 and 650 nm and differences in this range are concentrated. The original fluorescence spectrum is shown in Figure 3. Figure 3A shows the original fluorescence spectra of all mine water samples, and Figure 3B shows the fluorescence spectra of one sample randomly selected from each type of A-G goaf water and sandstone water mixed samples. The morphology and wave peaks of the original fluorescence spectra are very similar, and there are crosses between different spectra. The spectral differences are small, so it is difficult to observe and distinguish the differences between experimental samples. Therefore, the original fluorescence spectral data should be preprocessed.
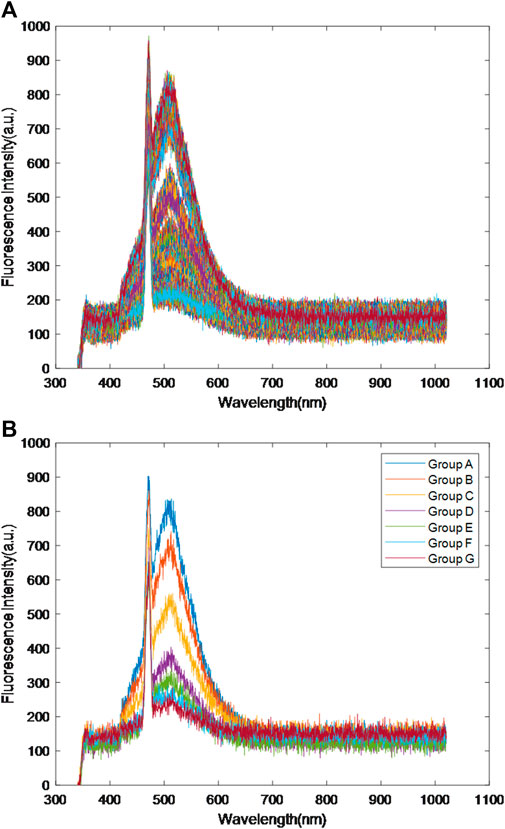
Figure 3. The original fluorescence spectrum of mine water sample.
3.2 Selection of spectral pretreatment method
In order to eliminate noise interference in the original fluorescence spectrum, reduce errors, and retain useful information in the fluorescence spectrum, MA, SG, FD, and SD were used to preprocess the original fluorescence spectrum data of mine water samples. Respectively, the preprocessed fluorescence spectra are shown in Figure 4.
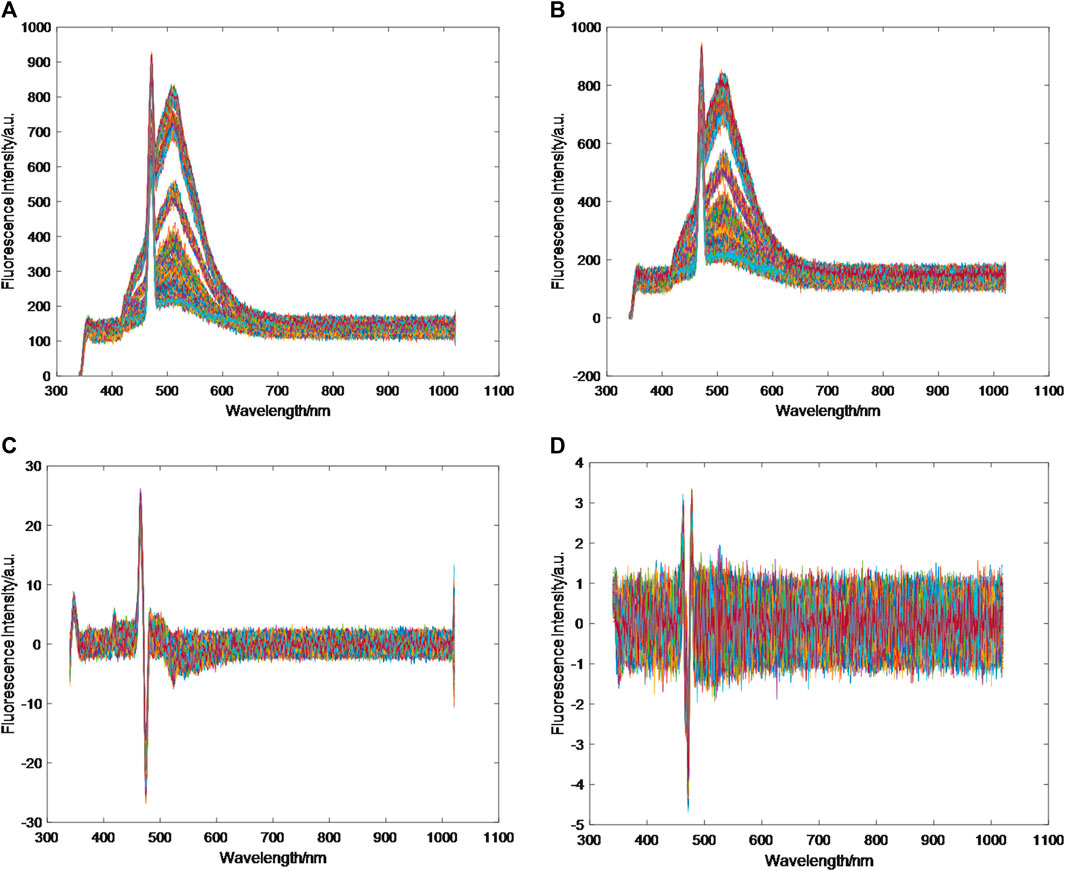
Figure 4. Fluorescence spectra after different pretreatments.
The four groups of diagrams in Figure 4 show that the fluorescence spectra of MA and SG preprocessed spectra have many advantages, although there are still overlapping parts. Compared with the original fluorescence spectra, they are more dispersed, with less noise interference, and the water samples are easier to distinguish. While the FD and SD processed data are redundant, with large noise interference, which affects the accuracy of the spectral data.
The classification accuracy and training time of the four preprocessing methods were obtained by RF classification. The results were shown in Table 1. The classification accuracy of MA reached 99.24%, and the training time was 0.3434s. The classification accuracy of SG is 99.05%, and the training time is 0.3431s. Both methods have improved the classification accuracy of 98.10% and the training time of 0.3660 of the original spectrum. Overall, the pretreatment effect of MA is the best. The data also showed that the classification accuracy of FD and SD were 80% and 61.52%, and the training time was 0.3975s and 0.3884s, which showed poor processing effect.

Table 1. Classification result of different preprocessing methods under decision tree.
3.3 Random forest analysis of fluorescence spectra
Random forest is an ensemble learning algorithm that improves classification and regression accuracy by combining multiple decision trees. In the random forest, we need to adjust the parameters, and the first is to set the minimum number of leaves. Each decision tree divides the data set into smaller subsets through continuous segmentation, each subset corresponds to a node in the tree and the leaf node is the final subset Karabadji et al. (2023). According to the setting of the minimum number of leaves, each node must have a certain number of samples in the subset after segmentation to continue downward segmentation. Otherwise, it will become a leaf node. How to set the minimum number of leaves greatly affects the classification and regression results of random forest. If the minimum number of leaves is set too large, the depth of the decision tree will be shallow, resulting in an underfitting phenomenon. If the minimum number of leaves is set too small, the depth of the decision tree will be large, and overfitting will occur Santra et al. (2020). Out-of-bag (OOB) data can be used as generalization error to evaluate the model. After training, RF's out-of-bag error rate is shown in Figure 5. The minimum number of leaves is set to 6, the number of trees is set to 24, and the out-of-bag error rate is reduced to 0, achieving 100
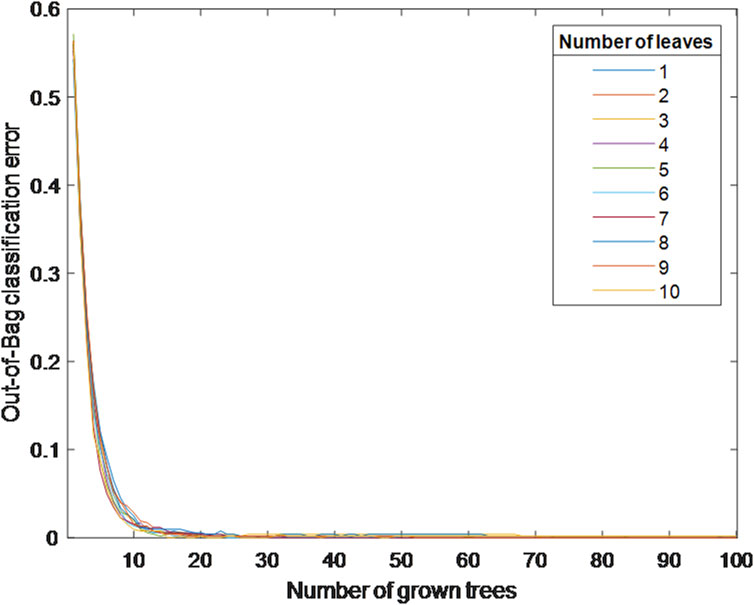
Figure 5. RF classification errors under different minimum number of leaves.
There are 2048 attributes in the original fluorescence spectral data, each of which contains different spectral information, and the importance of different attributes to spectral analysis is obviously different. Non-critical attributes with low importance will affect the establishment of the classification model for mine water inrush samples and thus fail to achieve a good prediction effect. Based on random forest, the feature importance is analyzed. As shown in Figure 6, the importance of most attributes is 0. After MA preprocessing, some attributes eliminate interference information and make their importance prominent. The fluorescence spectrum with wavelengths between 420 and 620 nm has obvious characteristics, and the feature importance is between 0.1–0.3.
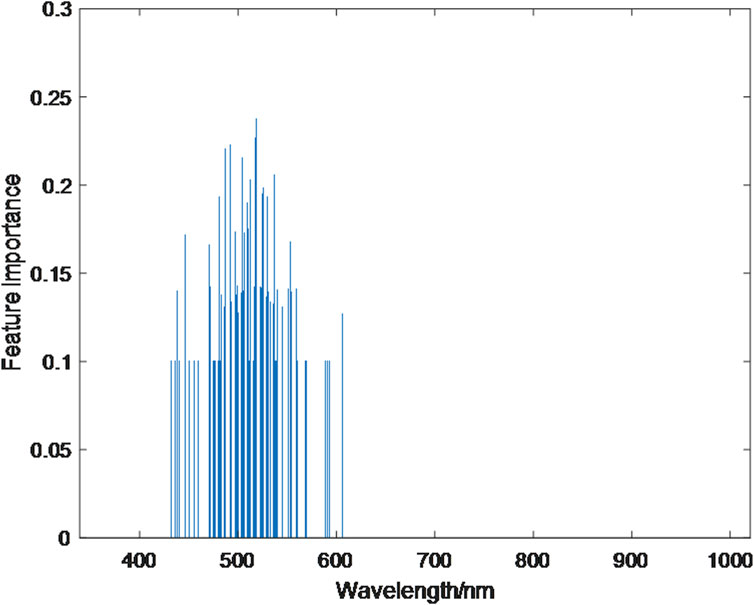
Figure 6. Characteristic importance of fluorescence spectra at different wavelength positions.
The RF classification model can select features from their importance through threshold selection for model optimization Hwang et al. (2023). Try to remove unimportant features at lower levels to optimize the accuracy and efficiency of the model. When the threshold is 0.25, the number of selected feature wavelengths is 2, the minimum classification error is 1.71
A total of seven groups of A-G samples mixed with different volume ratios of goaf water and sandstone water were trained. Since the test set and training set were generated randomly, the results would be different each time. The RF prediction model of a certain run was fitted, and the results are shown in Figure 7. After MA preprocessing, the RF model threshold was set to 0.10, and the number of characteristic wavelengths was 281. The predicted results were good, and the predicted values were basically consistent with the actual values. This is consistent with the results under different feature importance thresholds in Table 2.
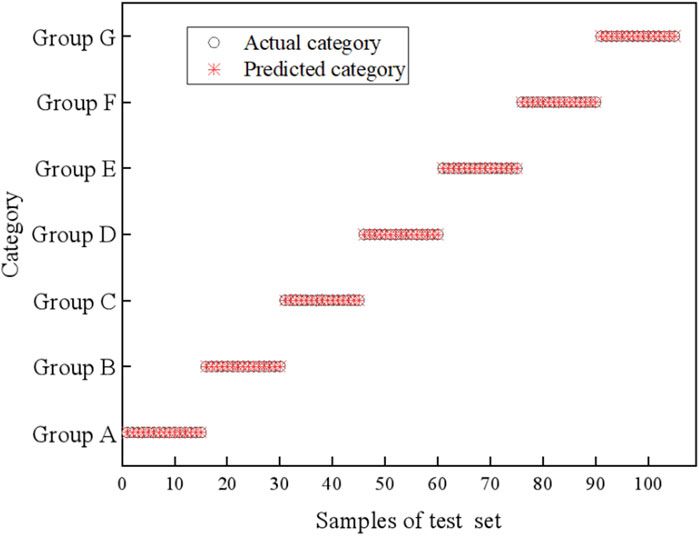
Figure 7. Actual category and predicted category of the test set.
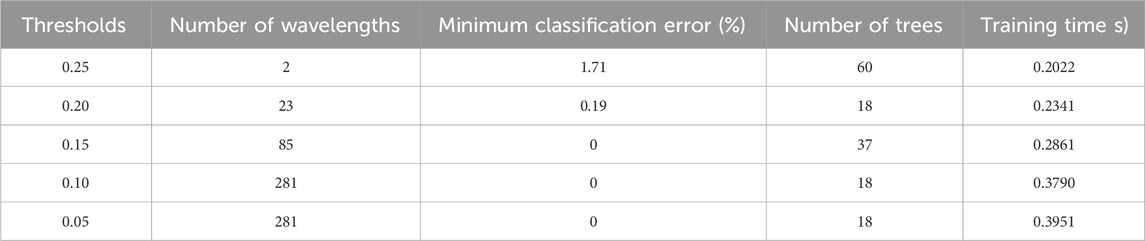
Table 2. The results of different feature importance thresholds.
3.4 Comparison with traditional
In order to verify the evaluation effect and reliability of the RF algorithm model for mine water inrush prediction, Support Vector Machine (SVM) Ding et al. (2017), Principal Component Analysis (PCA) Zhou et al. (2020), and Moving average smoothing (MA) algorithm are used to identify mine water inrush independently or combined with algorithm modeling. In the experiment, the training data was randomly selected, and the experiment was repeated three times independently. The experimental results are the average of three times, as shown in Figure 8.
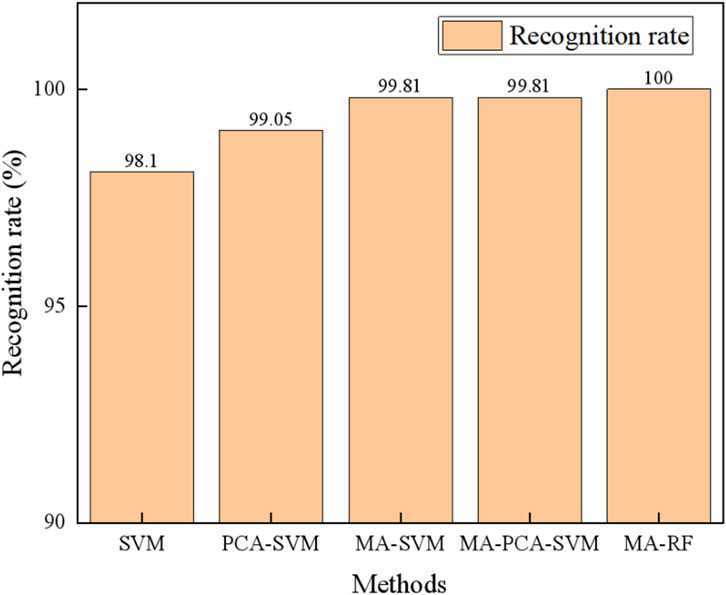
Figure 8. Comparison with traditional recognition methods.
In Figure 8, when only SVM algorithm is used to identify mine water inrush, the spectral data has the interference of redundant information, and the recognition accuracy is the lowest 98.1
4 Conclusion
This study proposes a laser induced fluorescence method for identifying mine water sources, which combines the identification model of random forests. Firstly, a LIF spectral acquisition system is established, and different spectral data are obtained by laser irradiation of water inrush samples. The original samples were collected from sandstone water and goaf water in a coal mine in Huainan, and the two types of water were mixed in different proportions to form a total of seven water samples. The laser induced fluorescence spectra of the seven water samples were identified and analyzed.
Then, smooth preprocessing of spectral data using different processing methods. Moving average smoothing (MA),Savitzky-Golay Smoothing (SG), First derivative (FD), and Second derivative (SD) methods are used to preprocess the original spectral data to reduce the noise and interference information existing in the original spectral data. By comparison, the Moving average smoothing (MA) method has high classification accuracy and is the final method for noise reduction. Based on the feature importance analysis of RF for fluorescence spectra at different wavelength positions, when the threshold is set to 0.1, the minimum classification error is 0. When the number of characteristic wavelengths is selected, and the best classification effect is obtained. Finally, compared with SVM, PCA-SVM, MA-SVM, and MA-PCA-SVM, the MA-RF algorithm reaches 100
The experimental analysis shows that it is feasible to use RF combined with laser-induced fluorescence technology for prediction and evaluation of mine water inrush. Compared with traditional hydrochemical analysis, principal component analysis, and dynamic water level analysis methods,Laser-induced fluorescence technology can achieve non disturbance, real-time in-situ measurement, and fluorescence spectroscopy analysis has advantages such as high sensitivity and fast speed. The RF recognition model constructed using MA preprocessed spectral data has the best recognition effect on water samples. This is due to the different effects of the four preprocessing methods on spectral data. SG mainly eliminates the influence of large scale differences in spectral data, MA is used to eliminate random noise and improve signal-to-noise ratio, while FD and SD mainly reduce the influence of uneven distribution; The MA preprocessing method performed the best in this work. The MA-RF classification model has good performance in identifying water sources. Compared to the other three SVM models, PCA-SVM, MA-SVM, and MA-PCA-SVM, the training accuracy is the best. It is providing new exploration and improvement for artificial intelligence in identifying water sources in mines.
Going forward, three critical areas need to be explored further. First, in the subsequent experiments, we will continuously expand the research on coal mining areas and the categories of aquifer water samples, and improve the model database. Because the water source identification model for coal mines requires a large number of representative aquifer water samples as the foundation, in order to make the model have the best adaptability and reliability. Second, given that the hydrochemical analysis method has accumulated a lot of experience, in practical analysis, comprehensive water source identification research can be carried out by adding online measurement of pH value, conductivity, etc., as well as measuring water pressure and inflow as characteristic values, and conducting water source warning research based on various data. Finally, we should investigate more effective methods for determining the weights of weighted classifiers to enhance the predictive performance of the model.
Data availability statement
The raw data supporting the conclusion of this article will be made available by the authors, without undue reservation.
Author contributions
XM: Methodology, Writing–original draft. PY: Data curation, Writing–review and editing. KW: Conceptualization, Investigation, Software, Writing–review and editing.
Funding
The author(s) declare that no financial support was received for the research, authorship, and/or publication of this article.
Conflict of interest
The authors declare that the research was conducted in the absence of any commercial or financial relationships that could be construed as a potential conflict of interest.
Publisher’s note
All claims expressed in this article are solely those of the authors and do not necessarily represent those of their affiliated organizations, or those of the publisher, the editors and the reviewers. Any product that may be evaluated in this article, or claim that may be made by its manufacturer, is not guaranteed or endorsed by the publisher.
References
Bukin, O., Proschenko, D., Alexey, C., Korovetskiy, D., Bukin, I., Yurchik, V., et al. (2020). New solutions of laser-induced fluorescence for oil pollution monitoring at sea. Photonics (MDPI) 7, 36. doi:10.3390/photonics7020036
Ceccato, R., Chicco, A., and Diana, M. (2021). Evaluating car-sharing switching rates from traditional transport means through logit models and random forest classifiers. Transportation Planning and Technology 44, 160–175. doi:10.1080/03081060.2020.1868084
Czarnecki, M. A. (2015). Resolution enhancement in second-derivative spectra. Applied spectroscopy 69, 67–74. doi:10.1366/14-07568
Ding, S., Zhang, N., Zhang, X., and Wu, F. (2017). Twin support vector machine: theory, algorithm and applications. Neural Computing and Applications 28, 3119–3130. doi:10.1007/s00521-016-2245-4
Ghasemi, F., Parvin, P., Motlagh, N. S. H., and Abachi, S. (2017). Lif spectroscopy of stained malignant breast tissues. Biomedical Optics Express 8, 512–523. doi:10.1364/BOE.8.000512
Goehry, B., Yan, H., Goude, Y., Massart, P., and Poggi, J.-M. (2021). Random forests for time series. doi:10.57805/revstat.v21i2.400
Gupta, C., Kuchibhotla, A. K., and Ramdas, A. (2022). Nested conformal prediction and quantile out-of-bag ensemble methods. Pattern Recognition 127, 108496. doi:10.1016/j.patcog.2021.108496
Hu, F., Zhou, M., Yan, P., Li, D., Lai, W., Zhu, S., et al. (2019). Selection of characteristic wavelengths using spa for laser induced fluorescence spectroscopy of mine water inrush. Spectrochimica Acta Part A Molecular and Biomolecular Spectroscopy 219, 367–374. doi:10.1016/j.saa.2019.04.045
Huang, P. H., and Chen, J. S. (2011). Prediction of water inrush from coal floor based on Fisher discriminant analysis. Applied Mechanics and Materials 71, 4211–4214. doi:10.4028/www.scientific.net/amm.71-78.4211
Huang, H., and Wang, X. (2018). Groundwater-mixing mechanism in a multiaquifer system based on isotopic tracing theory: a case study in a coal mine district, china. Geofluids 2018, 1–10. doi:10.1155/2018/9549141
Hwang, S.-W., Chung, H., Lee, T., Kim, J., Kim, Y., Kim, J.-C., et al. (2023). Feature importance measures from random forest regressor using near-infrared spectra for predicting carbonization characteristics of kraft lignin-derived hydrochar. Journal of Wood Science 69, 1–12. doi:10.1186/s10086-022-02073-y
Jin, Q., Yu, L., Lavery, J. E., and Fang, S.-C. (2012). Univariate cubic l 1 interpolating splines based on the first derivative and on 5-point windows: analysis, algorithm and shape-preserving properties. Computational Optimization and Applications 51, 575–600. doi:10.1007/s10589-011-9426-y
Karabadji, N. E. I., Korba, A. A., Assi, A., Seridi, H., Aridhi, S., and Dhifli, W. (2023). Accuracy and diversity-aware multi-objective approach for random forest construction. Expert Systems with Applications 225, 120138. doi:10.1016/j.eswa.2023.120138
Kotsiantis, S. (2011). Combining bagging, boosting, rotation forest and random subspace methods. Artificial intelligence review 35, 223–240. doi:10.1007/s10462-010-9192-8
Li, G., Wang, X., Meng, Z., and Zhao, H. (2014). Seawater inrush assessment based on hydrochemical analysis enhanced by hierarchy clustering in an undersea goldmine pit, china. Environmental earth sciences 71, 4977–4987. doi:10.1007/s12665-013-2888-8
Li, L., Lei, T., Li, S., Xu, Z., Xue, Y., and Shi, S. (2015). Dynamic risk assessment of water inrush in tunnelling and software development. Geomechanics and engineering 9, 57–81. doi:10.12989/gae.2015.9.1.057
Liu, W. T., Liu, S. L., and Sun, Y. S. (2015). Risk evaluation of water inrush from coal floor based on bp neural network. Applied Mechanics and Materials 744, 1728–1732. doi:10.4028/www.scientific.net/amm.744-746.1728
Mantas, C. J., Castellano, J. G., Moral-García, S., and Abellán, J. (2019). A comparison of random forest based algorithms: random credal random forest versus oblique random forest. Soft Computing 23, 10739–10754. doi:10.1007/s00500-018-3628-5
Oseke, F. I., Anornu, G. K., Adjei, K. A., and Eduvie, M. O. (2021). Assessment of water quality using gis techniques and water quality index in reservoirs affected by water diversion. Water-Energy Nexus 4, 25–34. doi:10.1016/j.wen.2020.12.002
Paing, M. P., Hamamoto, K., Tungjitkusolmun, S., Visitsattapongse, S., and Pintavirooj, C. (2020). Automatic detection of pulmonary nodules using three-dimensional chain coding and optimized random forest. Applied Sciences 10, 2346. doi:10.3390/app10072346
Parcha, S. K., Sabnis, S. V., and Saraswati, P. K. (2007) Taxonomic application of classification and regression tree (cart) and random forests (rf): a case study of middle cambrian trilobites. Geological Society of India, 70 (6), 1033–1038. doi:10.1111/j.1752-1688.2007.00132.x
Parras-Berrocal, I. M., Vázquez, R., Cabos, W., Sein, D. V., Álvarez, O., Bruno, M., et al. (2022). Surface and intermediate water changes triggering the future collapse of deep water formation in the north western mediterranean. Geophysical Research Letters 49, e2021GL095404. doi:10.1029/2021GL095404
Quadrianto, N., and Ghahramani, Z. (2014). A very simple safe-Bayesian random forest. IEEE transactions on pattern analysis and machine intelligence 37, 1297–1303. doi:10.1109/TPAMI.2014.2362751
Santra, B., Paul, A., and Mukherjee, D. P. (2020). Deterministic dropout for deep neural networks using composite random forest. Pattern Recognition Letters 131, 205–212. doi:10.1016/j.patrec.2019.12.023
Schettino, B. M., Duque, C. A., and Silveira, P. M. (2016). Current-transformer saturation detection using savitzky-golay filter. IEEE Transactions on Power Delivery 31, 1400–1401. doi:10.1109/TPWRD.2016.2521327
Si-ying, C., Yi-wen, J., Yu-rong, J., He, C., Wen-hui, Y., Yu-peng, L., et al. (2022). Classification and recognition of adulterated manuka honey by multi-wavelength laser-induced fluorescence. Spectrosc. Spectr. ANALYSIS 42, 2807–2812. doi:10.3964/j.issn.1000-0593(2022)09-2807-06
Stevens, F. R., Gaughan, A. E., Linard, C., and Tatem, A. J. (2015). Disaggregating census data for population mapping using random forests with remotely-sensed and ancillary data. PLOS ONE 10, 01070422–e107122. doi:10.1371/journal.pone.0107042
Wu, Q., Liu, Y., Liu, D., and Zhou, W. (2011). Prediction of floor water inrush: the application of gis-based ahp vulnerable index method to donghuantuo coal mine, China. Rock Mechanics and Rock Engineering 44, 591–600. doi:10.1007/s00603-011-0146-5
Zhang, H., He, Y., Tang, C., Ahmad, B., and Han, L. (2009). Application of an improved flow-stress-damage model to the criticality assessment of water inrush in a mine: a case study. Rock Mechanics and Rock Engineering 42, 911–930. doi:10.1007/s00603-008-0004-2
Zhou, W., Liu, H., Xu, Q., Li, P., Zhao, L., and Gao, H. (2020). Glycerol’s generalized two-dimensional correlation ir/nir spectroscopy and its principal component analysis. Spectrochimica Acta Part A Molecular and Biomolecular Spectroscopy 228, 117824. doi:10.1016/j.saa.2019.117824
Keywords: laser induced fluorescence spectroscopy, mine water source, water source identification, random forest, preprocess
Citation: Ma X, Yan P and Wang K (2024) Identification of mine water source by random forest combined with laser-induced fluorescence spectra. Front. Environ. Sci. 12:1392496. doi: 10.3389/fenvs.2024.1392496
Received: 27 February 2024; Accepted: 01 July 2024;
Published: 26 July 2024.
Edited by:
Ahmed El Nemr, National Institute of Oceanography and Fisheries (NIOF), EgyptReviewed by:
Zhenkun Liu, Nanjing University of Posts and Telecommunications, ChinaMohammad Yazdi, Shahid Beheshti University, Iran
Copyright © 2024 Ma, Yan and Wang. This is an open-access article distributed under the terms of the Creative Commons Attribution License (CC BY). The use, distribution or reproduction in other forums is permitted, provided the original author(s) and the copyright owner(s) are credited and that the original publication in this journal is cited, in accordance with accepted academic practice. No use, distribution or reproduction is permitted which does not comply with these terms.
*Correspondence: Pengcheng Yan, cGN5YW4xOTg4QDEyNi5jb20=