 Shicheng Feng
 Weimin Wang2*
 Renliang Huang
 Rongxin Su
- 1Key Laboratory of Ocean Observation Technology of Ministry of Natural Resources, School of Marine Science and Technology, Tianjin University, Tianjin, China
- 2Zhejiang Institute of Tianjin University, Ningbo, Zhejiang, China
This study summarized and evaluated the cost-benefit analysis methods for typical water environment pollution control measures in China. We conducted a comprehensive comparison of these measures, whose advantages and disadvantages were examined, so the application models and characteristics can be delved into. Through integrating methods and analyzing application cases, we refined a combination of measures with high efficiency and low cost in controlling China’s water environment. In our analysis of cost-benefit, we emphasized the importance of implementing scientifically designed control measures and employing rigorous methods to addressing water environment pollution. In order to achieve rapid response and efficient treatment of China’s environmental problems, we advocated for establishing a cross regional pollution control mechanism. That is, the collaborative platform and scientific suggestions for all participants in this field should be provided, through interdisciplinary integration, development of domestic models, and expansion of databases.
1 Introduction
Water resources are essential for the development of human society. With the rapid development of social economy and the continuous advancement of urbanization process, the problem of water environment pollution in Rivers and Lakes in China has become increasingly prominent. 75% of lakes in China have experienced varying degrees of eutrophication (Yang, 2018). A survey conducted in 118 large and medium-sized cities in China revealed a concern in trend in groundwater quality. From 2012 to 2017, the proportion of groundwater with excellent and good water quality declined, while the proportion of poor-quality groundwater increased. Between 2018 and 2021, less than 15% of China’s groundwater met the criteria for Class I–Class III quality, while over 85% fell into the Class IV–Class V categories. Additionally, groundwater contamination has been observed in 11 cities, with severe pollution accounting for approximately 40% (Xu, 2014; Yang, 2023; Zeng and Wu, 2023). Water pollution not only diminishes the functionality of water bodies but also exacerbates water resource shortages, impeding the implementation of China’s sustainable development strategy. The article mainly elaborates on the research work and future development suggestions of China’s control of non-point source pollution in water environment.
In the 1980s, China began to conduct research and investigation on the eutrophication of reservoirs and lakes, and carried out exploration and planning for river water quality control, including research on non-point source pollution in major cities such as Beijing. With the acceleration of industrialization and urbanization, more and more socio-economic factors are being considered for their impact on non-point source pollution, which exacerbates the damage to the ecological environment and increases the degree of agricultural non-point source pollution (Sun et al., 2011; Liu et al., 2023). At the same time, the country has neglected the control of pollution caused by agricultural development, and effective prevention and control of agricultural non-point source pollution is also a major challenge faced by local governments in China under the background of rural revitalization (Tang and Li, 2023).
Water pollution in China is a significant issue, with 90% of cities suffering from severe pollution, and 60%–70% of water shortages in southern cities being attributed to pollution (Chen, 2013; Yang, 2018; Yan, 2020). The adverse effects of non-point source pollution caused by urban runoff erosion are becoming increasingly severe. Due to the complexity of its composition, randomness of occurrence, intermittency of emissions, widespread harm, and difficulty in research and prevention, it has become a top priority in water environment pollution research, attracting extensive research and high attention from scholars and urban managers (Ma et al., 2021; Ma and Zhao, 2022).
In summary, it is urgent to study the control and treatment of non-point source pollution in water environment and the sustainable development of environmental economy.
2 Analysis of water pollution source types and research trends
The reasons for the deterioration of water environment quality usually include two aspects. Firstly, point source pollution directly from pipeline wastewater discharge, including household, industrial, and commercial water use; The second is non-point source pollution, which can be further divided into agricultural non-point source pollution and urban non-point source pollution according to their different sources. Rainfall runoff is the main driving force of non-point source polluted water bodies, and it is the driving force and transport carrier of pollution load generation (Wang, 2014; Gossweiler et al., 2021). Under the action of rainfall erosion or surface infiltration, pollutants on the surface merge into receiving water (lakes, rivers, reservoirs, bays, etc.) along with runoff.
In recent years, the government has made significant efforts in controlling water pollution, resulting in effective management and treatment of point source pollution (Rissman and Carpenter, 2015; Peng, 2019). However, non-point source pollution has emerged as a prominent issue and has become a primary factor in water pollution worldwide. The occurrence of non-point source pollution is unpredictable, making it challenging to monitor, control, and treat due to uncertainties regarding its source, quantity, and complex processes and mechanisms (Xia et al., 2020; Xue et al., 2020). There are significant differences between urban non-point source pollution and agricultural non-point source pollution control in terms of research areas, governance measures, and cost-benefit impacts (Sousa et al., 2021).
2.1 Agricultural non-point source pollution
Among various non-point source pollution problems, agricultural non-point source pollution has become the main source of water pollution, and is one of the most hidden and difficult problems to solve in pollution control (Ding, 2019). The main factors affecting agricultural non-point source pollution include economic development trends, land use patterns, agricultural cultivation patterns, fertilizer application, and natural environmental conditions.
To control agricultural non-point source pollution, the “3S (Remote sensing, Geography information systems, Global positioning systems)” technology, combining the natural characteristics of agricultural non-point source areas with social and economic development factors, can be used to construct the simulation and ecological regulation model for water and soil processes in a watershed. This model enables the analysis of spatiotemporal distribution characteristics of pollution loads in receiving water, identification of key pollution source areas, and the implementation of appropriate management measures in these areas. Evaluating the benefit of Best Management Practices (BMPs) in reducing agricultural non-point source pollution in key source areas is an essential approach. Researchers can establish optimal management measures for agricultural non-point source pollution in specific river basins based on local conditions, providing theoretical and technical support for local prevention and control of non-point source pollution (Geng et al., 2019; Gu et al., 2021).
2.2 Urban non-point source pollution
The rapid progress of urbanization has led to the expansion of impermeable surfaces such as roofs and roads in urban areas, resulting in higher runoff and peak runoff, thereby increasing urban flood risk and water quality degradation (Chen et al., 2004; Snodgrass et al., 2008; Hou J. et al., 2020). When runoff forms, pollutants enter the receiving water along with surface runoff, and when the receiving water is exposed to human production and living environment for a long time, it can bring great risks to human health (Deng, 2020; Morabito et al., 2021).
The United States first proposed the concept of “Low Impact Development (LID) Rainwater System Construction” to address urban non-point source pollution, which involves planning and deploying dispersed treatment facilities at the source to address hydrological and water quality issues, and has been widely applied (Tan and Ding, 2014; Sun, 2020). LID systems can effectively absorb, store, and purify rainwater during rainfall events and utilize the purified rainwater during periods of water scarcity, promoting the sustainable recycling of rainwater resources. In the context of urban non-point source pollution control, BMPs combined with LID rely on measures such as rainwater ponds, artificial wetlands, and infiltration ponds to manage rainwater and control pollutants (Geng, 2020; Rong et al., 2022). The implementation of LID-BMPs and the construction of reservoirs are effective approaches to address urban stormwater problems, promote the efficient use of urban energy, and ensure the stability and sustainable development of urban landscapes in China (Hou J. et al., 2020).
Currently, China is in the initial stage of controlling urban non-point source pollution. Universities and residential areas, as integral parts of cities, can contribute to the development of sponge cities by implementing the planning and development principles of sponge cities. By addressing local rainwater pollution and flood issues during construction and maintenance, these areas can facilitate the transition from point-based to area-based promotion of sponge city construction (Wang, 2020). In the past, water environment BMPs mainly focused on mitigating runoff pollution and restoring hydrological conditions at the process and end stages, but fell short of fully restoring the pre-development state (Rong et al., 2022; Zhang et al., 2023). Therefore, the implementation of low-impact development facilities is essential in controlling urban non-point source pollution in catchment areas (Mohammad et al., 2022). This research emphasizes the significance of BMPs and the System for Urban Stormwater Treatment and Analysis Integration Model (SUSTAIN) as the core components. We argued that the establishment of BMPs and rainfall runoff planning system, simulation based on different scenarios, and optimization of cost-benefit to determine the optimal scheme, provide a scientific basis for the quantitative analysis and decision-making of urban surface runoff pollution.
3 Main types and current situation of receiving water
3.1 Rivers and tributaries
According to the 2022 China Ecological Environment Status Bulletin, the seven major water bodies in China are severely polluted, with about 1/4 of freshwater drinking water sources failing to meet the national standard for healthy drinking water, and 12.1% of them are classified as V ∼ VI water. Due to the lack of sufficient technical means to deal with the harsh and complex on-site inspection conditions and the lack of implementation of a working mechanism for data sharing and cooperation among various departments, the research on the pollution status of river tributaries only focuses on the major water systems. The coverage of pollution level surveys in a large number of medium and small-scale rivers and their tributaries are not comprehensive, thus the above data cannot truly reflect the overall water environment quality of China’s entire river basin.
3.2 Reservoir
Reservoirs are crucial for regulating river flows and urban runoff. Reservoirs themselves can store water with lower hardness, but their wide surface, slow flow rate, strong settlement, and poor dilution and mixing ability can lead to excessive growth of algae, and then cause eutrophication (Yang et al., 2023). The soil around the reservoir is susceptible to pollution caused by vehicles, industrial activities, and improper agricultural activities. Especially when soil erosion is strong due to fertilizer pollution or runoff erosion, rainwater can bring these pollutants into the reservoir (Zhao and Yu, 2021). With the completion of large-scale water diversion and storage projects like the South-to-North Water Diversion Project in China, reservoirs have become vital intermediate regulating reservoirs for water resource allocation. This project places higher demands on the protection of reservoir water quality and water environment management (Li M. H., 2019).
4 Optimization of BMPs for cost-benefit analysis
BMPs are widely recognized as effective tools for reducing non-point source pollution (Leng et al., 2022). Achieving efficient and cost-effective BMPs at the watershed level remains an ongoing challenge. It is crucial to consider the trade-offs between environmental and economic goals. The effectiveness of BMPs is influenced by the complex interactions among environmental factors and the limitations of local resources (Zhou and Wang, 2019; Jamshidi et al., 2020). To protect and improve the environment, it is necessary to further explore the impacts of BMPs and develop multi-objective combination measures. Conducting a effectiveness analysis can assist decision-makers in planning and providing the highest level of environmental protection with limited resources and funding. BMPs specifically refer to “measures, operational procedures, or methods that can prevent or reduce water resource pollution, primarily including engineering and non-engineering measures, as well as operational and maintenance procedures.” The research mainly focuses on simulating the ecological control effects of BMPs and evaluating their cost-benefit as the basis for selecting preferred solutions. The technical roadmap is shown in Figure 1.
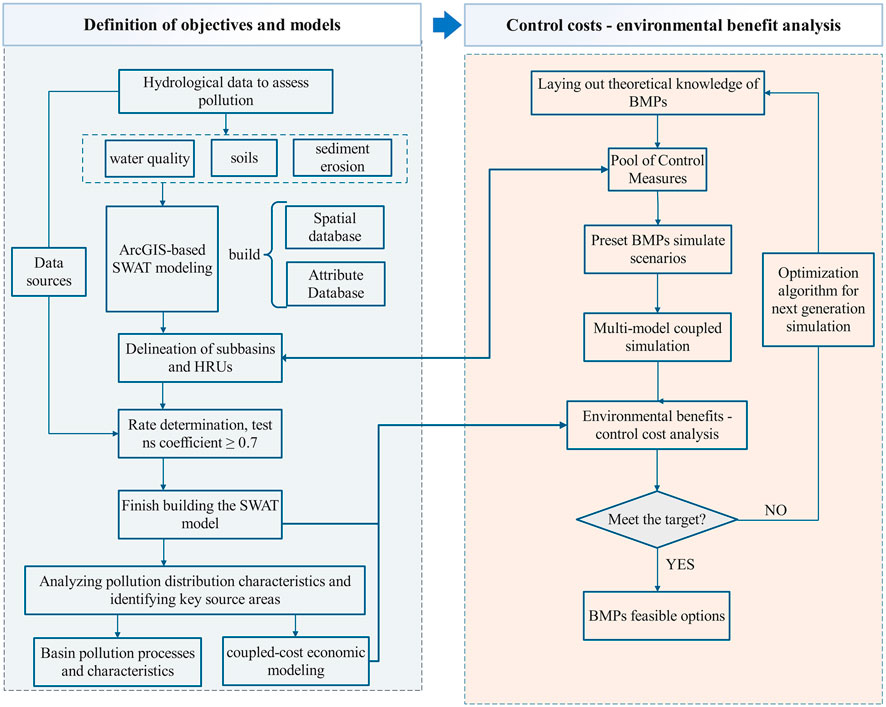
Figure 1. Roadmap for cost-benefit analysis of water environmental pollution BMPs.
4.1 Main measures and effects of BMPs
Engineering measures refer to weaken the intensity of pollutant migration process by adjusting their runoff and sediment flow rates, increasing infiltration rates, and reducing flood peaks, also known as interception measures. Non-engineering measures mainly control the source of pollution, reduce the production of pollutants, and achieve the goal of controlling non-point source pollution. Non-engineering measures, also known as source control measures, are important component of agricultural non-point source pollution management measures (Yin, 2017; Xue et al., 2020).
4.1.1 Measures for controlling agricultural non-point source pollution
(1) Engineering measures
Due to the fact that the main carriers of agricultural non-point source pollutants are sediment and runoff, the amount of sediment and runoff pollutants entering the river can be greatly reduced through the implementation of engineering measures, thereby achieving the effect of river and lake management. Specific measures include vegetation buffer zones, grassy river channels, sedimentation ponds, wetlands, slope farmland conversion to forests, afforestation, and terraced fields (O’Hogain and Mccarton, 2018).
Studies have been conducted to evaluate the effectiveness of grass-planted waterway measures in reducing non-point source pollution. For example, Zhang et al. (2014) used the Soil Water Assessment Tool (SWAT) model to assess the impact of grass-planted waterways on non-point source pollution in the Xiangxi River basin of the Three Gorges Reservoir area. The study indicated that grass planting waterways can effectively control agricultural non-point source pollution, particularly in reducing total phosphorus pollution. Furthermore, Shen et al. (2015) investigated the reduction effect of grass planting on surface source pollutants in river channels by simulating rainfall runoff. The results demonstrated that this measure had an interception effect of over 90% on sediment and a reduction rate of over 70% on nitrogen and phosphorus.
Vegetation buffer zones are an effective means of reducing source pollution. However, research has shown that the width of these buffer zones does not always directly correlate with the reduction rate of pollutants. In China, it is a common practice to use buffer zones as a measure for pollution control (Fu et al., 2019; Carolus et al., 2020). Buffer zones’ effectiveness in pollutant removal depends on factors like surface type, vegetation, and slope. The width of the buffer zone does not have a linear relationship with pollutant removal rate. Therefore, determining the appropriate width is crucial based on specific regional conditions. The effectiveness and scope of measures may not always correlate linearly. Some measures may become less effective as their intensity or width increases. These findings provide valuable guidance for policy-making and modeling. Decision-makers should consider achieving small changes on a larger scale and reducing fertilizer use for pollution control.
In addition to engineering measures such as grass-planted river channels and vegetation buffer zones, other methods like artificial wetlands, terracing projects, and afforestation have shown positive effects in controlling surface source pollution (Fang, 2014; Ruan et al., 2015; Liu et al., 2018; Li et al., 2022). Wan et al. (2012) found that artificial wetlands have the highest overall reduction of various pollutants and exhibit good stability in controlling non-point source pollution. Chen. (2015) conducted a study using the Hydrological Simulation Program Fortran (HSPF) model and integrated artificial wetland technology to analyze the reduction effect of different measures on nutrient pollution in a watershed. They found that canna and water hyacinth have strong tolerance to harmful components in agricultural wastewater and possess high absorption capacity for nitrate nitrogen. Liu et al. (2014) found that afforestation is particularly effective in reducing total phosphorus levels, based on the SWAT model.
(2) Non-engineering measures
Non-engineering measures play a crucial role in controlling agricultural non-point source pollution. These measures include various tillage management practices (such as contour tillage, vegetation coverage, conservation tillage, and rotation tillage), effective fertilizer and nutrient management, reduced pesticide use, and residue cover measures (Liang, 2013; Li, 2021; Huang et al., 2022).
Among these measures, fertilizer management is considered a top priority in pollution control (Liu et al., 2019). For instance, Xu et al. (2019) developed a cost-benefit optimization model for water environment management in the Xiaoqing River Basin. By minimizing costs while ensuring water quality compliance, they found that reducing fertilization by 2,900 tons could lead to a reduction of 2,916 tons of pollutants. Similarly, Shi et al. (2021) utilized the Non-Dominated Sorting Genetic Algorithm II (NSGA-II) to simulate and optimize multiple objectives. They concluded that reduced fertilization and returning farmland to forest were suitable measures for the back slope and valley areas of the Zhongtianshe watershed, validating the effectiveness and rationality of these practices.
Tillage management measures are implemented through various cultivation techniques to weaken the conversion ability of non-point source pollutants at their source, reduce the loss of pollutants in rainfall runoff, and maintain soil fertility (Fang, 2014). Research by Liu et al. (2014) has shown that tillage management is particularly effective in reducing total nitrogen. By combining measures such as returning to the forest, no tillage, contour tillage, and reducing weight by 0.8 times, significant reductions in annual nitrogen and phosphorus loads can be achieved. Among different tillage methods, no tillage is considered more environmentally friendly, while contour tillage is more cost-benefit. Huang (2020) implemented stubble cover tillage and contour tillage measures in the Danjiang River Basin, resulting in reduction rates of 15.26% and 11.26% for total nitrogen, and reduction rates of 25.23% and 20.23% for total phosphorus, respectively. Yang et al. (2019) used the SWAT model to implement no tillage measures in the Guishui River, observing a reduction rate of around 10% for nitrogen and phosphorus.
In summary, both engineering and non-engineering measures have a certain effect in reducing agricultural non-point source pollution, although the effectiveness of individual measures is limited. Through the combination of different management measures, non-point source pollution can be reduced to a greater extent. Finding the optimal combination of management measures is a research hotspot, considering not only the reduction effect on non-point source pollution but also the cost-benefit of these measures. The economic cost of BMPs includes construction and maintenance costs, while environmental benefits mainly consider the reduction of non-point source pollution.
4.1.2 Urban non-point source pollution control measures
The 2014 “Technical Guidelines for Sponge City Construction” and the 2022 “Notice on Further Clarifying the Relevant Requirements for Sponge City Construction” of China, emphasized the need for cities to adopt a comprehensive planning and design approach to address pollution. This approach involves controlling pollution at its source, reducing transmission processes, and enhancing end treatment. These measures not only help prevent waterlogging but also enable the efficient utilization of rainwater resources (Chen, 2013; Luo and Li, 2014; Li et al., 2020). To address the random and indirect discharge of urban non-point source pollution, a combination of engineering and non-engineering measures is primarily employed for centralized pollution source control (Table 1).
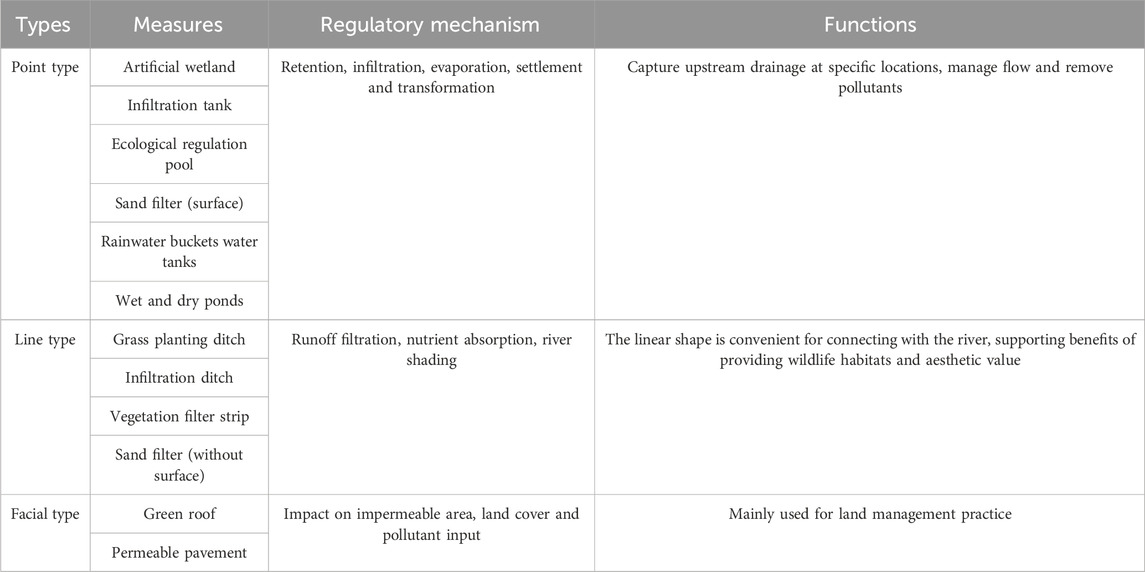
Table 1. Urban non-point source pollution control measures [Revised from Wu Y. (2022)].
Engineering measures: engineering and technical measures for controlling urban non-point source pollution involve various infrastructure projects that combine green rainwater facilities with gray facilities. These measures aim to address urban non-point source pollution and include the construction of sedimentation tanks, leakage pits, porous roads, reservoirs, permeable paving, rainwater gardens, green roofs, grass planting ditches, and other drainage projects (Qiu et al., 2020). These measures can be categorized into three main aspects: 1) controlling pollution sources to minimize pollutants in rainwater runoff from the source: 2) Control the diffusion pathways of pollutants by studying the transport and diffusion patterns of pollutants in rainwater runoff, taking appropriate measures to reduce the amount of pollutants discharged into underground or surface water bodies: 3) Terminal governance involves the degradation of pollutants brought into water by runoff through natural ecological technology or artificial purification technology.
Non-engineering measures: non-engineering measures involve implementing various management strategies and practices to complement and support the technical measures in controlling urban non-point source pollution. These measures focus on utilizing and protecting ecological spaces within cities, leveraging the natural absorption and slow-release effects of built environments, and promoting the formation of an ecological and sustainable urban water circulation system.
4.2 Cost-benefit of BMPs
In the cost-benefit analysis of environmental governance, the conversion of costs and environmental benefit into actual currencies is a crucial step in conducting a comprehensive cost-benefit assessment. Benefit mainly refers to environmental benefit, namely the reduction of pollutants and the improvement of water quality. The “cost of expenses” of BMPs usually mainly includes research costs, layout costs, and post maintenance costs.
4.2.1 Cost of expenses
The costs of controlling non-point source pollution can be categorized into two aspects: explicit costs, which are evident and fixed, and implicit costs, which are complex, difficult to quantify, and have hidden sources (Kurkalova, 2015). The variation in implicit costs is influenced by factors such as economic patterns, technological levels, and educational levels across different regions. Most countries use model-based approaches to calculate costs, leveraging comprehensive agricultural economic data and mature economic models associated with BMPs. However, due to the lack of relevant economic databases and models in our country, calculations are primarily based on expenditure experience (Jiang et al., 2013).
4.2.2 Benefit exchange
To evaluate ecological benefits, it is necessary to convert the feedback from control measures into quantifiable indicators in order to optimize models and conduct cost-benefit analysis of BMPs in different scenarios. In order to enhance the scientific validity of cost-benefit analysis, various benefit exchange ideas have been developed (Table 2). While the market value method was widely used initially, it was found to have limited comprehensiveness as model accuracy and algorithms improved (Lewis et al., 2020). Methods such as the protection fee method, recovery fee method, shadow engineering method, investigation and evaluation method, and impact path method were also found unsuitable for comparative analysis of multiple scenarios. The opportunity cost method is the most commonly employed approach for converting ecological benefits into actual currency. The way holds an advantage in multi-scenario comparative analysis and is widely utilized in environmental policy assessment (Wei, 2022).
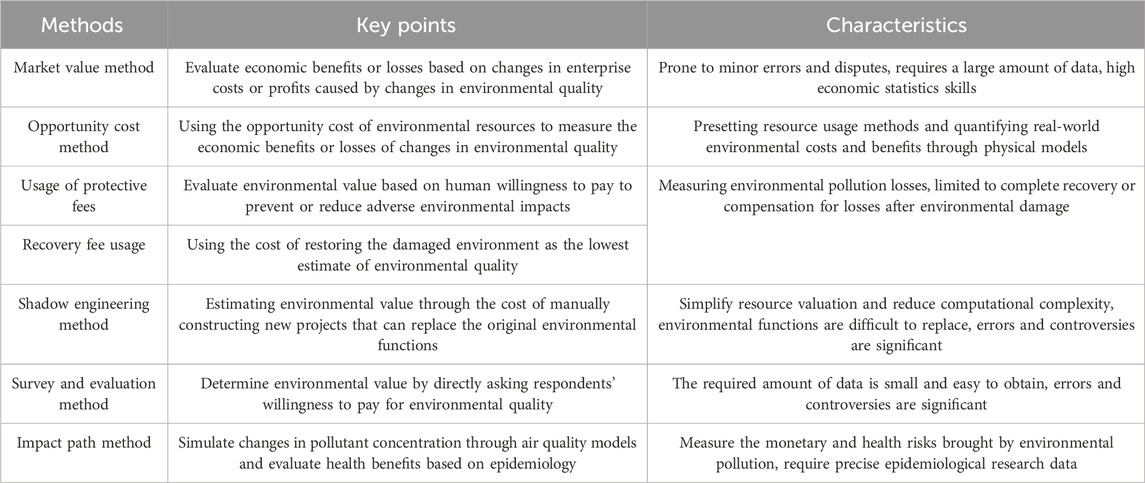
Table 2. Benefit exchange methods [Revised from Gao (2013)].
4.3 BMPs configuration refinement and simulation evaluation
The spatial optimization configuration of BMPs within the watershed is of great significance for the decision-making of comprehensive watershed management. Fully considering the spatial configuration relationship between different BMPs and optimizing the BMPs spatial configuration units is the key to ensuring the effectiveness of the simulation.
4.3.1 BMPs spatial configuration unit
Sub-basins, hydrological response units, plots, farms, slope locations, etc. are often used as spatial configuration units for BMPs (Gao et al., 2018). Initially, plots were widely used as the units for dividing BMPs configurations. However, the excessive subdivision of plots can lead to computational burdens and hinder practical implementation (Gaddis et al., 2014). Wu et al. (2017) found that using plot units may limit the representation of the relationship between upstream and downstream processes on slope surfaces, thereby reducing the effectiveness of China’s watershed management model. The idea of introducing slope morphology units to characterize the basic morphological characteristics of slope terrain has been proposed. In order to further improve the accuracy of configuration, a research approach of overlapping slope positions with land parcels has been formed (Rathjens et al., 2016). Studies conducted by Shi et al. (2021) and Liu et al. (2019) have demonstrated that using slope block units or configurations that incorporate stacked slopes and plots can yield higher pollution reduction effectiveness at similar or lower economic costs, resulting in more reasonable optimized schemes.
4.3.2 BMPs simulation evaluation optimization
The evaluation and optimization research on BMPs primarily relies on the “hydrological model and optimization method” developed by American and Chinese scholars (Geng et al., 2019; Kim and Ryu, 2020). These researchers propose a multi-objective decision-making approach for BMPs, aiming to achieve the lowest cost, highest pollution reduction efficiency, and significant water quality improvement (Chaubey et al., 2010; Ratté-Fortin et al., 2019). To evaluate the effectiveness of BMPs, watershed agricultural non-point source pollution models are commonly used and considered essential for accurate and reliable assessments.
In the evaluation and optimization process, the model initially sets BMPs with ecological control effectiveness as a cost constraint. Then, by employing various optimized algorithms like linear programming and NSGA-II, the search direction of the algorithm is guided through objective functions such as minimizing cost or maximizing pollution reduction. This approach provides a scientific solution for multi-objective evaluation and optimization. Finally, an implementation plan is adjusted and determined (Zhang et al., 2013; Wang, 2016; Chang et al., 2017). The algorithm-based optimization model simulates and selects BMPs with specific and targeted measures, ensuring that the optimal solution is not lost and resulting in the most cost-effective combination of measures (Zhang et al., 2019; Qi et al., 2020; Zhang et al., 2020; Zhang et al., 2022). Over time, as the model’s modules and algorithms are continuously revised and optimized, the credibility of the simulation results increases significantly (Chang et al., 2017; Liu Z. B. et al., 2021; Wu Y., 2022). Table 3 presents an overview of the characteristics and limitations of commonly used models for simulating non-point source pollution.
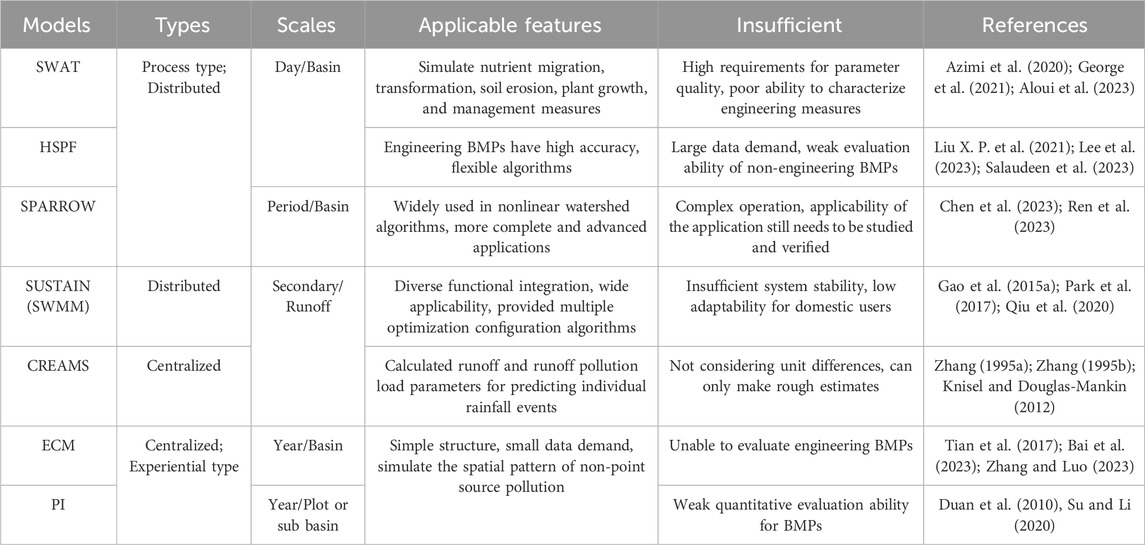
Table 3. Characteristics of commonly used simulation non-point source pollution models.
Models such as SWAT, HSPF, and SUSTAIN have found numerous applications in simulating and predicting non-point source pollution, and they hold significant potential for future development. The SWAT model, for instance, integrates efficient economic modules and benefit algorithms to evaluate the optimization of BMPs in agricultural watersheds. It has become a valuable tool for in-depth research on agricultural non-point source pollution in watersheds, gaining recognition and widespread use among researchers in the same field (Briak et al., 2019; Chang et al., 2021).
The HSPF model possesses two key advantages: comprehensiveness and flexibility. These attributes contribute to achieving high computational accuracy and make it suitable for large-scale agricultural watersheds, intricate urban watersheds, and specific rainfall scenarios (Xie et al., 2022). Due to the model reliance on older data manipulation platforms (BASINS) to obtain comprehensive data, its performance may be compromised, particularly in areas with urbanization and limited data availability. Consequently, the combination of HSPF with BMPs’ effectiveness has been less extensively applied (Chen, 2015; Her et al., 2017).
SUSTAIN has developed a comprehensive system model for urban stormwater treatment and analysis based on the combination of the well-established stormwater management model SWMM. SUSTAIN takes into account the simulation of various BMP types and possesses robust internal simulation capabilities for transporting runoff and associated pollutants. The SUSTAIN model, which combines the NSGA-II algorithm, is widely used and can provide cost-benefit curves for measures under limited objectives and cost conditions These curves facilitate the analysis and selection of the optimal BMPs scheme. (Chung, 2010; Li X. G., 2019; Ling and Dai, 2019; Taghizadeh et al., 2021).
5 Research on non-point source pollution control and application analysis of cost-benefit methods
The distribution of sampling sites for the research case studies on water environmental pollution control in China mentioned in this article is shown in Figure 2. This chapter primarily focuses on the application of multi-attribute decision-making methods in cost-benefit analysis for non-point source pollution control. In agricultural non-point source pollution control, research has found that the combination of information entropy and multi-attribute decision-making methods for cost-benefit evaluation balances the influence of different constraint factors, and can more accurately simulate the effectiveness and cost of single or combination pollution control measures in the watershed. Urban non-point source pollution, as an important pollution control direction at present, has different measures and cost-benefit analysis methods, but the simulation effect of control measures is somewhat similar to the former.
Figure 2. Distribution map of research case studies on water environmental pollution control in China mentioned in this article.
5.1 Analysis of pollution control measures for agricultural non-point sources mainly receiving water
5.1.1 Rivers and tributaries
Traditional research on BMPs for agricultural non-point source pollution has primarily focused on rivers, tributaries, and lakes. Among the most commonly used cost-benefit analysis methods in this context are the Net Present Value (NPV) method and the Cost-Benefit Ratio (CBR) method. For example, Xu et al. (2013) utilized the SWAT model to estimate non-point source loads in the Weinan Canal Basin under different hydrological conditions (high, flat, and dry). They analyzed the spatial distribution characteristics of these loads and compared 47 different BMPs through simulation. And then, they identified the most effective measures for reducing total nitrogen and total phosphorus pollutants, which were the construction of vegetation type ditches. The authors also determined the unit reduction costs for these pollutants. Geng (2012) employed “3S” technology to divide the Huaijiu River into three spatial levels. They used the NSGA-II optimization module in the SUSTAIN system to optimize the cost-benefit of different combinations of BMPs at each level. Their findings revealed that the comprehensive reduction rate of annual pollution load for the two pollutants could reach 65%. Huang et al. (2007) integrated fuzzy comprehensive evaluation and the Pearl growth curve method to develop an ecological benefit analysis method for water pollution control in watersheds. Their approach considered measures targeting point sources, non-point sources, and river pollution. They discounted all economic benefits and costs and arrived at a feasible cost-benefit ratio of 3.68. Shao (2013) conducted on-site research and collected data to analyze the unit investment and return rate of various ecological control project measures. They found that the measures with the highest return rate were landslide control, hedge construction, firewood saving stoves, artificial forest transformation, and fuel forest, in descending order. Among soil and water conservation measures, straw coverage showed the highest return rate. Wang (2021) discovered a correlation between the magnitude of non-point source pollution load in the sub-basin of the Guishui River and the proportion of arable land, forest land, urban and rural construction land, and the distribution of elevation within the sub-basin. Zhang (2021) used the SWAT model to evaluate the effectiveness of engineering measures, such as vegetation buffer zones, in reducing pollutants. They found that these measures achieved a reduction rate of 50%–70%. The researchers also employed cost-benefit ratios to evaluate various BMPs and concluded that engineering measures often provide better environmental and economic benefits.
The analysis of water environment cost-benefit can vary based on the scale of the research basin. Different research methods and techniques can be employed (Table 4). Several key findings have emerged from numerous studies: 1) Combined measures exhibit a stronger reduction effect on water pollution compared to individual measures. 2) Engineering measures, as a whole, have a better overall reduction effect on total phosphorus and total nitrogen pollution loads in watersheds. 3) Process interception shows higher cost-benefit than source control in reducing water pollution. 4) Engineering measures generally have higher cost-benefit compared to non-engineering measures. Among engineering measures, grassy waterways demonstrate the best cost-benefit, while terrace engineering exhibits the worst cost-benefit. Based on these findings, river basin managers can refer to the methods and technologies discussed to develop water pollutant control strategies. These strategies should be tailored to the specific scale and conditions of the research basin, aiming to strike a balance between environmental and economic benefits.
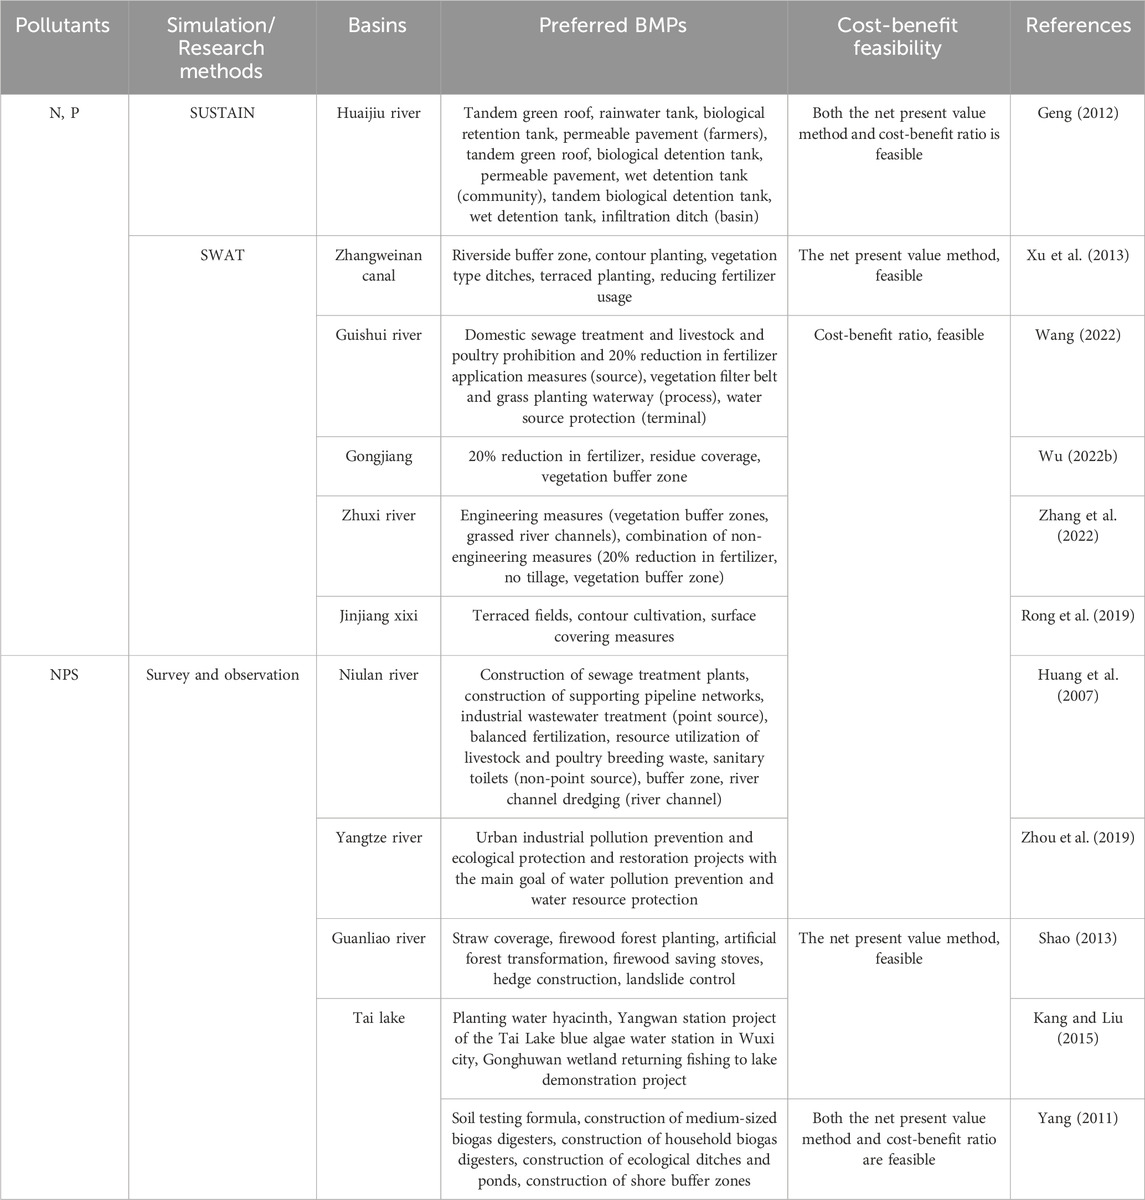
Table 4. Cases of agricultural non-point source pollution control.
5.1.2 Reservoir pollution
Research by Zhang (2010) evaluated the effectiveness of BMPs (wetland and detention pond and grass ditch) and LID measures (vegetation and vegetation retention troughs) in reducing pollution in the Qiankeng Reservoir catchment area. They found that the pollutant removal efficiency of these measures decreases under larger runoff scenarios. It is suggested to employ the NPV method and cost-benefit analysis for preliminary engineering and cost analysis. Wang et al. (2009) conducted a comparative analysis of various pollution control measures. They found that converting farmland into orchards in the Miyun Reservoir catchment area had significant economic benefits. However, changing land use methods required substantial investment and the environmental benefits took time to manifest. Rural household biogas digesters were suitable for long-term pollution control. Riparian vegetation buffer zones had significant environmental benefits and were suitable for areas with scattered pollution sources. Returning farmland to forests, as a fundamental measure for soil erosion control, carried a higher economic benefit risk but was more effective when combined with other measures. These findings highlight the importance of considering runoff conditions and cost-benefit when selecting pollution control measures. Converting farmland into orchards, implementing biogas digesters, and using riparian vegetation buffer zones are recommended strategies for pollution control. Xie (2012) developed corresponding BMPs for farmland (implementing returning farmland to forest, setting contour hedges, implementing less or no tillage practices, and controlling nitrogen fertilizer application), grassland (implementing returning grassland to forest), and rural residents (promoting Guangnong Village biogas digesters) based on the sensitive parameters of the ReNuMa model and the planned annual water quality goals of the watershed. Sun et al. (2017) proposed a comprehensive plan to address the challenges of monitoring and managing non-point source pollution in the Three Gorges Reservoir area. This plan combines source control, migration path interception, and end treatment strategies to effectively control non-point source pollution. The “slope to ladder” or “large cross slope and small slope” limited slope cultivation technology model is recommended due to its suitability in terms of engineering quantity and cost for managing pollution in slope farmland.
Reservoir pollution in the Three Gorges area is influenced by different factors compared to urban areas, and therefore, pollution control measures differ as well. Instead of using LID-BMPs, control measures focus on agricultural non-point source pollution. Implementing land conversion from farmland to forest, practicing less or no tillage, controlling nitrogen fertilizer application, and promoting rural biogas digesters are effective choices. Considering the specific conditions of the reservoir area, pollution control measures are often developed based on dividing pollution stages or areas. Smaller reservoir areas near residential, agricultural, and industrial areas can utilize non-engineering measures, such as land use planning, pollution source management, and agricultural and forestry land management. Engineering measures, such as biological retention ponds, wetland systems, grass ditches, buffer grass belts, grass belt systems, and erosion control blankets, can be employed for effective control.
5.2 Cost-benefit analysis of agricultural non-point source pollution based on multi-attribute decision-making method: taking danjiang as an example
In the context of cost-benefit analysis for environmental control, accurately evaluating the effectiveness of combined measures is often challenging for decision-makers. This difficulty arises from the limited cognitive ability of humans to accurately quantify the weights of influencing factors, as well as the complexity and uncertainty inherent in objective phenomena (Li et al., 2022). To address this issue, researchers have developed a comprehensive evaluation model based on information entropy multi-attribute decision-making. This model incorporates multiple steps to enhance the decision-making process. Firstly, the improved Analytic Hierarchy Process is utilized to determine the subjective weights assigned by decision-makers to each indicator. Then, information entropy theory is employed to determine the objective weights for each indicator. Finally, the subjective and objective weights are combined to obtain comprehensive weights for the final evaluation. By incorporating both subjective and objective weights, this model provides a more accurate evaluation of the effectiveness of decision-making methods. The resulting comprehensive attribute values consider the realistic weights assigned by decision-makers and utilize data as the basis for evaluation. Larger comprehensive attribute values indicate better effectiveness and are suitable for controlling and managing non-point source pollution in larger watersheds (Fu et al., 2015).
In the study conducted by Huang (2020), the researchers focused on the Danjiang River Basin and utilized the multi-attribute decision-making method based on information entropy to evaluate the cost-benefit of various management measures. The findings indicated that the combined BMPs exhibited a higher pollution reduction rate compared to individual measures, suggesting that their implementation should be prioritized. As an individual measure, returning farmland to forests showed a relatively high comprehensive attribute value (0.62), making it suitable for controlling small-scale agricultural non-point source pollution. However, for larger-scale situations, a more effective approach was found to be the combination of terracing engineering, stubble cover cultivation, and grassland waterway BMPs. Building upon Huang Kang’s research, Li et al. (2022) discovered that non-engineering measures had relatively high comprehensive attribute values. Combined BMPs involving stubble cover, terrace engineering, and returning farmland to forest demonstrated the highest comprehensive attribute value (0.86), indicating the best decontamination effect. Regarding the research on pollution areas covering slopes, Wang et al. (2013) considered various factors such as the cost of measures, the extent of farmland occupation, and the control effect. They used the multi-attribute decision-making method based on information entropy to comprehensively evaluate and optimize measures in different slope areas surrounding the Danjiang River Basin. Different measures were proposed for different slope areas, although no further cost accounting verification was conducted. In another study by Yin (2017), the focus was on the impact of measures on pollution reduction and economic costs. The multi-attribute decision-making cost-benefit analysis method based on information entropy provided suggestions based on the scale of the governance area and the slope conditions.
Based on the research findings, the following management measures are recommended for addressing non-point source pollution: 1) The best management measure is to return farmland, grasslands, and forests above 15°C. This approach helps to reduce surface source pollution and is cost-effective. 2) Contour tillage is the most effective method for reducing sediment loss. Stubble cover tillage is effective in reducing the loss of total nitrogen and phosphorus. A combination of contour tillage as the primary method, supplemented by residual stubble cover tillage, is recommended in areas ranging from 15° to 25° slope. 3) In areas with smaller slopes, prioritize the use of low-cost measures. These measures can be cost-effective while still reducing non-point source pollution. 4) In areas with slightly higher slopes, engineering measures primarily based on terracing should be prioritized. Terracing helps to control soil erosion and reduce the movement of pollutants. 5) In areas with large slopes, the main measure is to return farmland to forests. This approach helps to stabilize the soil, control erosion, and reduce non-point source pollution.
5.3 Urban non-point source pollution
In China, the urban non-point source pollution control plan, particularly on campuses, differs from typical watershed control measures and often incorporates LID-BMPs. Despite being introduced relatively late, LID technology has been widely promoted and has achieved significant results nationwide. For instance, Wen (2022) proposed a plant configuration and rainwater treatment model for Hengqin New Area in Zhuhai. They implemented technical facilities like permeable pavement, grass planting ditches, sunken green spaces, and rainwater gardens in the road drainage system. These measures effectively addressed issues related to the quantity, peak flow, and pollution of rainwater runoff. As a result, urban rainwater management capabilities were improved, and the recreational needs of citizens were met. Zhou et al. (2018) analyzed the runoff situation in the old urban area of Zhangjiagang City under different return periods, considering the layout of permeable pavement, rainwater buckets, and sunken green spaces. They found that the combined layout of various LID measures did not simply have a superposition effect on reducing runoff. Permeable pavement had the most significant effect on reducing the runoff coefficient, while rainwater buckets and sunken green spaces had similar effects. Li et al. (2017) established biological detention zones and permeable paving in Tianjin’s central urban area and surrounding districts to control flood peaks and total runoff. The results indicated that LID measures effectively controlled runoff. However, as the design recurrence period increased, the drainage capacity of urban drainage networks decreased. Therefore, optimizing the drainage pipe network and increasing the drainage capacity of river channels were deemed necessary. Chen and Long (2022) evaluated the comprehensive benefits of different spatial layout schemes in a residential area in Beijing. They used a multi-objective function simulation method combining the SUSTAIN model and NSGA-II. Two optimization schemes for LID facility spatial layout, namely permeable pavement and sunken green space, were selected and evaluated for their effectiveness.
The main trend of research on urban non-point source pollution in China is to transform the development of BMPs combined with LID from a single LID measure to a combination measure or a combination with green infrastructure; The research objective has shifted from only considering controlling rainwater and reducing pollutants to comprehensively considering social, economic, and ecological benefits; The evaluation method has changed from a single model to a multidisciplinary comprehensive application. With the gradual development of the national concept of ecological campus construction, the construction of sponge campuses in universities guided by sponge cities can become a good example of testing the effectiveness of sponge cities and an important means of promoting the construction of campus ecological civilization (Wang, 2020). The urban non-point source pollution BMPs in China should be based on their adaptability, with the goal of protecting and restoring the water ecological environment, and promoted by economic preferential policies. Based on the advantages and disadvantages of LID transformation conditions for different land types, different runoff control goals should be set to achieve the goals of ecological restoration and water system governance.
5.4 Cost-benefit analysis of urban non-point source pollution control based on cost-benefit curve
The cost-benefit analysis curve is derived from simulations and calculations using the SUSTAIN model. It represents the relationship between costs and ecological governance for LID-BMPs. Each point on the curve corresponds to a potential solution for the construction and configuration of these measures. The ratio of benefits to costs, indicated by the vertical and horizontal coordinates of each point, determines the cost-benefit of the solution. A smaller ratio signifies a more cost-effective option (Zeng et al., 2020; Azari and Tabesh, 2022). The horizontal axis represents the construction cost for different LID-BMPs configurations, while the vertical axis represents the percentage of pollution reduction achievable by each scheme.
Recent research cases have shown that decision-makers prioritize economic benefits in smaller functional areas like university campuses and residential areas, considering pollution control budgets. In contrast, in larger urban areas, practitioners tend to focus on control plans that offer environmental benefits (Table 5). Yang (2017) used the SUSTAIN model to determine the optimal combination of runoff reduction rates, total suspended solids output, and total nitrogen output reduction rates based on the tangent of the cost-benefit curve. Other researchers, such as Lin (2016) and Wu Z. J. (2022), utilized the Analytic Hierarchy Process and SUSTAIN to establish a urban non-point source pollution control measure comparison and selection system. They optimized the NSGA-II algorithm to meet environmental control objectives and determine the most cost-effective planning plan. Li M. H. (2019) incorporated built-in and customized constraints into the model to obtain suitable spatial configurations for LID-BMPs. Their research showed that the series connection mode of LID-BMPs is more cost-effective than parallel and hybrid connection modes. They also found that there is a cumulative effect of LID on the cost-benefit of BMPs, and once the scale and cost of LID exceed a certain threshold, the runoff reduction rate stabilizes.
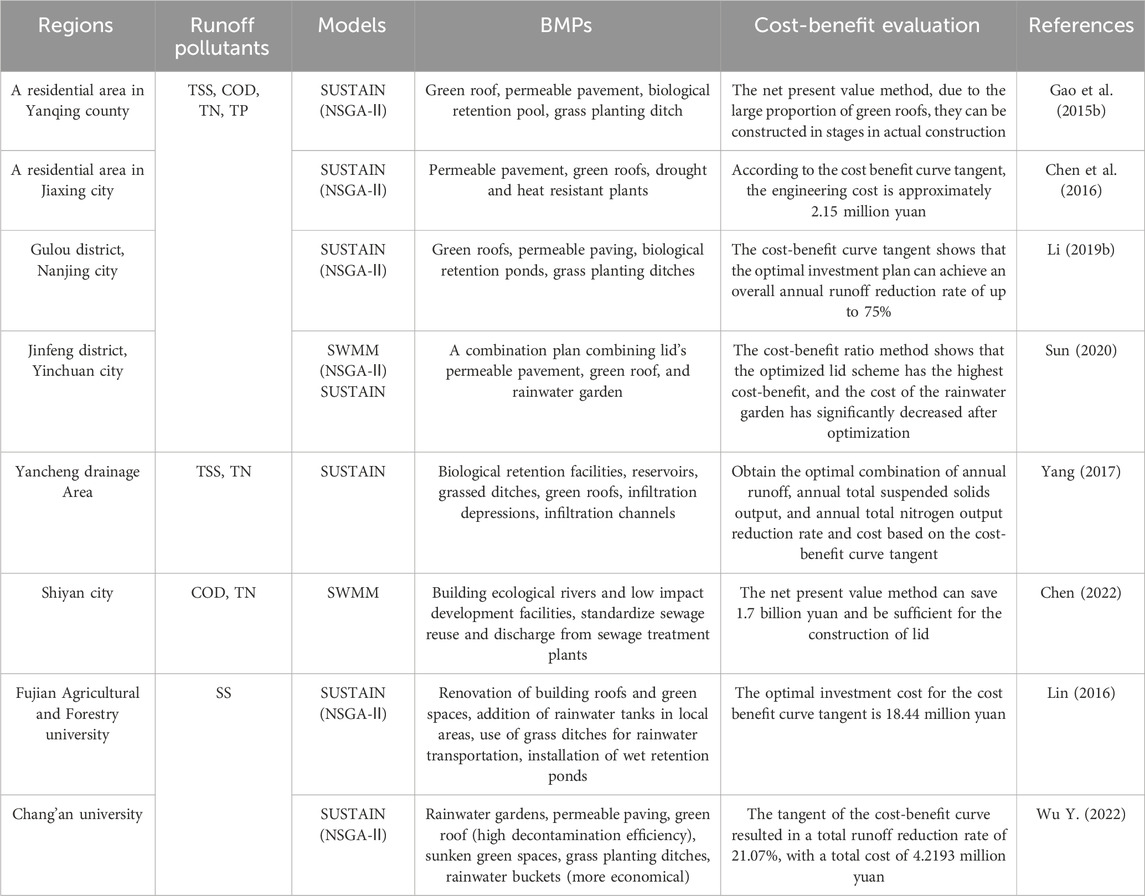
Table 5. Research cases of urban non-point source pollution.
The cost-benefit curve provides a comprehensive qualitative and quantitative analysis of different LID-BMPs configuration schemes. Each point on the curve represents a specific combination of measures, allowing for accurate selection of schemes. This curve is unique in its ability to evaluate the cost-benefit of a single measure before and after optimization, which is not possible with other methods. The line connecting the leftmost points in the graph often represents the most cost-effective focus when considering the scope of the scheme, particularly at the inflection point where the curve transitions from steep to gentle. By selecting the most cost-effective solution from the cost-benefit curve, it is possible to achieve optimal environmental control goals while saving on initial investment costs. This approach creates a win-win situation for both economic and environmental benefits in urban non-point source pollution control. However, it is worth noting that the advantages of cost-benefit analysis using the SUSTAIN model for urban non-point source pollution control have not yet been widely applied to other types of pollution control.
6 Summary and outlook
6.1 Characteristics and optimization direction of BMPs ecological assessment
Currently, BMPs configuration focuses on multi-objective optimization using a “hydrological model optimization algorithm” to evaluate and optimize BMP schemes at the plot or watershed scale. Evaluation methods and characterization indicators are becoming more comprehensive. However, there are several limitations to consider. Firstly, as research scale increases, hydrological and soil erosion processes in river basins are often simplified, leading to incomplete characterization of pollution from small-scale sources. Additionally, the impact of changes in transmission processes on pollutant reduction is not adequately considered. This limits the optimization of BMPs primarily controlled by transmission mechanisms, such as planting and feeding activities. Furthermore, most evaluations are qualitative and lack effective quantification of results. In terms of model research, the integration with actual monitoring data is insufficient. In China, inadequate database construction hinders obtaining optimal solutions for large-scale watersheds, often requiring adjustments based on the actual situation.
Future research should focus on auxiliary verification and validation through actual monitoring to enhance credibility. It is also important to establish a nonlinear relationship between pollutant load reduction in watersheds and water quality improvement. This involves developing and verifying the effectiveness of BMP schemes that combine multiple measures. Building upon this, a multi-objective decision support system can be constructed by integrating measure scheme databases, cost databases, and optimization configuration schemes based on evolutionary algorithms. This system aims to optimize the spatial configuration of BMPs and implement scientifically and efficiently controlled measures. In summary, future research should address these limitations by integrating actual monitoring data, establishing nonlinear response relationships, and developing comprehensive decision support systems to improve the accuracy and feasibility of BMPs configuration.
6.2 Cost-benefit analysis and development strategies for water environmental pollution control
The current cost-benefit analysis methods for water environment pollution control in China mainly include the following four types. The CBR and NPV methods are more accurate for analyzing the cost-benefit of individual control measures. The CBR compares the cost of implementing control measures with the achieved benefits, allowing for direct comparison between different measures. The NPV method takes into account the time value of money by discounting future costs and benefits, providing a more accurate long-term cost-benefit evaluation. The comprehensive attribute value method aims to establish a comprehensive relationship between various ecological indicators and costs. The method considers multiple indicators and their impact on benefits, effectively balancing the influence of different indicators on cost-benefit. However, the cost-benefit curve method requires extensive data on the reduction of different pollution indicators and the cost of investment measures. It also relies on complex system model algorithms. While this method can provide valuable insights, there are limitations in terms of the accuracy of data detection and model simulation compared to real-world conditions.
In summary, although these methods have contributed to the cost-benefit analysis of water environmental pollution control, they still heavily depend on foreign models and databases. It is necessary to continue efforts in developing and improving domestic models and databases to enhance the accuracy and applicability of these analysis methods in the Chinese context. Several researches in China should be carried out: 1) Establish environmental cost-benefit assessment models for various scale standards in the environmental management system should be prioritized. It is crucial to achieve coupling and linkage of different scale models to ensure comprehensive and efficient evaluation. 2) Conduct comprehensive cost-benefit analysis and evaluation is essential to establish a rapid and dynamic feedback mechanism for changes in environmental policy conditions. This will enable timely adjustments and improvements in environmental management strategies. 3) Emphasize the development of computer technology is vital to enhance the efficiency and accuracy of cost-benefit analysis and optimization of BMPs. This will improve the feasibility of cost-benefit analysis methods in practical applications and enable the attainment of multi-objective cost-benefit optimal solutions.
6.3 Macroscopic supervision and control of water environment pollution
The current water pollution control process in China has drawbacks, such as local and departmental divisions. This closed governance model leads to a focus on pollution within specific administrative regions, neglecting overall water conditions and enabling the transfer of pollutants through local protectionism (Tong, 2017). Cost-benefit analysis primarily evaluates economic and engineering policies, but it should also consider regional development and native ecology. Although investment in river basin protection shows long-term benefits, efforts to control polluted river areas need to be increased. To address these issues, China should adopt integrated and collaborative approaches, transcending administrative boundaries and promoting cooperation among regions. This will enhance water pollution control and achieve more sustainable outcomes.
We urge the establishment of a collaborative governance model for water pollution management that considers the entire river basin. This should include an environmental cost-benefit assessment and cross-basin synergy to address agricultural non-point source pollution (Xu et al., 2022). It is important to prioritize emergency response capacity and upgrade industrial sectors while considering the ecological impact of the water environment. By balancing regional differences and promoting a win-win situation between the environment and economy, we can achieve effective water pollution control.
Author contributions
SF: Data curation, Investigation, Methodology, Writing–original draft. WW: Conceptualization, Funding acquisition, Writing–review and editing. RH: Writing–review and editing. RS: Conceptualization, Data curation, Funding acquisition, Supervision, Writing–review and editing.
Funding
The author(s) declare that financial support was received for the research, authorship, and/or publication of this article. The author(s) declare financial support was received for the research, authorship, and/or publication of this article. This work was supported by the Key Project of the National Natural Science Foundation of China (52273272), and Ningbo Natural Science Foundation (2023J394).
Conflict of interest
The authors declare that the research was conducted in the absence of any commercial or financial relationships that could be construed as a potential conflict of interest.
The author(s) declared that they were an editorial board member of Frontiers, at the time of submission. This had no impact on the peer review process and the final decision.
Publisher’s note
All claims expressed in this article are solely those of the authors and do not necessarily represent those of their affiliated organizations, or those of the publisher, the editors and the reviewers. Any product that may be evaluated in this article, or claim that may be made by its manufacturer, is not guaranteed or endorsed by the publisher.
References
Aloui, S., Mazzoni, A., Elomri, A., Aouissi, J., Boufekane, A., and Zghibi, A. (2023). A review of soil and water assessment tool (SWAT) studies of mediterranean catchments: applications, feasibility, and future directions. J. Environ. Manag. 326 (Pt B), 116799. doi:10.1016/j.jenvman.2022.116799
Azari, B., and Tabesh, M. (2022). Urban storm water drainage system optimization using a sustainability index and LID/BMPs. Sustain. Cities Soc. 76, 103500. doi:10.1016/j.scs.2021.103500
Azimi, S., Dariane, A. B., Modanesi, S., Bauer-Marschallinger, B., Bindlish, R., Wagner, W., et al. (2020). Assimilation of Sentinel 1 and SMAP - based satellite soil moisture retrievals into SWAT hydrological model: the impact of satellite revisit time and product spatial resolution on flood simulations in small basins. J. Hydrology 581, 124367. doi:10.1016/j.jhydrol.2019.124367
Bai, K., Zhou, J., and Wang, Y. Y. (2023). The impact of agricultural “Two Modernizations” on farmers’ income: an entropy ECM model analysis. Math. Pract. Theory 53 (02).
Briak, H., Mrabet, R., Moussadek, R., and Aboumaria, K. (2019). Use of a calibrated SWAT model to evaluate the effects of agricultural BMPs on sediments of the Kalaya river basin (North of Morocco). Int. Soil Water Conservation Res. 7 (2), 176–183. doi:10.1016/j.iswcr.2019.02.002
Carolus, J. F., Bartosova, A., Olsen, S. B., Jomaa, S., Tonderski, K., Zīlāns, A., et al. (2020). Nutrient mitigation under the impact of climate and land-use changes: a hydro-economic approach to participatory catchment management. J. Environ. Manag. 271, 110976. doi:10.1016/j.jenvman.2020.110976
Chang, D., Lai, Z., Li, S., Li, D., and Zhou, J. (2021). Critical source areas’ identification for non-point source pollution related to nitrogen and phosphorus in an agricultural watershed based on SWAT model. Environ. Sci. Pollut. Res. 28 (34), 47162–47181. doi:10.1007/s11356-021-13973-9
Chang, J., Yu, J., Wang, F. E., and Zheng, S. Y. (2017). Cost-effectiveness analysis of best management practices for non-point source pollution in watersheds: a review. J. Zhejiang Univ. 43 (02), 137–145. doi:10.3785/j.issn.1008-9209.2016.04.211
Chaubey, I., Chiang, L., Gitau, M. W., and Mohamed, S. (2010). Effectiveness of best management practices in improving water quality in a pasture-dominated watershed. J. Soil Water Conservation 65 (6), 424–437. doi:10.2489/jswc.65.6.424
Chen, D., Li, Y., Cao, K. L., and Zhang, Y. J. (2016). Application of SUSTAIN to evaluate runoff control effect of LID practices in residential area. China Water and Wastewater 32 (09). doi:10.19853/j.zgjsps.1000-4602.2016.09.034
Chen, H., Wang, X., Ge, B., Zhang, T., and Zhu, Z. (2023). A multi-strategy improved sparrow search algorithm for coverage optimization in a WSN. Sensors (Basel) 23 (8), 4124. doi:10.3390/s23084124
Chen, L., and Long, Y. (2022). The spatial optimization of LIDs based on SWMM and NSGA-II algorithm: a case study of a residential group in Tongzhou District, Beijing. Urban Plan. Int. 37 (06). doi:10.19830/j.upi.2022.428
Chen, Y. C., Li, Z. P., Li, Z. C., and Xu, H. Y. (2004). Contamination of urban surface runoff and its whole course minimization. J. Soil Water Conservation 18, 133–136. doi:10.13870/j.cnki.stbcxb.2004.03.034
Chen, Y. H. (2015). Simulation of nutrient transport and transformation and optimal BMPs placement in riparian agricultural area of typical Yunnan Plateau Lake. Doctoral Dissertation, Yunnan University. doi:10.27456/d.cnki.gyndu.2015.000003
Chen, Y. X. (2013) “Planning research for urbanized region stormwater drainage system based on Low-Impact Development,”. Tianjin University. Doctoral Dissertation. doi:10.7666/d.D485286
Chen, Y. Z. (2022) “A case study of urban watercirculation system based ongrey-green synergistic measures,”. Harbin Institute of Technology. Master’s Thesis. doi:10.27061/d.cnki.ghgdu.2022.002933
Chung, M. M. (2010). BMP decision using genetic algorithms for cost-effective pollution control at the watershed-level. University of California. Doctoral Dissertation.
Deng, Y. (2020). Low-cost adsorbents for urban stormwater pollution control. Fese 14 (5), 83. doi:10.1007/s11783-020-1262-9
Ding, Y. (2019) “Research on the best management measures for non-point source pollution in the Guishui River basin based on SWAT model,”. Jinan University. Master’s Thesis. doi:10.27166/d.cnki.gsdcc.2019.000293
Duan, X. W., Xie, Y., Zhang, Y. P., and Liu, B. (2010). Applied PI model in soil productivity assessment of song nen black soil region in northeast China. Sci. Bull. 26 (08). CNKI:SUN:ZNTB.0.2010-08-041.
Fang, Z. M. (2014). Application of best management measures (BMPs) in agricultural non-point source pollution control. Green Living (14). CNKI:SUN:HJYS.0.2014-14-094.
Fu, J., Wang, Y. Q., Ma, C., Wang, Y. J., and Liang, D. (2019). Research progress on the effects of vegetation buffer zone on reducing agricultural non-point pollution. J. Soil Water Conservation 33 (02). doi:10.13870/j.cnki.stbcxb.2019.02.001
Fu, S., Zhou, H. J., Yang, B., and Xiao, Z. Y. (2015). The statistics comprehensive evaluation research based on entropy multi-attribute decision making. Comput. Appl. Math. Lett. 35 (08). doi:10.3969/j.issn.1008-0821.2015.08.024
Gaddis, E. J. B., Voinov, A., Seppelt, R., and Rizzo, D. M. (2014). Spatial optimization of best management practices to attain water quality targets. Water Resour. Manag. 28 (6), 1485–1499. doi:10.1007/s11269-013-0503-0
Gao, H. R., Qin, C. Z., Zhu, L. J., Liu, J. Z., and Wu, H. (2018). Scenario optimization method for watershed management measures based on slope location as spatial configuration unit. J. Soil Water Conservation 20 (06). doi:10.12082/dqxxkx.2018.170622
Gao, J., Wang, R., Huang, J., and Liu, M. (2015b). Application of BMP to urban runoff control using SUSTAIN model: case study in an industrial area. Ecol. Model. 318, 177–183. doi:10.1016/j.ecolmodel.2015.06.018
Gao, J., Wang, R. S., Zhou, C. B., and Gao, H. (2015a). Application of BMP for urban runoff control using SUSTAIN model at community scale. Water Wastewater Eng. 51 (S1). doi:10.13789/j.cnki.wwe1964.2015.0393
Gao, Y. Z. (2013). Research on the evaluation method and technical economic cost efficiency analysis of environmental pollution prevention and control technology. Beijing: China University of Geosciences. Doctoral Dissertation, CNKI:CDMD:1.2010.085988.
Geng, A. Y. (2020). Study on the construction of the sponge campus — a case of the Universities in Wuhan. Urbanism Archit. 17 (20). doi:10.19892/j.cnki.csjz.2020.20.017
Geng, R. Z. (2012). Research on the optimization and allocation of non-point source pollution and management measures in small watersheds. Master’s Thesis, Cap. Norm. Univ. doi:10.3969/j.issn.1002-6819.2015.02.030
Geng, R. Z., Liang, X. J., Yin, P. H., Wang, M., and Zhou, L. L. (2019). A review: multi-objective collaborative optimization of best management practices for non-point sources pollution control. Acta Ecol. Sin. 39 (08). doi:10.5846/stxb201804140860
George, A., Hoang, L. T., Takashi, G., and Tasuku, K. (2021). A review of SWAT model application in Africa. Water 13 (09), 1313. doi:10.3390/w13091313
Gossweiler, B., Wesström, I., Messing, I., Villazón, M., and Joel, A. (2021). Impact of land use change on non-point source pollution in a Semi-Arid catchment under rapid urbanisation in Bolivia. Water 13 (4), 410. doi:10.3390/w13040410
Gu, J. J., Cao, Y., Wu, M., Song, M., and Wang, L. (2021). Spatial optimization layout of best management practices through SWAT and interval fractional programming under uncertainty. Res. Square. doi:10.21203/rs.3.rs-509238/v1
Her, Y., Jeong, J., Arnold, J., Gosselink, L., Glick, R., and Jaber, F. (2017). A new framework for modeling decentralized low impact developments using Soil and Water Assessment Tool. Environ. Model. Softw. 96, 305–322. doi:10.1016/j.envsoft.2017.06.005
Hou, J., Zhu, M., Wang, Y., and Sun, S. (2020a). Optimal spatial priority scheme of urban LID-BMPs under different investment periods. Landsc. Urban Plan. 202, 103858. doi:10.1016/j.landurbplan.2020.103858
Hou, S. Y., Qiu, C. C., Ding, C., Wang, G. Z., and Yu, X. N. (2020b). Analysis on chemical composition of precipitation and its source apportionment in Xi’an City. Environ. Chem. 39 (09). doi:10.7524/i.issn.0254-6108.2020050501
Huang, D., Zhu, Y., and Yu, Q. (2022). Spatial spillover effects of agricultural agglomeration on agricultural non-point source pollution in the Yangtze River basin. Sustainability 14 (24), 16390. doi:10.3390/su142416390
Huang, K. (2020). Research on on-point source pollution management measures of danjiang river basin based onswat model. Master’s Thesis, Xi’an Univ. Technol. doi:10.27398/d.cnki.gxalu.2020.000578
Huang, K., Guo, H. C., Yu, Y. J., and Liu, Y. (2007). Ecological benefit analysis of integrated prevention and control of river basin water pollution. China Population,Resources Environ. 17, 109–112. doi:10.3969/j.issn.1002-2104.2007.06.022
Jamshidi, S., Imani, S., and Delavar, M. (2020). Impact assessment of best management practices (BMPs) on the water footprint of agricultural productions. Int. J. Environ. Res. 14 (6), 641–652. doi:10.1007/s41742-020-00285-y
Jiang, H., yang, S. S., Feng, S. Y., and Qi, F. T. (2013). Control strategies of rural non-point source pollution based on general benefit-cost analysis. J. Environ. Sciences-China 33 (04). doi:10.3969/j.issn.1000-6923.2013.04.027
Kang, Z. H., and Liu, H. Z. (2015). Eco-compensation for removal of nitrogen and phosphorus from Lake Taihu using cost-benefit analysis. Jiangsu J. Agric. Sci. 31 (04). doi:10.3969/j.issn.1000-4440.2015.04.037
Kim, J., and Ryu, J. H. (2020). Decision-making of LID-BMPs for adaptive water management at the Boise River watershed in a changing global environment. Water 12 (9), 2436. doi:10.3390/w12092436
Knisel, G. W., and Douglas-Mankin, R. K. (2012). CREAMS/GLEAMS: model use, calibration, and validation. Trans. J. ASABE 55 (04), 1291–1302. doi:10.13031/2013.42241
Kurkalova, L. A. (2015). Cost-effective placement of best management practices in a watershed: lessons learned from conservation effects assessment project. J. Am. Water Resour. Assoc. 51 (2), 359–372. doi:10.1111/1752-1688.12295
Lee, H., Kim, H., Kim, J., Jun, S. M., Hwang, S., Song, J. H., et al. (2023). Analysis of the effects of low impact development practices on hydrological components using HSPF. J. Hydro-environment Res. 46, 72–85. doi:10.1016/j.jher.2023.01.001
Leng, L., Xu, C., Jia, H., and Jia, Q. (2022). Incorporating receiving waters responses into the framework of spatial optimization of LID-BMPs in plain river network region. Water Res. 224, 119036. doi:10.1016/j.watres.2022.119036
Lewis, C. D., Smith, K. F., Jacobs, J. L., Ho, C. K. M., Leddin, C. M., and Malcolm, B. (2020). Using a two-price market value method to value extra pasture DM in different seasons. Agric. Syst. 178, 102729. doi:10.1016/j.agsy.2019.102729
Li, H. E., Zhou, X., Huang, K., Hao, G., and Li, J. (2022). Research on optimal control of non-point source pollution: a case study from the Danjiang River basin in China. Environ. Sci. Pollut. Res. 29 (11), 15582–15602. doi:10.1007/s11356-021-16740-y
Li, J., Xie, W. X., Jiang, Z. H., Shan, X. H., Liao, Y. J., Zhao, H. T., et al. (2020). Transition of particulate pollutant in the parcel-based catchment of sponge city. J. Environ. Sci. 41 (09). doi:10.27262/d.cnki.gqdau.2020.001397
Li, M. H. (2019a). Research on the hydrological effects and cost-effectiveness of LID with support of SUSTAIN system - a case study of Gulou District,Nanjing. Landsc. Archit. 27 (11). doi:10.14085/j.fjyl.2020.11.0057.07
Li, W. T., Sun, D. M., and Feng, P. (2017). Simulation study on influence of low impact development measures on rainstorm runoff in Tianjin Municipality. J. Nat. Disasters 26 (03). doi:10.13577/j.jnd.2017.0319
Li, X. G. (2019b). The dilemma and countermeasures of reservoir ecological environment protection in China. Agric. Jilin (10). doi:10.14025/j.cnki.jlny.2019.10.016
Li, Y. (2021). Analysis of air pollution control measures in environmental engineering. J. World Archit. 5 (01). doi:10.26689/jwa.v5i1.1868
Liang, Y. H. (2013). Research on the best management measures (BMPs) for agricultural non-point source pollution control. Jilin Water Resour. (10). doi:10.15920/j.cnki.22-1179/tv.2013.10.007
Lin, W. B. (2016). Study of stormwater management measure planningin campus base on SUSTAIN model-Xia an Campus of Fujian Agriculture and Forestry University as an example. Fujian AandF University. Master’s Thesis.
Ling, L., and Dai, S. Z. (2019). “A preliminary study on the construction of sponge campus under the concept of Low Impact Development - taking the Jiangpu Campus of Nanjing University of technology as an example,” in High quality development of urban infrastructure - proceedings of the 2019 engineering planning academic seminar (China Urban Publishing House), 2, 132–151. doi:10.26914/c.cnkihy.2019.095452
Liu, G., Chen, L., Wei, G., and Shen, Z. (2019). New framework for optimizing best management practices at multiple scales. J. Hydrology 578, 124133. doi:10.1016/j.jhydrol.2019.124133
Liu, J. F., Long, X. L., and Li, W. T. (2018). Application of non-point source pollution of reservoir water source in ecological wetland. Water Resour. Dev. Manag. (03). doi:10.16616/j.cnki.10-1326/TV.2018.03.12
Liu, R., Zhang, P., Wang, X., Wang, J., Yu, W., and Shen, Z. (2014). Cost-effectiveness and cost-benefit analysis of BMPs in controlling agricultural nonpoint source pollution in China based on the SWAT model. Environ. Monit. Assess. 186 (12), 9011–9022. doi:10.1007/s10661-014-4061-6
Liu, W., Zhang, L., Wu, H., Wang, Y., Zhang, Y., Xu, J. Y., et al. (2023). Strategy for cost-effective BMPs of non-point source pollution in the small agricultural watershed of Poyang Lake: a case study of the Zhuxi River. Chemosphere 333, 138949. doi:10.1016/j.chemosphere.2023.138949
Liu, X. P., Li, M. Z., Chai, Y. Z., Tang, Y., and Gao, J. Y. (2021b). A comprehensive framework for HSPF hydrological parameter sensitivity, optimization and uncertainty evaluation based on SVM surrogate model- A case study in Qinglong River watershed, China. Environ. Model. Softw. 143, 105126. doi:10.1016/j.envsoft.2021.105126
Liu, Z. B., Cheng, Q. G., and Wei, J. B. (2021a). A review on simulation and control of watershed scale non-point source. Pollut. Guangdong Chem. Ind. 48 (20). doi:10.3969/j.issn.1007-1865.2021.20.045
Luo, X. D., and Li, C. M. (2014). Research advances of urban stormwater Low-Impact Development. Anhui Nongye Kexue 42 (16). doi:10.13989/j.cnki.0517-6611.2014.16.044
Ma, X. L., Li, H. B., Luo, N., and Zhao, J. G. (2021). Research on urban surface runoff pollution. China Resour. Compr. Util. 39 (05). doi:10.3969/j.issn.1008-9500.2021.05.034
Ma, Y., and Zhao, H. (2022). The role of spatial patterns of Low-Impact Development in urban runoff pollution control within parcel based catchments. Front. Environ. Sci. Eng. 10. doi:10.3389/fenvs.2022.926937
Mohammad, K., Ali, Z., and Sadaf, M. (2022). Flood modeling in coastal cities and flow through vegetated BMPs: conceptual design. J. Hydrologic Eng. 27 (10). doi:10.1061/(ASCE)HE.1943-5584.0002206
Morabito, M., Crisci, A., Guerri, G., Messeri, A., Congedo, L., and Munafo, M. (2021). Surface urban heat islands in Italian metropolitan cities: tree cover and impervious surface influences. Sci. Total Environ. 751, 142334. doi:10.1016/j.scitotenv.2020.142334
O’Hogain, S., and Mccarton, L. (2018). A technology portfolio of nature based solutions. Cham: Springer. doi:10.1007/978-3-319-73281-7
Park, J. W., Kesuma Warganda, T., Sutjiningsih, D., Ay Lie, H., Hardjasaputra, H., and Thayaalan, P. (2017). Placement of BMPs in urban catchment area using SUSTAIN model: case study at Universitas Indonesia Campus, Depok, West Java, Indonesia. MATEC Web Conf. 138, 06007. doi:10.1051/matecconf/201713806007
Peng, M. L. (2019). Multi-time scale simulation of runoff andnon-point NH4+-N pollution in YanheRiver Basin. Master’s Thesis. Northwest AandF University.
Qi, Z., Kang, G., Wu, X., Sun, Y., and Wang, Y. (2020). Multi-objective optimization for selecting and siting the cost-effective BMPs by coupling revised GWLF model and NSGAII algorithm. Water 12 (1), 235. doi:10.3390/w12010235
Qiu, S., Yin, H., Deng, J., and Li, M. (2020). Cost-effectiveness analysis of green-gray stormwater control measures for non-point source pollution. Int. J. Environ. Res. Public Health 17 (3), 998. doi:10.3390/ijerph17030998
Rathjens, H., Bieger, K., Chaubey, I., Arnold, J. G., Allen, P. M., Srinivasan, R., et al. (2016). Delineating floodplain and upland areas for hydrologic models: a comparison of methods. Hydrol. Process. 30, 4367–4383. doi:10.1002/hyp.10918
Ratté-Fortin, C., Rousseau, A. N., Thériault, G., and van Bochove, É. (2019). Evaluating the effects of BMPs on agricultural contaminants using a novel method accounting for uncertainty in water flow and contaminant loads. Can. Water Resour. J./Revue Can. des ressources hydriques 44 (3), 263–279. doi:10.1080/07011784.2019.1581093
Ren, L., Zhang, W., Ye, Y., and Li, X. (2023). Hybrid strategy to improve the high-dimensional multi-target sparrow search algorithm and its application. Appl. Sciences-Basel 13 (6), 3589. doi:10.3390/app13063589
Rissman, A. R., and Carpenter, S. R. (2015). Progress on nonpoint pollution: barriers and opportunities. Daedalus 144 (3), 35–47. doi:10.1162/DAED_a_00340
Rong, K., Li, X. P., Yang, Q., Luo, J., and Zhang, C. X. (2019). Benefit and cost analysis of green water management measures in the xixi River Basin of the jinjiang river based on SWAT model. Bull. Soil Water Conservation 39 (01). doi:10.13961/j.cnki.stbctb.2019.01.022
Rong, Q., Liu, Q., Xu, C., Yue, W., and Su, M. (2022). Optimal configuration of low impact development practices for the management of urban runoff pollution under uncertainty. J. Environ. Manag. 320, 115821. doi:10.1016/j.jenvman.2022.115821
Ruan, J. J., Liu, p., Liu, X. N., Li, C., and Cheng, J. (2015). Treatment efficiency of non-point source pollution in three types of constructed wetlands. Environ. Eng. 33 (09). doi:10.13205/j.hjgc.201509004
Salaudeen, A., Shahid, S., Ismail, A., Adeogun, B. K., Ajibike, M. A., Bello, A. D., et al. (2023). Adaptation measures under the impacts of climate and land-use/land-cover changes using HSPF model simulation: application to Gongola river basin, Nigeria. Sci. Total Environ. 858 (Pt 2), 159874. doi:10.1016/j.scitotenv.2022.159874
Shao, W. (2013). Cost-benefit analysis to promote watershed ecosystem repayable services-taking guanliao river basin as an example. For. Econ. Rev. (06). doi:10.13843/j.cnki.lyjj.2013.06.019
Shen, Z. X., Kan, L. Y., and Che, S. Q. (2015). Effects of grass swales structure parameters on storageand pollutant removal of rainfall runoff. J. Shanghai Jiaot. Univ. Sci. 33 (06). doi:10.3969/J.ISSN.1671-9964.2015.06.008
Shi, Y. X., Zhu, L. J., Qin, C. Z., and Zhu, A. X. (2021). Spatial optimization of watershed best management practices based on slope position field units. J. Geo-information Sci. 23 (04). doi:10.12082/dqxxkx.2021.200335
Snodgrass, J. W., Casey, R. E., Joseph, D., and Simon, J. A. (2008). Microcosm investigations of stormwater pond sediment toxicity to embryonic and larval amphibians: variation in sensitivity among species. Environ. Pollut. 154 (2), 291–297. doi:10.1016/j.envpol.2007.10.003
Sousa, B. J. d. O., Fialho, H. C. P., Taffarello, D., Souza, F. A. A., Hassanzadeh, E., Mendiondo, E. M., et al. (2021). Citizens’ viewpoints on stormwater beneficial management practices (BMPs) in Brazil. J. Clean. Prod. 328, 129569. doi:10.1016/j.jclepro.2021.129569
Su, J., and Li, X. (2020). A fully integrated NPS PI model in R: an option for coupling nonpoint source models and GIS. Environ. Model. Softw. 126, 104637. doi:10.1016/j.envsoft.2020.104637
Sun, J. H., Cao, X. F., and Huang, Y. (2011). Effect of land use on inflow rivers water quality in lake Dianchi watershed. China Environ. Sci. 31 (12), 2052–2057. CNKI:SUN:ZGHJ.0.2011-12-022.
Sun, P., Zhou, Y. P., Hua, X., Bai, Y. Y., and Feng, L. (2017). BMPs framework for prevention and control of non-point source pollution in Three Gorges Reservoir area. J. Hydroecology 38 (01). doi:10.15928/j.1674-3075.2017.01.009
Sun, S. Q. (2020). Simulation and layout optimization of low impact development of sponge city in dry area. Master’s Thesis. Ningxia University. doi:10.27257/d.cnki.gnxhc.2020.001173
Taghizadeh, S., Khani, S., and Rajaee, T. (2021). Hybrid SWMM and particle swarm optimization model for urban runoff water quality control by using green infrastructures (LID-BMPs). Urban For. Urban Green. 60, 127032. doi:10.1016/j.ufug.2021.127032
Tan, Q., and Ding, Q. (2014). Theoretical review and research progress of Low-Impact Development technologies. Chin. Hortic. Abstr. 30 (03). doi:10.3969/j.issn.1672-0873.2014.03.025
Tang, J., and Li, S. (2023). Research on multiple co-governance of agricultural non-point source pollution in China on the perspective of ENGOs and public participation. PLoS One 18 (2), e0280360. doi:10.1371/journal.pone.0280360
Tian, Y., Chen, W., and Zhu, S. (2017). Does financial macroenvironment impact on carbon intensity: evidence from ARDL-ECM model in China. Nat. Hazards 88 (2), 759–777. doi:10.1007/s11069-017-2925-0
Tong, Z. Y. (2017). Research on supervision and restriction mechanism in inter - governmental cooperative governance of basin water pollution comparison of water pollution control in Huaihe river basinand Rhine river basin. Master’s Thesis. Central China Normal University.
Wan, J. B., Sun, L., Liu, f., and Tang, A. P. (2012). Demonstration and effects of best management practices applied to control of rural non-point source pollution in Poyang Lake Area. Bull. Soil Water Conservation 32 (03). doi:10.13961/j.cnki.stbctb.2012.03.029
Wang, D. (2016). The load simulation of nitrogen and phosphorus non-point source pollution and water quality assessment in the Three Gorges Reservoir. Southwest University. Doctoral Dissertation.
Wang, M. L. (2021). Research on characteristics of non-point source pollution and optimization of management practices in Guishui River Basin based on SWAT model. Beijing Forestry University. Master’s Thesis. doi:10.26949/d.cnki.gblyu.2021.000732
Wang, Q. B. (2014). Study on the migration characteristics and mechanism ofnitrogen in plant-soil and water interface based onnon-point source pollution control. Chinese academy of forestry sciences. Master’s thesis. doi:10.7666/d.Y2630071
Wang, X., Hao, F. H., and Zhang, X. (2013). Optimization of best management practices for non-point source pollution in Danjiangkou Reservoir Basin. China Environ. Sci. 33 (7). doi:10.13843/j.cnki.lyjj.2013.06.019
Wang, X. L. (2020). The sponge city construction’s improving effect on non-point source pollution treatment and drainage. China Resour. Compr. Util. 38 (10). doi:10.3969/j.issn.1008-9500.2020.10.050
Wang, X. Y., Zhang, Y. F., Ou, Y., and Duan, S.-H. (2009). Cost benefit evaluation and optimization of non point source pollution control and management measures in river basins. Ecol. Environ. Sci. 18 (02), 540–548. doi:10.16258/j.cnki.1674-5906.2009.02.050
Wei, Z. (2022). Stochastic cost-benefit analysis for energy atmosphere system of Yulin City. Xi’an University of Architecture and Technology. Master’s Thesis. doi:10.27393/d.cnki.gxazu.2021.000280
Wen, Z. T. (2022). Application of low impact development (LID) technologies in sponge city construction—a case study of Hengqin new district of zhuhai. Wetl. Sci. Manag. 18 (06). doi:10.3969/j.issn.1673-3290.2022.06.16
Wu, H., Zhu, A. X., Liu, J., Liu, Y., and Jiang, J. (2017). Best management practices optimization at watershed scale: incorporating spatial topology among fields. Water Resour. Manag. 32 (1), 155–177. doi:10.1007/s11269-017-1801-8
Wu, Y. (2022a). Research on sponge campus BMP planning layout and optimization scheme based on SUSTAIN model. Chang'an University. Master’s Thesis. doi:10.26976/d.cnki.gchau.2022.001440
Wu, Z. J. (2022b). Best management practices of watershed non-point source pollution based on SWAT model — case analysis of Gongjiang basin. Nanchang University. Master’s Thesis. doi:10.27232/d.cnki.gnchu.2022.003387
Xia, Q., Han, H. J., Huang, H. Q., Zhang, Z. L., Zheng, C. X., and Zhao, Q. (2020). Research progress of two typical watershed-scale non-point source pollution distributed models. IOP Conf. Ser. Earth Environ. Sci. 679 (01). doi:10.1088/1755-1315/619/1/012033
Xie, H., Qiu, J. L., Dong, J. W., Gao, T. T., and Lai, X. J. (2022). Research of the HSPF model on nonpoint source pollution modeling and management: progresses and perspectives. Acta Ecol. Sin. 42 (15). doi:10.5846/stxb202109062508
Xie, Y. C. (2012). Study on overall control goal of total nitrogen ofagricultural non-point pollution dominant river basinbased on BMPs. Doctoral Dissertation. Beijing: China University of Geosciences.
Xu, H., Tan, X., Liang, J., Cui, Y., and Gao, Q. (2022). Impact of agricultural non-point source pollution on river water quality: evidence from China. Front. Ecol. Evol. 10. doi:10.3389/fevo.2022.858822
Xu, H. S., Xu, Z. X., and Liu, P. (2013). Estimation of non-point source pollutant loads and optimization of the best management practices (BMPs) in the Zhangweinan River basin. Environ. Sci. 34 (03), 882–891. doi:10.13227/j.hjkx.2013.03.041
Xu, X. C., Su, Y., Li, K. Q., Liang, S. K., and Wang, X. L. (2019). Preliminary study on the control measures of total nitrogen pollutants entering the sea in the Xiaoqing River basin based on cost efficiency optimization model. Periodical Ocean Univ. China 49 (04). doi:10.16441/j.cnki.hdxb.20180063
Xu, Z. L. (2014). The present status and countermeasures of water pollution of Liao river area. Jilin University. Maste’s Thesis.
Xue, L., Hou, P., Zhang, Z., Shen, M., Liu, F., and Yang, L. (2020). Application of systematic strategy for agricultural non-point source pollution control in Yangtze River basin, China. Agric. Ecosyst. Environ. 304, 107148. doi:10.1016/j.agee.2020.107148
Yan, L. (2020). Study on the occurrence and release of organic pollutants in urban road dust and rainfall runoff. Beijing Jianzhu University. Master’s Thesis. doi:10.26943/d.cnki.gbjzc.2020.000393
Yang, L., Qi, D. H., Li, L. X., Wang, S. J., Yang, A. S., Luo, W. W., et al. (2023). Research on the environmental status and protection measures of the drinking water source area of nahe reservoir in Pu’er city. Environ. Sci. Surv. 42 (02). doi:10.13623/j.cnki.hkdk.2023.02.013
Yang, Q. F. (2023). The problems and countermeasures of water pollution prevention and control are discussed. Resour. Econ. Environ. Prot. (05). doi:10.16317/j.cnki.12-1377/x.2023.05.008
Yang, S. S. (2011) “Cost-Benefit analysis on management practices of agricultural non point source point source pollution in Yixing,”. Nanjing Agricultural University. Master’s Thesis. doi:10.7666/d.Y2038741
Yang, T. S. (2018). Analysis of the development of modern water pollution monitoring technology. Sci. Technol. Innovation (13). doi:10.15913/j.cnki.kjycx.2018.13.154
Yang, T. Y. (2017). “Exploration of best management practices for sponge cities based on SUSTAIN model - taking the drainage area of Yancheng city center as an example,” in Rational planning for sustainable development - proceedings of the 2017 China urban planning annual conference 03 urban engineering planning.
Yin, C. (2017). Study of best management practices of non-point source pollution based on SWAT and information entropy: a case of upstream of Liaohe River. East China Normal University. Master's Thesis.
Zeng, Q., and Wu, T. C. (2023). The status of water pollution in China and its health hazards and countermeasures. Chin. J. Dis. Control Prev. 27 (05). doi:10.16462/j.cnki.zhjbkz.2023.05.002
Zeng, Y., Cai, Y., Tan, Q., and Dai, C. (2020). An integrated modeling approach for identifying cost-effective strategies in controlling water pollution of urban watersheds. J. Hydrology 581, 124373. doi:10.1016/j.jhydrol.2019.124373
Zhang, A. W., and Luo, R. W. (2023). The environmental effects of FDI: "Pollution Halo" or "Pollution Paradise"—— empirical testing based on panel ARDL-ECM model. J. Chongqing Technol. Bus. Univ. Soc. Sci. Ed. 40 (02). doi:10.3969/j.issn.1672-0598.2023.02.004
Zhang, J. (1995a). Application of CREAMS model in calculating runoff and erosion on loess slopes. J. Soil Water Conservation 4. CNKI:SUN:TRQS.0.1995-01-008.
Zhang, J. (1995b). The structural characteristics of the CREAMS model. J. Water Resour. Water Eng. 6 (03). NKI:SUN:XBSZ.0.1995-03-003.
Zhang, J., Zhang, P., and Song, Y. (2022). Comparative water environment simulation study of two typical models with BMPs in a Karst Basin. Agriculture 12 (1), 69. doi:10.3390/agriculture12010069
Zhang, L. (2021) “Research on non-point source pollution management measures of Zhuxi River basin based on SWAT model,”. Nanchang University. Master’s Thesis. doi:10.27232/d.cnki.gnchu.2021.002094
Zhang, P. P., Li, Q., Kan, H. T., Wang, J. W., Yu, W. W., and Liu, R. M. (2014). Effectiveness of vegetated waterway in controlling non-point source pollution based on SWAT model. J. Agro-Environment Sci. 33 (06). doi:10.11654/jaes.2014.06.022
Zhang, R. (2010) “Study on best management practices: non-point source pollution control for watershed management,”. Nanchang University. Doctoral Dissertation. doi:10.7666/d.y1540869
Zhang, T., Yang, Y., Ni, J., and Xie, D. (2020). Construction of an integrated technology system for control agricultural non-point source pollution in the Three Gorges Reservoir Areas. Agric. Ecosyst. Environ. 295, 106919. doi:10.1016/j.agee.2020.106919
Zhang, T., Yang, Y., Ni, J., Xie, D., and Nicholson, F. (2019). Best management practices for agricultural non-point source pollution in a small watershed based on the AnnAGNPS model. Soil Use Manag. 36 (1), 45–57. doi:10.1111/sum.12535
Zhang, Z., Montas, H., Shirmohammadi, A., Leisnham, P. T., and Rockler, A. K. (2023). Modeling spatio-temporal dynamics of BMPs adoption for stormwater management in urban areas. Water 15 (14), 2549. doi:10.3390/w15142549
Zhang, Z. Z., Liu, Y., Qian, L., Zhou, J., Zhao, L., Gou, H. C., et al. (2013). Best management practices, simulation and optimization for non-point source pollution control. China Water and Wastewater 29 (12). doi:10.3969/j.issn.1000-4602.2013.12.002
Zhao, S. Y., and Yu, Y. (2021). Discussion on the current situation and treatment measures of water environment in huairou reservoir. China Water Transp. 21 (05).
Zhou, G. H., Hu, Q., and Ma, S. L. (2019). Research on the evaluation of ecological protection policies in the "12th Five Year Plan" basin of Hubei province - based on cost benefit analysis. Spec. Zone Econ. (06), 82–87.
Zhou, X. Y., and Wang, X. (2019). Cd contamination status and cost-benefits analysis in agriculture soils of Yangtze River basin. Environ. Pollut. 254 (Pt A), 112962. doi:10.1016/j.envpol.2019.112962
Keywords: receiving water, non-point source pollution, BMPs, evaluation of measures effectiveness, development strategies
Citation: Feng S, Wang W, Huang R and Su R (2024) A review of typical water pollution control and cost-benefit analysis in China. Front. Environ. Sci. 12:1406155. doi: 10.3389/fenvs.2024.1406155
Received: 25 March 2024; Accepted: 10 July 2024;
Published: 29 July 2024.
Edited by:
Ahmed El Nemr, National Institute of Oceanography and Fisheries (NIOF), EgyptReviewed by:
Joshua Kiddy K. Asamoah, Kwame Nkrumah University of Science and Technology, GhanaChunyan Shi, Jilin Jianzhu University, China
Copyright © 2024 Feng, Wang, Huang and Su. This is an open-access article distributed under the terms of the Creative Commons Attribution License (CC BY). The use, distribution or reproduction in other forums is permitted, provided the original author(s) and the copyright owner(s) are credited and that the original publication in this journal is cited, in accordance with accepted academic practice. No use, distribution or reproduction is permitted which does not comply with these terms.
*Correspondence: Weimin Wang, d2FuZ3dtQHppdGp1LmNu; Rongxin Su, c3VyeEB0anUuZWR1LmNu