 Abira Nowar1†
 Md. Hafizul Islam
 Ahmed Jubayer
 Md. Moniruzzaman Nayan
- 1Institute of Nutrition and Food Science, University of Dhaka, Dhaka, Bangladesh
- 2Bangladesh Institute of Social Research (BISR) Trust, Dhaka, Bangladesh
This systematic review aimed to identify the heavy metal contents of Bangladeshi vegetables and evaluate the subsequent health hazards of these heavy metals. Relevant studies were obtained from systematic searches of electronic databases. Average (mean) concentrations of Arsenic (AS), Lead (Pb), Cadmium (Cd), Chromium (Cr), Manganese (Mn), Nickel (Ni), Zinc (Zn), and Copper (Cu) in the vegetables were calculated on a fresh-weight basis. The health hazards associated with these metals’ intake were assessed using estimated daily intake (EDI) and carcinogenic and noncarcinogenic risks were measured as the target cancer risk (TR), target hazard quotient (THQ), and hazard index (HI). The results showed that the mean concentration of As, Pb, Cd, Cr, Mn, Ni, Zn, and Cu was 0.02–0.45, Not detectable (ND)-9.45, 0.00–0.51, 0.05–2.19, 0.28–43.43, Not detectable (ND)-5.80, 2.005–175.77, and 0.20–23.85 mg/kg of fresh vegetables respectively. The concentrations of As, Pb, and Cd were higher than the maximum allowable concentration (MAC) in the vegetables. However, all the metals were consumed daily in amounts below the maximum tolerable daily intake (MTDI) for all vegetables. THQ values for all metals except As and Pb were below the safety level (THQ <1) in all the vegetables. Potential non-carcinogenic risk (THQ >1) was posed by As and Pb in some vegetables like cabbage, string bean, bottle gourd, green papaya, sponge gourd, etc. The TR levels of As, Cd, Cr, and Ni were higher than the acceptable levels (10−4) for most vegetables, suggesting that long-term exposure to these toxic metals may raise the risk of developing various malignancies, including stomach and lung cancer. An integrated approach is required to address the contamination burden to preserve the health of the consumers.
1 Introduction
The exposure of humans to heavy metals is a multifaceted issue, manifesting through various pathways that encompass inhalation of contaminated air, drinking of contaminated water, and the consumption of food items contaminated with toxic metals. These heavy metals find their way into the environment through an array of sources, including atmospheric deposition, vehicular emissions, the application of metallo-pesticides or herbicides, phosphate-based fertilizers, industrial discharges, effluents, as well as sewage and sludge pollution (Wilson and Pyatt, 2007; Zhang et al., 2013; Zhang et al., 2017; Rai et al., 2019). Consequently, these metals make their way into the soil and water, particularly in regions where contamination is prevalent. This accumulation occurs through two predominant routes: the soil-root-crop pathway and the water-root-crop pathway, resulting in the incorporation of heavy metals into the food chain, impacting both animal and human consumption (Zhang et al., 2013; Zhang et al., 2017; Rai et al., 2019).
Trace metals are known to play diverse roles in human health, encompassing both favorable and detrimental effects, and they are categorized into three groups: toxic metals such as arsenic, cadmium, lead, mercury, and nickel; metals that are likely essential like vanadium; and essential metals, which include copper, zinc, iron, manganese, selenium, and cobalt (Baruthio, 1992; Uriu-Adams and Keen, 2005; Godt et al., 2006; Plum et al., 2010; Hong et al., 2014; Nakhaee et al., 2019). It is worth noting that even the latter two categories of metals have been associated with adverse health effects when consumed in excessive amounts. In recent years, food safety has become a critical global public health concern, primarily due to the escalating risks posed by various biological, microbial, and chemical hazards including toxic heavy metals present in foods (D’Mello, 2003). Individuals who have been exposed to foods containing excessive levels of toxic or hazardous metals over an extended period face a heightened risk of developing severe health issues, including cancer, cardiovascular diseases, liver impairments, and renal damage (Uriu-Adams and Keen, 2005; Godt et al., 2006; Hong et al., 2014; Nakhaee et al., 2019). Recognizing the potential risks, the World Health Organization (WHO) and the Food and Agriculture Organization (FAO) have put forth recommendations establishing safe limits for heavy metal concentrations in water, fruits, vegetables, and various other food products (FAO/WHO, 2011). Consumption of heavy metals beyond these recommended Maximum allowable concentrations (MAC) through food consumption can significantly jeopardize human health and wellbeing (Uriu-Adams and Keen, 2005; Godt et al., 2006; Hong et al., 2014; Nakhaee et al., 2019).
Heavy metal exposure through dietary intake has emerged as a pressing global concern, as mounting evidence underscores the presence of elevated concentrations of diverse toxic metals in a range of food products, including water, fish, rice, fruits, vegetables, and other foodstuffs (Simon, 2016; Onakpa et al., 2018; Nkwunonwo et al., 2020; Sharma and Nagpal, 2020; Bahiru and Yegrem, 2021; Mengistu, 2021). Hazard quotient assessment in various studies has shown that consumption of contaminated vegetables can be toxic to both adults and children. A recent study on the heavy metal content of vegetables available in Bangladesh has revealed a concerning finding, with elevated levels of Cr, Mn, Fe, Ni, Cu, Zn, As, Cd, and Pb surpassing the established safety limits in the majority of cases (Abu Rayhan Khan and Hosna, 2021). Similarly, Islam et al. (Islam et al., 2018), reported that As, Pb, Cd, and Cr contamination in river water, river sediments, soil, rice, fish, and vegetables exceeded the maximum allowable limits in many instances. Thus, intake of heavy metals beyond the MAC through consuming different foods can result in adverse health effects and substantially impact the overall health of the Bangladeshi population.
Different vegetables are grown all year round in Bangladesh and the average per capita daily intake of vegetables is 201.9 g (Bangladesh Bureau of Statistics (BBS), 2022). In the past decade, numerous studies have been conducted in Bangladesh to assess the presence of heavy metals in vegetables. Several reviews have addressed heavy metal content in soil, water, rice, and food items (Islam et al., 2018; Sarker et al., 2022), and a few focused on heavy metal content in vegetables in Bangladesh (Islam et al., 2018; Abu Rayhan Khan and Hosna, 2021). However, none of the studies estimated the health risks of humans related to heavy metals. Therefore, comprehensive information encompassing the heavy metal contamination of commonly consumed vegetables in Bangladesh and estimation of subsequent health risks upon consumption of vegetables is required. Thus, this systematic review aimed to identify the heavy metal contents in Bangladesh’s vegetables and estimated the carcinogenic and non-carcinogenic health risks of these heavy metals due to intake of these vegetables.
2 Methods and materials
2.1 Search strategy
The original articles were identified through systematic searches of two electronic databases: PubMed and Google Scholar. The search strategy to find relevant articles was as follows: PubMed: ((heavy metals OR trace elements OR trace minerals OR toxic metals) AND (fruit OR vegetable OR food) AND Bangladesh) and Google Scholar: allintitle: Bangladesh fruit OR vegetable OR “heavy metals” OR “trace elements” OR “trace minerals” OR “toxic metals.” Moreover, manual Google searching was done to get additional articles relevant to this study. The literature search was conducted in August - September 2022. Two authors independently searched the literature with the same search strategy.
2.2 Eligibility criteria
The following inclusion criteria were used to select the pertinent studies: 1) study design: cross-sectional study, 2) study area: different areas in Bangladesh 3) language: articles published in English, 4) sample: research articles on vegetables 5) issues with publication: original research articles of peer-reviewed journals, 6) reporting data: articles reported the quantitative content of heavy metals in vegetables on fresh weight basis.
2.3 Study selection
All the articles obtained from systematic and manual database searches were exported to Rayyan, an online tool that helps in the initial screening of the abstracts and titles. The Rayyan was used to find and eliminate duplicate articles. After screening the titles and abstract, the articles were removed which were not relevant to the review. Then, the full text of the articles was evaluated for relevance to the study by comparing them to the eligibility requirements. To reduce selection bias, two authors independently reviewed the identified articles based on the eligibility criteria, and if any discrepancies were raised between these two authors regarding the study selection a third author was consulted to resolve the issue.
2.4 Data extraction and reporting
Relevant data (the author, year of publication, study area, study design, name of sample, description of the sample, analytical methods, quality assurance method, and heavy metal contents) were extracted from the included articles based on a predetermined data extraction form, using Microsoft Excel 2016. The extracted data were presented in the form of a table and text.
2.5 Assessment of the outcome
This systematic review aimed to determine the contents and public health significance of different heavy metals in various vegetables of Bangladesh. The concentration of each heavy metal (mean ± standard deviation, minimum - maximum) was presented for each vegetable. The public health risk of different heavy metals was assessed in terms of estimated daily intake (EDI), target hazard quotient (THQ), and carcinogenic risk (TR) (USEPA, 2023).
2.5.1 Estimated daily intake (EDI) of heavy metals
The EDI of heavy metal was calculated using the mean concentrations of heavy metal in various vegetables (on a fresh weight basis), average daily consumption of vegetables, and body weight. The following formula was applied to calculate the respective EDI for each heavy metal (Eq. 1).
where FIR is the daily food consumption rate for adult residents (g/person/day), C is the mean concentration of heavy metal in the vegetable sample (mg/kg fresh weight) and BW is the body weight. In Bangladesh, the daily vegetable consumption rate for an adult of 65 kg (ICMR-NIN, 2020) was an average of 116.9 g leafy vegetables, 95.1 g non-leafy vegetables, 69.7 g potato, 30.2 g onion, and 8.6 g green chili on a fresh weight basis (Shaheen et al., 2021; Bangladesh Bureau of Statistics (BBS), 2022).
2.5.2 Target hazard quotient (THQ)
The following equation (Eq. 2) was used for estimating the THQ.
where EFr is the exposure frequency (365 days/year); ED means the exposure duration (70 years) equivalent to the average lifetime for a man in Bangladesh; FIR is the food ingestion rate (g/person/day); C is the metal concentration in vegetable samples (mg/kg fresh weight); BW is the average body weight (adult, 65 kg), and AT is the averaging time for non-carcinogens (365 days/year
2.5.3 Combined risk of multiple metals
It has been reported that exposure to two or more pollutants may result in additive and/or interactive effects. The total THQ (TTHQ) of heavy metals for individual fruit was treated as the mathematical sum of each metal’s THQ value (Eq. 3):
Based on the Guidelines for Health Risk Assessment of Chemical Mixtures of USEPA, a hazard index (HI) has been formulated as Eq. 4 to assess the overall potential for noncarcinogenic effects from more than one heavy metal.
2.5.4 Carcinogenic risk
The following equation (Eq. 5) was used for estimating the target cancer risk (lifetime cancer risk).
where TR represents the risk of cancer over a lifetime; EFr is the exposure frequency (365 days/year); ED is the exposure duration (70 years) equivalent to the average lifetime for man in Bangladesh; FIR is the food ingestion rate (g/person/day); C is the concentration of metal in vegetable samples (mg/kg fresh weight); BW is the body weight (65 kg for an adult) and AT is the averaging time for non-carcinogens (365 days/year × number of exposure years, assuming 70 years); CSFo is the oral carcinogenic slope factor from the Integrated Risk Information System database, which was 1.5, 6.1, 0.41, 0.91 and 0.0085 mg/kg/day for As, Cd, Cr, Ni, and Pb respectively (USEPA, 2023).
3 Results and discussion
The present systematic review provides an overview of heavy metal concentrations present in Bangladeshi vegetables. The review includes 24 research articles that estimated the heavy metals concentration of vegetables collected from different places in Bangladesh. It provides information on concentrations of eight heavy metals (As, Pb, Cd, Cr, Mn, Ni, Zn, and Cu) in 43 varieties of vegetables. The study also assessed the health risks associated with the consumption of these vegetables covering both carcinogenic and non-carcinogenic risks.
3.1 Study selection
A total of 1444 studies were identified through a systematic search in PubMed, and Google Scholar using a predefined search strategy (Figure 1). In addition, 14 articles were identified through a manual search on Google. After an initial screening, 130 identified duplicate articles were excluded and the titles and abstracts of the remaining 1328 articles were screened. After screening the titles and abstracts, 1239 articles were excluded. Then, the available full text of 81 articles was assessed against the eligibility criteria to evaluate their relevance to this review. Finally, 24 eligible studies that reported the concentration of heavy metals in vegetables on a fresh-weight basis in Bangladesh were selected for this systematic review.
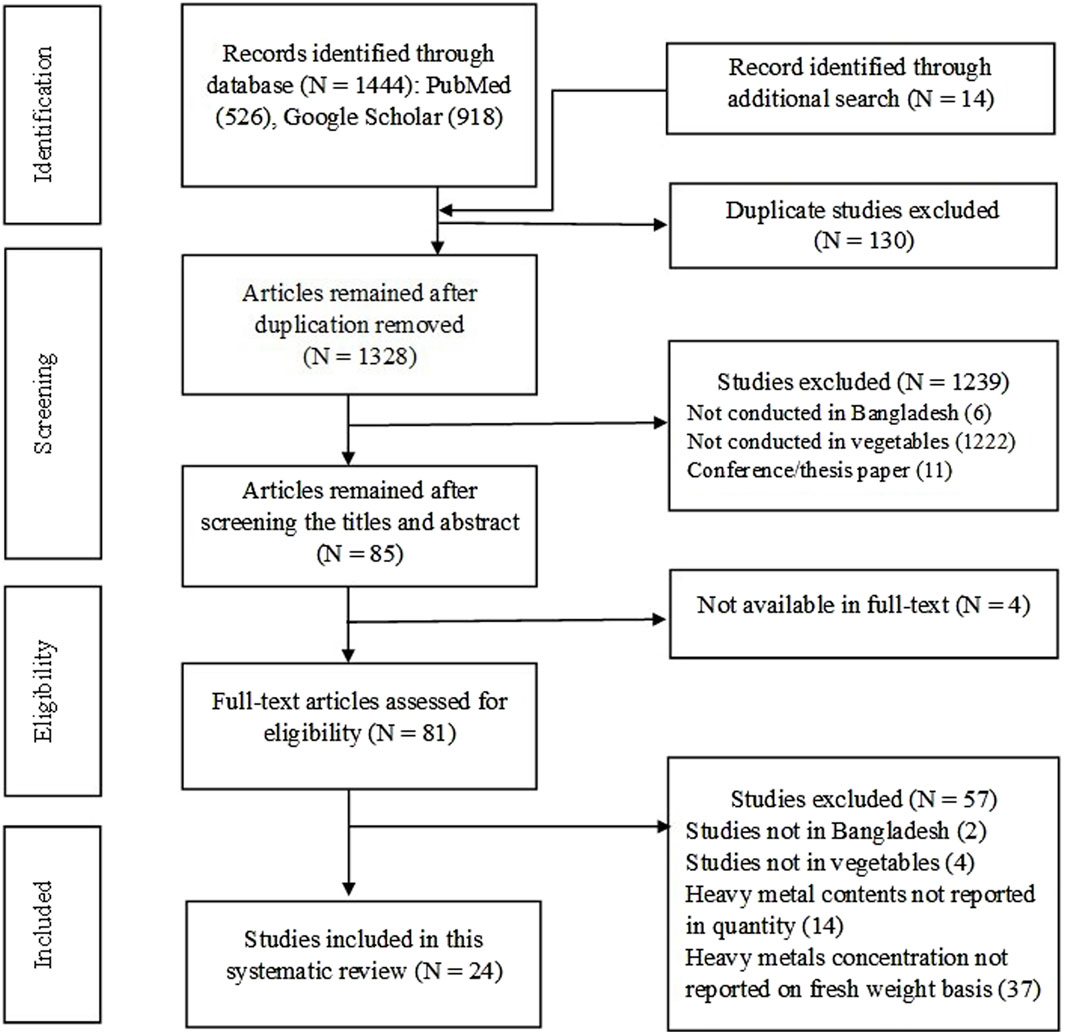
Figure 1. PRISMA flow diagram indicating the study selection process for this systematic review.
3.2 Characteristics of the included studies
A total of 24 studies were included in this review to determine heavy metal concentrations in Bangladeshi vegetables. Among the 24 selected studies, 9 studies were conducted in Dhaka city and its adjacent districts such as Savar and Gazipur. These studies covered locations including local markets, river-adjacent sites, and industrial areas. Four studies were conducted in Rajshahi and Bogra districts, and 8 were in the southern regions of Bangladesh covering districts such as Kushtia, Bagerhat, Pabna, Jhenaidah, Patuakhali, and Narshingdi. Apart from these, 2 studies covered different ecological zones and markets of the whole country. Out of 24 studies, 14 studies used the edible parts of the vegetables as sample for analyzing metal concentration. Twelve studies used Inductively coupled plasma mass spectrometer (ICP-MS) as the instrument for sample analysis and other studies used atomic absorption spectrometer and its different types such as Flame atomic absorption spectroscopy (FAAS), Cold vapor atomic absorption spectrometer (CVAAS), and Hydride generation atomic absorption spectrometer (HGAAS). Almost all the studies (n = 19) conducted different quality assurance methods such as using internal quality controls, certified reference materials, blanks, calibration curves, and running accuracy and precision analysis (Table 1).
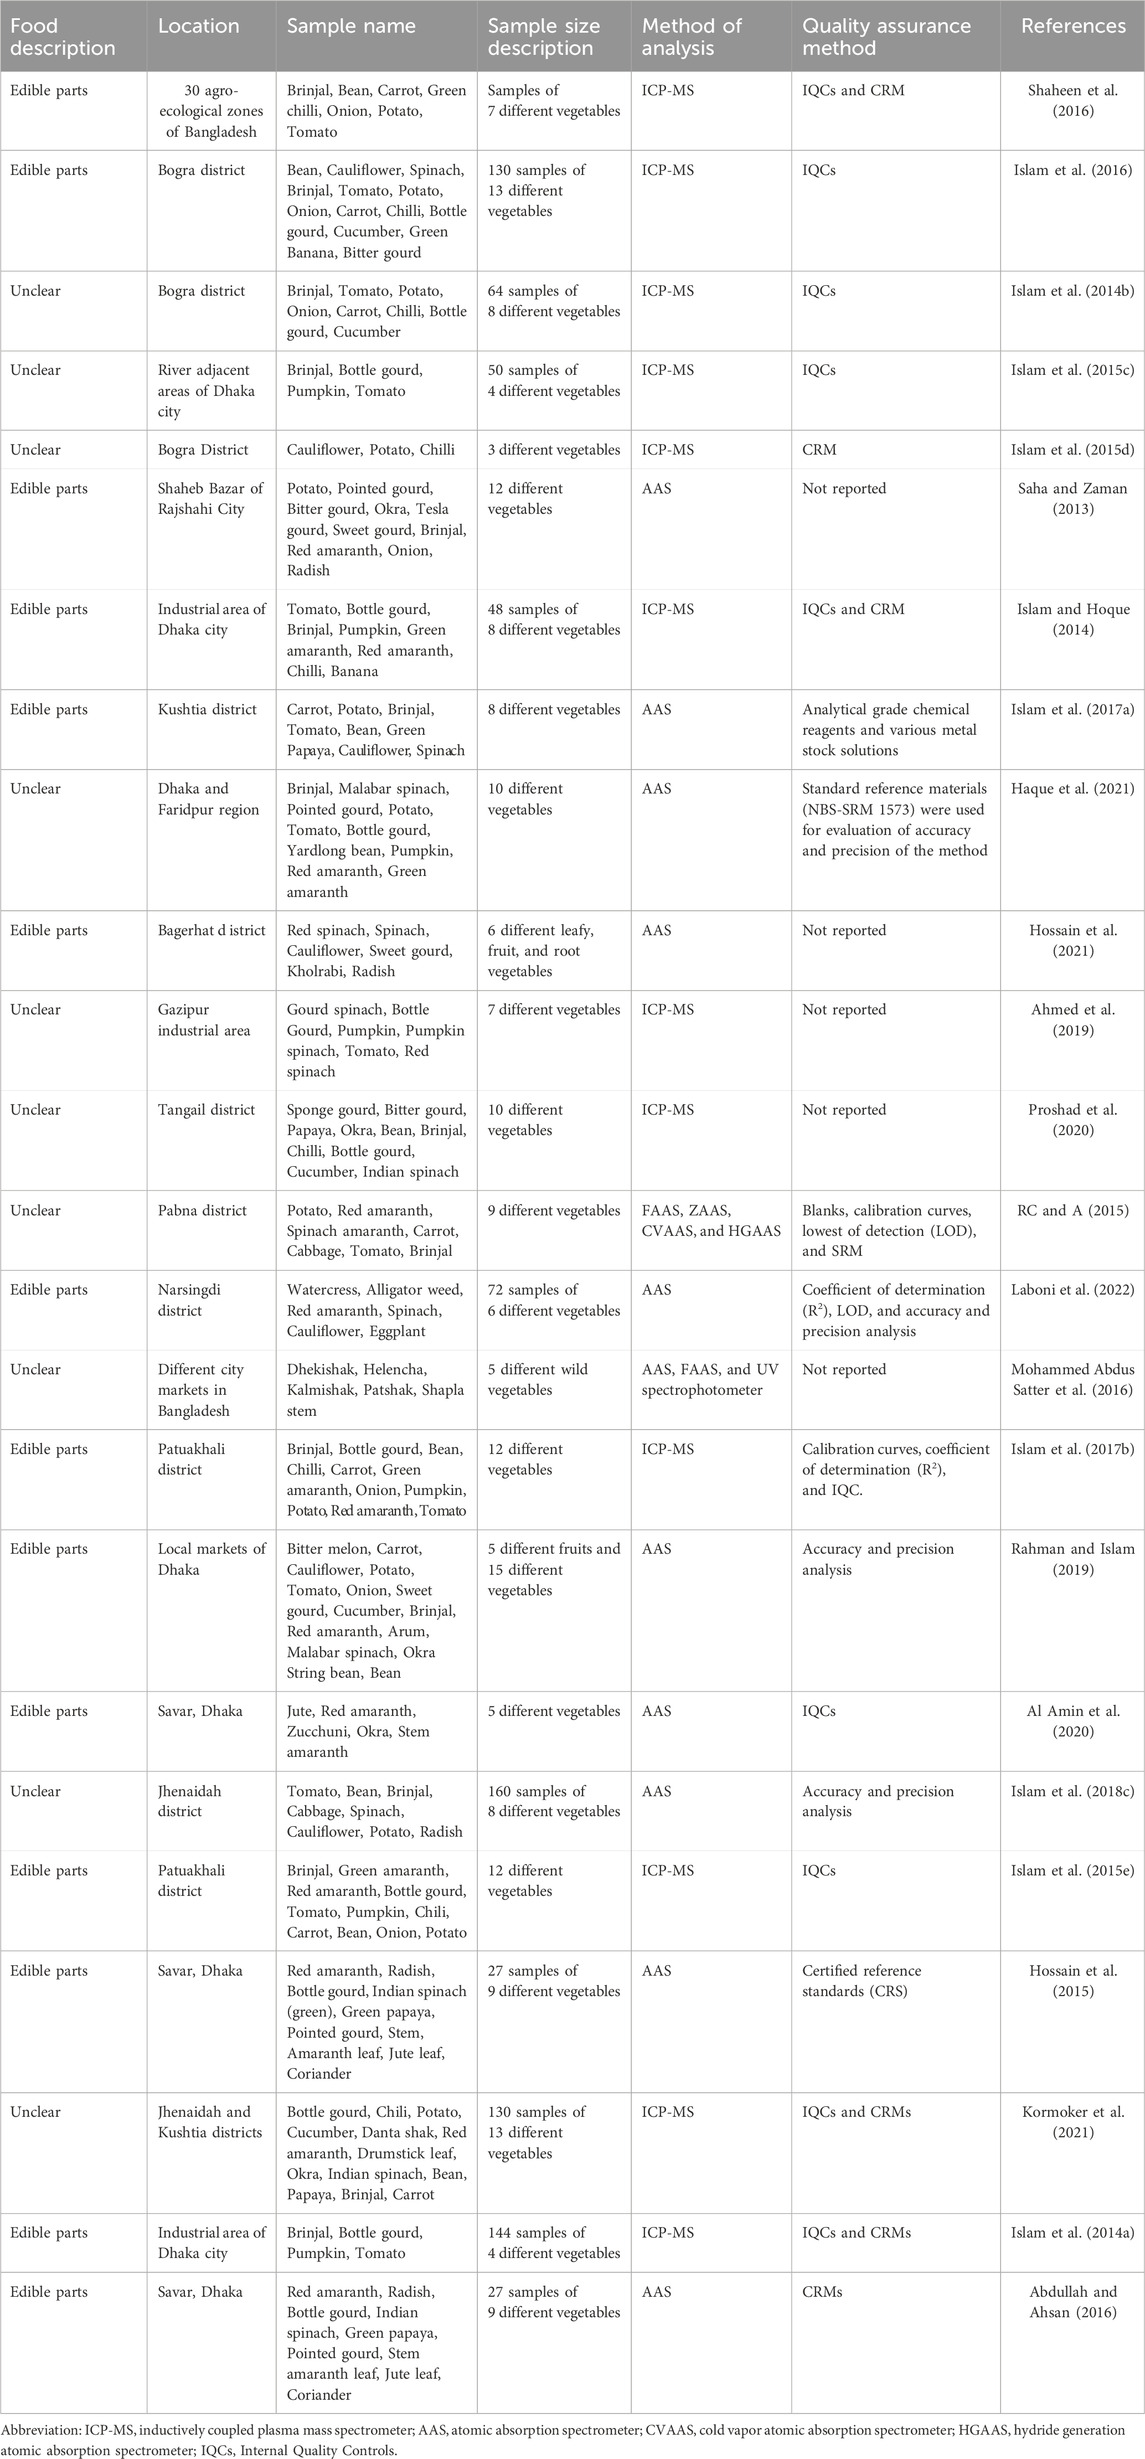
Table 1. Characteristics of the included studies (n = 24).
3.3 Metal concentration in vegetable samples
The concentration of heavy metals in the vegetable samples is presented in Table 2. In this study, the As concentration of vegetables ranged from 0.02 to 0.45 mg/kg where the lowest content was found in string beans and the highest in coriander. Another study conducted in the 30 agroecological zones of Bangladesh reported As content in beans as 0.018 mg/kg (Shaheen et al., 2016). Almost all the vegetables, except radish, sweet gourd, tesla gourd, and jute leaf had As content above its maximum allowable concentration (MAC) (0.1 mg/kg). In a study, the mean As concentration varied from 0.13 mg/kg to 0.52 mg/kg among different vegetables (Islam et al., 2016). Conversely, another study reported a lower mean concentration of As in the vegetables which was 0.05 mg/kg (Rahman et al., 2013). Arsenic (As) is one of the harmful heavy metals and a global public health concern. This ubiquitous metal is found in food, water, and the environment as a contaminant and is notoriously known as the “king of poisons”. Arsenic exposure affects the majority of the human body organs and hamper vital body systems such as cardiovascular systems, renal systems, reproductive systems, respiratory systems, and nervous systems (Rahman et al., 2018; Rahaman et al., 2021; Shaji et al., 2021). In Bangladesh, arsenic-contaminated drinking water is regarded as one of the significant public health threats (Rahman et al., 2018). Recent studies established that arsenic contamination in groundwater has been found in 62 districts out of 64 districts of the country (Ahmad et al., 2018). This contaminated groundwater is often used in the cultivation of food crops leaving staple crops and other foodstuffs contaminated with As. Among the contaminated foodstuffs rice and vegetables are the most common sources of As for the Bangladeshi population (Ahmed et al., 2016). Moreover, fertilizers, pesticides, industrial waste, etc. also contribute to the As pollution in the water leading to penetrating the food chain of humans. Limited use of chemical fertilizers, and proper management of industrial waste might help in resolving As contamination in Bangladesh.
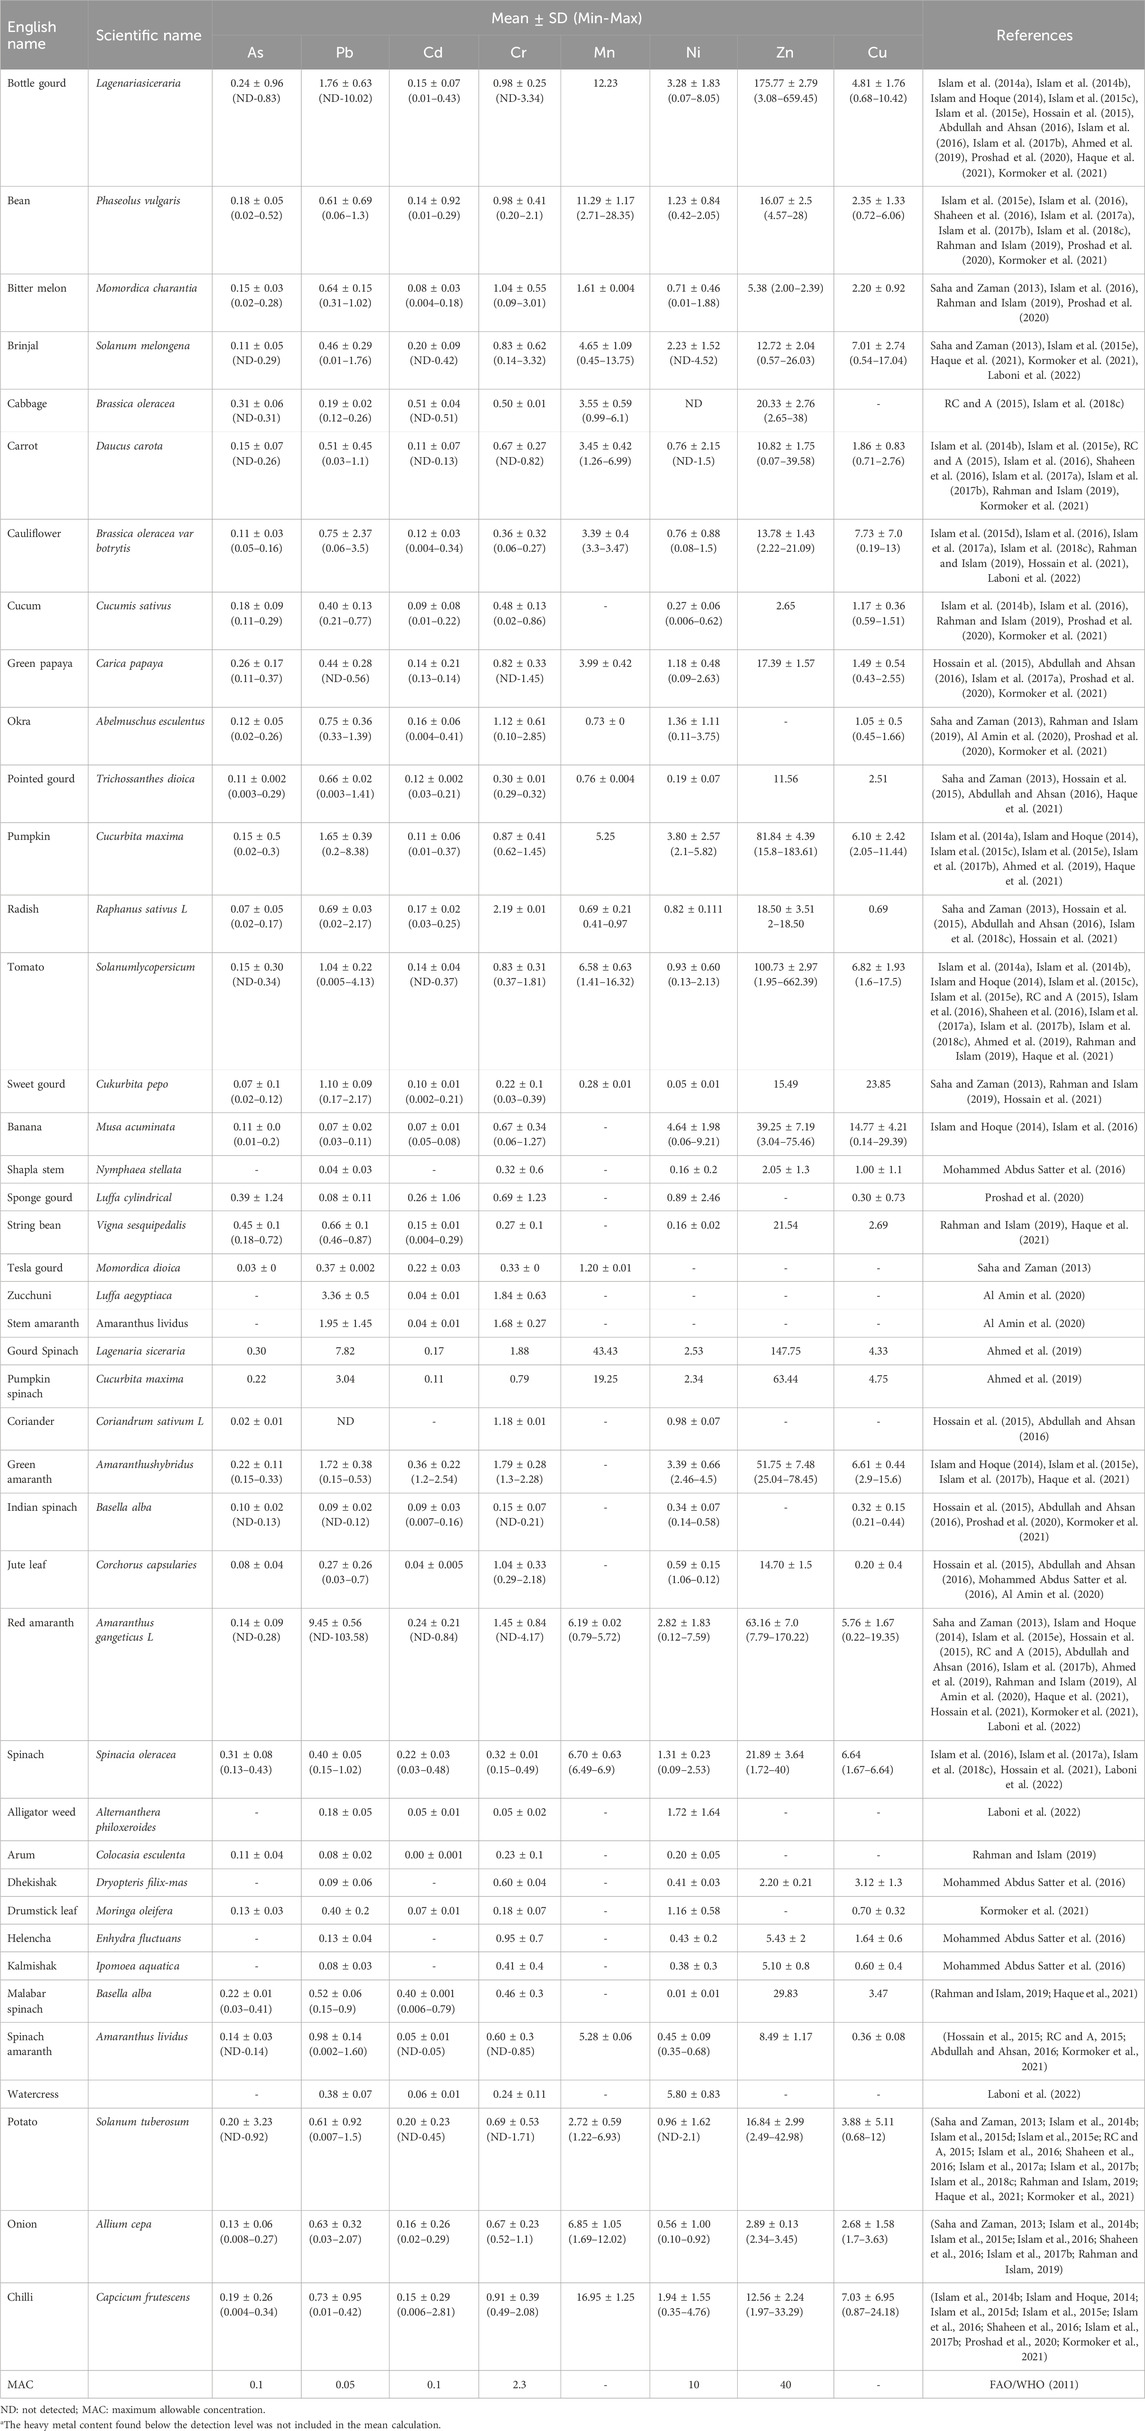
Table 2. Heavy metal content in vegetables (mg/kg of fresh edible weight) of Bangladesh.
Pb was present in all the vegetable samples and the lowest content of Pb was found in coriander (0.02 mg/kg) whereas the highest content of Pb was found in red amaranth (9.45 mg/kg). On the other hand, a study conducted in the 9 industrial areas of Dhaka city found the highest concentration of Pb in bottle gourd (2.2 mg/kg) (Islam et al., 2014a). Another study on vegetables in the Chapai Nawabganj district reported the Pb concentration of the samples in the range of 3E-05 to 7E-04 mg/kg (Islam et al., 2015a). Though the MAC of Pb is 0.05 mg/kg, except for corriander and shapla stem all the vegetable samples exceeded this permissible limit. Pb, a highly toxic element, poses harmful toxic effects to many organs of the human body. This heavy metal can be ingested in the body through air, food, water, and through the skin. Exposure to Pb can cause serious effects leading to neurological, respiratory, cardiovascular, and urinary disorders. Moreover, Pb could disrupt the oxidant-antioxidant system of the body and can cause oxidative imbalance and inflammatory mechanisms (Balali-Mood et al., 2021). Pb toxicity can adversely affect children resulting in poor brain development and intelligence outcomes (Kiran and Sharma, 2022). Among the many sources of Pb, chemical fertilizers, pesticides, industrial waste, municipal waste, traffic, etc. substantially contaminate the air, and water with Pb which then comes to the food chain (vegetables, rice, fruits, etc.) to the human body. To secure public health the possible sources of these hazardous metals should be monitored and controlled.
Among the vegetable samples, arum (0.0 mg/kg) had the lowest concentration of Cd followed by stem amaranth, jute leaves, and zucchini. On the other hand, the highest Cd concentration was found in cabbage (0.51 mg/kg) which was above its maximum permissible limit (0.1 mg/kg). In a review study on heavy metals concentration of vegetables, the authors reported Cd level in the range of 0.01–0.74 mg/kg with a mean concentration of 0.16 mg/kg (Abu Rayhan Khan and Hosna, 2021). Several other studies conducted in Dhaka reported Cd concentrations in vegetables as 0.008–0.056 mg/kg (Shaheen et al., 2016), 0.001–1.6 mg/kg (Islam et al., 2015b), and 0.23–0.51 mg/kg (Islam et al., 2018). People who get exposed to high levels of Cd may develop symptoms of kidney disease, hypertension, prostatic lesions, and bone fractures. This heavy metal can be ingested in the human body through air, water, soil, contaminated food, and even through smoking (Balali-Mood et al., 2021). Apart from these sources, another major source of Cd is occupational exposure which can occur in alloy, battery, glass, and electroplating industries.
In this study, Cr was also found in all the vegetable samples. The maximum and minimum levels of Cr were found in radish (2.19 mg/kg) and alligator weed (0.05 mg/kg), respectively. Similarly, a study reported the highest concentration of Cr in radish (4.14 mg/kg) which was relatively higher than our study’s finding (Abdullah and Ahsan, 2016). The differences in the results can be due to the nature of the studies as the present study is a review and another is original research conducted in the industrial areas of Dhaka city. When compared to the WHO/FAO standards the present study found Cr concentrations in all vegetable samples below the maximum permissible value (2.3 mg/kg). Though Cr is less toxic than other heavy metals its bioaccumulation in the body can develop several cancers including kidney, bone, lungs, and larynx (Fang et al., 2014). According to a study by Islam et al. (2018) highlighted industrial and municipal waste as the sources of Cr in Bangladesh (Islam et al., 2018). Controlled regulations, monitoring, and management of industrial and municipal waste might contribute to reducing Cr contamination to the environment and foodstuffs.
Manganese, the most abundant heavy metals, can be found in different oxidation states in nature. In the present study, the lowest and highest levels of Mn were observed in tesla gourd (1.20 mg/kg) and gourd spinach (43.43 mg/kg). These results were congruent with other study findings which also reported gourd spinach as the highest Mn containing vegetable (Ahmed et al., 2019). Previous studies found Mn concentration in the range of 2.01–6.49 mg/kg (Islam et al., 2017), 1.36–8.12 mg/kg (Saha and Zaman, 2013), and 0.99–5.72 mg/kg (RC and A, 2015). Although there is little evidence regarding the MAC of Mn in vegetables chronic overexposure to Mn can affect the nervous system (Miah et al., 2020).
Nickel is a minor essential metal, but it is toxic at higher concentrations. In the vegetable samples, the Ni concentration varied in the range of 0.01–4.64 mg/kg with the lowest in malabar spinach and the highest in banana. Conversely, banana was found to be the lowest source of Ni concentration in another study (Shaheen et al., 2016). A previous study detected Ni concentration in the range of 0.072–1.069 mg/kg which was quite lower than the present study findings. The study also identified bottle gourd having the highest Ni concentration (Hossain et al., 2015). All the vegetable samples contained Ni concentration below its MAC of 10 mg/kg of fresh weight. However, different results were observed in another study where Ni content in vegetables crossed the standard safe limit (Abu Rayhan Khan and Hosna, 2021). Although Ni can be found in smaller amounts in the environment it can cause a wide range of diseases namely pulmonary diseases, lung inflammation, fibrosis, and epigenetic effects (Kiran and Sharma, 2022).
In the present study, most of the vegetables contained Zn more than its standard allowable limit. The highest content of Zn was found in bottle gourd (175.77 mg/kg) and the lowest content was in shapla stem (2.05 mg/kg). Moreover, the Zn concentration in the bottle gourd was more than 3.5 times higher than its maximum permissible limit. Other studies reported the highest concentration of Zn in tomatoes and the lowest in cauliflower (Islam et al., 2017). A study conducted in the severe As-contaminated area of Bangladesh reported a high median concentration (50 mg/kg) of Zn in the vegetables (Abedin et al., 2021). Zn is a fundamental metal. It is essential for the development and growth of the body as it acts as a co-factor in different enzymatic reactions. Zn toxicity known as Zn toxicosis can lead to liver and kidney failure, anemia, bloody urine, and nausea (Ahmed et al., 2021).
In the case of Cu, the mean concentration varied in the range of 0.20–23.85 mg/kg in the vegetable samples with the highest Cu content present in sweet gourd. The Cu concentration in the vegetables decreased in the following order sweet gourd > banana > cauliflower > chili > tomato where the lowest content was found in jute leaf. The highest mean concentration of Cu was found at 16 mg/kg in brinjal (Islam et al., 2015c). Another study reported the concentration of Cu in the vegetables where the non-leafy vegetables possessed higher concentration in comparison to the leafy vegetables (Abedin et al., 2021). Cu is one of the essential micronutrients that play a significant role in the normal physiological functions of the human body. However, excess Cu exposure can induce toxicity and can cause lung and kidney damage (Ahmed et al., 2021).
Like Bangladesh, different studies from neighboring countries of Bangladesh like India (Gupta et al., 2021; Mawari et al., 2022), and Pakistan (Jehan et al., 2022) also showed various hazardous heavy metal contents in vegetables and other foodstuffs. The concentrations of different heavy metals especially Pd, Cd, and Cr were reported to exceed the safety levels in different vegetables.
3.4 Estimated daily intake of heavy metals
Heavy metals can be transported to humans through air, water, or through food ingestion. Through consuming contaminated vegetables, humans may get exposed to toxic heavy metals which can negatively impact their health. Thus, estimating the EDI of heavy metals from vegetables is an important way to assess the health hazards associated with vegetable consumption. The EDI of the heavy metals and their maximum tolerable daily intake (MTDI) have been reported in Table 3. EDI values of the vegetables were calculated using the mean concentration of each metal and their daily consumption rate. The total EDI of metals from all vegetables were below their MDTI level except for Pb which had the total EDI value of 0.073 in comparison with its MDTI value of 0.021. Total EDI values from all vegetables decreased in the following order: Zn > Mn > Cu > Ni Pb > Cr > Cd > As.
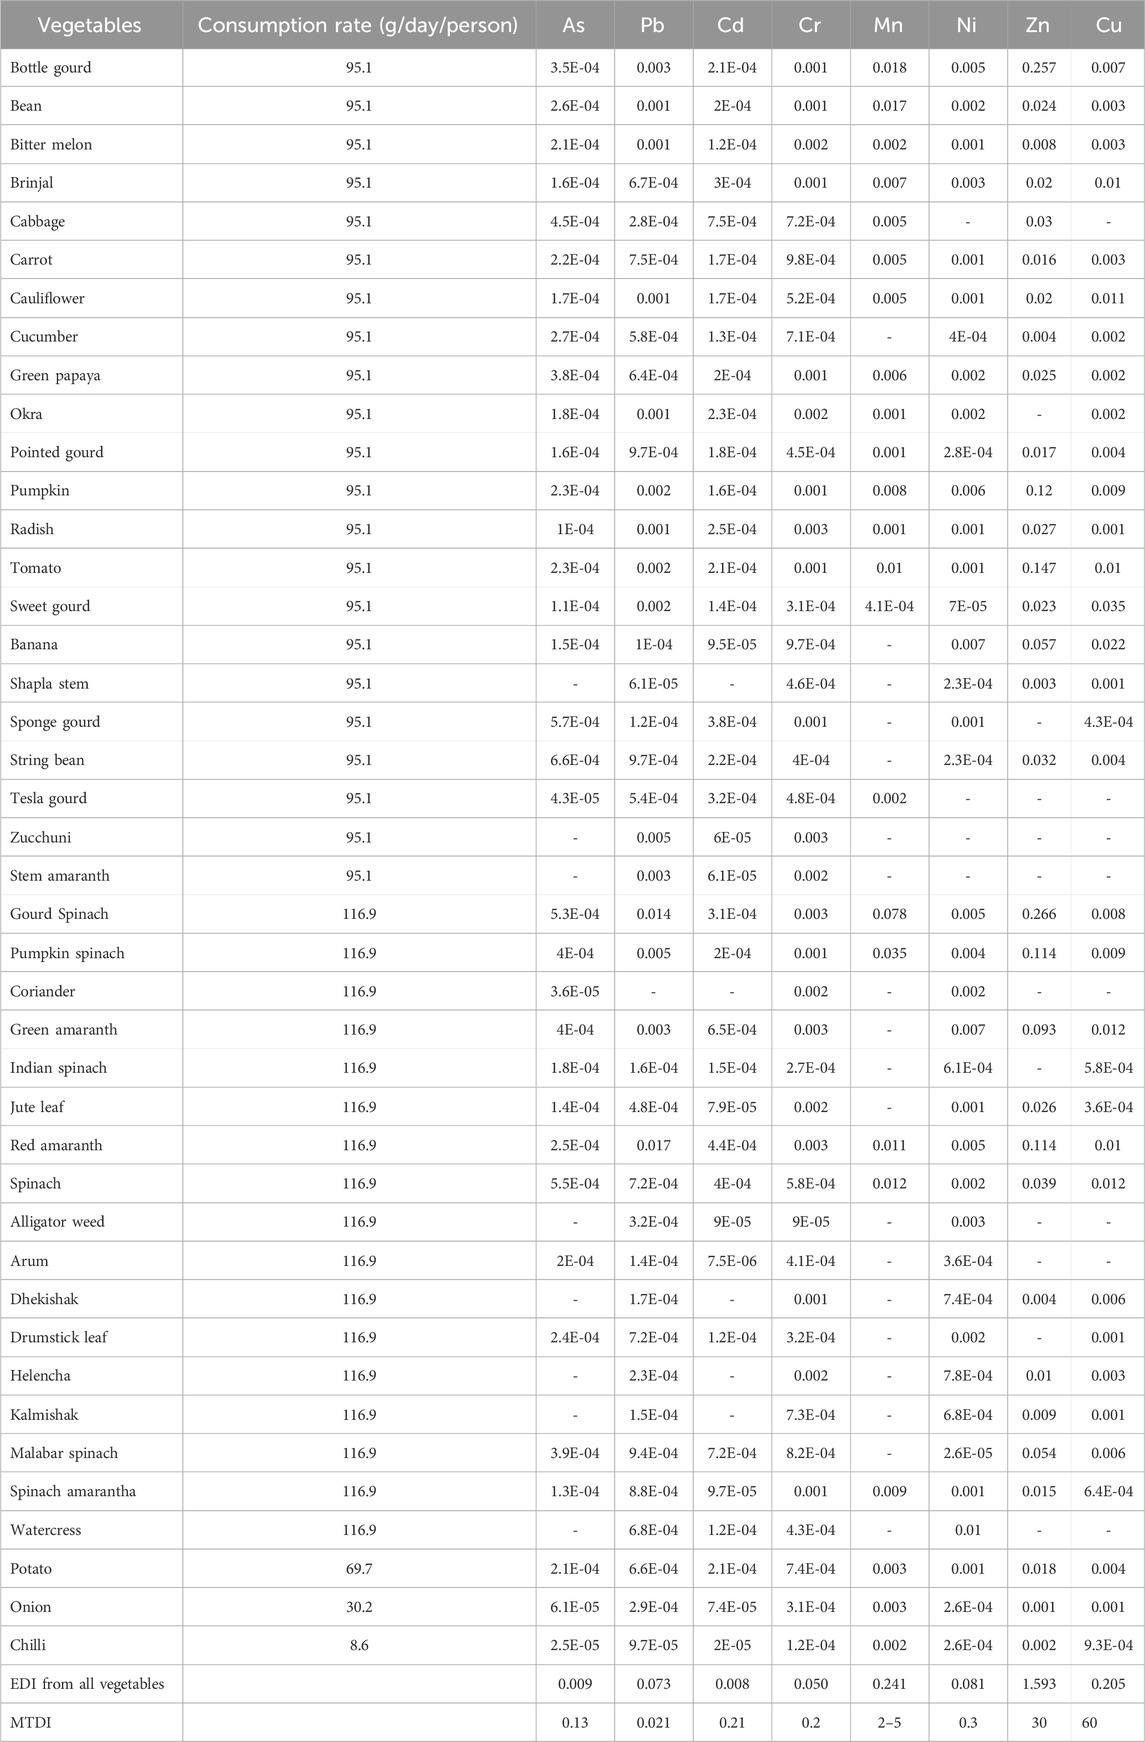
Table 3. Estimated daily intake (EDI) of heavy metals in vegetables with the corresponding maximum tolerable daily intake (MTDI) in the Bangladeshi population.
3.5 Noncarcinogenic risk of heavy metals
THQ is one of the most widely used methods for assessing the non-carcinogenic risks of being exposed to heavy metals. Calculating THQ values is important because a THQ value greater than 1 indicates that there are chances of developing non-carcinogenic health hazards from ingestion of these heavy metals. Table 4 shows the THQ values of the studied heavy metals and the TTHQ of the varieties of vegetable samples. The study findings present that except As and Pb all the heavy metals had a THQ value of less than 1 for all vegetable samples. TTHQ was found to be >1 for all the heavy metals except for Cr indicating that an individual may experience health hazards if they ingested these heavy metals from only consuming these vegetables. However, in a study by Shaheen et al., (2016), the authors found the TTHQ value of Cr and Ni > 1.
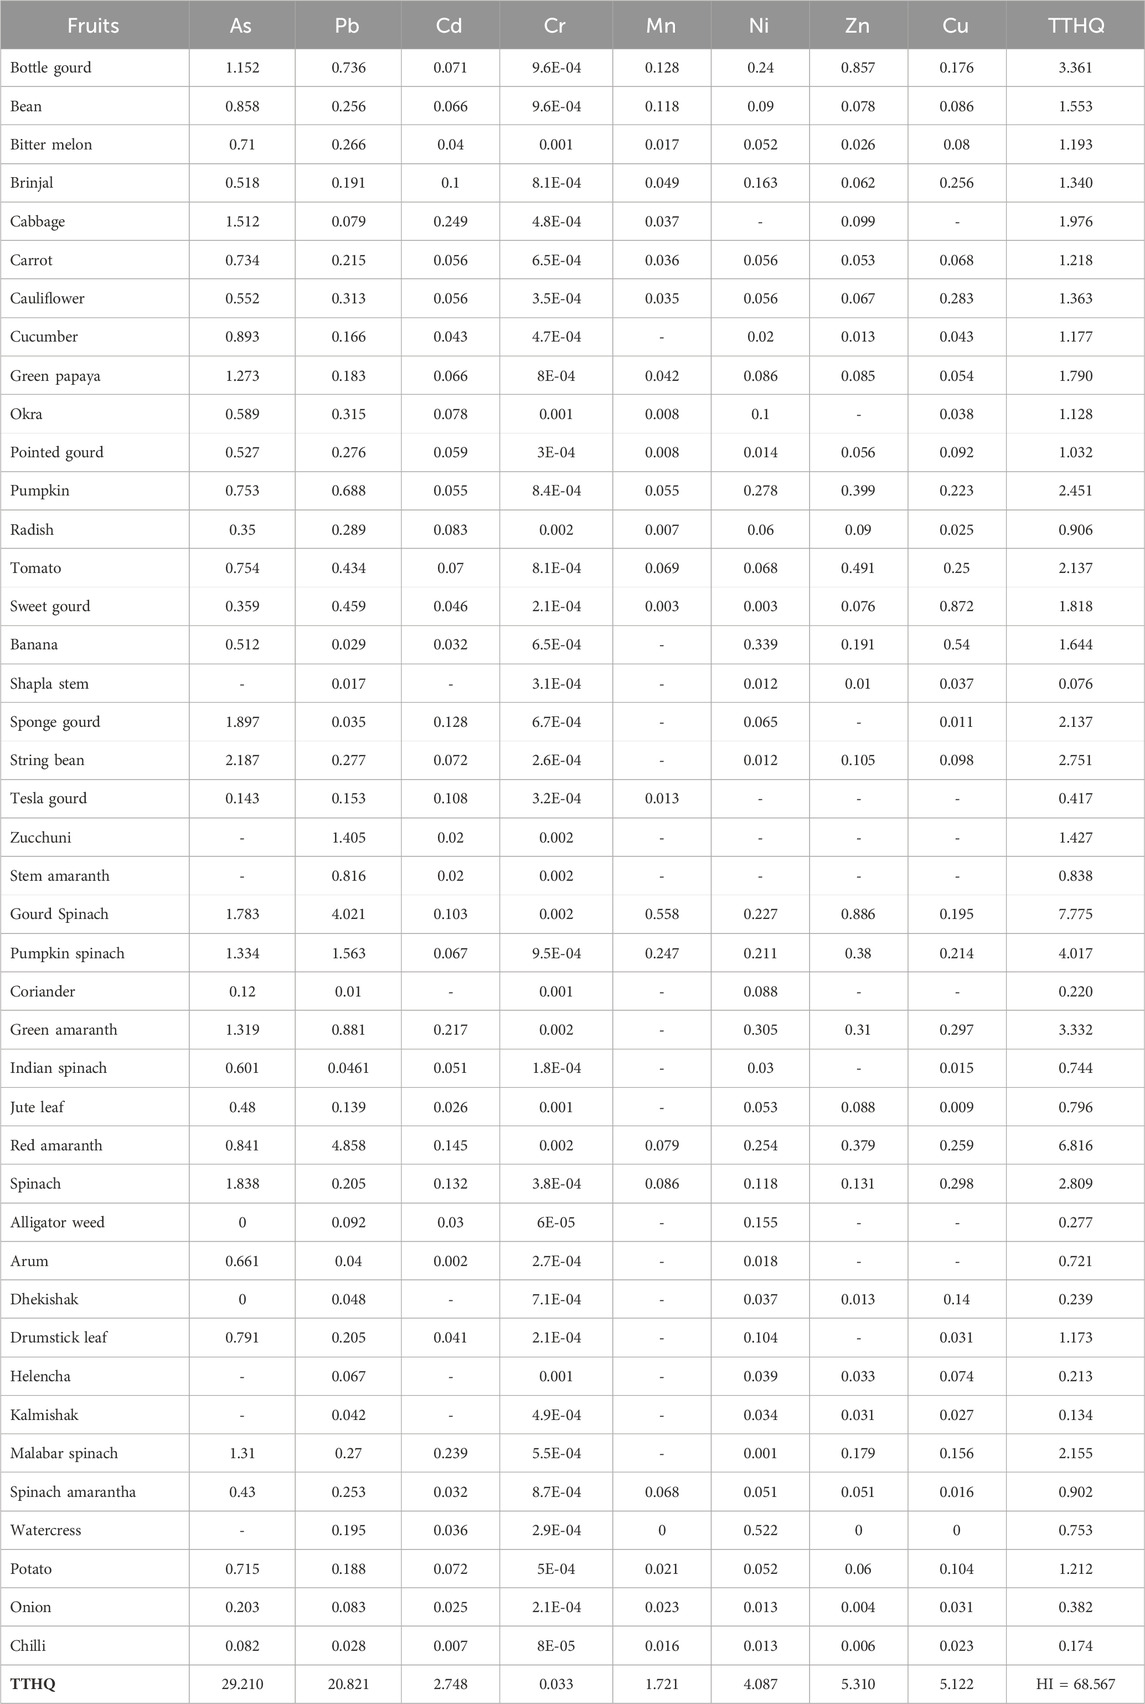
Table 4. Target hazard quotient (noncarcinogenic risk) of heavy metals from consuming vegetables in Bangladesh.
TTHQ value was highest for As which was about 29 times more than the acceptable threshold. Exposure to inorganic arsenic (iAs) is a crucial health problem that hampers 140 million people worldwide. Acute iAs exposure leads to symptoms of diarrhea, vomiting, and nausea whereas chronic iAs exposure may increase the odds of developing non-malignant health effects in hepatic, neurological, and cardiovascular systems (Martínez-Castillo et al., 2021). Similarly, exposure to Pb induces non-carcinogenic adverse effects on the biological, neurological, and cognitive functions of the human body. The TTHQ value for Pb was around 20 times higher than the acceptable limit in the vegetable samples of the study.
The majority of the TTHQ values of the vegetable samples were >1 except radish, shapla stem, stem amaranth, kalmishak, tesla gourd, and onion. Red amaranth had the highest TTHQ value which implies significant health risk from its consumption. HI value expresses the combined noncarcinogenic effects of multiple metals. In this study, the HI was greater than 1 indicating that consumers may suffer from adverse health effects if they consumed all these vegetable samples. Consequently, consuming these vegetables is not considered safe and their regular consumption is not recommended.
3.6 Carcinogenic risk of heavy metals
The study presents the TRs of As, Pb, Cd, Cr, and Ni due to the consumption of the vegetable samples reported in Table 5. The TRs of the targeted metals were assessed as these metals may have carcinogenic effects depending on the ingestion dose. Previous studies show that exposure to these heavy metals can cause chronic poisoning in the body leading to immune system dysfunctions, vascular damage, and different types of cancer (Balali-Mood et al., 2021). The results show that TRs of As and Pb ranged from 3.7E-05 to 9.8E-04 and 3.1E-07 to 9.8E-04, respectively. Evidence suggests exposure to one or more metals simultaneously may have cumulative effects such as lead and arsenic poisoning both may cause combined damage to central nervous system injury (Balali-Mood et al., 2021). The study considered total TR > 10−4 to be unacceptable by following the standards set by the USEPA. Total TR values of As, Cd, Cr, and Ni exceeded the acceptable range which implies that a person may develop carcinogenic effects induced by these heavy metals upon consuming them. Carcinogenic metals like Cd, As, and Cr can damage the process of DNA synthesis and repair (Clancy et al., 2012; Koedrith et al., 2013). Likewise, another carcinogenic metal Ni can disrupt several internal mechanisms including oxidative stress, lung toxicity, and apoptosis (Latvala et al., 2016). Though other studies (Islam et al., 2014a; Islam et al., 2017; Islam et al., 2018) found the total TR value for Pb above the acceptable range in this study the total TR of Pb was within the limit. This indicates little or no Pb-induced carcinogenic effects from consuming these vegetables. The total TR of the metals ranked as Ni > Cd > Cr > As > Pb.
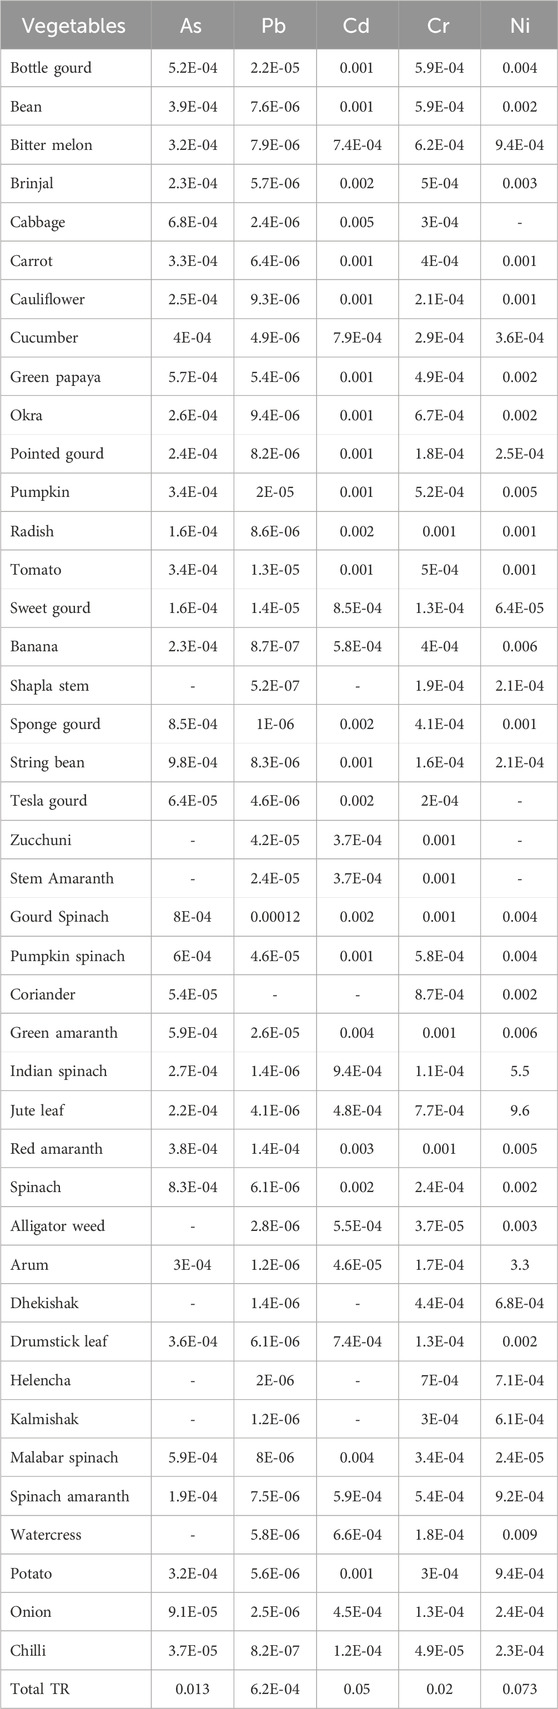
Table 5. Target carcinogenic risk (TR) of heavy metals due to consumption of vegetables in Bangladesh.
3.7 Limitations and recommendations for future work
The present study has some limitations. Firstly, the study included results from two electronic databases only which might cause the missing out of some of the relevant literature from other databases. However, the results of Google Scholar alone can provide sufficient literature for systematic reviews and meta-analyses (Gehanno et al., 2013). Secondly, the study results summarized the findings of studies conducted in the industrial, non-industrial, and polluted areas of Bangladesh. Thus, it would be difficult to generalize the results as the real scenario of the vegetables of the country. The review did not assess the methodological quality of the included studies. Nonetheless, we reviewed the quality assurance methods and analysis methods of the studies. Moreover, as heavy metals-related studies are conducted frequently in Bangladesh, further review studies might be imperative to cover the latest publications beyond our searching period. Despite these limitations, the study revealed important findings by providing an overview of the present heavy metal contents in Bangladeshi vegetables and their potential health risks. The findings will help to develop policies regarding the contamination management strategies of heavy metals and regulations to protect the environment from different heavy metal pollution. Future studies may focus on identifying area-specific potential sources of heavy metals in vegetables and their possible entry roots in the food supply chain. Prospective research on heavy metals in vegetables may include a detailed description of the sample, along with a detailed sampling strategy and quality assurance methods for increasing the reliability of the results.
4 Conclusion and recommendation
The review presented an overview of the heavy metal concentrations present in Bangladeshi vegetables along with their potential associated health risks. The heavy metal concentration varied widely with different vegetables and almost all the vegetable samples except for Ni exceeded the maximum allowable concentration of the heavy metals. TTHQ values were >1 for all the eight heavy metals except Cr and the total TR value was above the safe limit for As, Cd, Cr, and Ni. As vegetables are one of the major components of the habitual Bangladeshi diet it is crucial to maintain their quality. Consumption of these contaminated vegetables can pose a major threat to the public health of the Bangladeshi population. A more integrated approach to regularly investigate the edible portions of vegetables for heavy metals and strategies to reduce the contamination burden is paramount to conserve the overall health of the population.
Data availability statement
The original contributions presented in the study are included in the article/Supplementary Material, further inquiries can be directed to the corresponding author.
Author contributions
AN: Conceptualization, Data curation, Formal Analysis, Methodology, Software, Writing–original draft, Writing–review and editing. MH: Conceptualization, Data curation, Formal Analysis, Methodology, Software, Writing–original draft, Writing–review and editing. SI: Conceptualization, Methodology, Supervision, Writing–original draft, Writing–review and editing. AJ: Formal Analysis, Methodology, Visualization, Writing–original draft, Writing–review and editing. MN: Formal Analysis, Methodology, Visualization, Writing–original draft, Writing–review and editing.
Funding
The author(s) declare that financial support was received for the research, authorship, and/or publication of this article. The publication fee was provided by the University of Dhaka, Bangladesh.
Acknowledgments
The authors gratefully acknowledge the financial support from the University of Dhaka, Bangladesh to cover the APC.
Conflict of interest
The authors declare that the research was conducted in the absence of any commercial or financial relationships that could be construed as a potential conflict of interest.
Publisher’s note
All claims expressed in this article are solely those of the authors and do not necessarily represent those of their affiliated organizations, or those of the publisher, the editors and the reviewers. Any product that may be evaluated in this article, or claim that may be made by its manufacturer, is not guaranteed or endorsed by the publisher.
References
Abdullah, M., and Ahsan, A. (2016). Public health risk assessment of chromium intake from vegetable grown in the wastewater irrigated site in Bangladesh. Pollution 2 (4), 425–432.
Abedin, M., Hassan, M., and Rahman, S. (2021). A comprehensive review on heavy metal contamination in the urban river Buriganga Bangladesh: restoration perspectives. Int. J. Biosci. 6655 , 164–181.
Abu Rayhan Khan, M., and Hosna, A. M. (2021). A review on heavy metals in vegetables available in Bangladesh. J. Hum. Environ. Heal Promot. 7 (3), 108–119. doi:10.52547/jhehp.7.3.108
Ahmad, S. A., Khan, M. H., and Haque, M. (2018). Arsenic contamination in groundwater in Bangladesh: implications and challenges for healthcare policy. Risk Manag. Healthc. Policy 11, 251–261. doi:10.2147/rmhp.s153188Available at: https://www.tandfonline.com/action/journalInformation?journalCode=drmh20
Ahmed, A., Sara, T. A., Sundas, R. Q., and Man-Qun, W. (2021). Heavy metals and pesticides toxicity in agricultural soil and plants: ecological risks and human health implications. Toxics 9, 42. doi:10.3390/toxics9030042
Ahmed, M. K., Shaheen, N., Islam, M. S., Habibullah-Al-Mamun, M., Islam, S., Islam, M. M., et al. (2016). A comprehensive assessment of arsenic in commonly consumed foodstuffs to evaluate the potential health risk in Bangladesh. Sci. Total Environ. 544, 125–133. doi:10.1016/j.scitotenv.2015.11.133
Ahmed, M. S., Biswas, Md., Mahfuzul, H., Mottalib, M. A., Alam, M. N., and Khan, M. (2019). Translocation of heavy metals from industry into vegetables and crops through water and soil of Mokesh Beel in Bangladesh and their impact on human body. IOSR J. Environ. Sci. Toxicol. Food Technol. 13 (5), 59–71.
Al Amin, M., Rahman, M. E., Hossain, S., Rahman, M., Rahman, M. M., Jakariya, M., et al. (2020). Trace metals in vegetables and associated health risks in industrial areas of savar, Bangladesh. J. Heal Pollut. 10 (27), 200905. doi:10.5696/2156-9614-10.27.200905
Bahiru, D. B., and Yegrem, L. (2021). Levels of heavy metal in vegetable, fruits and cereals crops in Ethiopia: a levels of heavy metal in vegetable, fruits and cereals crops in Ethiopia: a review. Int. J. Environ. Monit. Anal. 9, 96–103.
Balali-Mood, M., Naseri, K., Tahergorabi, Z., Khazdair, M. R., and Sadeghi, M. (2021). Toxic mechanisms of five heavy metals: mercury, lead, chromium, cadmium, and arsenic. Front. Pharmacol. 12, 643972–644019. doi:10.3389/fphar.2021.643972
Baruthio, F. (1992). Toxic effects of chromium and its compounds. Biol. Trace Elem. Res. 32 (1–3), 145–153. doi:10.1007/bf02784599
BBS (Bangladesh Bureau of Statistics) (2022). Household income and expenditure survey (HIES) 2022. Statistics and Informatics Division. 2022. Schiltach: BBS.
Clancy, H. A., Sun, H., Passantino, L., Kluz, T., Muñoz, A., Zavadil, J., et al. (2012). Gene expression changes in human lung cells exposed to arsenic, chromium, nickel or vanadium indicate the first steps in cancer. Metallomics. 4 (8), 784–793. doi:10.1039/c2mt20074k
Fang, Z., Zhao, M., Zhen, H., Chen, L., Shi, P., and Huang, Z. (2014). Genotoxicity of tri- and hexavalent chromium compounds in vivo and their modes of action on DNA damage in vitro. PLoS One 9 (8), e103194. doi:10.1371/journal.pone.0103194Available at: https://journals.plos.org/plosone/article?id=10.1371/journal.pone.0103194.
FAO/WHO (2011). Joint FAO/WHO food standards programme codex committee on contaminants in foods, food CF/5 INF/1. Fifth session. The Hague, The Netherlands: FAO/WHO. Available at: ftp://ftp.fao.org/codex/meetings/CCCF/cccf5/cf05_INF.pdf
Gehanno, J.-F., Rollin, L., and Darmoni, S. (2013). Is the coverage of google scholar enough to be used alone for systematic reviews. BMC Med. Inf. Decis. Mak. 13 (7), 7. doi:10.1186/1472-6947-13-7
Godt, J., Scheidig, F., Grosse-Siestrup, C., Esche, V., Brandenburg, P., Reich, A., et al. (2006). The toxicity of cadmium and resulting hazards for human health. J. Occup. Med. Toxicol. 1 (1), 22–26. doi:10.1186/1745-6673-1-22
Gupta, N., Yadav, K. K., Kumar, V., Krishnan, S., Kumar, S., Nejad, Z. D., et al. (2021). Evaluating heavy metals contamination in soil and vegetables in the region of North India: levels, transfer and potential human health risk analysis. Environ. Toxicol. Pharmacol. 82, 103563. doi:10.1016/j.etap.2020.103563
Haque, M. M., Niloy, N. M., Khirul, M. A., Alam, M. F., and Tareq, S. M. (2021). Appraisal of probabilistic human health risks of heavy metals in vegetables from industrial, non-industrial and arsenic contaminated areas of Bangladesh. Heliyon 7 (2), e06309. doi:10.1016/j.heliyon.2021.e06309
Hong, Y. S., Song, K. H., and Chung, J. Y. (2014). Health effects of chronic arsenic exposure. J. Prev. Med. Public Heal 47 (5), 245–252. doi:10.3961/jpmph.14.035
Hossain, M. S., Ahmed, F., Abdullah, A. T. M., Akbor, M. A., and Ahsan, M. A. (2015). Public health risk assessment of heavy metal uptake by vegetables grown at a waste-water-irrigated site in Dhaka, Bangladesh. J. Heal Pollut. 5 (9), 78–85. doi:10.5696/2156-9614-5-9.78
Hossain, N., Islam, AKMN, Akter, S., Salem, K. M., Azim, M. A., and Begum, N. N. (2021). Health risks assessment of heavy metals in vegetables collected from Bagerhat district. Int. J. Eng. Sci. 10 (10), 27–33.
ICMR-NIN (2020). Recommended dietary allowances and estimated average requirements - 2020 ICMR-national institute of nutrition. Secunderabad: ICMR-NIN.
Islam, M., Ahmed, M., Proshad, R., and Ahmed, S. (2017b). Assessment of toxic metals in vegetables with the health implications in Bangladesh. Adv. Environ. Res. 6 (4), 241–254.
Islam, M. A., Romić, D., Akber, M. A., and Romić, M. (2018b). Trace metals accumulation in soil irrigated with polluted water and assessment of human health risk from vegetable consumption in Bangladesh. Environ. Geochem Health 40 (1), 59–85. doi:10.1007/s10653-017-9907-8
Islam, M. M., Karim, M. R., Zheng, X., and Li, X. (2018a). Heavy metal and metalloid pollution of soil, water and foods in Bangladesh: a critical review. Int. J. Environ. Res. Public Health 15 (12), 2825. doi:10.3390/ijerph15122825
Islam, M. S., Ahmed, M. K., and Habibullah-Al-Mamun, M. (2015b). Determination of heavy metals in fish and vegetables in Bangladesh and health implications. Hum. Ecol. Risk Assess. 21 (4), 986–1006. doi:10.1080/10807039.2014.950172
Islam, M. S., Ahmed, M. K., and Habibullah-Al-Mamun, M. (2015e). Metal speciation in soil and health risk due to vegetables consumption in Bangladesh. Environ. Monit. Assess. 187 (5), 288. doi:10.1007/s10661-015-4533-3
Islam, M. S., Ahmed, M. K., and Habibullah-Al-Mamun, M. (2016). Apportionment of heavy metals in soil and vegetables and associated health risks assessment. Stoch. Environ. Res. Risk Assess. 30 (1), 365–377. doi:10.1007/s00477-015-1126-1
Islam, M. S., Ahmed, M. K., Habibullah-Al-Mamun, M., Islam, K. N., Ibrahim, M., and Masunaga, S. (2014b). Arsenic and lead in foods: a potential threat to human health in Bangladesh. Food Addit. Contam. - Part A Chem. Anal. Control Expo. Risk Assess. 31 (12), 1982–1992. doi:10.1080/19440049.2014.974686
Islam, M. S., Ahmed, M. K., Habibullah-Al-Mamun, M., and Masunaga, S. (2014a). Trace metals in soil and vegetables and associated health risk assessment. Environ. Monit. Assess. 186 (12), 8727–8739. doi:10.1007/s10661-014-4040-y
Islam, M. S., Ahmed, M. K., Habibullah-Al-Mamun, M., and Masunaga, S. (2015a). Assessment of trace metals in fish species of urban rivers in Bangladesh and health implications. Environ. Toxicol. Pharmacol. 39 (1), 347–357. doi:10.1016/j.etap.2014.12.009
Islam, M. S., Ahmed, M. K., Habibullah-Al-Mamun, M., and Masunaga, S. (2015c). Assessment of trace metals in foodstuffs grown around the vicinity of industries in Bangladesh. J. Food Compos Anal. 42, 8–15. doi:10.1016/j.jfca.2014.12.031
Islam, M. S., Ahmed, M. K., Habibullah-Al-Mamun, M., and Raknuzzaman, M. (2015d). The concentration, source and potential human health risk of heavy metals in the commonly consumed foods in Bangladesh. Ecotoxicol. Environ. Saf. 122, 462–469. doi:10.1016/j.ecoenv.2015.09.022
Islam, Md S., and Hoque, M. F. (2014). Concentrations of heavy metals in vegetables around the industrial area of Dhaka city, Bangladesh and health risk assessment. Int. Food Res. J. 21 (6), 2121–2126.
Islam, R., Kumar, S., Karmoker, J., Sorowar, S., Rahman, A., and Tama Sarkar, N. B. (2017a). Heavy metals in common edible vegetables of industrial area in Kushtia, Bangladesh: a health risk study. Env. Sci. Ind. J. 13 (5), 1–13.
Islam, R., Kumar, S., Rahman, A., Karmoker, J., Ali, S., Islam, S., et al. (2018c). Trace metals concentration in vegetables of a sub-urban industrial area of Bangladesh and associated health risk assessment. AIMS Environ. Sci. 5 (3), 130–142. doi:10.3934/environsci.2018.3.130
Jehan, S., Muhammad, S., Ali, W., and Hussain, M. L. (2022). Potential risks assessment of heavy metal(loid)s contaminated vegetables in Pakistan: a review. Geocarto Int. 37 (24), 7287–7302. doi:10.1080/10106049.2021.1969449
Kiran, B. R., and Sharma, R. (2022). Effect of heavy metals: an overview. Mater Today Proc. 51, 880–885. doi:10.1016/j.matpr.2021.06.278
Koedrith, P., Kim, H. L., Il, W. J., and Seo, Y. R. (2013). Toxicogenomic approaches for understanding molecular mechanisms of heavy metal mutagenicity and carcinogenicity. Int. J. Hyg. Environ. Health 216 (5), 587–598. doi:10.1016/j.ijheh.2013.02.010
Kormoker, T., Proshad, R., Islam, M. S., Shamsuzzoha, M., Akter, A., and Tusher, T. R. (2021). Concentrations, source apportionment and potential health risk of toxic metals in foodstuffs of Bangladesh. Toxin Rev. 40 (4), 1447–1460. doi:10.1080/15569543.2020.1731551
Laboni, F. A., Ahmed, M. W., Kaium, A., Alam, M. K., Parven, A., Jubayer, M. F., et al. (2022). Heavy metals in widely consumed vegetables grown in industrial areas of Bangladesh: a potential human health hazard. Biol. Trace Elem. Res. 201 (0123456789), 995–1005. doi:10.1007/s12011-022-03179-6
Latvala, S., Hedberg, J., Di Bucchianico, S., Möller, L., Wallinder, I. O., Elihn, K., et al. (2016). Nickel release, ROS generation and toxicity of Ni and NiO micro- and nanoparticles. PLoS One 11 (7), 01596844–01596920. doi:10.1371/journal.pone.0159684
Martínez-Castillo, M., García-Montalvo, E. A., Arellano-Mendoza, M. G., Sánchez-Peña L del, C., Soria Jasso, L. E., Izquierdo-Vega, J. A., et al. (2021). Arsenic exposure and non-carcinogenic health effects. Hum. Exp. Toxicol. 40 (12), S826–S850. doi:10.1177/09603271211045955
Mawari, G., Kumar, N., Sarkar, S., Daga, M. K., Singh, M. M., Joshi, T. K., et al. (2022). Heavy metal accumulation in fruits and vegetables and human health risk assessment: findings from Maharashtra, India. Environ. Health Insights 16, 117863022211191. doi:10.1177/11786302221119151
Mengistu, D. A. (2021). Public health implications of heavy metals in foods and drinking water in Ethiopia (2016 to 2020): systematic review. BMC Public Health 21, 2114–2118. doi:10.1186/s12889-021-12189-3
Miah, M. R., Ijomone, O. M., Okoh, C. O. A., Ijomone, O. K., Akingbade, G. T., Ke, T., et al. (2020). The effects of manganese overexposure on brain health. Neurochem. Int. 135, 104688. doi:10.1016/j.neuint.2020.104688
Mohammed Abdus Satter, M., Khan, MMRL, Jabin, S. A., Abedin, N., Islam, M. F., and Shaha, B. (2016). Nutritional quality and safety aspects of wild vegetables consume in Bangladesh. Asian Pac J. Trop. Biomed. 6 (2), 125–131. doi:10.1016/j.apjtb.2015.11.004
Nakhaee, S., Amirabadizadeh, A., Brent, J., and Mehrpour, O. (2019). Impact of chronic lead exposure on liver and kidney function and haematologic parameters. Basic Clin. Pharmacol. Toxicol. 124 (5), 621–628. doi:10.1111/bcpt.13179
Nkwunonwo, U. C., Odika, P. O., and Onyia, N. I. (2020). A review of the health implications of heavy metals in food chain in Nigeria. Sci. World J. 2020, 1–11. doi:10.1155/2020/6594109
Onakpa, M. M., Njan, A. A., and Kalu, O. C. (2018). A review of heavy metal contamination of food crops in Nigeria. Ann. Glob. Heal 84 (3), 488–494. doi:10.29024/aogh.2314
Plum, L. M., Rink, L., and Hajo, H. (2010). The essential toxin: impact of zinc on human health. Int. J. Environ. Res. Public Health 7 (4), 1342–1365. doi:10.3390/ijerph7041342
Proshad, R., Kormoker, T., Islam, M. S., and Chandra, K. (2020). Potential health risk of heavy metals via consumption of rice and vegetables grown in the industrial areas of Bangladesh. Hum. Ecol. Risk Assess. 26 (4), 921–943. doi:10.1080/10807039.2018.1546114
Rahaman, M. S., Rahman, M. M., Mise, N., Sikder, M. T., Ichihara, G., Uddin, M. K., et al. (2021). Environmental arsenic exposure and its contribution to human diseases, toxicity mechanism and management. Environ. Pollut. 289, 117940. doi:10.1016/j.envpol.2021.117940
Rahman, M., and Islam, M. A. (2019). Concentrations and health risk assessment of trace elements in cereals, fruits, and vegetables of Bangladesh. Biol. Trace Elem. Res. 191 (1), 243–253. doi:10.1007/s12011-018-1596-3
Rahman, M. A., Rahman, A., Khan, M. Z. K., and Renzaho, A. M. N. (2018). Human health risks and socio-economic perspectives of arsenic exposure in Bangladesh: a scoping review. Ecotoxicol. Environ. Saf. 150, 335–343. doi:10.1016/j.ecoenv.2017.12.032
Rahman, M. M., Asaduzzaman, M., and Naidu, R. (2013). Consumption of arsenic and other elements from vegetables and drinking water from an arsenic-contaminated area of Bangladesh. J. Hazard Mater. 262, 1056–1063. doi:10.1016/j.jhazmat.2012.06.045
Rai, P. K., Lee, S. S., Zhang, M., Tsang, Y. F., and Kim, K. H. (2019). Heavy metals in food crops: health risks, fate, mechanisms, and management. Environ. Int. 125, 365–385. Available from:. doi:10.1016/j.envint.2019.01.067
Rayyan (2024). AI powered tool for systematic literature reviews. Available at: https://www.rayyan.ai/
Rc, T., and A, R. (2015). Heavy metals contamination in vegetables and its growing soil. J. Environ. Anal. Chem. 02 (03), ■■■. doi:10.4172/2380-2391.1000142
Saha, N., and Zaman, M. R. (2013). Evaluation of possible health risks of heavy metals by consumption of foodstuffs available in the central market of Rajshahi City, Bangladesh. Environ. Monit. Assess. 185 (5), 3867–3878. doi:10.1007/s10661-012-2835-2
Sarker, A., Kim, J. E., Islam, ARMT, Bilal, M., Rakib, M. R. J., Nandi, R., et al. (2022). Heavy metals contamination and associated health risks in food webs—a review focuses on food safety and environmental sustainability in Bangladesh. Environ. Sci. Pollut. Res. 29 (3), 3230–3245. Available at. doi:10.1007/s11356-021-17153-7
Shaheen, N., Amin, R., Islam, S., Shimul, S. N., and Hamid, S. A. (2021). Nutrient density and affordability of habitual and desirable diets in Bangladesh by life cycle stage, region, and vulnerable groups.
Shaheen, N., Irfan, N. M., Khan, I. N., Islam, S., Islam, M. S., and Ahmed, M. K. (2016). Presence of heavy metals in fruits and vegetables: health risk implications in Bangladesh. Chemosphere 152, 431–438. doi:10.1016/j.chemosphere.2016.02.060
Shaji, E., Santosh, M., Sarath, K. V., Prakash, P., Deepchand, V., and Divya, B. V. (2021). Arsenic contamination of groundwater: a global synopsis with focus on the Indian Peninsula. Geosci. Front. 12 (3), 101079. doi:10.1016/j.gsf.2020.08.015
Sharma, A., and Nagpal, A. K. (2020). Contamination of vegetables with heavy metals across the globe: hampering food security goal. J. Food Sci. Technol. 57 (2), 391–403. doi:10.1007/s13197-019-04053-5
Simon, F. (2016). Heavy metals contamination in agricultural soil and rice in Tanzania: a review. Int. J. Environ. Prot. Policy 4 (1), 16. doi:10.11648/j.ijepp.20160401.13Available at: https://www.academia.edu/26354488/Heavy_Metals_Contamination_in_Agricultural_Soil_and_Rice_in_Tanzania_A_Review.
Uriu-Adams, J. Y., and Keen, C. L. (2005). Copper, oxidative stress, and human health. Mol. Asp. Med. 26 (4-5 SPEC. ISS.), 268–298. doi:10.1016/j.mam.2005.07.015
USEPA (2023). Regional screening levels (RSLs) - generic Tables|US EPA. Available at: https://www.epa.gov/risk/regional-screening-levels-rsls-generic-tables.
Wang, X., Sato, T., Xing, B., and Tao, S. (2005). Health risks of heavy metals to the general public in Tianjin, China via consumption of vegetables and fish. Sci. Total Environ. 350 (1–3), 28–37. doi:10.1016/j.scitotenv.2004.09.044
Wilson, B., and Pyatt, F. B. (2007). Heavy metal dispersion, persistance, and bioccumulation around an ancient copper mine situated in Anglesey, UK. Ecotoxicol. Environ. Saf. 66 (2), 224–231. doi:10.1016/j.ecoenv.2006.02.015
Zhang, H., Huang, B., Dong, L., Hu, W., Akhtar, M. S., and Qu, M. (2017). Accumulation, sources and health risks of trace metals in elevated geochemical background soils used for greenhouse vegetable production in southwestern China. Ecotoxicol. Environ. Saf. 137, 233–239. doi:10.1016/j.ecoenv.2016.12.010
Zhang, X., Wang, H., He, L., Lu, K., Sarmah, A., Li, J., et al. (2013). Using biochar for remediation of soils contaminated with heavy metals and organic pollutants. Environ. Sci. Pollut. Res. 20 (12), 8472–8483. doi:10.1007/s11356-013-1659-0Available at: https://link.springer.com/article/10.1007/s11356-013-1659-0
Keywords: heavy metal, public health risk, food safety, vegetable, Bangladesh, systematic review
Citation: Nowar A, Islam MH, Islam S, Jubayer A and Nayan MM (2024) A systematic review on heavy metals contamination in Bangladeshi vegetables and their associated health risks. Front. Environ. Sci. 12:1425286. doi: 10.3389/fenvs.2024.1425286
Received: 15 May 2024; Accepted: 15 July 2024;
Published: 08 August 2024.
Edited by:
Nsikak U. Benson, Topfaith University, NigeriaReviewed by:
Jingxin Huang, Yunnan Normal University, ChinaLucy Semerjian, University of Sharjah, United Arab Emirates
Copyright © 2024 Nowar, Islam, Islam, Jubayer and Nayan. This is an open-access article distributed under the terms of the Creative Commons Attribution License (CC BY). The use, distribution or reproduction in other forums is permitted, provided the original author(s) and the copyright owner(s) are credited and that the original publication in this journal is cited, in accordance with accepted academic practice. No use, distribution or reproduction is permitted which does not comply with these terms.
*Correspondence: Md. Hafizul Islam, aGFmaXppbmZzMTlAZ21haWwuY29t
†ORCID: Abira Nowar, orcid.org/0000-0002-8772-3679; Md. Hafizul Islam, orcid.org/0000-0002-7803-0985; Saiful Islam, orcid.org/0000-0002-0424-7719; Ahmed Jubayer, orcid.org/0000-0001-8369-8413; Md. Moniruzzaman Nayan, orcid.org/0000-0002-0505-1080