 T. S. Heuts1*
 Q. van Giersbergen1
 R. Nouta1,2
 T. P. A. Nijman1
 R. C. H. Aben1O. van der Scheer1
 P. G. M. Heuts3L. J. Skovsholt4
 G. R. Quadra1A. J. P. Smolders1,5
 C. Fritz1
- 1Department of Ecology, Radboud Institute for Biological and Environmental Sciences, Radboud University, Nijmegen, Netherlands
- 2Wetterskip Fryslân, Leeuwarden, Netherlands
- 3Researcher, Independent Ecologist, Houten, Netherlands
- 4Department of Biology, Aarhus University, Aarhus, Denmark
- 5B-WARE Research Centre, Nijmegen, Netherlands
Introduction: Drainage for agricultural purposes is one of the main drivers of peatland degradation, leading to significant greenhouse gas (GHG) emissions, biodiversity loss, and soil eutrophication. Rewetting is a potential solution to restore peatlands, but it generally requires a land-use shift to paludiculture or nature areas.
Methods: This study explored whether three different water level management techniques (subsoil irrigation, furrow irrigation, and dynamic ditch water level regulation) could be implemented on dairy grasslands to yield increases in essential ecosystem services (vegetation diversity and soil biogeochemistry) without the need to change the current land use or intensity. We investigated vegetation diversity, soil biogeochemistry, and CO2 emission reduction in fourteen agricultural livestock pastures on drained peat soils in Friesland (Netherlands).
Results: Across all pastures, Shannon-Wiener diversity was below 1, and the species richness was below 5. The plant-available phosphorus (P) was consistently higher than 3 mmol L−1. None of the water level management (WLM) techniques enhanced vegetation diversity or changed soil biogeochemistry despite a notable increase in water table levels. The potential for CO2 emission reduction remained small or even absent. Indicators of land-use intensity (i.e., grass harvest and fertilization intensity), however, showed a strong negative correlation with vegetation diversity. Furthermore, all sites’ total and plant-available P and nitrate exceeded the upper threshold for species-rich grassland communities.
Discussion: In conclusion, our research suggests that incomplete rewetting (i.e., higher water tables while maintaining drainage) while continuing the current land use does neither effectively mitigate GHG emissions nor benefit vegetation diversity. Therefore, we conclude that combining WLM and reducing land-use intensity is essential to limit the degradation of peat soils and restore more biodiverse vegetation.
Introduction
Peatlands are facing severe, ongoing degradation globally through the combined effects of agriculture and forestry, leading to a carbon (C) loss of seven gigatons since 1750 (Loisel et al., 2021). These highly degraded drained peatlands lose their wetland-specific vegetation diversity (Hammerich et al., 2022) and the ability to store C and nutrients (Richardson and Marshall, 1986). Degraded peatlands are responsible for around 5% of global anthropogenic carbon dioxide (CO2) emissions (Chaudhary et al., 2020; IPCC, 2022). Therefore, global peatland degradation contributes to multiple environmental problems, and restoration is essential and urgent.
Peatland restoration after drainage is generally achieved through rewetting, which requires re-establishing former groundwater levels to reduce peat oxidation. Rewetting is the process of restoring hydrological conditions in drained wetlands. In complete rewetting, the resulting ecosystem is a wetland (either nature or paludiculture–cultivation on inundated soils). On the other hand, partial rewetting refers to areas where ground water levels are increased and stabilized, but drainage remains present (Joosten et al., 2012). The rewetting process can bring trade-offs that must be considered (Günther et al., 2020; Hambäck et al., 2023). The oxygen depletion resulting from rewetting is known to reduce greenhouse gas (GHG) emissions of CO2 and nitrous oxide (N2O). Günther et al. (2015) shows reductions from 22 t CO2 ha-1 yr-1 and 12 kg N2O ha-1 yr-1 in drained peatlands to −0.4 t CO2 ha-1 yr-1 and 0 kg N2O ha-1 yr-1 in rewetted peatlands. However, the anoxic conditions created after rewetting can lead to initial spikes in methane (CH4) emissions (Evans et al., 2021): 74 kg CH4 ha-1 yr-1 in drained peatlands and 206 kg CH4 ha-1 yr-1 in rewetted peatlands (Günther et al., 2020). The trade-off between increasing CH4 and decreasing CO2 and N2O can be minimized through careful water level management (WLM). For instance, a water table 10 cm below surface level was even associated with a slight C sink (Drösler et al., 2013; Evans et al., 2021). The global warming potential drops, measured in CO2 equivalents (CO2-eq, Supplementary Table S1), from 30 t CO2-eq ha-1 yr-1 to 13 t CO2-eq ha-1 yr-1 after drained peatlands are rewetted, even accounting for increased CH4 emissions (Günther et al., 2015). Other studies showed stabilization of GHG emissions at a water table of 50 cm or deeper below surface level (Nijman et al., 2024; Tiemeyer et al., 2020), thus achieving substantial GHG emission reduction. Especially in deeply drained peatlands, partial rewetting to above 50 cm below surface level is likely required for any emission reduction.
Another trade-off caused by rewetting deep-drained, highly degraded agricultural peatlands involves nutrient availability and mobilization, particularly those drained for intensive agricultural use, which have usually been heavily fertilized for decades. Besides peaks of CH4 emissions, rewetting of these areas can release stored organic phosphorus (P) and nitrogen (N) (Zak et al., 2010; Zak and Gelbrecht, 2007), contributing to a continuous and severe decline in the ecological quality of surface water (Grizzetti et al., 2019). P mobilization can be as much as three orders of magnitude higher in highly degraded, completely rewetted peat than in natural peatlands (Zak et al., 2010). In partially rewetted peatlands, the bulk of accumulated inorganic P in the top layer is not expected to be mobilized, as the top layer is not deprived of oxygen (Emsens et al., 2015).
For decades, the species richness of vegetation in Dutch agricultural landscapes has been marginal, with field edges and ditch banks forming the most diverse areas (Kleijn et al., 2001; Van Dobben et al., 2019). Intensively managed (cattle) pastures on drained peatlands are characterized by a vegetation community with hyper-dominant, highly productive species, mainly Lolium perenne (Bakker and Ter Heerdt, 2005). As rewetting alters grassland habitat characteristics, it also affects which species can thrive there. Previous research showed that complete rewetting, as the only measure on a European scale, did not increase species richness and evenness of vegetation even after 30 years (Kreyling et al., 2021). However, shallower water table and high soil moisture content combined with organic instead of conventional farming positively affected the vegetation community, even after accounting for fertilization (Van Dobben et al., 2019).
Immediate and complete rewetting is incompatible with most livestock farming due to increased vulnerability to machinery damage and cattle trampling (Buschmann et al., 2020). Paludiculture, water buffalo farming, and nature restoration, therefore, provide alternative land uses (LUs) to dryland livestock but require a shift in the current farm operation (Drösler et al., 2013; Liu et al., 2023; Sweers et al., 2014). Three proposed WLM methods to partially rewet by increasing and stabilizing the water table are 1) sub-soil irrigation, which stabilizes the water table level through irrigation and drainage using tubes dug into the ground; 2) dynamic regulation of ditch water level, where the water level of ditches is raised and only lowered when farming requires; and 3) furrow irrigation, which uses furrows (small ditches or trenches) to irrigate 20 cm below surface level. Including these methods under the umbrella term ‘rewetting’ suggests climate benefits (Wilson et al., 2016) and the development of vegetation that thrives in wet environments (Närmann et al., 2021), but the validity and applicability of these effects to partial rewetting have yet to be tested. This research aims to evaluate the potential effects of sub-soil irrigation, dynamic regulation of ditch water levels and furrow irrigation on biodiversity and biogeochemistry, also considering effects on GHG emissions. This research aimed to clarify which expectations can be set for water level management in combination with intensive agricultural land use.
To understand the effects of the three different WLM methods on vegetation biodiversity, wetland-adapted species presence, and soil biogeochemistry, we evaluated 14 sites in the Netherlands over 2 years.
Methods
Study sites
All 14 sites were located on agricultural peatland pastures in the province of Friesland, the Netherlands (exact coordinates for each site can be found in Supplementary Table S2), where agricultural pastures are characterized by deep groundwater drainage, with a peat layer of 80–200 cm and a 0–40 cm clay cover. Friesland has a mean annual precipitation of 840 mm (KNMI, averaging period 1998 and 2018) and a mean annual temperature of 10°C. The sites differed in land use (LU), land-use intensity (LUI), and WLM strategies (Supplementary Table S2). Of the three WLM techniques, subsoil irrigation (SSI) was implemented on three sites, dynamic regulation of ditch water level (d-DWL) on one site, and furrow irrigation (FI) on three sites (Figure 1). However, all seven sites were grouped in the further analysis (as WLM sites) because of the low number of replicates and because the intended effect (shallower water table without LU displacement) was similar amongst sites (Supplementary Figure S1B). The remaining seven sites were identified as control sites. Nijman et al. (2024) investigated the same sites and provided site-specific information for each.
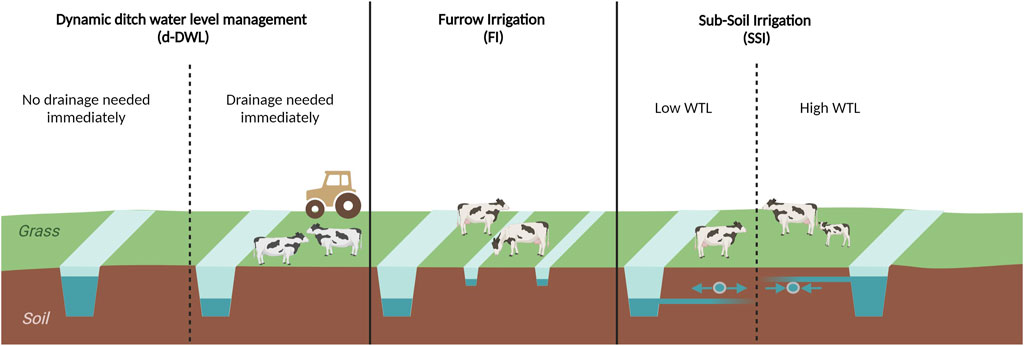
Figure 1. Schematic view of the implemented water level management (WLM) measures. On the left, dynamic ditch water level management (d-DWL) is shown, with the regular situation (high ditch water level) if the pasture is not used and temporary drainage if cattle or machinery are present. The middle figure shows furrow irrigation (FI), which adds small furrows throughout the pasture. The right Figure shows subsoil irrigation, which irrigates when the water table is lower than the drains and drains when the water level is higher.
The LU was primarily agricultural, with seven sites currently used for cattle farming and two for sheep grazing. Four sites were not subject to livestock grazing but managed for grass harvest. One site was a buffer zone next to a protected nature area and was only mowed for maintenance. The LUI was estimated based on grass harvest (above-ground biomass was harvested during the growing season in exclosures) and applied fertilization (based on fertilizer use by the farmer). Methods and data of emission measurements at each site were published in Nijman et al. (2024).
Data collection
Groundwater monitoring
The site’s water table levels and water levels from surrounding ditches were monitored continuously throughout 2021 and 2022 using dip wells and Ellitrack-D water pressure loggers (Leiderdorp Instruments). The water level was measured at the experiment’s start relative to the pastures’ surface level. We installed the dip wells to a depth of 120–200 cm. Here, the water table level values are expressed relative to the surface level, with water levels below the surface level as negative values.
Vegetation diversity
The species and their relative cover were monitored at each site in November 2022 and March and July 2023. All results in the main text concern the measurements in July 2023 (being the growing season); data from other campaigns are shown in Supplementary Figures S2–4. Three vegetation plots of 1 m2 were measured at every site: one plot next to the ditch closest to the GHG measurement plot (Nijman et al., 2024), one plot 5 m from the ditch, and one plot at 15 m from the ditch (close to or in the GHG measurement plot); resulting in 42 vegetation plots. The plots at 5 and 15 m from the nearest ditch were grouped as field plots, yielding 28 field plots. The plots next to the ditch were indicated as a separate habitat and treated as such during analysis because water availability and resulting vegetation were visibly different from the other vegetation plots. The vegetation data consisted of presence-absence data per species and a visually estimated abundance percentage. The cover per species was estimated between 1 and 100, but the sum of all cover estimations could exceed 100% through overlapping layers of vegetation. Species richness and the Shannon-Wiener diversity index were calculated for each site. The Shannon-Wiener diversity index is calculated as the sum of relative abundances for each species multiplied by the natural logarithm of the relative abundance.
We classified plant species as wetland-adapted using Schaminée and Boll (2010), which we defined as species that could persist under wet conditions, including cosmopolitan species. Species richness and Shannon-Wiener diversity index were then determined for the wetland-adapted species. All recorded species had an Ellenberg value for the environment’s N requirements, which was used to calculate the community-weighted mean per site.
Soil sampling
In July 2023, soil was sampled at each site for nutrient content quantification. The cores were divided into 0–10 cm, 10–20 cm, and 20–40 cm subsections, collected in triplicates but pooled by depth. Aboveground vegetation and big roots were removed prior to analysis, but small roots were left in the sample. Fresh soils were weighed for each sample, and subsamples were taken for drying (48 h at 70°C) and loss on ignition (4 h at 550°C). The moisture content, organic matter content, and bulk density were determined using fresh, dry, and incinerated weights. Using a NaCl extraction, nitrate (NO3− NaCl) and phosphorus (PNaCl) concentrations were determined by colorimetric methods following NEN protocols (NEN-EN-ISO 13395:1997; NEN-EN-ISO 11732:2005) adapted to the Seal Auto Analyzer System (SEAL Analytical Ltd., Norderstedt, Germany) and using inductively coupled plasma mass spectrometry (ICP-OES-ARCOS Spectro Analytical; Kleve, Germany). Plant-available P (POlsen) was determined using an Olsen extraction (Olsen et al., 1954). To perform this extraction, 60 mL of 0.5M sodium bicarbonate (NaHCO3) was added to 3 g of dried soil. The samples were subsequently shaken (105 rpm) for 30 min, after which the samples were collected under vacuum using Teflon pore water samplers. P concentrations were determined using inductively coupled plasma optical emission spectrometry (ICP-OES-ARCOS Spectro Analytical; Kleve, Germany).
These nutrient measures were compared to thresholds indicating upper limits for species-rich grasslands. Species-rich grasslands can develop if POlsen < 1.2 mmol L-1; If this threshold is not met, species-rich grasslands can still develop if NO3− NaCl < 0.2 mmol L-1 and PNaCl <0.002 mmol L-1 (Visscher and van Mullekom, 2022).
Data analysis
In the data analysis, we aimed to test our hypotheses using various bivariate statistical methods. The chosen methods depend on the type of explanatory data (categorical or continuous) and whether the assumptions are satisfied. All assumptions were tested visually. We used alternative methods, such as a generalized linear model with a quasipoisson distribution and log transformation where appropriate. The effects of WLM on per 30-min water table levels were tested using a nested ANOVA, with the location nested in the treatment (control or WLM), while also taking the year of sampling (2021 or 2022) and averaging period (summer mean or annual mean) as explanatory variables. The effect of WLM and sampling depth on soil nutrient status was analyzed using a two-way ANOVA. A simple linear regression was used to analyze the relationship between the water table and Shannon-Wiener diversity. We used a generalized linear model with a Quasi-Poisson distribution to test the effect of LUI on vegetation diversity (Shannon-Wiener diversity index and species richness) because our data often did not satisfy the dispersion assumption of a regular Poisson distribution. All data analyses were performed in R 4.2.2 (R Core Team, 2022; RStudio Team, 2016). Datasets were cleaned, structured, and summarized using ‘tidyverse’ (Wickham et al., 2019) and visualized using the ‘ggplot2’ (Wickham, 2016) and ‘ggpubr’ packages (Kassambara, 2023).
Results
The aim of this study was to determine whether partial rewetting through water level management (WLM) can be implemented while maintaining conventional agricultural land use (LU) and land use intensity (LUI). The 14 sites were evaluated regarding whether WLM measures had the intended direct effect (elevating water table), whether indirect effects on ecosystem services (i.e., vegetation diversity and nutrient availability) were present, and whether potential trade-offs or win-win scenarios occurred between these services. Results on GHG emissions were published in a separate paper (Nijman et al., 2024).
Did water level management influence the water table level?
A nested ANOVA showed that the water table significantly increased in WLM sites (R2 = 0.41, F51,11,805 = 161.4, p < 0.001) compared to the control. In 2021, the increase was 5.5 cm; in 2022, it was 14.6 cm (Table 1). The year 2022 was drier than 2021, with a difference in the mean annual water table of 32 cm in the controls and 22.9 cm in the WLM sites (Figure 2A). The water table had a non-linear relationship with CO2 emissions, with the strongest response to water table occurring above a water table of −50 cm (Nijman et al., 2024). We also did not find a significant relationship between net CO2 emissions and Shannon-Wiener diversity (Supplementary Figure S5).
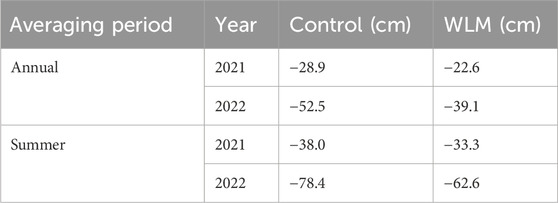
Table 1. Estimates of water table from a nested ANOVA model, where treatment is compared to the control, with year of measurement and averaging period.
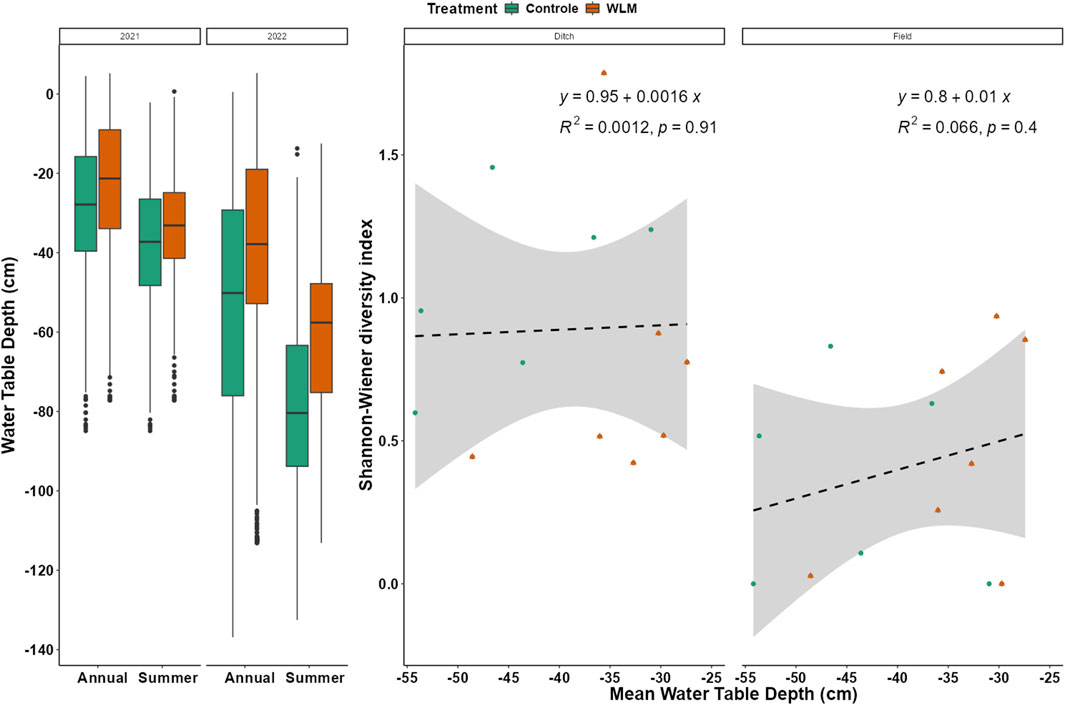
Figure 2. Groundwater dynamics in grasslands on drained peat pastures managed for livestock agriculture. (A) Boxplot showing the distribution of measurements for the summer and annual water table levels in 2021 and 2022. Each cross within the green area indicates the mean water table per control site, and each estimate indicated by a line within the orange area indicates the mean of a treatment site. Vertical lines indicate the standard deviation for each site. The underlying horizontal line indicates the average for the group. 2021 was much wetter than 2022; the effect of water level management on the water table was only significant in 2022. (B) The mean annual water table (measured on the pasture) did not significantly affect the Shannon-Weiner diversity of either ditch banks vegetation or vegetation on the pasture.
Did water level management influence vegetation diversity?
WLM did not significantly affect vegetation species diversity. A model with Shannon diversity as the explanatory variable, water table, and plot location shows a significant result (F2, 23 = 4.9, R2 = 0.24, p = 0.02), mainly due to the plot location (estimate = −0.48, t = −3.065, p = 0.005). However, the water table did not significantly affect Shannon diversity (Figure 2B).
In contrast, species diversity showed a significant negative relationship with productivity and LU intensity; a ton C ha-1 yr-1 increase in grass yield correlates with a 52.9% decrease in Shannon-Weiner diversity index (Figure 3A, GLM, explained deviance = 45%, DF = 13 and 12, p = 0.004). Moreover, a 10 kg N ha-1 yr-1 increase in fertilization correlates to a 15.6% decrease in the Shannon-Weiner diversity index (Figure 3B, GLM, explained deviance = 40%, DF = 13 and 12, p = 0.013).
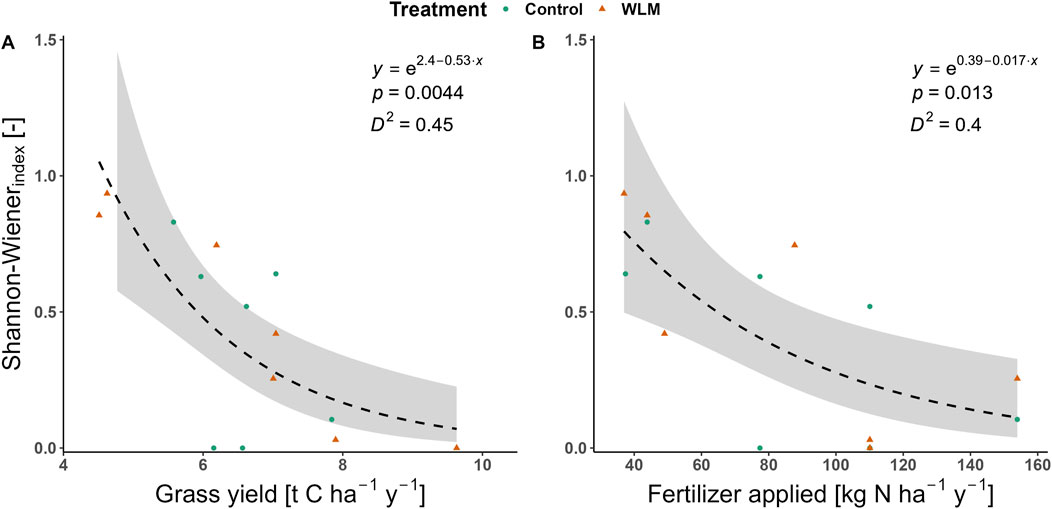
Figure 3. Land-use effects of productivity (Grass yield) and fertilization on Shannon-Weiner diversity index. (A, B) Shannon-Weiner diversity index decreased significantly as land-use intensity increased, with both grass yield and fertilization.
All sites together had a low number of species. We found 13 species across 14 sites, with L. perenne being the only species present in all 28 field plots (Figure 4A). Moreover, L. perenne was dominant, with a mean abundance of 73.6%. Only five other species (Holcus mollis, Trifolium repens, Holcus lanatus, Ranunculus acris, and Taraxacum sect. ruderalia) revealed an average abundance above 1% and are also shown (Figure 4B).
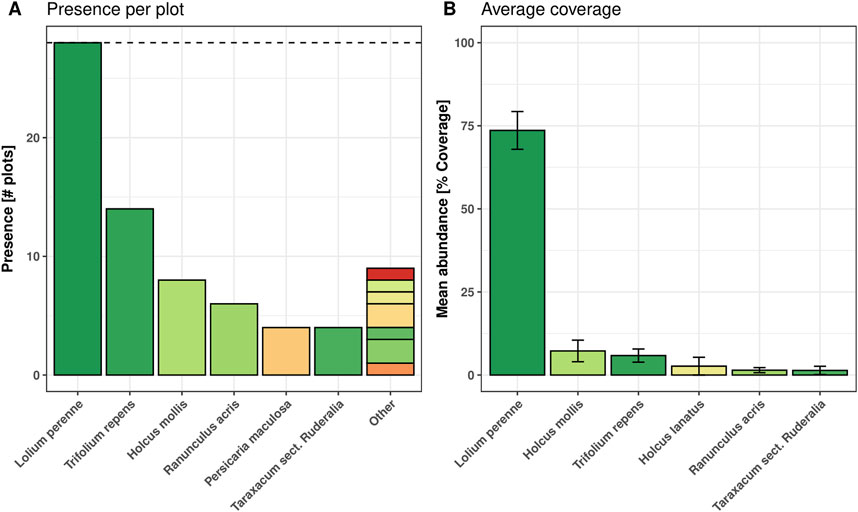
Figure 4. The overall number of occurrences for the most common species regionally and locally. (A) is a regional indication of occurrence, showing the number of plots where each species was found, with a maximum of 28 (indicated by the dashed black line). (B) shows the mean abundance of each species across all locations, with the error bars indicating the SEM. This Figure shows data for the measurement campaign in July. Data for all three measurement campaigns is depicted in Supplementary Figure S2.
Wetland-adapted species (i.e., species that can persist under partially and completely rewetted conditions, including cosmopolitan species) also had a negative relationship with productivity, with a 24.5% decrease on average in species richness per t C ha-1 yr-1 increase in grass yield (Figure 5A, GLM, explained deviance = 10%, CI = −35.9%, −13.2%, p < 0.001). The cosmopolitan wetland-adapted species T. repens was present in 17 sites. Rumex acetosa was present in two plots, while Ranunculus repens and H. lanatus were present in one plot. Although these species can survive in wet conditions, they do not indicate wetland conditions. More wetland-adapted species were found in the ditch plots, especially during the July monitoring campaign (Supplementary Figure S3). We counted nineteen wetland-adapted species, with Phragmites australis, Juncus effuses, Urtica dioica, and T. repens being the most common. Other notable species are Mentha aquatica, Sparganium erectum, and Lycopus europaeus. Although not rare, these species are more indicative of and reliant on wet conditions. Fertilization showed a similar relationship to species richness of wetland-adapted species with a significant decrease of 8.3% per 10 kg N ha-1 yr-1 (GLM, explained deviance = 9%, 95% CI = −4.3%, −12.2%, p <0.001).
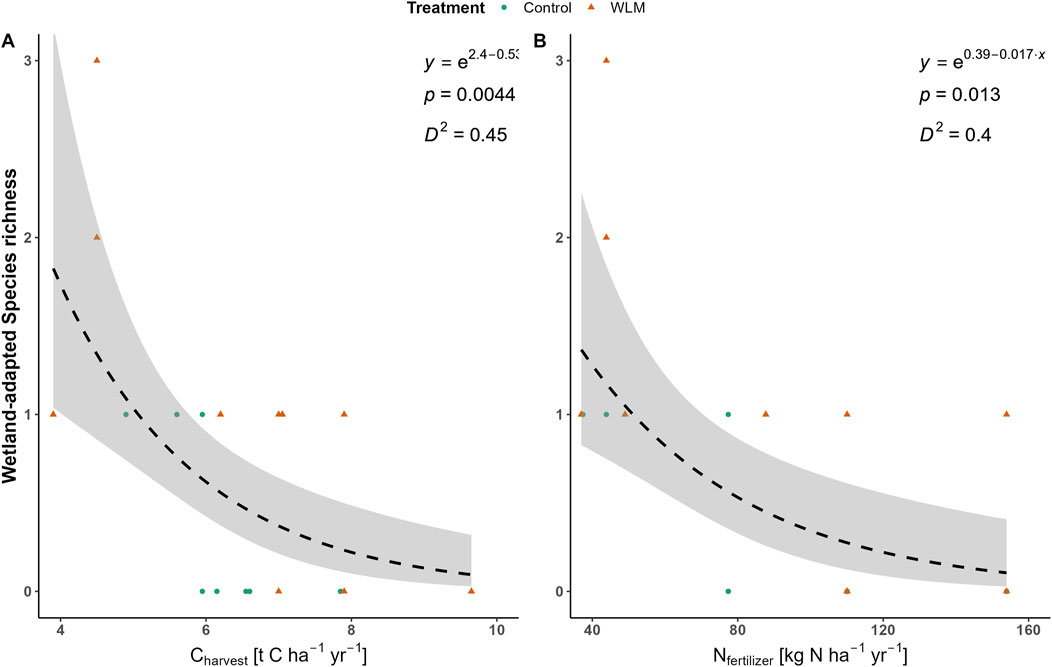
Figure 5. Responses of species richness of wetland species to land use intensity. (A) shows the response of wetland-adapted species richness on the pastures to harvest as expressed in exported carbon (t C ha-1 yr-1). (B) shows the response of wetland-adapted species richness on the pastures to applied fertilizer (kg N ha-1 yr-1).
Did water level management influence nutrient soil content?
Nutrient availability was also not significantly affected by WLM but exceeded the threshold for a species-rich grassland vegetation community of 1.2 mmol POlsen L-1, 0.2 mmol NO3− NaCl L-1, and 0.002 mmol PNaCl L-1 (Figure 6) (Visscher and van Mullekom, 2022). NO3, POlsen, and total P were significantly higher than the threshold in soils 10–20 cm deep, and PNaCl also exceeded the threshold at 40 cm depth (Supplementary Table S3).
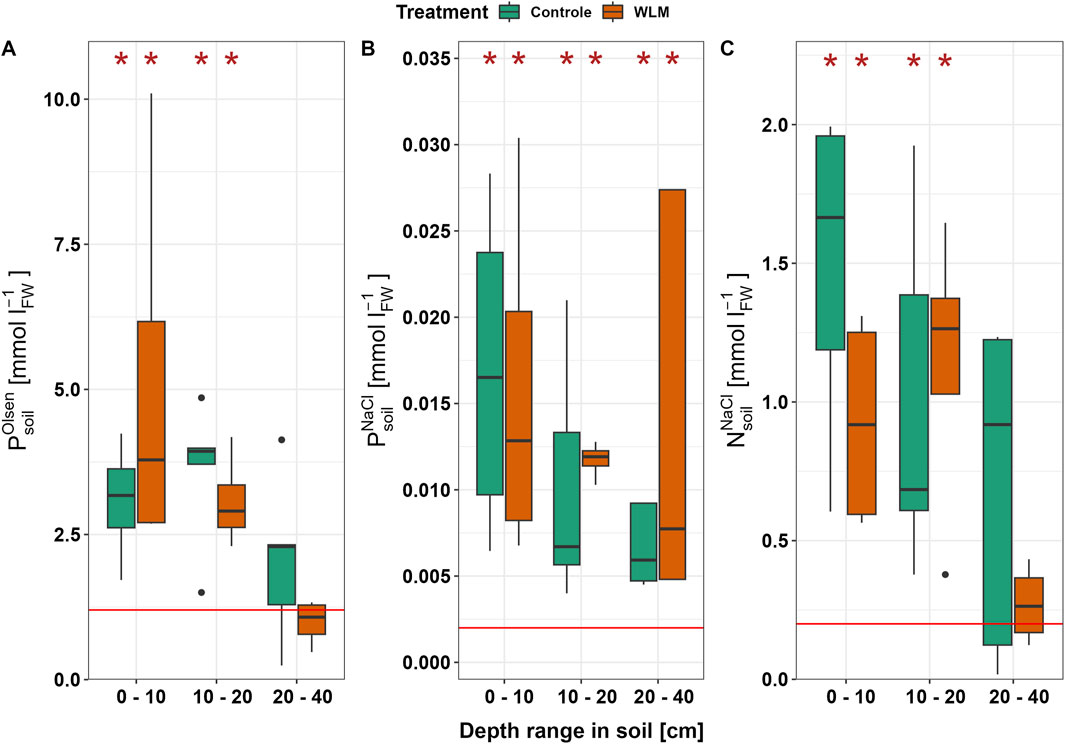
Figure 6. Nutrient availability for vegetation in treatment and control sites, with thresholds for species-rich vegetation (red line). The asterisks indicate a significant difference compared to the threshold. (A) shows the POlsen concentration. Species-rich vegetation communities can develop if POlsen < 1.2 mmol L-1. If the threshold for POlsen is not met, species-rich communities can still develop if PNaCl and NO3 NaCl remain below their respective thresholds. (B) shows PNaCl. The red line shows a threshold of 0.002 mmol L-1. (C) shows NO3 NaCl. The red line shows a threshold of 0.2 mmol L-1.
Discussion
This study aimed to show the effects of water level management (WLM) on plant species richness, the occurrence of wetland-adapted species, and soil’s nutrient status (plant available nutrients) when land use (LU) remains intensive agriculture. As hypothesized, WLM increased both mean annual and summer water table depth. In contrast, we did not find a significant relationship between either the water level management measures and CO2 emission (Nijman et al., 2024) or biodiversity. So, although the water table was higher in sites where irrigation management was implemented, substantial improvement of ecosystem services likely requires a water table change more prominent than 5.5 cm in the mean annual water table or 8.8 cm in the mean summer water table.
Water table level and vegetation diversity
WLM did cause a significant increase in the water table. Our results show, however, that the mean effect size of WLM is relatively small (5.6 cm in 2021, 8.8 cm in 2022). The increase in water table depth remained limited to levels around 40 cm below the surface level (Supplementary Figure S6). Subsoil rewetting remains ineffective for ecosystem processes, which primarily center around the top 20 cm of grassland soils (Crush et al., 2005; Emsens et al., 2020). Furthermore, the mean annual and mean summer water table in 2022 remained below 40 cm, resulting in no significant emission reduction (Nijman et al., 2024), which is in line with earlier studies (Lafleur et al., 2005; Tiemeyer et al., 2020), especially with the bulk of emissions expected during the summer (Weideveld et al., 2021).
We did not find a significant relationship between the Shannon-Wiener diversity index and water table either. The lack of a significant relationship is likely due to the limited effect size of the treatment; the water table was increased by 5–9 cm annually. In an environment with intensive agriculture and associated fertilization, such minor changes in water levels are expected to be part of the background noise. Furthermore, increased groundwater levels may result in less water stress in summer time, which may lead to increased growth in highly productive grassland species. However, previous research found an increased Shannon-Wiener diversity index due to rewetting when the water table was changed from 40 to 45 to 20–30 cm below surface level (Van Dijk et al., 2007). All agricultural practices in that study were abandoned 4 years prior, alluding to a land-use effect. Renou-Wilson et al. (2016) did find a relationship between the water table and species richness in grazed grasslands, but the water table range was between 0 and 30 cm. Furthermore, they found that rewetting did not significantly affect the species richness when grazing was seized because species richness was high in all sites (13 on average per site, compared to less than three in our study).
Neither the annual nor summer water table showed a relationship with wetland-adapted diversity, indicating that the effect size of rewetting measures was within the site-to-site variation. Furthermore, the number of wetland-adapted species was often 0, even in areas where WLM was implemented, and the land use intensity was reduced. The lack of relationship (and the lack of wetland-adapted species) is in line with previous studies. Dwyer et al. (2021) showed that the mean Ellenberg value for soil moisture has a significant linear relationship with groundwater level, but this relationship disappears with high soil P availability. A relationship between wetland species and water table level is therefore not expected in a highly fertilized agricultural environment like our measurement sites.
Soil biogeochemistry
WLM did not significantly affect the soil’s plant-available phosphorus (POlsen), likely because the summer water table level was often lower than 40 cm below surface level (when sampling took place). The soil samples were collected from the top 40 cm, the layer where the roots of the hyper-dominant L. perenne are mostly found (Wedderburn et al., 2010). The concentrations of plant-available P enormously exceeded the threshold of 1.2 mmol L-1 (Visscher and van Mullekom, 2022) for species-rich grassland communities in the top 20 cm of the soil on all sites (Supplementary Table S2; Figure 6). In P-rich soils, limitations by other factors (e.g., drought and nitrogen shortage) could still increase plant species diversity. Visscher and van Mullekom (2022) suggested that more species-rich grasslands could still develop under these conditions if both PNaCl and NO3 NaCl remain below their respective thresholds (0.002 mmol P L-1 soil and 0.2 mmol NO3 L-1) (Visscher and van Mullekom, 2022). However, these thresholds were also exceeded in the top 20 or even 40 cm of soil, independent of WLM implementation. In other words, we did not find indications of P-mobilization, which is only expected after complete rewetting (Kieckbusch and Schrautzer, 2006; Zak et al., 2010), but the total amount of plant-available P is too high for species-rich vegetation communities to develop. The NO3 concentrations even exceed the limits where nutrient depletion through biomass removal is feasible (400 μmol NO3 L-1 in the top 25 cm layer), which would take more than 80 years to achieve (Visscher and van Mullekom, 2022). Restoration of the biogeochemical characteristics for species-rich grasslands thus requires more drastic measures, such as topsoil removal (Käärmelahti et al., 2023).
Land-use intensity, legacy, and biodiversity
The effects of land use (LU) and land-use intensity (LUI) on vegetation diversity and species richness are much more pronounced in our results than the effect of WLM. LUI is one of the main drivers of biodiversity decline globally (Sala et al., 2000), and the negative relationship of productivity and grazing with diversity in grasslands has been well-documented (Buzhdygan et al., 2020; Gossner et al., 2016; Plantureux et al., 2005; Risser, 1988). Fertilization intensity and grass yield negatively affect vegetation diversity, with a decrease of 16% per 10 kg N ha-1 yr-1 fertilization and a decrease of 53% per t C ha-1 yr-1 grass yield. The low number of species we found during the summer monitoring campaign (13 across 28 plots; <3 on average per plot) on the pastures (excluding ditch banks) further shows the effects of highly intensive land use. Other studies in drained peatlands have found 9.4 species per 0.36 m2 in Ireland (Renou-Wilson et al., 2016), 12 species per 9 m2 at conventional farms in the northeast of the Netherlands (Van Dobben et al., 2019), and 6.7 species per m2 and an average Shannon-Wiener diversity index of 0.78 in (former) agricultural farms in the west of the Netherlands (Van Dijk et al., 2007). The species richness of wetland-adapted vegetation decreased with both grass harvest and fertilization to the point where higher productivity sites did not house any species indicative of wet conditions. The initial state of the pastures (with a history of intensive agriculture for decades) is likely degraded to an extent where minor improvements, such as stabilization of the water level, do not lead to noticeable environmental changes when taking a snapshot approach.
Our results on biodiversity are limited to vegetation data, but previous studies have shown that the same processes also impact the biodiversity of other taxa. Due to drainage, peatland bird populations have declined massively (Fraixedas et al., 2017) due to the reduced penetrability of the soil for probing birds and the availability of nesting spots for ground-breeding birds (Ausden et al., 2001). WLM can benefit meadow and wetland birds when drained peatlands are converted to nature or paludiculture (Tanneberger et al., 2022). However, this effect was not observed with WLM in agriculture (Kleijn et al., 2004). Land use intensification similarly decimated arthropod populations (Habel et al., 2019). Increased water levels can benefit spiders, carabids, aphids, flies, and other taxa when the system is converted to paludiculture (Martens et al., 2023; Tanneberger et al., 2022). In agricultural systems, vegetation diversity and management schemes are the strongest predictors of arthropod diversity (Habel et al., 2019; Kleijn et al., 2004).
In 2023, new regulations were implemented to reduce agricultural pastures’ nutrient availability and vegetation biodiversity, ensuring more sustainable farming practices in the future (Elliott et al., 2024). The abolishment of derogation (RVO, 2023a) and the implementation of buffer zones at the edges of pastures (RVO, 2023b) could help improve biodiversity through the reduction of fertilization, especially because the pasture edges already harbor more plant species (Kleijn et al., 2004).
Conclusion
In conclusion, we did not find the effects of water level management on eutrophication, vegetation diversity, nor wetland-adapted species. The impact of the measures was insignificant during a wet year, while during a dry year, the effect size was not large enough to significantly affect emissions, nutrient availability, or plant biodiversity. In the context of intensively used grasslands on peat, more than the relatively minor improvements in water level management are needed to make a difference. The effect size of water level management was also largely influenced by the land-use. Water levels were increased more in areas with more extensively used meadows assigned as meadow bird habitat, compared to meadows where intensive agricultural practices persist. Water levels and land-use are thus not entirely independent. In future research, incorporating these findings into broader ranges of the investigated ecosystem services, as well as geographical range could result in a more comprehensive view, showing the required effect size for ecological recovery of drained peatlands with a history of intensive drainage. More research sites can unveil subtle differences between SSI, FI and d-DWL as well, where we expect SSI to stabilize water levels most, FI requires the highest ditch water levels and provides new habitat, and d-DWL provides the highest flexibility for land-users. Other factors, such as intensive fertilization and mowing, are likely to obscure any differences between WLM measures however.
In summary, wetter does not necessarily mean wet, and water level management options like subsoil irrigation, furrow irrigation, and dynamic ditch water management should not be considered alternatives to complete rewetting. More substantial interventions, including both water level management and land-use intensity reduction, are required to achieve positive biodiversity effects and reduce GHG soil emissions in concert.
Data availability statement
All data used in this paper are made publicly available online in the DANS-EASY data repository. Datasets can be found using doi:10.17026/LS/JKRVN5.
Author contributions
TH: Conceptualization, Data curation, Formal Analysis, Investigation, Methodology, Visualization, Writing–original draft, Writing–review and editing. QG: Formal Analysis, Visualization, Writing–review and editing. RN: Conceptualization, Investigation, Methodology, Validation, Writing–review and editing. TN: Formal Analysis, Investigation, Writing–review and editing. RA: Methodology, Writing–review and editing. OS: Investigation, Writing–review and editing. PH: Conceptualization, Investigation, Methodology, Writing–review and editing. LS: Writing–review and editing, Conceptualization, Validation. GQ: Visualization, Writing–review and editing. AS: Conceptualization, Methodology, Supervision, Validation, Visualization, Writing–review and editing. CF: Conceptualization, Funding acquisition, Methodology, Project administration, Resources, Supervision, Visualization, Writing–review and editing.
Funding
The author(s) declare that financial support was received for the research, authorship, and/or publication of this article. This research was supported by Horizon Europe Grant Wet Horizons (GAP-101056848).
Acknowledgments
We thank the farmers for their hospitality during the study, allowing us to conduct measurements on their land for several years, and Niek Bosma of Wetterskip Fryslân for managing the project. We thank Stowa/LNW for their support in collecting of the water table depth and CO2 emission data. We would also like to thank Martijn Bakker, Sannimari Käärmelahti, and Marijn Krijnsen for assistance during fieldwork campaigns and Roy Peters, Germa Verheggen, Sebastian Krosse, and Paul van der Ven for their aid in analyzing soil samples. We would also like to thank our colleagues in Wet Horizons work package 4, who provided valuable input through discussion and review.
Conflict of interest
The authors declare that the research was conducted in the absence of any commercial or financial relationships that could be construed as a potential conflict of interest.
Publisher’s note
All claims expressed in this article are solely those of the authors and do not necessarily represent those of their affiliated organizations, or those of the publisher, the editors and the reviewers. Any product that may be evaluated in this article, or claim that may be made by its manufacturer, is not guaranteed or endorsed by the publisher.
References
Ausden, M., Sutherland, W. J., and James, R. (2001). The effects of flooding lowland wet grassland on soil macroinvertebrate prey of breeding wading birds. J. Appl. Ecol. 38 (2), 320–338. doi:10.1046/j.1365-2664.2001.00600.x
Bakker, J. P., and Ter Heerdt, G. N. J. (2005). Organic grassland farming in The Netherlands: a case study of effects on vegetation dynamics. Basic Appl. Ecol. 6, 205–214. doi:10.1016/j.baae.2005.01.003
Buschmann, C., Röder, N., Berglund, K., Berglund, Ö., Lærke, P. E., Maddison, M., et al. (2020). Perspectives on agriculturally used drained peat soils: comparison of the socioeconomic and ecological business environments of six European regions. Land Use Policy 90, 104181. doi:10.1016/j.landusepol.2019.104181
Buzhdygan, O. Y., Tietjen, B., Rudenko, S. S., Nikorych, V. A., and Petermann, J. S. (2020). Direct and indirect effects of land-use intensity on plant communities across elevation in semi-natural grasslands. PLoS ONE 15 (11), e0231122. doi:10.1371/journal.pone.0231122
Chaudhary, N., Westermann, S., Lamba, S., Shurpali, N., Sannel, A. B. K., Schurgers, G., et al. (2020). Modelling past and future peatland carbon dynamics across the pan-Arctic. Glob. Change Biol. 26 (7), 4119–4133. doi:10.1111/gcb.15099
Crush, J. R., Waller, J. E., and Care, D. A. (2005). Root distribution and nitrate interception in eleven temperate forage grasses. Grass Forage Sci. 60 (4), 385–392. doi:10.1111/J.1365-2494.2005.00488.X
Drösler, M., Adelman, W., Augustin, J., Bergman, L., Beyer, C., Chojnicki, B., et al. (2013). Klimaschutz durch Moorschutz - Schlussbericht des Vorhabens “Klimaschutz - Moornutzungsstrategien” 2006-2010. Available at: www.lbeg.niedersachsen.de.
Dwyer, C., Millett, J., Pakeman, R. J., and Jones, L. (2021). Environmental modifiers of the relationship between water table depth and Ellenberg’s indicator of soil moisture. Ecological Indicators 132, 1–9. doi:10.1016/j.ecolind.2021.108320
Elliott, J., Tindale, S., Outhwaite, S., Nicholson, F., Newell-Price, P., Sari, N. H., et al. (2024). European permanent grasslands: a systematic review of economic drivers of change, including a detailed analysis of the Czech republic, Spain, Sweden, and UK. Land 13 (1), 116. doi:10.3390/land13010116
Emsens, W. J., Aggenbach, C. J. S., Smolders, A. J. P., and van Diggelen, R. (2015). Topsoil removal in degraded rich fens: can we force an ecosystem reset? Ecol. Eng. 77, 225–232. doi:10.1016/J.ECOLENG.2015.01.029
Emsens, W. J., Van Diggelen, R., Aggenbach, C. J. S., Cajthaml, T., Frouz, J., Klimkowska, A., et al. (2020). Recovery of fen peatland microbiomes and predicted functional profiles after rewetting. ISME J. 14, 1701–1712. doi:10.1038/s41396-020-0639-x
Evans, C. D., Peacock, M., Baird, A. J., Artz, R. R. E., Burden, A., Callaghan, N., et al. (2021). Overriding water table control on managed peatland greenhouse gas emissions. Nature 593 (May), 548–552. doi:10.1038/s41586-021-03523-1
Fraixedas, S., Lindén, A., Meller, K., Lindström, Å., Keišs, O., Kålås, J. A., et al. (2017). Substantial decline of Northern European peatland bird populations: consequences of drainage. Biol. Conserv. 214, 223–232. doi:10.1016/j.biocon.2017.08.025
Gossner, M. M., Lewinsohn, T. M., Kahl, T., Grassein, F., Boch, S., Prati, D., et al. (2016). Land-use intensification causes multitrophic homogenization of grassland communities. 540, 266, 269. doi:10.1038/nature20575
Grizzetti, B., Liquete, C., Pistocchi, A., Vigiak, O., Zulian, G., Bouraoui, F., et al. (2019). Relationship between ecological condition and ecosystem services in European rivers, lakes and coastal waters. Sci. Total Environ. 671, 452–465. doi:10.1016/j.scitotenv.2019.03.155
Günther, A., Barthelmes, A., Huth, V., Joosten, H., Jurasinski, G., Koebsch, F., et al. (2020). Prompt rewetting of drained peatlands reduces climate warming despite methane emissions. Nat. Commun. 11 (1), 1644–1645. doi:10.1038/s41467-020-15499-z
Günther, A., Huth, V., Jurasinski, G., and Glatzel, S. (2015). The effect of biomass harvesting on greenhouse gas emissions from a rewetted temperate fen. GCB Bioenergy 7 (5), 1092–1106. doi:10.1111/gcbb.12214
Habel, J. C., Samways, M. J., and Schmitt, T. (2019). Mitigating the precipitous decline of terrestrial European insects: requirements for a new strategy. Biodivers. Conservation 28, 1343–1360. doi:10.1007/s10531-019-01741-8
Hambäck, P. A., Dawson, L., Geranmayeh, P., Jarsjö, J., Kačergytė, I., and Peacock, M. (2022). Tradeoffs and synergies in wetland multifunctionality: a scaling issue. Science of the Total Environment 862, 1–14.
Hammerich, J., Dammann, C., Schulz, C., Tanneberger, F., Zeitz, J., and Luthardt, V. (2022). Assessing mire-specific biodiversity with an indicator based approach. Mires Peat 28, 1–29. doi:10.19189/MaP.2021.SJ.StA.2205
IPCC. (2022). Climate change 2022: impacts, adaptation, and vulnerability. Contribution of working group II to the sixth assessment report of the intergovernmental panel on climate change.
Joosten, H., Tapio-Biström, M. -L., and Tol, S. (2012). Peatlands—guidance for climate change mitigation through conservation, rehabilitation and sustainable use. Mitigation of Climate Change in Agriculture series 5, 1–114.
Käärmelahti, S. A., Fritz, C., Quadra, G. R., Gardoki, M. E., Gaudig, G., Krebs, M., et al. (2023). Topsoil removal for Sphagnum establishment on rewetted agricultural bogs. Biogeochemistry 167, 479–496. doi:10.1007/s10533-023-01096-x
Kassambara, A. (2023). _ggpubr: “ggplot2” based publication ready plots_. R. package version 0.6.0. Available at: https://rpkgs.datanovia.com/ggpubr/.
Kieckbusch, J. J., and Schrautzer, J. (2006). Nitrogen and phosphorus dynamics of a re-wetted shallow-flooded peatland. Sci. Total Environ. 380, 3–12. doi:10.1016/j.scitotenv.2006.10.002
Kleijn, D., Berendse, F., Smit, R., and Gilissen, N. (2001). Agri-environment schemes do not effectively protect biodiversity in Dutch agricultural landscapes. Nature 413, 723–725. doi:10.1038/35099540
Kleijn, D., Berendse, F., Smit, R., Gilissen, N., Smit, J., Brak, B., et al. (2004). Ecological effectiveness of agri-environment schemes in different agricultural landscapes in The Netherlands. Conserv. Biol. 18 (Issue 3), 775–786. doi:10.1111/j.1523-1739.2004.00550.x
Kreyling, J., Tanneberger, F., Jansen, F., van der Linden, S., Aggenbach, C., Blüml, V., et al. (2021). Rewetting does not return drained fen peatlands to their old selves. Nat. Commun. 12 (5693), 5693–5698. doi:10.1038/s41467-021-25619-y
Lafleur, P. M., Moore, T. R., Roulet, N. T., and Frolking, S. (2005). Ecosystem respiration in a cool temperate bog depends on peat temperature but not water table. Ecosystems 8, 619–629. doi:10.1007/s10021-003-0131-2
Liu, W., Fritz, C., Van Belle, J., and Nonhebel, S. (2023). Production in peatlands: comparing ecosystem services of different land use options following conventional farming. Sci. Total Environ. 875, 162534. doi:10.1016/j.scitotenv.2023.162534
Loisel, J., Gallego-Sala, A. V., Amesbury, M. J., Magnan, G., Anshari, G., Beilman, D. W., et al. (2021). Expert assessment of future vulnerability of the global peatland carbon sink. Nat. Clim. Change 11, 70–77. doi:10.1038/s41558-020-00944-0
Martens, H. R., Laage, K., Eickmanns, M., Drexler, A., Heinsohn, V., Wegner, N., et al. (2023). Paludiculture can support biodiversity conservation in rewetted fen peatlands. Sci. Rep. 13 (18091), 18091–18110. doi:10.1038/s41598-023-44481-0
Närmann, F., Birr, F., Kaiser, M., Nerger, M., Luthardt, V., Zeitz, J., et al. (2021). Klimaschonende, biodiversitätsfördernde Bewirtschaftung von Niedermoorböden. BfN-Skripten 616, 155–183. doi:10.19217/skr616
Nijman, T.P.A., van Giersbergen, Q., Heuts,, T.S., et al. (2024). Drainage effects on carbon budgets of degraded peatlands in the north of the Netherlands. Science of the Total Environment 935, 172882. doi:10.1016/j.scitotenv.2024.172882
Olsen, S. R., Cole, C. V., Watanabe, F. S., and Dean, L. A. (1954). Estimation of available phosphorus in soils by extraction with sodium bicarbonate. 939. Available at: https://books.google.nl/books?hl=nl&lr=&id=d-oaM88x5agC&oi=fnd&pg=PA2&dq=Olsen+SR,+Cole+C+V,+Watanabe+FS,+Dean+LA+(1954)+Estimation+of+available+phosphorus+in+soils+by+extraction+with+sodium+bicarbonate.+USDA+Circ+939&ots=z_VhTEgPYD&sig=znrBzY-GBlMkHEtUg7kUBAiSNzo&redir_esc=y#v=onepage&q&f=false.
Plantureux, S., Peeters, A., and Mccracken, D. (2005). Biodiversity in intensive grasslands: effect of management, improvement, and challenges. Agron. Res. 3 (Issue 2).
R Core Team (2022). R: a language and environment for statistical computing. Vienna, Austria: R Foundation for Statistical Computing.
Renou-Wilson, F., Müller, C., Moser, G., and Wilson, D. (2016). To graze or not to graze? Four years greenhouse gas balances and vegetation composition from a drained and a rewetted organic soil under grassland. Agric. Ecosyst. Environ. 222, 156–170. doi:10.1016/j.agee.2016.02.011
Richardson, C. J., and Marshall, P. E. (1986). Processes controlling movement, storage, and export of phosphorus in a fen peatland. Source Ecol. Monogr. 56 (4), 279–302. doi:10.2307/1942548
Risser, P. G. (1988). in Fourteenth. Biodiversity. Editors E. O. Wilson, and F. M. Peter (Albuquerque, NM: National Academy Press), 521.
RStudio Team (2016). RStudio: integrated development for R. Boston, MA: RStudio, Inc. Available at: http://www.rstudio.com/.
RVO (2023a). Derogatie. Available at: https://www.rvo.nl/onderwerpen/mest/derogatie.
RVO (2023b). Alles over bufferstroken. Available at: https://www.rvo.nl/onderwerpen/bufferstroken.
Sala, O. E., Chapin III, F. S., Armesto, J. J., Berlow, E., Bloomfield, J., Dirzo, R., et al. (2000). Global biodiversity scenarios for the year 2100. Science 287, 1770–1774. doi:10.1126/science.287.5459.1770Available at: https://www.science.org.
Sweers, W., Möhring, T., and Müller, J. (2014). The economics of water buffalo (Bubalus bubalis) breeding, rearing and direct marketing. Arch. Anim. Breed. 57 (1), 1–11. doi:10.7482/0003-9438-57-022
Tanneberger, F., Birr, F., Couwenberg, J., Kaiser, M., Luthardt, V., Nerger, M., et al. (2022). Saving soil carbon, greenhouse gas emissions, biodiversity and the economy: paludiculture as sustainable land use option in German fen peatlands. Reg. Environ. Change 22 (69), 69–15. doi:10.1007/s10113-022-01900-8
Tiemeyer, B., Freibauer, A., Borraz, E. A., Augustin, J., Bechtold, M., Beetz, S., et al. (2020). A new methodology for organic soils in national greenhouse gas inventories: data synthesis, derivation and application. Ecol. Indic. 109 (October 2019), 105838. doi:10.1016/j.ecolind.2019.105838
Van Dijk, J., Stroetenga, M., Van Bodegom, P. M., and Aerts, R. (2007). The contribution of rewetting to vegetation restoration of degraded peat meadows. Appl. Veg. Sci. 10 (3), 315–324. doi:10.1111/J.1654-109X.2007.TB00430.X
Van Dobben, H. F., Quik, C., Wieger Wamelink, G. W., Lantinga, E. A., Wamelink, G. W. W., and Lantinga, E. A. (2019). Vegetation composition of Lolium perenne-dominated grasslands under organic and conventional farming. Basic Appl. Ecol. 36, 45–53. doi:10.1016/j.baae.2019.03.002
Visscher, A., and van Mullekom, M. (2022). Bodem-en hydrochemisch onderzoek natuurpotenties Alde Feanen. Available at: www.b-ware.eu.
Wedderburn, M. E., Crush, J. R., Pengelly, W. J., and Walcroft, J. L. (2010). Root growth patterns of perennial ryegrasses under well-watered and drought conditions, New Zealand. Journal of Agricultural Research 53 (4), 377–388. doi:10.1080/00288233.2010.514927
Weideveld, S. T. J., Liu, W., Van den Berg, M., Lamers, L. P. M., and Fritz, C. (2021). Conventional subsoil irrigation techniques do not lower carbon emissions from drained peat meadows. Biogeosciences 18, 3881–3902. doi:10.5194/bg-18-3881-2021
Wickham, H., Averick, M., Bryan, J., Chang, W., McGowan, L., François, R., et al. (2019). Welcome to the tidyverse. J. Open Source Softw. 4 (43), 1686. doi:10.21105/joss.01686
Wilson, D., Blain, D., Couwenber, J., Evans, C., Murdiyarso, D., Page, S., et al. (2016). Greenhouse gas emission factors associated with rewetting of organic soils. Mires Peat 17 (4), 1–28. doi:10.19189/MaP.2016.OMB.222
Zak, D., and Gelbrecht, J. (2007). The mobilisation of phosphorus, organic carbon and ammonium in the initial stage of fen rewetting (a case study from NE Germany). Biogeochemistry 85, 141–151. doi:10.1007/s10533-007-9122-2
Keywords: peatland water management, nutrient mobilization, grassland biodiversity, vegetation diversity, dairy farming, climate mitigation, trade-offs, rewetting
Citation: Heuts TS, Giersbergen Qv, Nouta R, Nijman TPA, Aben RCH, Scheer Ovd, Heuts PGM, Skovsholt LJ, Quadra GR, Smolders AJP and Fritz C (2024) Shallow drainage of agricultural peatlands without land-use change: have your peat and eat it too. Front. Environ. Sci. 12:1437394. doi: 10.3389/fenvs.2024.1437394
Received: 23 May 2024; Accepted: 20 September 2024;
Published: 09 October 2024.
Edited by:
Haojie Liu, University of Rostock, GermanyReviewed by:
Mingzhi Lu, Northeast Normal University, ChinaMiaorun Wang, University of Rostock, Germany
Lei Ma, Lanzhou University, China
Copyright © 2024 Heuts, Giersbergen, Nouta, Nijman, Aben, Scheer, Heuts, Skovsholt, Quadra, Smolders and Fritz. This is an open-access article distributed under the terms of the Creative Commons Attribution License (CC BY). The use, distribution or reproduction in other forums is permitted, provided the original author(s) and the copyright owner(s) are credited and that the original publication in this journal is cited, in accordance with accepted academic practice. No use, distribution or reproduction is permitted which does not comply with these terms.
*Correspondence: T. S. Heuts, dG9tLmhldXRzQHJ1Lm5s