 Mengyu Ge
 Weifeng Wang
 Honghua Ruan
 Guobing Wang1
- 1College of Ecology and Environment, Nanjing Forestry University, Nanjing, China
- 2Department of Agricultural Sciences, University of Helsinki, Helsinki, Finland
Forest plantations cover a large percentage of global forest landscapes contributing significantly to carbon sequestration. By using continuous eddy covariance technique, we observed net ecosystem CO2 exchange (NEE), gross primary production (GPP), ecosystem respiration (ER), and meteorological variables from August 2018 to December 2019 in a Poplar plantation. The Poplar plantation ecosystem was a carbon sink overall, with high carbon uptake in growing season and limited uptake/emission in non-growing season. The annual cumulative NEE, GEP, and ER were −763.61, 1542.19, and 778.58 g C m−2 yr−1, respectively. Photosynthetically active radiation (PAR) significantly influenced NEE both at half-hourly and daily scale (P < 0.01 for both), while relative humidity (RH) and vapor pressure deficit (VPD) only significantly affected NEE at half-hourly scale (P < 0.01). The prevailing wind direction throughout 2019 was southeast and it varied between seasons. Southeast wind was the prevailing wind direction in summer and winter, while southwest and northeast wind were the dominant wind direction in spring and autumn, respectively. Our results highlight that polar plantations play an important role in storing carbon, and that understanding meteorological conditions is crucial in investigating ecosystem-atmosphere interactions and their impacts on carbon cycling.
1 Introduction
Carbon dioxide (CO2) is a powerful greenhouse that can efficiently trap heat and warm the Earth. The current CO2 in the atmosphere is 421 ppm, 50% higher than the pre-industrial concentration (Letcher, 2020). The increasing trend of CO2 will lead to the an obvious rise of surface temperature compared to pre-industrial temperatures (Bindoff et al., 2014). The unprecedented climatic warmth has resulted in a series of environmental problems (e.g., drought, storms, heat waves, rising sea levels) (Cook et al., 2018; Hashim and Hashim, 2016), warranting the investigation of carbon sink that can remove greenhouse gas from the atmosphere.
Forests can sequester carbon by capturing atmospheric CO2 through photosynthesis. Due to the high carbon storage of the trees and soils, forests are the largest carbon sink in the terrestrial ecosystem, with annual absorption of 7.6 billion metric tonnes of CO2 (Harris et al., 2021). While forests can make a great contribution to slow down global warming, many countries have been massively defrosted by humans to meet the increasing need of food and fuel, and by natural disasters like wildfires (Betts et al., 2017). Forest loss has caused severe environmental and economic issues, and to cope with the situation, many countries have launched tree-planting programs (Du et al., 2022; Kaine et al., 2023; Shen et al., 2024; Tang et al., 2022), leading the global expansion of forest plantations.
Forest plantations, established through human intervention, represent a distinct type of ecosystem that is often overlooked in carbon sequestration studies (Böttcher and Lindner, 2010). They not only bring economic benefits by offering woods, but also contribute to the environment by storing carbon (Kaith et al., 2023). Forest plantations cover around 294 million ha, representing roughly 7% of global forest area. China has a massive area of forest plantation, accounting for 33.3% of China’s total forest area and 26.3% of the global forest area (Cheng et al., 2023). While many studies have investigated carbon fluxes in natural forests (Bisht et al., 2023), fewer studies have investigated carbon fluxes in forest plantations.
Poplar (Populus spp.) are perennial deciduous tree species that can adapt to dry and moist habitats. Due to the fast-growing speed and high biomass productivity, Poplar trees could be used as wood and biofuel products. They have been found to be widely distributed around the world (Xi et al., 2021), roughly reaching 31.4 and 6.67 million in the world and China, respectively (Wu et al., 2019). Thus, Poplar plantation could potentially contribute to the mitigation of global warming. However, the unique contributions of managed Poplar ecosystems to carbon cycling have not been thoroughly examined.
Remote sensing, ground-based measurements, and modeling approaches are three typical methods monitoring the carbon sequestration of terrestrial ecosystems (He et al., 2024). By using satellites and aerial imagery to assess vegetation cover, biomass, and land-use changes over large areas, remote sensing provides spatial and temporal data essential for carbon assessment (Asner, 2009). Ground-based measurements involve direct sampling and analysis of carbon pools in vegetation and soil, showing the amount of carbon stored in different components of the ecosystem (Baldocchi et al., 2001). Eddy covariance measurement is a specific type of ground-based technique capturing the exchange of CO2, water vapor, and energy between the land surface and the atmosphere (Mauder et al., 2021). It can provide continuous, real-time data on net ecosystem exchange (Pastorello et al., 2020), offering insights into how ecosystems respond to environmental changes over various temporal scales as well as supplying data to validate and calibrate carbon cycle models (Bao et al., 2019; Buysse et al., 2017).
In this study, we analyzed NEE and its component fluxes (including GEP and ER) in a Poplar plantation by using eddy covariance measurement. Meteorological variables were also recorded simultaneously. We aim to reveal the magnitude, variability, drivers, and sources of carbon fluxes in the Poplar plantation. We hypothesized that the Poplar plantation is a sink of the atmospheric CO2; CO2 fluxes show seasonal and diurnal variations caused by different meteorological conditions; most of the emissions originate from the southward of the measurement site.
2 Materials and methods
2.1 Site description
The measurement was set up in the Dongtai forest plantation (32°51″26″N, 120°51″01″E) which was established in 2018 (Figure 1). The annual mean temperature, precipitation, and sunshine hour are 14.6°C, 1,051 mm, and 2,167 h, respectively. Desalted meadow is the main soil type and sandy loam is the main soil structure in the plantation. Dongtai forest plantation covers 3,000 ha with a flat terrain, and it was established in 2018 as well. The EC system was roughly established in the center of the site, 35 m above the soil surface. The forest coverage rate is up to 85% and the stand density and tree height are 2,800 trees ha-1 and 20 ± 0.3 m, respectively. The forest plantation is dominated by Populus canadensis, with the presence of understory vegetation, consisting of trees (e.g., Morus alba L., Broussonetia papyrifera L.), forbs (e.g., Solidago canadensis L., Microstegium vimineum, and Pharbitis purpurea), and grasses (e.g., Setaria glauca L., Imperata cylindrica, and Setaria viridis).
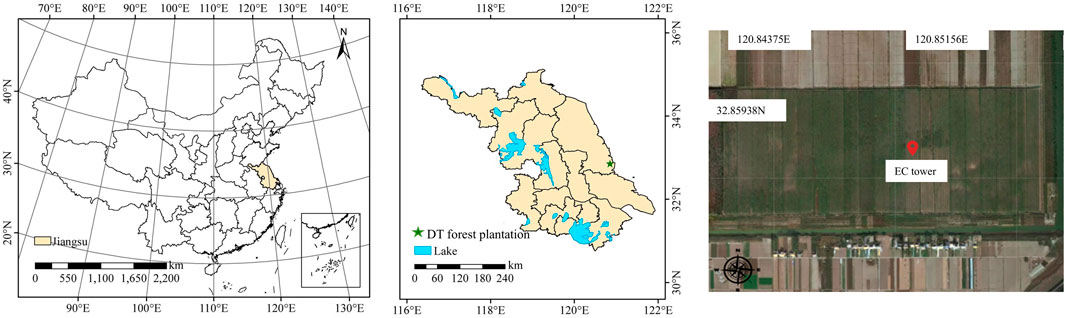
Figure 1. Location of Dongtai (DT) forest plantation and flux tower. Figure modifies after Han et al. (2022).
2.2 Flux measurements
We used EC technique to measure CO2 fluxes. The EC system consisted of (i) an open-path infrared CO2/H20 gas analyzer measuring the density of CO2 and water vapor (LI-7500A, Li-COR Inc., United States); (ii) a 3D sonic anemometer (Windmaster, Gill, United Kingdom ) observing the three-dimensional wind velocity and virtual temperature; (iii) a data logger (CR5000, Campbell Scientific Inc., United States) to record measurement data from the gas analyzer and the 3D sonic anemometer.
Other relevant instruments observing meteorological variables include net radiometer with all 4 sensors (CNR4, Kipp and Zonen, Delft, Netherlands), PAR radiometer (LI-190R, Li-COR Inc., United States), humidity and temperature sensors (HMP155, Vaisala Group, Helsinki, Finland), tipping bucket rain gauge (Texas Electronics TR-525M, Texas Instruments, Dallas, United States), soil temperature and moisture sensor (TEROS12, METER, United States). Data obtained from all the aforementioned instruments was recorded by the data logger (Sutron 9210 Xlite, United States) every 30 min, then processed by SmartFlux, and stored in a USB driver.
2.3 Flux data treatment
The raw data obtained from EC was analyzed by EddyPro 6.2 developed by LI-COR Biosciences (Fratini and Mauder, 2014). The half-hourly flux was calculated by the mean covariance between fluctuations in vertical wind velocity and CO2 density. Several corrections were conducted afterwards, including de-spiking (Vickers and Mahrt, 1997; Vitale, 2021), de-trending (Donateo et al., 2015), coordinate rotations (Rannik et al., 2020), spectral corrections (Emad, 2023; Moncrieff et al., 2005), and density corrections (Jentzsch et al., 2021). For more information on correction procedures, see Franz et al. (2018).
The corrected half-hourly fluxes were screened to remove erroneous data. We removed the data observed in the periods of the system malfunctioning and low turbulence. The data did not meet the stationarity criteria was also removed (Foken and Wichura, 1996). EddyPro 6.2 can create quality flags (1–9) (Lee et al., 2004), and we only used the data that have quality flags of 1, 2, and 3.
The missing data were gap-filled in the software TOVI 2.8.1 developed by LI-COR Biosciences (Fratini and Mauder, 2014). We used various methods to fill the missing data according to the gap length. The linear regression was used when the gaps were less than 2 h. For the gaps over 2 h, mean diurnal variation (MDV, filling gaps with bin-averages of corresponding half hours or hours on previous and subsequent days) was used. However, MDV cannot consider the non-linear regression between flux data and environmental variables when the gaps are over 1 week, which unavoidably leads to high uncertainties. Thus, non-linear regression was used when the gaps were over 1 week.
At the gap-filling step, GEP and ER were further deduced by portioning the NEE measurement. NEE was equal to ER in non-growing season, due to the lack of carbon uptake by photosynthesis. During the growing season, only nighttime respiration (ERn) was equal to NEE, and thus, we used the well-established correlation between ERn and soil temperature to compute daytime respiration (Equation 1). This method is supported by studies such as Xu and Baldocchi (2004) and Reichstein et al. (2005), which demonstrated its effectiveness in partitioning NEE into its components. GEP was further deduced by Equation 2.
where ERn (μmol CO2 m−2 s−1) is the nighttime respiration, A and B are parameters, TS (°C) is soil temperature at depth of 5 cm.
where GEP (μmol CO2 m−2 s−1) is the gross ecosystem production, ER (μmol CO2 m−2 s−1) is ecosystem respiration, and NEE (μmol CO2 m−2 s−1) is net ecosystem exchange.
A complete dataset can be generated after gap-filling, allowing us to calculate the cumulative CO2 fluxes at different temporal scales. Specifically, the daily cumulative fluxes (g C m⁻2 d⁻1) were calculated by summing the half-hourly NEE flux data for each day. Similarly, the monthly cumulative fluxes (g C m⁻2 mon⁻1) were determined by summing the daily cumulative fluxes for each month. This approach ensures that all flux measurements, corrected and gap-filled, are accurately integrated over the specified time periods, providing a comprehensive view of the carbon dynamics in the Poplar plantation.
The footprint analysis was also conducted to estimate the site and relative importance of passive scalar sources contributing to the observed fluxes. The estimation was conducted following method of the “simple footprint parameterization” proposed by Kljun et al. (2004). The analysis was also conducted in the Tovi with the input of measurement height, friction velocity, and turbulence.
2.4 Statistical analysis
The statistical analysis was conducted in R v.3.6.1. The dataset was first inspected for the following to ensure data quality: (i) outliners were identified using boxplots; (ii) normality was assessed with the Shapiro-Wilk test; and (iii) homogeneity of variances across different subpopulations was evaluated using Levene’s test. Pearson correlation analysis was used investigate the correlation between meteorological variables (relative humidity, air temperature, vapor pressure deficit, PAR) and carbon fluxes (NEE, GEP, and ER).
3 Results
3.1 Variations in environmental conditions
3.1.1 Seasonal variations in environmental conditions
The precipitation in the Poplar plantation varied seasonally (Figure 2A). Higher amount of precipitation was observed occurring in the summer (June-August), with the maximum precipitation occurred on the 17th of July 2019 (58.8 mm). The precipitation started to decrease significantly in October when the plantation entering the off-season. SWC showed small variations with time, ranging from 13% to 32%. Similarly, no clear seasonal pattern was observed in relative humidity (RH) which was in a range of 60%–100%, although a slightly higher value was observed in the summer than that in other seasons.
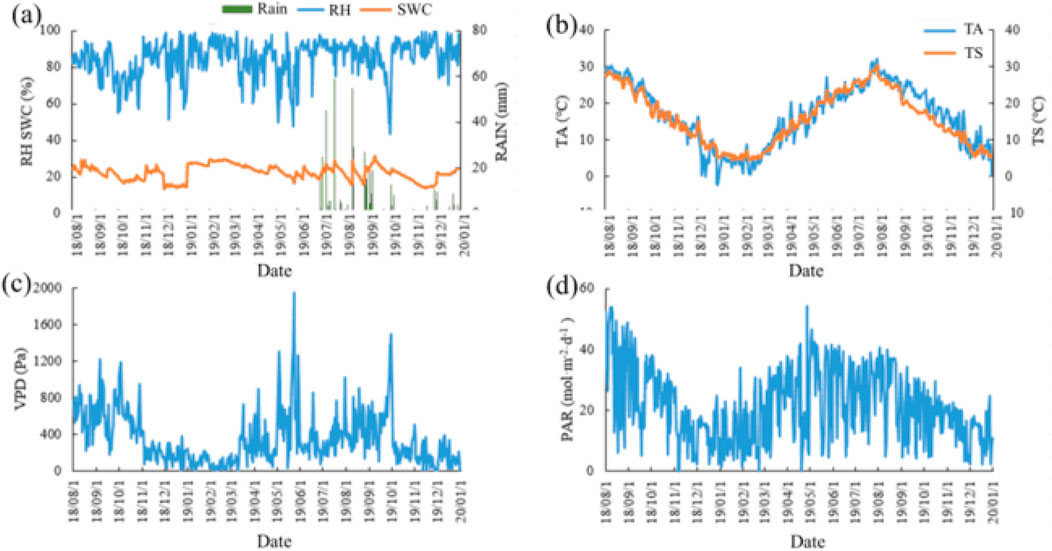
Figure 2. Seasonal variations in precipitation (Rain, mm, (A)), relative humidity (RH, %, (A)), soil water content (depth: 5 cm, SWC, %, (A), air temperature (TA, °C, (B)), soil temperature (depth: 5 cm, TS, °C, (B)), vapor pressure deficit (VPD, Pa, (C)), and photosynthetically active radiation (PAR, mol m−2 d−1, (D)). Precipitation measurement starts in June 2019 due to rain gauge malfunction.
The seasonal variation pattern of soil temperature (depth: 5 cm) and air temperature (TA) was consistent (Figure 2B). They started to increase in February, peaked in July, and then decreased steadily. The mean and maximum for air temperature and soil temperature were 16.60°C and 15.96°C, and 32.07°C and 30.33°C, respectively. The same unimodal pattern was also observed in the changes of vapor pressure deficit (VPD) and photosynthetically active radiation (PAR) (Figures 2C, D).
3.1.2 Diurnal variations in environmental conditions
The diurnal variation pattern of relative humidity, air temperature, VPD, and PAR of each season was consistent (Figure 3). Yet, the degree of variations varied among the seasons, and from the large to small was summer > spring > autumn > winter. Relative humidity showed a “U”-shaped trend, decreasing from 7:00, reaching the minimum at 13:00, and then increasing steadily to a stable value (Figure 3A). The diurnal variations of air temperature, VPD, and PAR showed an inverted “U”-shape (Figures 3B–D). These variables all started to increase from 7:00 a.m. with sunrise, peaked at noon, and then decreased steadily to a stable value.
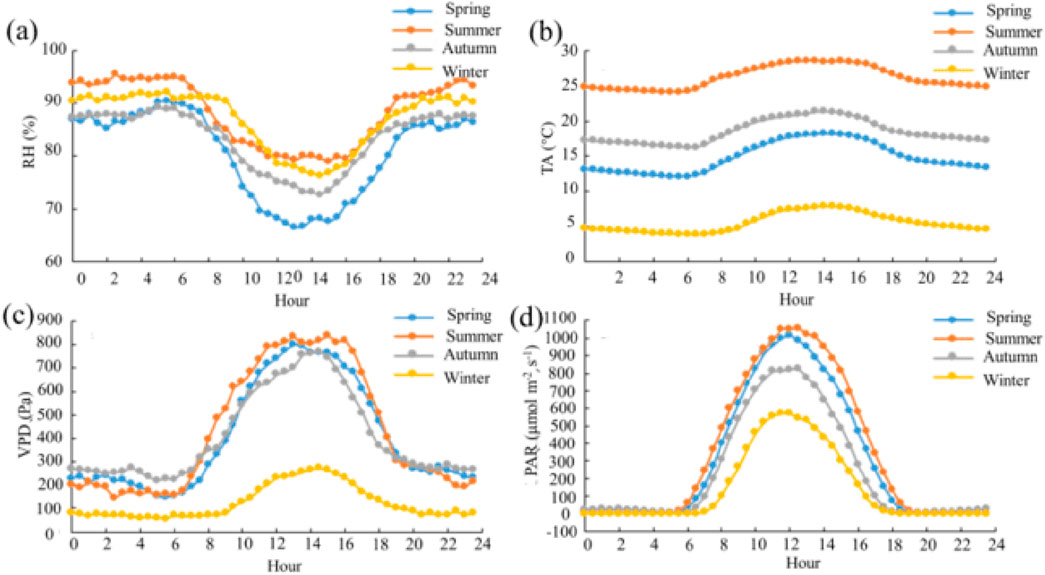
Figure 3. Diurnal variations in relative humidity (RH, %, (A)), air temperature (TA, °C, (B)), vapor pressure deficit (VPD, Pa, (C)), and photosynthetically active radiation (PAR, µmol m−2 s−1, (D)).
3.2 Variations in CO2 fluxes
3.2.1 Seasonal variations in CO2 fluxes
NEE in the Poplar plantation showed a strong seasonality (Figure 4A), ranging from −9.88 to 3.42 (daily scale) and −40.01 to 20.20 (half-hourly scale) g C m−2 d−1. In 2018, the carbon uptake was large between August and October, but it started to decrease since mid-October. The plantation became a weak carbon sink or source from November 2018 to April 2019. Afterward, the plantation entered the growing season and carbon uptake was observed again, reaching the maximum in mid-July (−9.88 g C m−2 d−1).
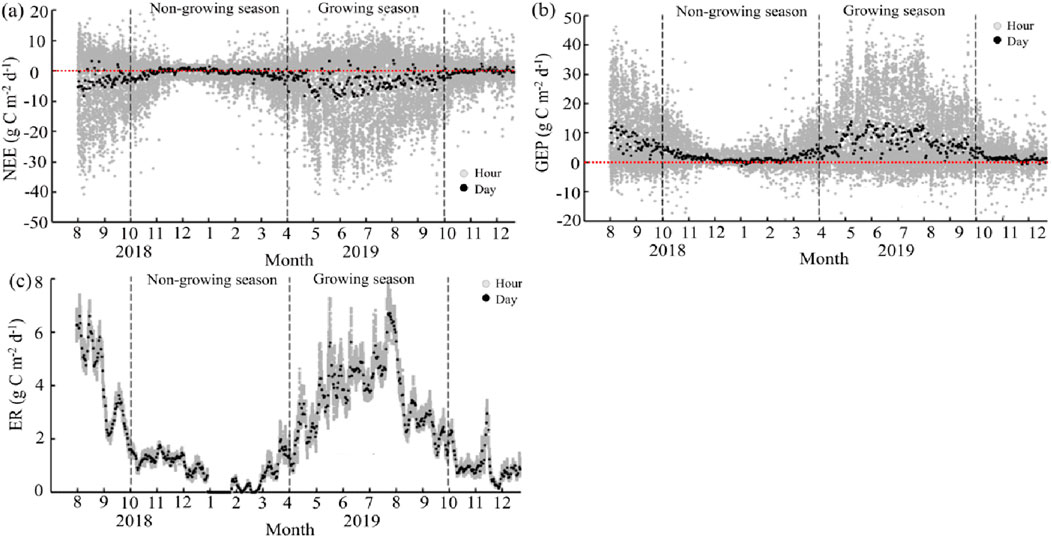
Figure 4. Seasonal variations in net ecosystem exchange (NEE, g C m−2 d−1, (A)), gross ecosystem production (GEP, g C m−2 d−1, (B), and ecosystem respiration (ER, g C m−2 d−1, (C).
Similarly, GEP and ER varied seasonally throughout the observations (Figures 4B, C). On a daily scale, GEP and ER ranged from −1.24 to 13.81, from 0.006 to 6.72 g C m−2 d−1, respectively. The seasonality of GEP and ER exhibited an inverted “U” shape, increasing since April and peaking in August (13.82 and 6.72 g C m−2 d−1, respectively), before gradually decreasing to a low stable value. In the non-growing season, GEP remained constantly low, hovering around zero, while ER was constantly below 2 g C m−2 d−1. Notably, GEP at the hourly scale exhibited large variations and even showed negative values. This might be due to the rapid and transient environmental changes (e.g., fluctuations in sunlight, temperature, and wind speed), measurement noise, and the inherent variability of turbulent fluxes.
3.2.2 Diurnal variations in CO2 fluxes
NEE showed a “U”-shaped trend with time, transitioning to negative values at 7:00 with sunrise, reaching the minimum at 13:00 (−0.23 mg C m−2 s−1), and afterwards steadily increasing to a stable value by 18:00 (Figure 5). The diurnal variation pattern of each season was consistent, although the degree of variations different: summer > spring > autumn > winter.
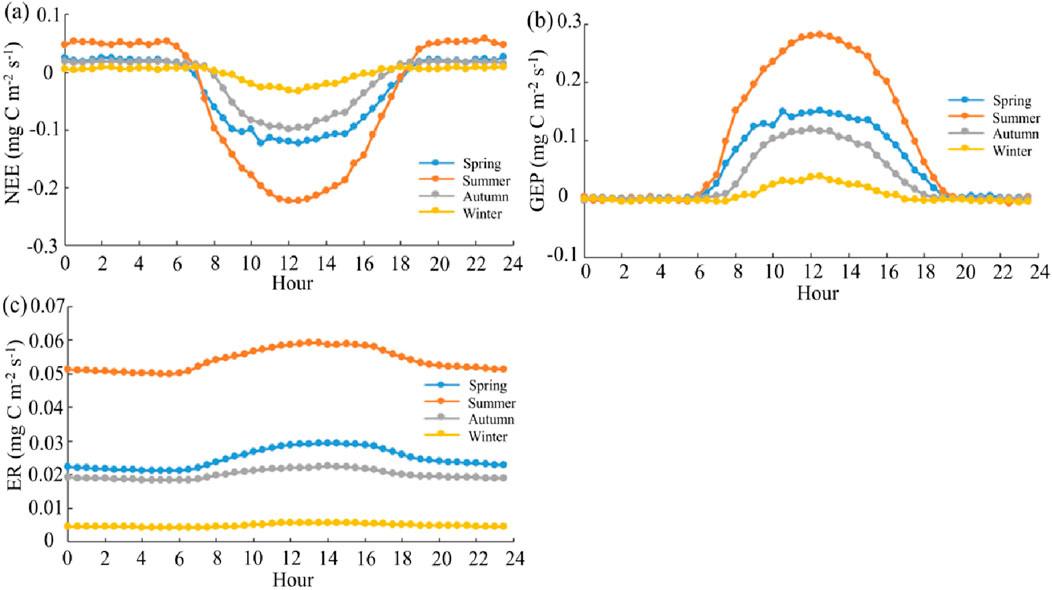
Figure 5. Diurnal variations in net ecosystem exchange (NEE, mg C m−2 s−1, (A)), gross ecosystem production (GEP, mg C m−2 s−1, (B)), and ecosystem respiration (ER, mg C m−2 s−1, (C)).
Contradictory with the diurnal variations observed in NEE, GEP exhibited an inverted “U”-shaped trend. GEP began to increase from 7:00, peaked at noon, and then steadily decreased to a stable low value by 18:00. ER showed similar diurnal variations, albeit to a lesser degree. Across seasons, both GEP and ER displayed consistent diurnal variation patterns, with the degree of variations ranking in the following order: summer > spring > autumn > winter.
3.2.3 Variations in cumulated CO2 fluxes
Overall, the Poplar plantation was a carbon sink throughout the observations (Figure 6). The annual cumulative NEE in 2019 was −763.61 g m−2 yr−1. The cumulated NEE varied between seasons. The plantation showed a modest carbon emission/uptake rate from January to April, with the daily cumulated NEE constantly remaining around zero. However, starting from April, the daily accumulated NEE became negative, implying a shift towards carbon uptake. Afterward, carbon uptake increased rapidly. From October, the plantation showed a weak carbon uptake and emission once more. The monthly cumulated NEE showed a “V”-shaped trend, increasing from April, peaking in June, and then decreasing to a low value since October (Figure 7).
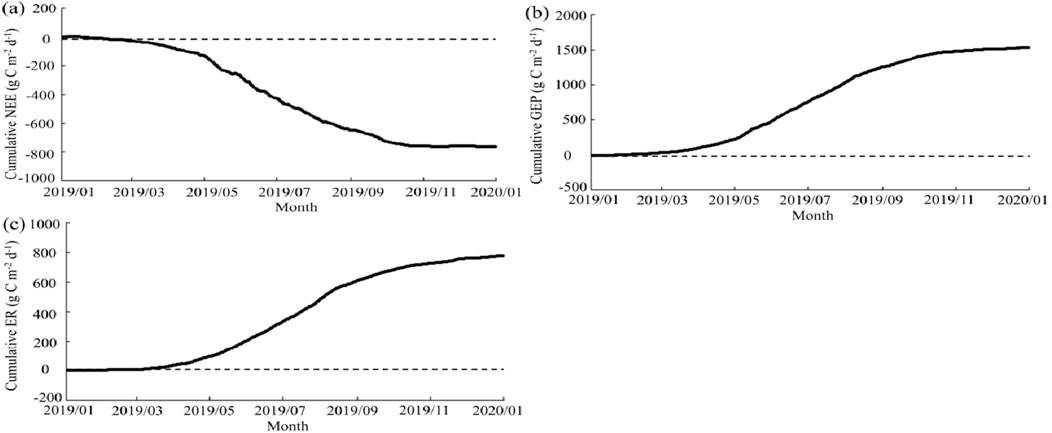
Figure 6. The cumulative net ecosystem exchange (NEE, mg C m−2 d−1), gross ecosystem production (GEP, mg C m−2 d−1), and ecosystem respiration (ER, mg C m−2 d−1) at the daily scale.
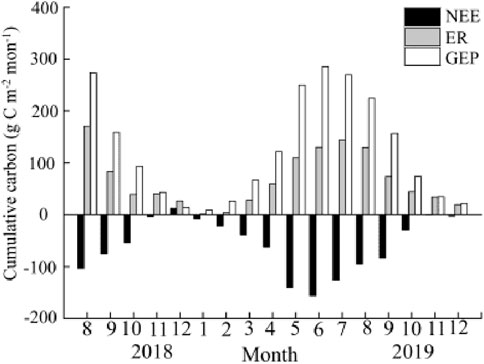
Figure 7. The cumulative net ecosystem exchange (NEE, mg C m−2 month−1, gross ecosystem production (GEP, mg C m−2 month−1, and ecosystem respiration (ER, mg C m−2 month−1, at the monthly scale.
The annual cumulative GEP and ER in 2019 was 1542.19 and 778.58 g m−2 yr−1, respectively. The daily cumulative GEP and ER also varied between the growing and non-growing seasons (Figure 6). From January to April 2019, the changes in GEP and ER were slow. The significant increase of GEP and ER began in April and continued until October, after which they gradually decreased to reach a stable, low value. The monthly cumulated GEP and ER showed an inverted “V”-shaped trend, increasing from April, peaking respectively in July and June, and then steadily decreasing.
3.3 Correlations between CO2 fluxes and environmental factors
3.3.1 The overall correlations between CO2 fluxes and environmental factors
Throughout the growing season in 2019, NEE was significantly affected by RH, TA, VPD, and PAR (P < 0.01, Table 1), and the effects from large to small: PAR > VPD > TA > RH. Notably, all these environmental variables were significantly affected by each other (P < 0.01). RH mostly correlated with VPD, while TA was predominantly affected by PAR. Similarly, GEP and ER were also significantly affected by RH, TA, VPD, and PAR (P < 0.01). The effects of these environmental variables on GEP and ER from large to small were PAR > TA > VPD > RH and TA > PAR > VPD > RH, respectively.
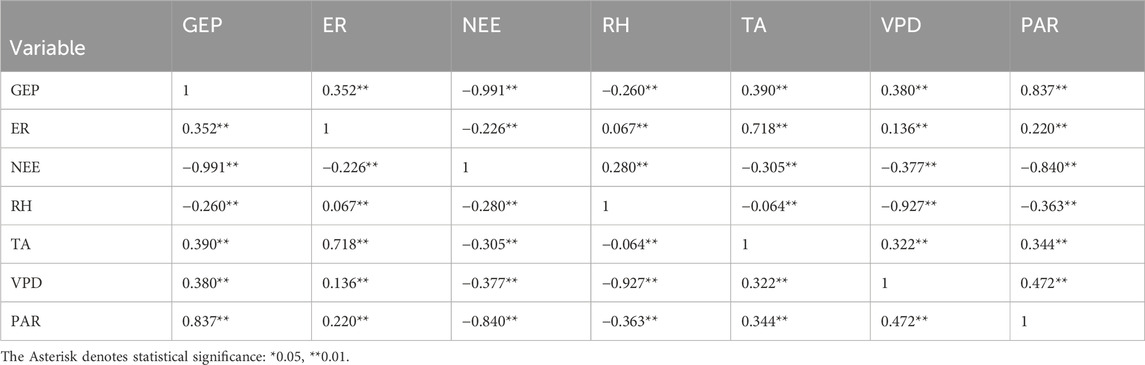
Table 1. Correlation between environmental variables, including relative humidity (RH, %), air temperature (TA, °C), vapor pressure deficit (VPD, Pa), photosynthetically active radiation (PAR, µmol m−2 s−1) and carbon fluxes, including net ecosystem exchange (NEE, mg C m−2 s−1), gross ecosystem production (GEP, mg C m−2 s−1), and ecosystem respiration (ER, mg C m−2 s−1) in the growing season of 2019.
3.3.2 The correlations between NEE and PAR, VPD, and air temperature
NEE increasingly became more negative with rising PAR at both the half-hourly and daily scale (P < 0.01 for both, Figures 8A, B). In contrast, NEE was only significantly affected by VPD and TA at the half-hourly scale (P < 0.01), and the correlation disappeared at the daily scale (Figures 8C–F).
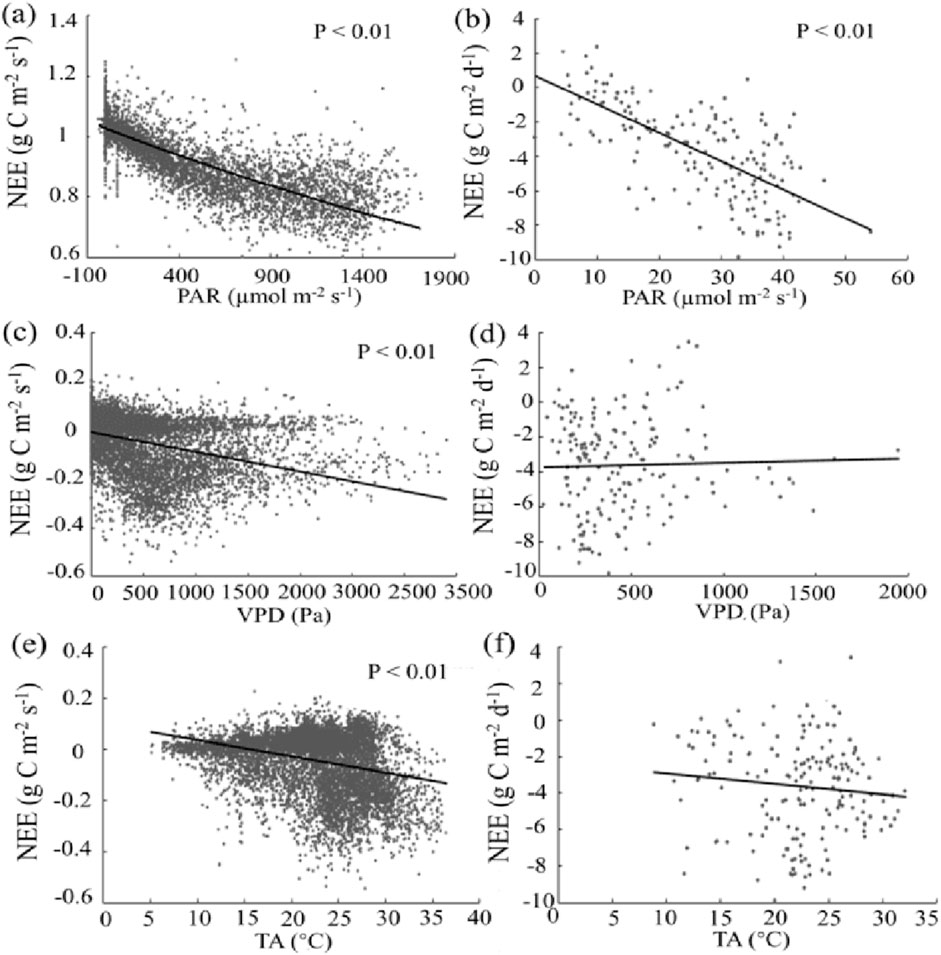
Figure 8. Correlation between (NEE, g C m−2 s−1 for half-hourly scale, g C m−2 d−1 for daily scale) and environmental variables, including photosynthetically active radiation (PAR, µmol m−2 s−1, (A, B)), vapor pressure deficit (VPD, Pa, (C, D)), and air temperature (TA, °C, (E, F)).
3.4 Footprint estimates
3.4.1 Wind direction analysis
The wind speed of the Poplar plantation ranged from 0.009 to 1.31 m s−1 in 2019. The wind frequency ranked from highest to lowest as follows: southeast wind (90°–180°) > northeast wind (0°–90°) > southwest (180°–270°) > northwest (270°–360°), with values of 36.2%, 26.2%, 24.4%, and 13.2%, respectively (Figure 9). Thus, the dominant wind direction over the year was southeast. The prevailing wind direction varied between seasons. In spring, summer, autumn, and winter, the dominant wind directions were southwest (wind frequency 37.9%, wind speed 0.42 m s−1), southeast (42.3%, 0.41 m s−1), northeast (37.3%, 0.34 m s−1), and southeast (37.7%, 0.38 m s−1), respectively.
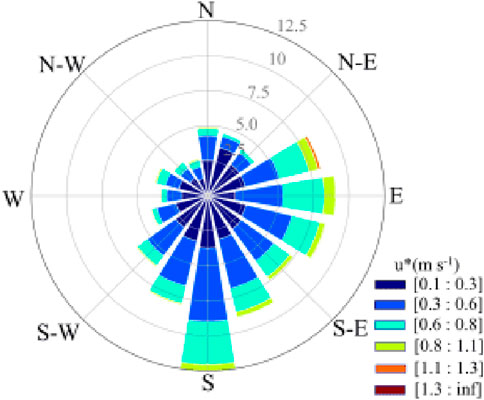
Figure 9. Annual wind rose in the Poplar plantation located in Dongtai.
3.4.2 Flux footprint analysis
The footprint size differed between stable and unstable atmospheric conditions, as well as between day and night (Figure 11). A larger footprint size was observed under stable conditions compared to unstable conditions. Moreover, the footprint size was greater during daytime than at night. When the contribution zones were set to 80%, the longest distance from the footprint to the flux tower was 615 and 379 m under stable and unstable conditions, respectively; 328 m and 520 m during daytime and nighttime, respectively.
4 Discussion
We conducted a whole-year EC measurement in a Poplar plantation, a less commonly studied forest type. Unlike previous research, we investigated CO2 fluxes and their response to environmental variables, including PAR, air temperature, and VPD at both half-hourly and daily scales, providing detailed insights into carbon dynamics. As we hypothesized, the Poplar plantation was a sink of the atmospheric CO2, showing different carbon uptake rates between seasons. We found that PAR, air temperature, and VPD significantly affected CO2 fluxes, with PAR being the only variable exerting effects on NEE at both the half-hourly and daily scale. The close relationship between these meteorological factors and NEE have also been observed in Han et al. (2024). Additionally, this study revealed how dominant wind direction affected flux footprint size, offering new understanding of atmospheric influences on CO2 flux measurements. However, against our hypothesis, the annual dominant wind direction in our study area was southeast.
4.1 Poplar plantation is a strong sink of CO2 fluxes
Our results show that the Poplar plantation overall is a sink absorbing atmospheric CO2. Higher carbon uptake was observed in the summer months, probably due to the strong photosynthesis when the plants were in an active growing stage and environmental conditions were favorable (e.g., high temperature, increasing solar radiation, sufficient precipitation) (Adams et al., 2020). In contrast, the carbon uptake became limited when the plants entering the off-season and the photosynthesis was weak, resulting from the decreasing temperature and solar radiation, the loss of leaves, and the low water availability (Ameray et al., 2021). The seasonal variations of GEP and ER were similar with NEE (Figures 4, 6, 7), which could also be ascribed to the increasing photosynthetic activities, higher leaf area index, active plant growth and biomass accumulation, a longer photoperiod, and optimal environmental conditions (Wagle and Kakani, 2014; Xia et al., 2009).
In 2019, the annual cumulative NEE was −763.61 g C m−2 yr−1, which was more than three times higher than that observed in the Poplar plantation in Belgium (Verlinden et al., 2013), and approximately 2 times higher than that observed in the Poplar plantations located in Hunan province, China (Peng et al., 2009). These results indicate that the Poplar plantation in our study area is highly efficient at carbon sequestration, probably due to the favorable environmental conditions. For example, our site could benefit from an average annual temperature of 14.6°C, which enhances metabolic and photosynthetic activities, compared to 10.5°C at the Belgian site and 13.5°C at the Hunan site. Additionally, our site receives 1,051 mm of annual precipitation, providing ample water for optimal growth. This is higher than the 820 mm of annual precipitation at the Belgian site and 950 mm at the Hunan site. Furthermore, our site could benefit from higher photosynthetically active radiation (PAR) due to longer sunshine hours (2,167 h annually), further enhancing photosynthesis. The other sites have fewer sunshine hours and potentially lower PAR, contributing to their lower carbon sequestration efficiency. The annual cumulative NEE in our study is up to 12 times higher than that observed in a natural pine forest (Peng et al., 2009; Yan et al., 2023), 4.5 times higher than that observed in a natural Caatinga forest (Mendes et al., 2020), 2 times higher than that recorded in an evergreen broadleaf forest (Yan et al., 2013). Taken together, Poplar trees are very efficient in carbon sequestration.
4.2 Environmental controls on CO2 fluxes
Our results show that photosynthetically active radiation (PAR) can positively affect carbon uptake in the Poplar plantation (Figures 8A, B). This is because chlorophyll and other pigments can transform PAR into glucose (Fan et al., 2011), and thus, enhance eventually enhance photosynthesis and carbon uptake. The positive correlation between PAR and carbon uptake has also been found before (Hikosaka et al., 2021). Notably, PAR in our study reached the saturation point, indicating a limitation for plants to absorb and convert light energy into chemical energy during the observations. Therefore, plants at our study site might not utilize higher levels of PAR for photosynthesis beyond the saturation point. Although the increasing PAR can lead to higher photosynthesis and carbon uptake up to the saturation point, other factors (e.g., CO2 concentration, temperature range, and the efficiency of photosynthetic machinery) may eventually restrict photosynthetic activities and carbon uptake (Kumarathunge et al., 2019); further work is required to investigate the specific mechanism.
The positive correlation between VPD and carbon uptake in the Poplar plantation (Figures 8C, D) matches many previous findings (Bobich et al., 2010; Zhang et al., 2024). Our finding implies a moderate VPD level, suitable soil moisture conditions, and sufficient water supply to the plants at our site. This is because high VPD levels, indicating drier atmospheric conditions and the water stress in plants, can lead to stomata closure, decreasing water availability for biochemical reactions in chloroplasts, and photosystem function disruption (Wu et al., 2020). All these inside-plant changes could reduce photosynthesis and carbon uptake, as has been found before (Zhang et al., 2024).
Increasing air temperature can enhance carbon uptake in the Poplar plantation (Figures 8E, F), matching previous studies (Helbig et al., 2022; Zhang et al., 2024). The possible reason for the positive correlation between air temperature and carbon uptake might be that higher temperature could enhance microbial respiration, enzyme activity, membrane fluidity, electron transport, and rubisco activity and, thus, stimulate photosynthetic activities. However, when soil temperature above certain thresholds exceeding limits for plant and microbial activity (Bürli et al., 2021), and when multiple environmental factors interact to regulate carbon dynamics or air temperatures in a range that does not significantly affect biological activities (Chari et al., 2021), negative and poor correlation between soil temperature and carbon uptake could also be observed, respectively.
Notably, at the daily scale, PAR was the only environmental variable affecting NEE, while VPD and air temperature only significantly affected NEE at the half-hourly scale (Figure 8). This difference occurs because PAR has a consistent and direct influence on photosynthesis throughout the day, driving carbon uptake. In contrast, VPD and air temperature have more variable effects that can fluctuate significantly within shorter time frames. Different controlling variables on carbon uptake at different time scales have also been reported. For example, Fang (2011) reported that NEE was mostly affected by PAR at the half-hourly scale, while air temperate significantly affected on NEE at the daily scale in the Poplar plantation established in the sandy soils. The dominant controls on carbon uptake can also vary between the day and night, as Hinko-Najera et al. (2017) reported that PAR and air temperature controlled NEE in the daytime, while only air temperature controlled NEE at night. Similarly, Mayen et al. (2024) reported that changes of NEE in daytime was mainly controlled by PAR, while changes in NEE at night were mainly driven by temperature. All these results suggest that the controlling factors for CO2 fluxes could be different, depending on time scale, and ecosystem types.
4.3 Flux footprint size is controlled by atmospheric conditions
Our results show that the southeast is the dominant wind direction overall in the Poplar plantation located in Dongtai (Figure 9). However, the prevailing winds can be different between seasons, probably due to the interactions between the atmospheric circulation patterns, temperature gradients, surface traits, and topography (Stoffelen et al., 2005). The flux footprint size could impact CO2 flux measurements by determining the area over which the flux measurements are representative, with larger footprints under stable conditions capturing more extensive areas and potentially higher flux values, while smaller footprints under unstable conditions capture less variability (Li et al., 2022; Pöhlker et al., 2019). The larger footprint size under stable conditions than under unstable conditions (Figure 10) suggests that flux footprint size could be affected by atmospheric conditions. This might be ascribed to the following two possible reasons. Firstly, when atmospheric conditions are stable, the atmosphere could be more stratified with less vertical mixing and, thus, air parcels could travel longer distances before being mixed or dispersed, leading to a large footprint size for flux measurements (Li et al., 2022). Secondly, air parcels may follow more consistent and predictable trajectories under stable atmospheric conditions, allowing air parcels to travel longer distances before reaching the measurement site (Pöhlker et al., 2019).
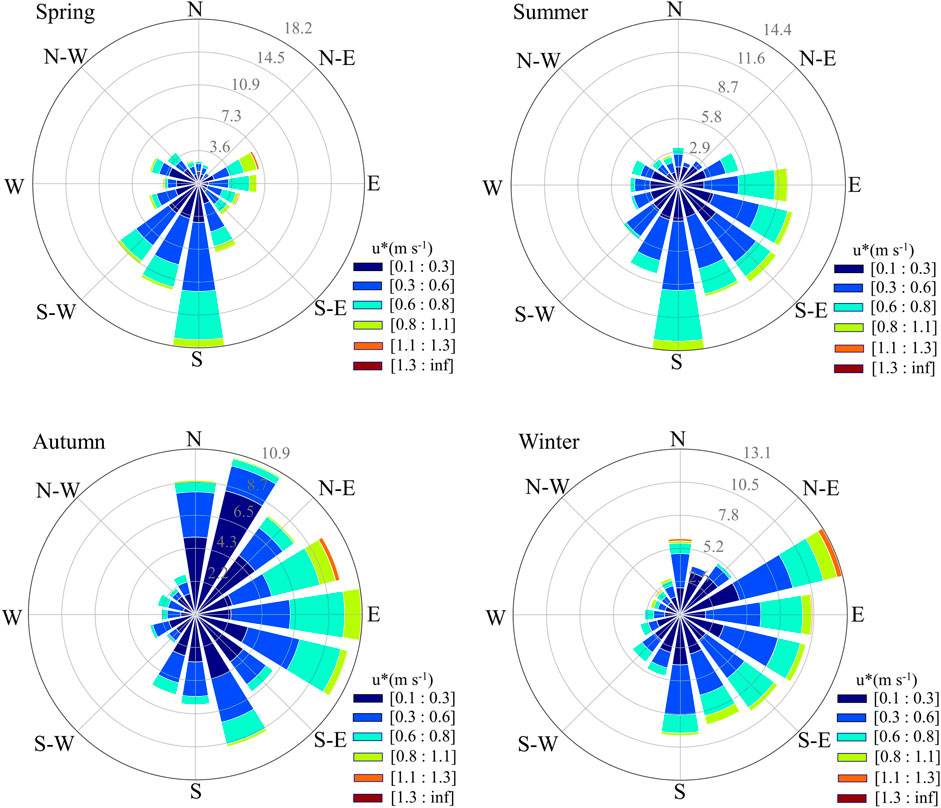
Figure 10. Wind rose of four seasons in the Poplar plantation located in Dongtai.
Accordingly, the diurnal variations in the atmospheric conditions could explain the different footprint sizes between the day and night (Figures 11C, D). This information is discussed at the end to emphasize the importance of understanding flux footprint size for accurately interpreting CO2 flux data and assessing the contribution of different sources and sinks within the measured area. This ensures the reliability and robustness of our findings on carbon dynamics in the Poplar plantation. The footprint size in our study is around 1.5 times larger than that observed in Wang et al. (2014), probably because their measurement height was lower than ours. The effects of measurement height on footprint size have also been reported by Arriga et al. (2017). Other factors affecting flux footprint size might include surface characteristics (Fitzpatrick et al., 2019) and model selection for footprint calculation (Liu et al., 2022).
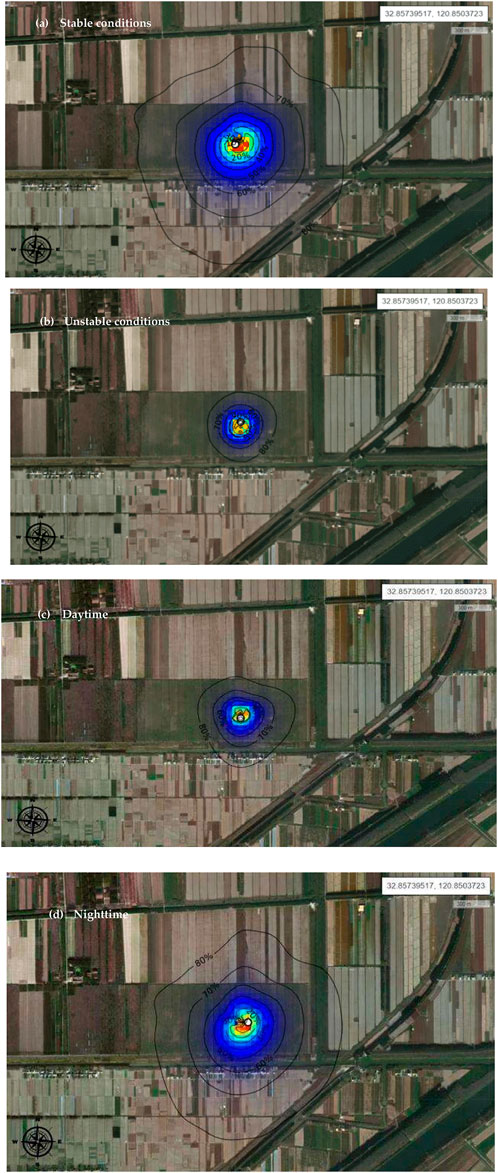
Figure 11. Annual footprint under stable (A) and unstable (B) atmospheric conditions, and during daytime (C) and nighttime (D) in the Poplar plantation.
4.4 Limitations of this study
We recognize that our study has some limitations. First, our measurements lasted only 1 year, which may not fully capture interannual variability in CO2 fluxes. Second, we did not examine how seasonal shifts in wind patterns impact carbon flux measurements. Further analysis could enhance understanding of the spatial variability of fluxes related to changing atmospheric conditions. Although this study discussed the influence of environmental variables like PAR, VPD, and air temperature on CO2 fluxes, it lacks a detailed mechanistic exploration of how these factors interact. Finally, the reliance on a single measurement site may limit the generalizability of our findings to other Poplar plantations.
5 Conclusion
Our study revealed that the Poplar plantation functioned predominantly as a carbon sink, with its carbon uptake varying between the growing and non-growing seasons. During the growing season, the plantation absorbed CO2 effectively, whereas, in the non-growing season, it acted as a weak carbon source. Our findings suggest that optimizing forest management practices can enhance carbon uptake, particularly during the growing season. We observed significant diurnal variations in carbon uptake, with peak rates occurring at noon. Among the environmental variables, PAR, VPD, and air temperature were crucial in influencing carbon uptake. PAR was identified as the primary factor affecting NEE at both half-hourly and daily scales, while VPD and temperature significantly impacted NEE only at the half-hourly scale. The different dominant factors affecting carbon flux at varying time scales suggests the need for refined models in carbon dynamics. Additionally, the dominant wind direction was southeast, but it varied seasonally, influencing the flux footprint size. Our findings also indicate that atmospheric conditions affect flux footprint size, with larger footprints observed under stable conditions. This comprehensive analysis could enhance our understanding of carbon dynamics in Poplar plantations and underscore the importance of local environmental conditions in shaping carbon sequestration processes.
Data availability statement
The data related to this article can be obtained from the corresponding author (WW) on request.
Author contributions
MG: Formal analysis, Visualization, Writing–original draft. WW: Conceptualization, Methodology, Writing–review and editing, Funding acquisition, Supervision. HR: Conceptualization, Resources, Writing–review and editing. GW: Resources, Writing–review and editing. SZ: Formal analysis, Visualization, Writing–review and editing. SY: Resources, Writing–review and editing.
Funding
The author(s) declare that financial support was received for the research, authorship, and/or publication of this article. This study finically was supported by the key project of the open competition in Jiangsu Forestry (LYKJ [2022] 01).
Acknowledgments
We would like to thank all students and working staff in the station who helped us during the field work.
Conflict of interest
The authors declare that the research was conducted in the absence of any commercial or financial relationships that could be construed as a potential conflict of interest.
Publisher’s note
All claims expressed in this article are solely those of the authors and do not necessarily represent those of their affiliated organizations, or those of the publisher, the editors and the reviewers. Any product that may be evaluated in this article, or claim that may be made by its manufacturer, is not guaranteed or endorsed by the publisher.
References
Adams, M. A., Buckley, T. N., and Turnbull, T. L. (2020). Diminishing CO2-driven gains in water-use efficiency of global forests. Nat. Clim. Change 10, 466–471. doi:10.1038/s41558-020-0747-7
Ameray, A., Bergeron, Y., Valeria, O., Montoro Girona, M., and Cavard, X. (2021). Forest carbon management: a review of silvicultural practices and management strategies across boreal, temperate and tropical forests. Curr. For. Rep. 7, 245–266. doi:10.1007/s40725-021-00151-w
Arriga, N., Rannik, Ü., Aubinet, M., Carrara, A., Vesala, T., and Papale, D. (2017). Experimental validation of footprint models for eddy covariance CO2 flux measurements above grassland by means of natural and artificial tracers. Agric. For. Meteorology 242, 75–84. doi:10.1016/j.agrformet.2017.04.006
Asner, G. (2009). Tropical forest carbon assessment: integrating satellite and airborne mapping approaches. Environ. Res. Lett. 4, 034009. doi:10.1088/1748-9326/4/3/034009
Baldocchi, D., Falge, E., Gu, L., Olson, R., Hollinger, D., Running, S., et al. (2001). FLUXNET: a new tool to study the temporal and spatial variability of ecosystem–scale carbon dioxide, water vapor, and energy flux densities. ©2001 Am. Meteorological Soc. 82, 2415–2434. doi:10.1175/1520-0477(2001)082<2415:fantts>2.3.co;2
Bao, X., Li, Z., and Xie, F. (2019). Environmental influences on light response parameters of net carbon exchange in two rotation croplands on the North China Plain. Sci. Rep. 9, 18702. doi:10.1038/s41598-019-55340-2
Betts, M. G., Wolf, C., Ripple, W. J., Phalan, B., Millers, K. A., Duarte, A., et al. (2017). Global forest loss disproportionately erodes biodiversity in intact landscapes. Nature 547, 441–444. doi:10.1038/nature23285
Bindoff, N. L., Stott, P. A., AchutaRao, K. M., Allen, M. R., Gillett, N., Gutzler, D., et al. (2014). Detection and attribution of climate change: from global to regional. Clim. change 2013 Phys. Sci. basis.
Bisht, S., Bargali, S. S., Bargali, K., Rawat, Y. S., and Rawat, G. S. (2023). Dry matter dynamics and carbon flux along riverine forests of Gori valley, Western Himalaya. Front. For. Glob. Chang 6, 1206677. doi:10.3389/ffgc.2023.1206677
Bobich, E. G., Barron-Gafford, G. A., Rascher, K. G., and Murthy, R. (2010). Effects of drought and changes in vapour pressure deficit on water relations of Populus d eltoides growing in ambient and elevated CO2. Tree Physiol. 30, 866–875. doi:10.1093/treephys/tpq036
Böttcher, H., and Lindner, M. (2010). Managing forest plantations for carbon sequestration today and in the future. Ecosystem goods and services from plantation forests. United Kingdom: Routledge, 43–76.
Bürli, S., Theurillat, J.-P., Winkler, M., Lamprecht, A., Pauli, H., Rixen, C., et al. (2021). A common soil temperature threshold for the upper limit of alpine grasslands in European mountains. Alp. Bot. 131, 41–52. doi:10.1007/s00035-021-00250-1
Buysse, P., Bodson, B., Debacq, A., De Ligne, A., Heinesch, B., Manise, T., et al. (2017). Carbon budget measurement over 12 years at a crop production site in the silty-loam region in Belgium. Agric. For. Meteorol. 246, 241–255.
Chari, N. R., Lin, Y., Lin, Y. S., and Silver, W. L. (2021). Interactive effects of temperature and redox on soil carbon and iron cycling. Soil Biol. Biochem. 157, 108235. doi:10.1016/j.soilbio.2021.108235
Cheng, K., Su, Y., Guan, H., Tao, S., Ren, Y., Hu, T., et al. (2023). Mapping China’s planted forests using high resolution imagery and massive amounts of crowdsourced samples. ISPRS J. Photogrammetry Remote Sens. 196, 356–371. doi:10.1016/j.isprsjprs.2023.01.005
Cook, B. I., Mankin, J. S., and Anchukaitis, K. J. (2018). Climate change and drought: from past to future. Curr. Clim. Change Rep. 4, 164–179. doi:10.1007/s40641-018-0093-2
Donateo, A., Cava, D., and Contini, D. (2015). Performance of different detrending methods in turbulent flux estimation. EGU General Assem. Conf. Abstr., 2740.
Du, Z., Yu, L., Yang, J., Xu, Y., Chen, B., Peng, S., et al. (2022). A global map of planting years of plantations. Sci. data 9, 141. doi:10.1038/s41597-022-01260-2
Emad, A. (2023). Optimal frequency-response corrections for eddy covariance flux measurements using the Wiener deconvolution method. Boundary-Layer Meteorol. 188, 29–53. doi:10.1007/s10546-023-00799-w
Fan, Y., Zhang, X., Wang, J., and Shi, P. (2011). Effect of solar radiation on net ecosystem CO2 exchange of alpine meadow on the Tibetan Plateau. J. Geogr. Sci. 21, 666–676. doi:10.1007/s11442-011-0871-4
Fang, X. (2011) “Carbon exchange and its response to environmental factors in Poplar plantation ecosystem (In Chinese),”. Beijing, China: Beijing Forestry University. PhD thesis.
Fitzpatrick, N., Radić, V., and Menounos, B. (2019). A multi-season investigation of glacier surface roughness lengths through in situ and remote observation. Cryosphere 13, 1051–1071. doi:10.5194/tc-13-1051-2019
Foken, T., and Wichura, B. (1996). Tools for quality assessment of surface-based flux measurements. Agric. For. Meteorology 78, 83–105. doi:10.1016/0168-1923(95)02248-1
Franz, D., Acosta, M., Altimir, N., Arriga, N., Arrouays, D., Aubinet, M., et al. (2018). Towards long-term standardised carbon and greenhouse gas observations for monitoring Europe's terrestrial ecosystems: a review. Int. Agrophysics 32, 439–455. doi:10.1515/intag-2017-0039
Fratini, G., and Mauder, M. (2014). Towards a consistent eddy-covariance processing: an intercomparison of EddyPro and TK3. Atmos. Meas. Tech. 7, 2273–2281. doi:10.5194/amt-7-2273-2014
Han, L., Chen, Y., Wang, Y., Sun, Y., Ding, Z., Zhang, H., et al. (2024). Divergent responses of subtropical evergreen and deciduous forest carbon cycles to the summer 2022 drought. Environ. Res. Lett. 19, 054043. doi:10.1088/1748-9326/ad416e
Han, M., Feng, H., Peng, C., Lei, X., Xue, J., Malghani, S., et al. (2022). Spatiotemporal patterns and drivers of stem methane flux from two poplar forests with different soil textures. Tree Physiol. 42, 2454–2467. doi:10.1093/treephys/tpac091
Harris, N. L., Gibbs, D. A., Baccini, A., Birdsey, R. A., De Bruin, S., Farina, M., et al. (2021). Global maps of twenty-first century forest carbon fluxes. Nat. Clim. Change 11, 234–240. doi:10.1038/s41558-020-00976-6
Hashim, J. H., and Hashim, Z. (2016). Climate change, extreme weather events, and human health implications in the Asia Pacific region. Asia Pac. J. Public Health 28, 8S–14S. doi:10.1177/1010539515599030
He, J., Li, W., Zhao, Z., Zhu, L., Du, X., Xu, Y., et al. (2024). Recent advances and challenges in monitoring and modeling of disturbances in tropical moist forests. Front. Remote Sens. 5. doi:10.3389/frsen.2024.1332728
Helbig, M., Živković, T., Alekseychik, P., Aurela, M., El-Madany, T. S., Euskirchen, E. S., et al. (2022). Warming response of peatland CO2 sink is sensitive to seasonality in warming trends. Nat. Clim. Change 12, 743–749. doi:10.1038/s41558-022-01428-z
Hikosaka, K., Kurokawa, H., Arai, T., Takayanagi, S., Tanaka, H. O., Nagano, S., et al. (2021). Intraspecific variations in leaf traits, productivity and resource use efficiencies in the dominant species of subalpine evergreen coniferous and deciduous broad-leaved forests along the altitudinal gradient. J. Ecol. 109, 1804–1818. doi:10.1111/1365-2745.13603
Hinko-Najera, N., Isaac, P., Beringer, J., van Gorsel, E., Ewenz, C., McHugh, I., et al. (2017). Net ecosystem carbon exchange of a dry temperate eucalypt forest. Biogeosciences 14, 3781–3800. doi:10.5194/bg-14-3781-2017
Jentzsch, K., Boike, J., and Foken, T. (2021). Importance of the WPL correction for the measurement of small CO2 fluxes. Atmos. Meas. Tech. Discuss., 1–10. doi:10.5194/amt-14-7291-2021
Kaine, G., Edwards, P., Polyakov, M., and Stahlmann-Brown, P. (2023). Who knew afforestation was such a challenge? Motivations and impediments to afforestation policy in New Zealand. For. Policy Econ. 154, 103031. doi:10.1016/j.forpol.2023.103031
Kaith, M., Tirkey, P., Bhardwaj, D., Kumar, J., and Kumar, J. (2023). Carbon sequestration potential of forest plantation soils in Eastern Plateau and Hill Region of India: a promising approach toward climate change mitigation. Water, Air, and Soil Pollut. 234, 341. doi:10.1007/s11270-023-06364-y
Kljun, N., Calanca, P., Rotach, M., and Schmid, H. (2004). A simple parameterisation for flux footprint predictions. Boundary-Layer Meteorol. 112, 503–523. doi:10.1023/b:boun.0000030653.71031.96
Kumarathunge, D. P., Medlyn, B. E., Drake, J. E., Tjoelker, M. G., Aspinwall, M. J., Battaglia, M., et al. (2019). Acclimation and adaptation components of the temperature dependence of plant photosynthesis at the global scale. New Phytol. 222, 768–784. doi:10.1111/nph.15668
Lee, X., Massman, W., and Law, B. (2004). Handbook of micrometeorology: a guide for surface flux measurement and analysis. Springer Sci. and Bus. Media 29.
Letcher, T. M. (2020). Introduction with a focus on atmospheric carbon dioxide and climate change. Future energy, 3–17. doi:10.1016/b978-0-08-102886-5.00001-3
Li, N., Sippel, S., Winkler, A. J., Mahecha, M. D., Reichstein, M., and Bastos, A. (2022). Interannual global carbon cycle variations linked to atmospheric circulation variability. Earth Syst. Dynam. 13, 1505–1533. doi:10.5194/esd-13-1505-2022
Liu, S., Liu, G., Zhang, M., Sun, Y., Fang, S., Zhen, X., et al. (2022). Evaluation of eddy covariance footprint models through the artificial line source emission of methane. J. Geophys. Res. Atmos. 127, e2021JD036294. doi:10.1029/2021jd036294
Mauder, M., Foken, T., Aubinet, M., and Ibrom, A. (2021). “Eddy-covariance measurements,” in Springer handbook of atmospheric measurements. Editor T. Foken (Cham: Springer International Publishing), 1473–1504.
Mayen, J., Polsenaere, P., Lamaud, É., Arnaud, M., Kostyrka, P., Bonnefond, J.-M., et al. (2024). Atmospheric CO2 exchanges measured by eddy covariance over a temperate salt marsh and influence of environmental controlling factors. Biogeosciences 21, 993–1016. doi:10.5194/bg-21-993-2024
Mendes, K. R., Campos, S., da Silva, L. L., Mutti, P. R., Ferreira, R. R., Medeiros, S. S., et al. (2020). Seasonal variation in net ecosystem CO2 exchange of a Brazilian seasonally dry tropical forest. Sci. Rep. 10, 9454. doi:10.1038/s41598-020-66415-w
Moncrieff, J., Clement, R., Finnigan, J., and Meyers, T. (2005). “Averaging, detrending, and filtering of eddy covariance time series,” in Handbook of micrometeorology: a guide for surface flux measurement and analysis. Editors X. Lee, W. Massman, and B. Law (Netherlands, Dordrecht: Springer), 7–31.
Pastorello, G., Trotta, C., Canfora, E., Chu, H., Christianson, D., Cheah, Y.-W., et al. (2020). The FLUXNET2015 dataset and the ONEFlux processing pipeline for eddy covariance data. Sci. Data 7, 225. doi:10.1038/s41597-020-0534-3
Peng, Z., Yan, W., HaiQing, R., QiXiang, S., and Zhou, J. (2009). Research on the variation of carbon flux and the relationship of environmental factors and carbon flux of Populus forest ecosystem in the reaches of Yangtze River in Anqing. For. Res. 22, 237–242. doi:10.3321/j.issn:1001-1498.2009.02.015
Pöhlker, C., Walter, D., Paulsen, H., Könemann, T., Rodríguez-Caballero, E., Moran-Zuloaga, D., et al. (2019). Land cover and its transformation in the backward trajectory footprint region of the Amazon Tall Tower Observatory. Atmos. Chem. Phys. 19, 8425–8470. doi:10.5194/acp-19-8425-2019
Rannik, Ü., Vesala, T., Peltola, O., Novick, K. A., Aurela, M., Järvi, L., et al. (2020). Impact of coordinate rotation on eddy covariance fluxes at complex sites. Agric. For. Meteorology 287, 107940. doi:10.1016/j.agrformet.2020.107940
Reichstein, M., Falge, E., Baldocchi, D., Papale, D., Aubinet, M., Berbigier, P., et al. (2005). On the separation of net ecosystem exchange into assimilation and ecosystem respiration: review and improved algorithm. Glob. change Biol. 11, 1424–1439. doi:10.1111/j.1365-2486.2005.001002.x
Shen, W., Sun, Y., Li, J., Zhang, H., Ding, Z., and Tang, X. (2024). Monitoring spatio-temporal dynamics of multi-dimensional karst ecosystem quality in Southwest China by integrating multi-source data. Int. J. Digital Earth 17, 2356119. doi:10.1080/17538947.2024.2356119
Stoffelen, A., Pailleux, J., Källén, E., Vaughan, J. M., Isaksen, L., Flamant, P., et al. (2005). The atmospheric dynamics mission for global wind field measurement. Bull. Am. Meteorological Soc. 86, 73–88. doi:10.1175/bams-86-1-73
Tang, X., Xiao, J., Ma, M., Yang, H., Li, X., Ding, Z., et al. (2022). Satellite evidence for China's leading role in restoring vegetation productivity over global karst ecosystems. For. Ecol. Manag. 507, 120000. doi:10.1016/j.foreco.2021.120000
Verlinden, M. S., Broeckx, L. S., Zona, D., Berhongaray, G., De Groote, T., Camino Serrano, M., et al. (2013). Net ecosystem production and carbon balance of an SRC poplar plantation during its first rotation. Biomass Bioenergy 56, 412–422. doi:10.1016/j.biombioe.2013.05.033
Vickers, D., and Mahrt, L. (1997). Quality control and flux sampling problems for tower and aircraft data. J. Atmos. Ocean. Technol. 14, 512–526. doi:10.1175/1520-0426(1997)014<0512:qcafsp>2.0.co;2
Vitale, D. (2021). A performance evaluation of despiking algorithms for eddy covariance data. Sci. Rep. 11, 11628. doi:10.1038/s41598-021-91002-y
Wagle, P., and Kakani, V. G. (2014). Growing season variability in evapotranspiration, ecosystem water use efficiency, and energy partitioning in switchgrass. Ecohydrology 7, 64–72. doi:10.1002/eco.1322
Wang, J., Zhou, J., and Ou, Q. (2014). CO2 flux footprint analysis of coastal polder wetlands in Dongtan of Chongming. J. Ecol. Rual Environ. 5, 588–594.
Wu, J., Serbin, S. P., Ely, K. S., Wolfe, B. T., Dickman, L. T., Grossiord, C., et al. (2020). The response of stomatal conductance to seasonal drought in tropical forests. Glob. change Biol. 26, 823–839. doi:10.1111/gcb.14820
Wu, Y., Wang, Q., Wang, H., Wang, W., and Han, S. (2019). Shelterbelt poplar forests induced soil changes in deep soil profiles and climates contributed their inter-site variations in dryland regions, northeastern China. Front. Plant Sci. 10, 220. doi:10.3389/fpls.2019.00220
Xi, B., Clothier, B., Coleman, M., Duan, J., Hu, W., Li, D., et al. (2021). Irrigation management in poplar (Populus spp.) plantations: a review. For. Ecol. Manag. 494, 119330. doi:10.1016/j.foreco.2021.119330
Xia, J., Niu, S., and Wan, S. (2009). Response of ecosystem carbon exchange to warming and nitrogen addition during two hydrologically contrasting growing seasons in a temperate steppe. Glob. Change Biol. 15, 1544–1556. doi:10.1111/j.1365-2486.2008.01807.x
Xu, L., and Baldocchi, D. D. (2004). Seasonal variation in carbon dioxide exchange over a Mediterranean annual grassland in California. Agric. For. Meteorology 123, 79–96. doi:10.1016/j.agrformet.2003.10.004
Yan, J., Zhang, Y., Yu, G., Zhou, G., Zhang, L., Li, K., et al. (2013). Seasonal and inter-annual variations in net ecosystem exchange of two old-growth forests in southern China. Agric. For. Meteorology 182-183, 257–265. doi:10.1016/j.agrformet.2013.03.002
Yan, Y., Zhou, L., Zhou, G., Wang, Y., Song, J., Zhang, S., et al. (2023). Extreme temperature events reduced carbon uptake of a boreal forest ecosystem in Northeast China: evidence from an 11-year eddy covariance observation. Front. Plant Sci. 14, 1119670. doi:10.3389/fpls.2023.1119670
Keywords: CO2 fluxes, eddy covariance, environmental variables, poplar plantation, flux footprint size
Citation: Ge M, Wang W, Ruan H, Wang G, Zhang S and Yu S (2024) Dynamics of CO2 fluxes and environmental responses in a Poplar plantation. Front. Environ. Sci. 12:1443779. doi: 10.3389/fenvs.2024.1443779
Received: 04 June 2024; Accepted: 28 October 2024;
Published: 12 November 2024.
Edited by:
Xuguang Tang, Southwest University, ChinaReviewed by:
Yu Gong, Chinese Academy of Sciences (CAS), ChinaXuguang Tang, Hangzhou Normal University, China
Qian Zhang, Nanjing Tech University, China
Copyright © 2024 Ge, Wang, Ruan, Wang, Zhang and Yu. This is an open-access article distributed under the terms of the Creative Commons Attribution License (CC BY). The use, distribution or reproduction in other forums is permitted, provided the original author(s) and the copyright owner(s) are credited and that the original publication in this journal is cited, in accordance with accepted academic practice. No use, distribution or reproduction is permitted which does not comply with these terms.
*Correspondence: Mengyu Ge, bWVuZ3l1LmdlQGhlbHNpbmtpLmZp; Weifeng Wang, d2FuZy53ZWlmZW5nQG5qZnUuZWR1LmNu