 Kevin Postma1*†
 Siddhesh Mane2†
 Meicheng Shen3
 Maira Kussainova3,4Raikhan Beisenova3,5
 Arunav Nanda2,6Gang Dong3
 Jiquan Chen3
- 1Department of Entomology, Michigan State University, East Lansing, MI, United States
- 2Biosystems and Agricultural Engineering, Michigan State University, East Lansing, MI, United States
- 3Department of Geography, Environment, and Spatial Sciences, Michigan State University, East Lansing, MI, United States
- 4GIS and RS Center, Kazak National Agrarian Research University, Almaty, Kazakhstan
- 5Environmental Management and Engineering Department, L. N. Gumilyov Eurasian National University, East Lansing, Kazakhstan
- 6Civil and Environmental Engineering, Michigan State University, East Lansing, MI, United States
The relationship between precipitation and evapotranspiration (ET) is critical to understanding water cycle related dynamics in ecosystems, including crops. Existing studies of bioenergy crops have primarily focused on annual or seasonal ET rates, with less attention given to the immediate ET response following precipitation events. This study examines the variation in ET rates in the days subsequent to precipitation events across various bioenergy crops—corn, switchgrass, and prairies—utilizing 13 years (2010–2022) of growing season data. Meteorological and eddy covariance flux data were collected from seven eddy covariance flux towers as part of the GLBRC scale-up experiment at the Kellogg Biological Station Long Term Ecological Research sites. The analysis revealed that average ET peaked the day after precipitation and declined linearly over the following days, with a statistically significant relationship (p-value = 0.00027, R2 = 0.96). Neither the type of biofuel vegetation nor the historical land use significantly influenced ET post-precipitation events (p-values = 0.53 and 0.153, respectively). Key predictors of ET following precipitation events include shortwave radiation, season, day of the year, ambient temperature, vapor pressure deficit (VPD), long-wave radiation, precipitation amount, soil moisture, and annual variability. These findings enhance our comprehension of ET responses in bioenergy crop systems, with implications for water management in sustainable agriculture.
1 Introduction
Precipitation provides water sources needed for evapotranspiration (ET), which is the combined process of evaporation and plant transpiration (Thornthwait, 1948). Plant stomata facilitate the uptake of carbon dioxide for photosynthesis, whereas water is lost through these same pores by transpiration. Because of this, the amount of water lost by ET is strongly correlated to the gross primary production of crop. As for the evaporation portion of ET, several microclimatic variables are responsible, including net radiation, temperature, vapor pressure deficit (VPD), and soil moisture (Chen, 2021). The aboveground biomass of corn stover, switchgrass, and prairies can be used as feedstock for cellulosic ethanol to replace ethanol made from corn kernels. Although this process is technologically feasible, it is not yet economically viable, and there are no current commercial production facilities in the United States (U.S. Congress, 2007). Major challenges include the pretreatment process of breaking down the lignocellulosic complex to separate digestible carbohydrates from lignin and engineering microorganisms for the fermentation process that can ferment multiple types of sugar and withstand high ethanol concentrations (Broda et al., 2022). As cellulosic ethanol technology improves, or commercial applications for lignocellulosic biomass develop, bioenergy perennial crops such as prairies and switchgrass may replace corn due to their low input requirements and ability to be planted on marginal lands. A potential shift from corn to perennial crops has raised concerns regarding its impact on the hydrologic cycle because of the high biomass productivity of perennial crops (Cibin et al., 2016), as well as altered microclimate conditions (Chen et al., 2024). Bioenergy crop cultivation has been identified as a means to remove carbon dioxide from the atmosphere, and its biophysical impact is important to understanding its mitigation potential (Wang et al., 2021).
In the hydrologic cycle, precipitation moistens the soil. Evaporation and transpiration return much of this water to the atmosphere. Previous studies have investigated the annual or seasonal ET rates across various crops to understand ET’s influence on bioenergy crop productivity (Abraha et al., 2015; Abraha et al., 2020; Hamilton et al., 2015). Abraha et al. (2020) analyzed 9 years of eddy covariance data and found that the perennial bioenergy crops used 4%–7% less water annually than corn in the fields that were historically used for conventional row-crop agriculture. During the growing season, the perennial crops had similar ET rates as corn, but during the non-growing season, they used 14%–15% less water due to the cover provided by the grass residues. Perennial bioenergy crops grown in fields with higher soil organic matter due to prior enrollment in the Conservation Reserve Program (CRP) had similar annual ET rates but used 5%–9% more water during the growing season and 11%–12% less water during the non-growing season.
The mechanisms driving these seasonal differences in water use and loss, particularly in relation to the dynamic interactions between ET and precipitation, remain unclear at finer temporal scales. Given the increasing variability of precipitation patterns due to climate change, it is crucial to understand how these changes impact ET processes in bioenergy crops over short-time periods. This knowledge gap is particularly evident in how bioenergy crops respond to intermittent and heavy precipitation events, which are becoming more frequent.
To fill this knowledge gap, the variations in ET rates during the 7 days following precipitation events are investigated in this study. Specifically, the aim of this study was to address the following research questions:
• How do ET rates of bioenergy crops respond to precipitation events at a fine temporal scale?
• What are the impacts of climatic factors, bioenergy crop types, and land-use history on ET following precipitation events?
• What is the temporal variability of ET in rain-fed biofuel crops?
We hypothesize that land-use history will influence the immediate ET response to growing season precipitation events. ET rates will be similar in fields with a history of conventional agriculture and higher for perennial biofuel crops than for corn when grown in former CRP fields. Additionally, the intensity of precipitation events may play a significant role in determining the ET dynamics onward, albeit that the importance of a specific biophysical variable may vary by the crop type.
2 Materials and methods
2.1 Study site
The study was conducted at the W. K. Kellogg Biological Station (KBS) agricultural research farm located in southwest Michigan, between Kalamazoo and Battle Creek, Michigan (N 42° 24 18.761, W 85° 24 4.468). The region has a humid, continental temperate climate with a mean annual air temperature of 9.3°C and a temperature range spanning from a minimum of −22.6°C to a maximum of 38.6°C. The site has a mean total annual mean precipitation of 1,027 mm. The sandy-loam soils are typically Hapludalfs and were formed on a glacial outwash with loess intrusions. The study area was previously described by Zenone et al. (2011), Abraha et al. (2015), and Bhardwaj et al. (2011).
The six fields include two cornfields (US-KL1 and US-KM1), two switchgrass monocultures (US-KL2 and US-KM2), and two restored prairies (US-KL3 and US-KM3), and the reference farm is grown with smooth bromegrass US-KM4 (Figure 1). The cornfields, switchgrass fields, and restored prairies fields were planted in 2010 following a year of vegetation destruction using two glyphosate (N-(phosphonomethyl)glycine treatments; Syngenta, Greensboro, NC, United States) at 2.9 kg ha−1 and a 2009 crop of no-till glyphosate-tolerant soybeans (Glycine max L.). The Lux Arbor Reserve corn, switchgrass, and restored prairie fields have a land-use history of corn–soybean rotations for over 50 years before 2009. The Marshall Farms set of corn, switchgrass, and restored prairie fields were managed as Conservation Reserve Program (CRP) land for 22 years before planting. The biomass from the switchgrass and restored prairies is harvested in November following senescence for cellulosic ethanol production. The cornfields are planted in early May, and since 2015, when harvested in the late fall, approximately 80% of the stover has been removed annually.
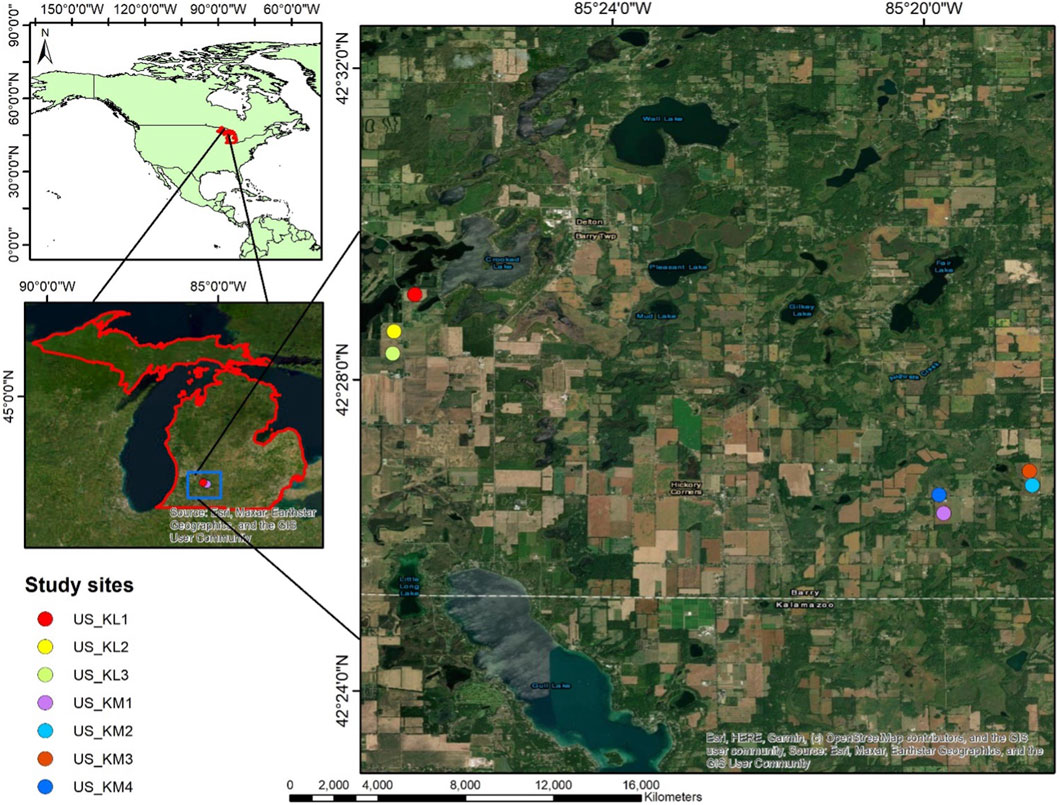
Figure 1. Locations of eddy covariance towers at W. K. Biological Field Station. US_KL1, US_KL2, and US_KL3 monitor the bioenergy crops corn, switchgrass, and restored prairie, respectively, and were planted in fields with a conventional agricultural land history. US_KM1, US_KM2, and US_KM3 monitor the bioenergy crops corn, switchgrass, and restored prairie, respectively, and were planted on lands that were formerly enrolled in the Conservation Reserve Program (CRP). Data from US_KM4 were not used for this study because they serve as a reference field.
2.2 Data collection and processing
2.2.1 Data source
The meteorological data used for this study were collected from the six experimental sites in the KBS agricultural research farm, each equipped with an eddy covariance tower. These towers provided continuous flux measurement for the fields described in Section 2.1 over a 13-year period from 2010 through 2022. Precipitation data were obtained from the KBS Long-Term Ecological Research (LTER) meteorological station, located at approximately 4 km from the nearest field (https://lter.kbs.msu.edu/datatables/247). This station, equipped with a NOAH IV weighing bucket gauge, has been recording precipitation data since 1988. Whereas these data have revealed the annual and seasonal water use by switchgrass and restored prairies (Abraha et al., 2015; Abraha et al., 2020), in this study, we narrow the focus to ET response in the week following growing season precipitation events.
2.2.2 Eddy covariance measurements
Since 2009, all six study fields (Figure 1) were individually monitored using open-path eddy covariance (EC) systems and meteorological instruments. Each EC system was equipped with LI-7500 infrared gas analyzers (IRGAs) from LI-COR Biosciences (Lincoln, NE, United States) paired with CSAT3 three-dimensional sonic anemometers from Campbell Scientific Inc. (Logan, UT, United States), sampling at a frequency of 10 Hz. The LI-7500 analyzers were calibrated every 4–6 months. The EC systems were in the center of each field at a height of 1.5–2.0 m above the canopy, with the anemometers oriented toward the prevailing wind direction, ensuring a minimum fetch of 150 m. Soil moisture was measured in the upper 0.3 m of the soil profile using a vertically inserted Campbell CS615 time domain reflectometry (TDR) probe. Soil moisture probes were placed at this level because most roots are found at this depth, so moisture changes at this level best indicate changes due to evaporation and transpiration.
The EC systems measured the total evaporative water flux, also known as evapotranspiration (ET). Raw half-hourly latent energy (LE) values were converted to ET values. Data with negative LE values and those exceeding 700 W/m2 were marked as not available (NA). To address data gaps, the average of daily values was used. Data processing and analysis were conducted using EddyPro 7 software (LI-COR Biosciences), which involved several steps: replacing data spikes with linear interpolation, correcting the time lag between water vapor and anemometer measurements, applying sector-wise planar fit method for axis rotation to correct anemometer tilt (Wilczak et al., 2001), block averaging for raw time series detrending, correcting sonic temperature for air pressure and humidity (Schotanus et al., 1983), adjusting water vapor fluxes for frequency response (Moore et al., 1991), and accounting for air density fluctuations (Webb et al., 1980).
2.2.3 Categorization of precipitation events
The primary focus of this study is to examine how ET varies in bioenergy crops in the days following precipitation events of varying intensity and across different seasons. To achieve this, daily precipitation data from 2010 through 2022 were collected from the KBS LTER meteorological station. The data analysis was conducted using R statistical software (V2023.06.1 + 524; Posit software, PBC).
Before analysis, the daily precipitation data were confined to events occurring between April 1st and October 31st to focus on the active growing periods. Precipitation events were further categorized by season: those occurring between April 1st and June 21st were characterized as “spring,” events between June 22nd and September 21st as “summer,” and events between September 22nd and October 31st as “fall.” If a precipitation event overlapped seasons, it was grouped in the category where most of its first three post-precipitation days occurred. The first 3 days tended to have the highest rates of ET following a precipitation event. Consecutive days of precipitation were aggregated and treated as a single precipitation event, with the initial day of each aggregated event designated as “day zero.” A minimum of three consecutive dry days was required to distinguish between separate precipitation events. Events lacking sufficient data were excluded, resulting in 839 analyzable precipitation events during 2010–2022.
The daily precipitation data, spanning from 1988 to 31 December 2023, were utilized to construct a probability density function (PDF), which visualizes the distribution of precipitation intensities across the study area. This PDF revealed that daily precipitation heavily skewed toward lower values, with most days experiencing light rainfall. Based on the observed distribution of precipitation intensities, we classified precipitation events into three categories for detailed analysis. These categories were defined to reflect natural breaks in the data, enabling a more structured analysis of precipitation patterns and their potential impacts on other study variables. The classification is as follows:
• Light intensity: precipitation events of less than 5 mm were categorized as “light intensity,” and there were 277 light precipitation events, comprising 33% of the total precipitation events over the study period.
• Moderate intensity: precipitation events between 5 mm and 15 mm were categorized as “moderate intensity,” and there were 220 moderate precipitation intensity events, comprising 26% of the total events.
• Heavy intensity: precipitation events greater than 15 mm were categorized as “heavy intensity,” and there were 342 heavy precipitation intensity events, comprising 41% of the total events.
Additionally, any precipitation events that occurred with less than a 3-day, rain-free period prior to a subsequent precipitation event were excluded from the analysis to ensure that only isolated precipitation events were considered, thereby maintaining the integrity of the evapotranspiration data associated with each categorized event.
2.2.4 Calculation of relative evapotranspiration (ET)
To normalize the data and ensure comparability across different precipitation events, relative ET was calculated using the daily ET values recorded after each precipitation event. Day zero was defined as the day of precipitation or the day when precipitation stopped. The relative ET for each day following a precipitation event was determined using the following formula:
This method compares each post-precipitation day’s average daily ET to the ET of the day of precipitation (Day 0 ET). By expressing ET as a ratio relative to the ET on the day of the precipitation event, we normalized the data, allowing for consistent analysis across different events and conditions. All precipitation events and their corresponding ET were converted into relative ET.
2.3 Statistical analysis
The dynamics of relative ET were compared in all growing seasons, by vegetation, and by a field’s land-use history before the establishment of the current bioenergy crop. In this study, the analysis was confined to 1 week following a precipitation event. This was because few precipitation events had a precipitation-free time span extending beyond a 7-day interval before a subsequent precipitation event. To quantify trends in relative evapotranspiration (ET) following precipitation events, linear regression analysis was utilized. Analysis of variance (ANOVA) was utilized to determine if any groups within seasonal categories, bioenergy crops, land-use history, and precipitation intensity categories were significantly different from other groups. Tukey’s honest significant difference (HSD) post hoc test was used to assess the significance of each of the groups from the other groups. A linear mix-effects model was used to statistically model the relative contributions that determine relative ET following precipitation events. All analyses were performed using [R studio], with a significance level of p-value <0.05.
3 Results
3.1 Dynamics of relative ET following precipitation events
From 2010 to 2022, 839 precipitation events during the growing season were identified, and relative ET was estimated as described in the methods Section 2.2.4. This section reports the significance of relative ET in relation to precipitation events and examines changes in the ET over 7 days following precipitation events. Additionally, it includes the impacts on ET of the growing seasons, types of bioenergy crop grown, and field land-use history before establishment of the current bioenergy crop.
A linear decrease in daily average relative ET over the 7 days following precipitation events in bioenergy crops was detected (Figure 2), revealing a significant decrease in ET over time (p-value = 0.0003) based on data collected from 2010 to 2022. Each data point represents the average relative ET for that post precipitation day, aggregated from various bioenergy crops, highlighting the overall trend and variability in ET response to precipitation. A decline is shown from the first day’s relative ET of 0.245 to the seventh day’s relative ET of 0.158, with a high correlation coefficient of determination (R2 value = 0.96), indicating that a decrease in ET decreases as the days following a precipitation event increase. Relative ET, however, exhibits high variability following precipitation events (Figure 3). The most extreme outlier was observed on day 2, when temperature played a significant role (p-value = 8.4e−15) on the variability of relative ET. The outlier on day 2 corresponds to a precipitation event on 15 April 2010, when the temperature increased from 9.2°C on the day of the precipitation event to 21.0°C by post-precipitation day 2. This substantial temperature increase caused relative ET’s increase, which then gradually decreased with decreasing temperatures over the next 2 days (Figure 4).
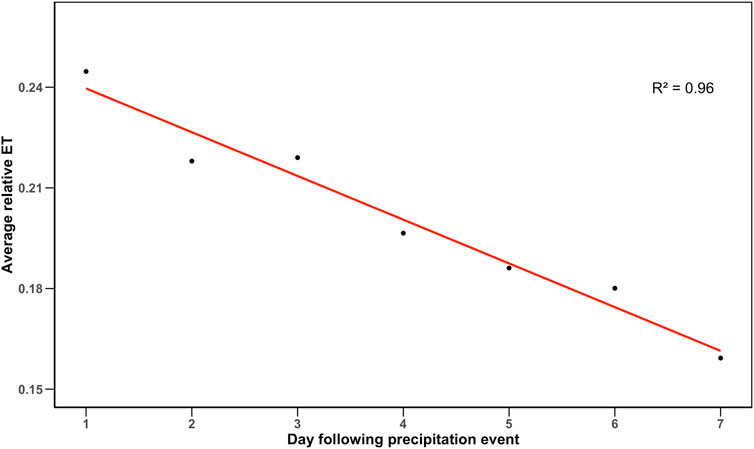
Figure 2. Average relative evapotranspiration (ET) decreases linearly in the days following a precipitation event, as illustrated by the red trend line (R2 = 0.96). Relative ET was calculated relative to the ET rate of the crop on the day of the precipitation event. This average includes all precipitation events from the corn, switchgrass, and restored prairie fields from 2010 through 2022.
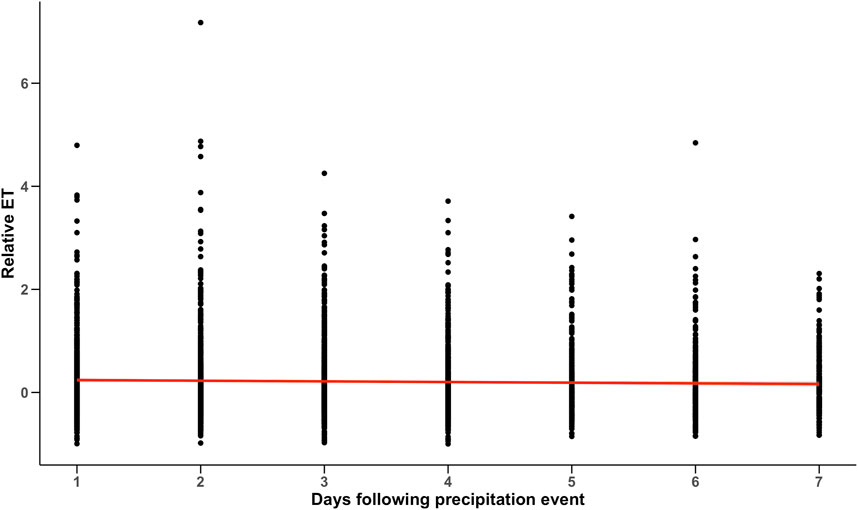
Figure 3. Scatterplot of relative evapotranspiration (ET) values for the days following a precipitation event reveals ET to be highly variable during the week following precipitation events in bioenergy crops (2010–2022). The red line indicates the linear relationship between relative ET and days after precipitation events.
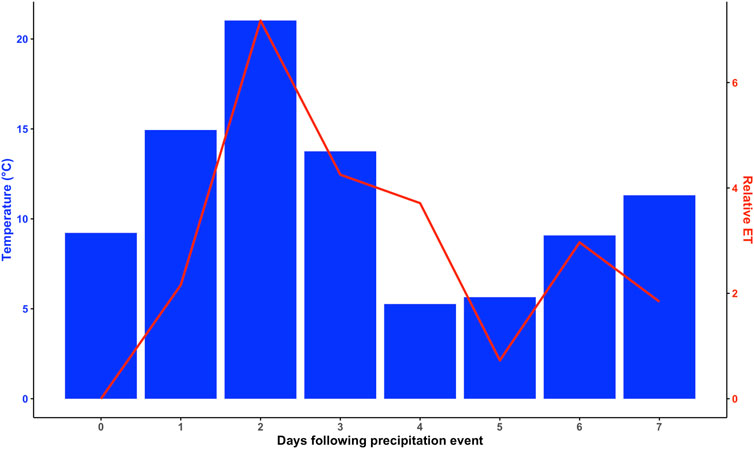
Figure 4. Temperature and evapotranspiration plotted for the most extreme relative ET event observed on 15 April 2010. The blue bars represent temperature (°C) for each day following the precipitation event, while the red line shows the corresponding relative ET.
3.2 Influencing factors on relative ET
Relative ET declines following precipitation events. To understand how meteorological conditions, crop-specific characteristics, and land-use history may affect ET following precipitation, a regression analysis and analysis of variance (ANOVA) followed by Tukey’s honest significant difference (HSD) post hoc test were employed to determine the parameters that significantly influence ET (Table 1).
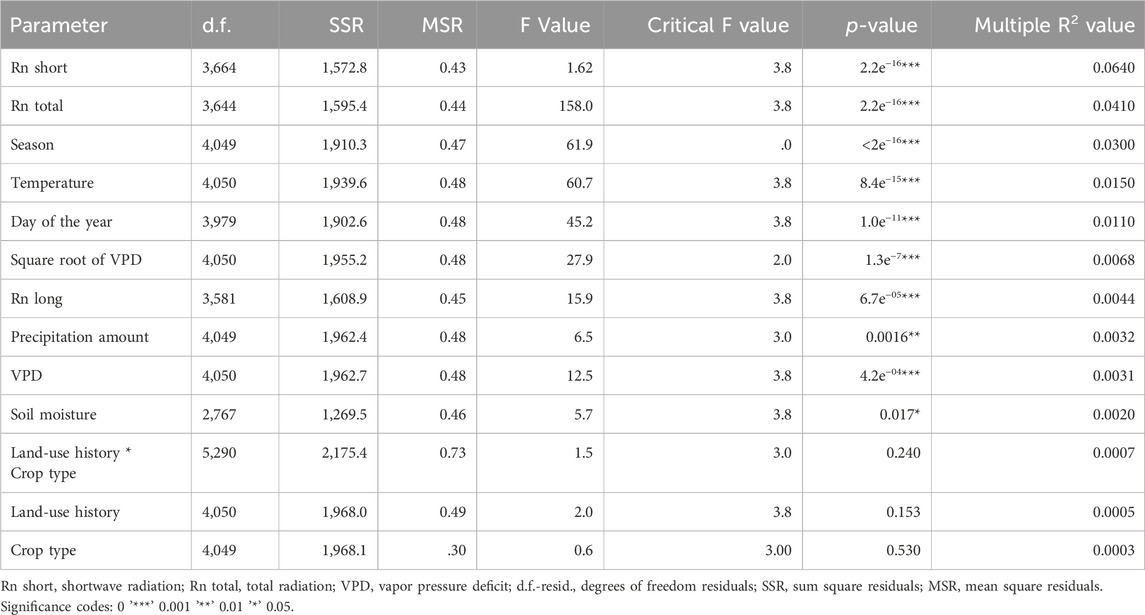
Table 1. Regression analysis and analysis of variance (ANOVA) results showing the impact of meteorological conditions, crop vegetation type, and land-use history on relative ET.
The microclimatic conditions that influence ET following a precipitation event are illustrated in Table 1. Shortwave radiation (Rn short), total radiation (Rn total), and season are the most significant climatic parameters that best explain relative ET with respective R2 values of 0.064, 0.041, and 0.030, respectively. Other parameters that have a significant impact on relative ET include ambient temperature, the day of the year, the square root of the vapor pressure differential (VPD), longwave radiation (Rn long), precipitation amount, VPD, and soil moisture (R2 values = 0.015, 0.011, 0.0068, 0.0044, 0.0032, 0.0031, and 0.0020, respectively). Surprisingly, land-use history and crop type (Figure 5) were not found to be significant parameters (p values = 0.153 and 0.53, respectively), nor was the interaction between land-use history and vegetation (p-value = 0.24).
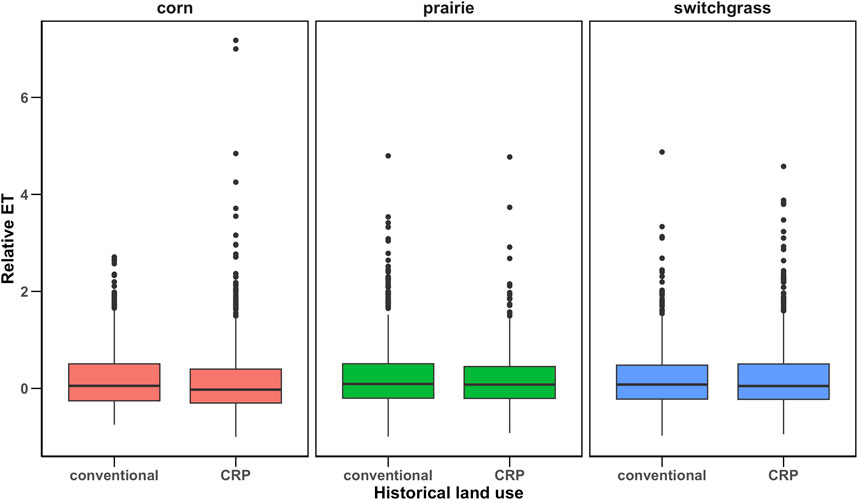
Figure 5. Relative evapotranspiration (ET) of bioenergy crops: corn, switchgrass, and restored prairie grown in fields historically used for conventional row cropping compared to fields enrolled in the Conservation Reserve Program (CRP). The middle line within the boxes (red, green, and blue) represents the median value of relative ET for each category. The analysis indicates that there is no statistically significant difference in relative ET across different crop types or historical land-use types in the days following a precipitation event, as indicated by the overlap in the interquartile ranges of the box plots.
A linear mixed-effects model fit using restricted maximum likelihood (REML) with t-tests using Satterthwaite’s method was used to determine the best predictive model for explaining the change in relative ET following a precipitation event. This model explains 34.8% of the relative ET for bioenergy crops (marginal R2 value = 0.176 and conditional R2 value = 0.348) and included Rn short, seasons, ambient temperature, square root of VPD, Rn long, precipitation intensity, and soil moisture as fixed variables, with year as a random variable and day of the year nested into seasons. This model had an Akaike Information Criterion (AIC) value of 4,765.5. Changing the relationship between Rn short and temperature to interactive from additive improved the explanatory power of the model (marginal R2 value = 0.181 and conditional R2 value = 0.350), but this increased its AIC score to 4,769.7, indicating overfitting.
Season significantly influenced relative ET (R2 value = 0.030) of the post-precipitation day. To determine each season’s effect on relative ET, 839 individual events were differentiated into three seasons: spring, summer, and fall. Fall’s relative ET was significantly lower than that of other seasons (Figure 6), with a mean difference of −0.34 when compared to spring (p-value = 0.0000) and with a mean difference of −0.33 when compared to summer (p-value = 0.0000). As the days of the year progressed, a decrement in relative ET was observed, with a change rate of −0.0013 compared to the intercept. The “day of the year” as a parameter accounted for less than 1% of the variance in relative ET changes, with a p-value of 2.0e−11 and a multiple R2 value of 0.011. Day of the year was nested under season for generating a model for ET following precipitation events.

Figure 6. Combined mean relative evapotranspiration (ET) of the bioenergy crops: corn, switchgrass, and restored prairie during the growing seasons (2010–2022). This figure demonstrates seasonal variations in relative ET, with the fall season showing significantly lower relative ET than spring and summer (R2 value = 0.030), with mean differences of −0.34 and −0.33, respectively, for all post-precipitation events. The middle line in the boxes represents the median relative ET value for each season. This figure highlights seasonal variations in relative ET, with the red box representing spring, the green box representing summer, and the blue box representing fall.
An ANOVA of precipitation intensity revealed that moderate precipitation (5 mm and 15 mm) significantly influenced relative ET, more than both the heavier (>15 mm) and lighter (<5 mm) precipitation. Although the differences in relative ET among the precipitation categories were statistically significant, they were exceedingly small, as shown in Figure 7. On comparing moderate to light precipitation, there was a mean difference of −0.077 (p-value = 0.021), suggesting that ET is not linearly related to the precipitation volume. Instead, ET appears to be influenced by a specific range of precipitation conditions. In comparison to heavier precipitation, the mean difference was even more pronounced at −0.095 (p-value = 0.0013). However, no significant difference was observed between the ET effects of lighter precipitation and heavier precipitation (p-value = 0.77), with a mean difference of −0.018. These statistical insights were obtained through Tukey’s multiple comparisons test after an ANOVA, which yielded an R2 value of 0.0031, indicating that the precipitation amount alone accounts for minimal variability in relative ET.
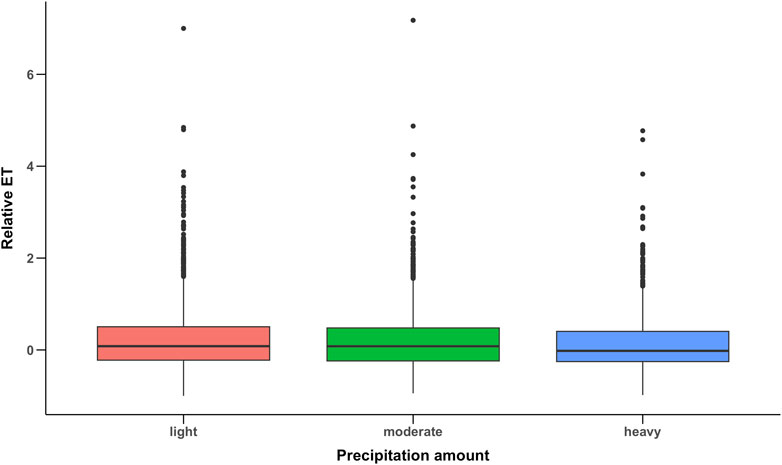
Figure 7. Relative evapotranspiration (ET) of bioenergy crops: corn, switchgrass, and restored prairie following precipitation events of varying intensities. Although moderate precipitation is significantly higher than light and heavy precipitation (R2 value = 0.0032), the mean differences were only −0.077 and −0.095, respectively. The middle line in the boxes represents the median relative ET value for each precipitation amount. This figure highlights seasonal variations in relative ET, with the red box representing spring, the green box representing summer, and the blue box representing fall.
The ANOVA of vegetation type revealed that the type of bioenergy crop grown did not significantly influence relative evapotranspiration (ET) during the days following a precipitation event, with a p-value of 0.53. Additionally, the mean precipitation amounts and the absolute mean ET values for the 13 years of the study period for each bioenergy were plotted to demonstrate similarity in the long-term flux patterns of the bioenergy crops (Figure 8). The ANOVA on historical land use revealed that planting bioenergy crops in former conservation reserve land or in land that was used to raise row crops conventionally had no significant impact on relative ET following precipitation events (p-value = 0.153). An ANOVA of the interaction between vegetation type and historical land use was found not to be of significance (p-value = 0.24). Neither the bioenergy crop nor historical land use significantly impacted relative ET (Figure 5).
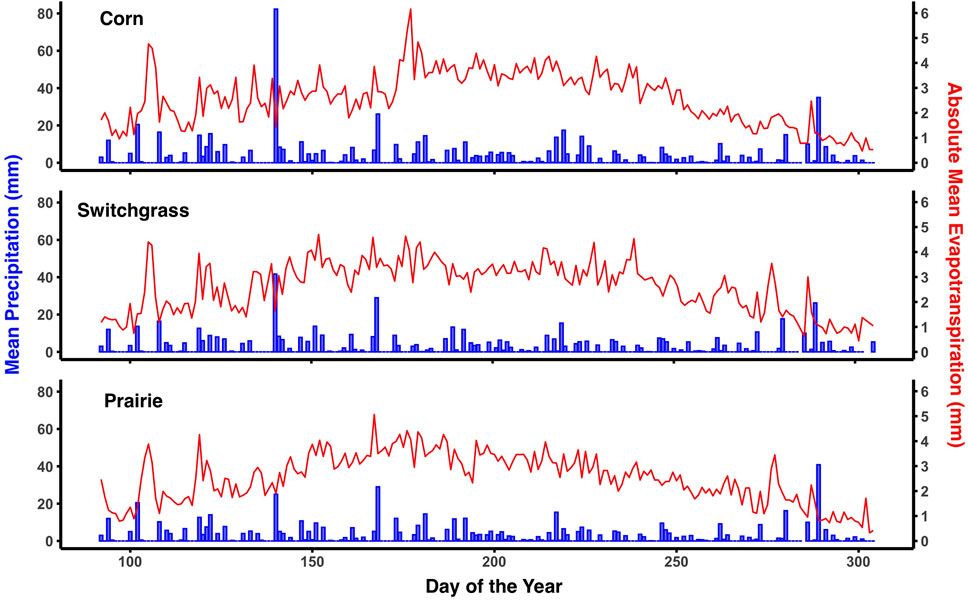
Figure 8. Absolute mean evapotranspiration (mm) and mean precipitation (mm) of the day of the year for the bioenergy crops: corn, switchgrass, and restored prairie (2010–2022). In each subplot, blue bars represent mean precipitation, while the red line indicates absolute mean evapotranspiration (ET).
4 Discussions
4.1 Exploring the dynamics of relative ET following precipitation events
The dynamics of relative ET following precipitation events, as detailed in Section 3.1, provide insights into the water dynamics of rain-fed, bioenergy crops. The observed decline in average relative ET following a precipitation event (Figure 2) indicates that ET is highest immediately after a precipitation event, with a gradual, linear decrease in the following days. This pattern aligns with the findings of He et al. (2017), who analyzed global responses of ecosystem ET to precipitation deficits and observed similar trends in ET behavior across diverse climatic regions. Notably, the second and third post-precipitation days exhibit minimal changes in relative ET, suggesting a temporary equilibrium in soil moisture and plant water uptake. As days progress, ET continues to decline, reflecting less soil water availability for evaporation and transpiration (Xu et al., 2012).
The analysis of the temporal variability in relative evapotranspiration (ET) does not reveal a distinct pattern in the first seven post-precipitation days, as illustrated in Figure 3. The observed decrease in variability on day seven might suggest that the vegetation is adjusting to decreasing moisture conditions, as depicted in Figure 9. This observation aligns with findings by Eagleman and Decker (1965), who noted that evapotranspiration rates decline as soil water decreases. The current study did not extend the analysis beyond the first 7 days, primarily because very few precipitation events were followed by extended dry periods. Future studies could benefit from employing eddy covariance data to explore the extended intervals between precipitation events further. It is also crucial to conduct a similar study in relation to different crop locations and weather conditions.
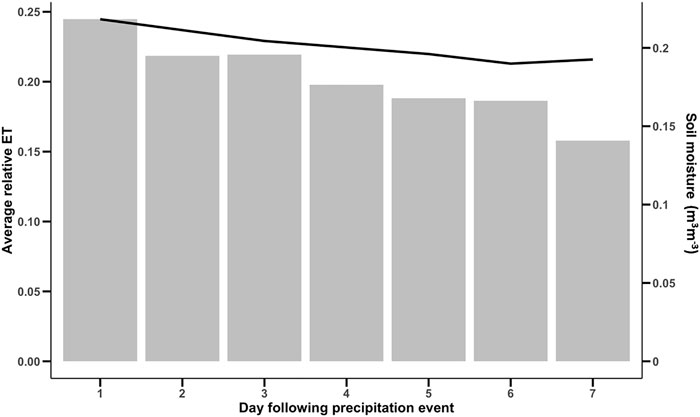
Figure 9. Average relative evapotranspiration (ET) of all post-precipitation events from bioenergy crops: corn, switchgrass, and restored prairie. The gray bars represent average relative ET across the 7 days following precipitation events, while the black line shows the corresponding soil moisture (m3m−3). ET is significantly correlated with soil moisture, however, the R2 value is only 0.0020.
4.2 Interpreting the analysis of influencing factors on ET
Regression analysis and ANOVA were used to examine how meteorological conditions, vegetation type, and land-use history collectively impact relative ET following precipitation events. This analysis identifies the key drivers of relative ET variability. Rn short, Rn total, and season have the greatest influence on ET, whereas other factors such as temperature, day of the year, VPD and the square root of VPD, Rn long, amount of precipitation, and soil moisture play significant but less important roles. In bioenergy crop canopies that are weakly coupled with the bulk atmosphere, ET moistens the air and reduces the VPD that drives ET in taller, strongly coupled canopies, such as forests or orchards. Waring and Running (2007) and Akuraju et al. (2017) emphasize the pivotal role of net radiation as the dominant driver of ET in short, weakly coupled canopies. In this study, we support and extend these findings by demonstrating that Rn short plays a more significant role in influencing relative ET than total or net radiation, with R2 values of 0.064 and 0.0461, respectively. This is because when Rn short is absorbed by the leaf and turned into heat, the warmer temperature increases the amount of water molecules in the stomata pore, which is at 100% relative humidity. This increase in water vapor concentration drives the diffusion of water from the stomata, increasing ET with increasing Rn short. The season of the year was the third most influential factor on ET (R2 value = 0.030). Whereas temperature is the fourth in importance as a driver of ET (R2 value = 0.015), a temperature swing was the cause of the most extreme outlier that occurred on post-precipitation day 2 (Figure 3). Extreme temperature events drove multiday ET swings that peaked on each of this day (Figure 4).
This study found that vegetation type and historical land use did not significantly affect relative ET following precipitation events, contrasting findings observed by Abraha et al. (2020), who utilized the same dataset. Their analysis revealed that perennial vegetation cultivated on land with a history of conventional agriculture exhibited 4%–10% lower ET rates during the growing season than those planted on former CRP fields. This was attributed to the better soil health of the CRP fields, which have a lower soil bulk density, higher contents of soil carbon (C) and nitrogen (N), and greater pools of labile soil carbon (Abraha et al., 2015; 2018). The enhanced soil conditions in CRP fields facilitated the development of larger canopies in perennial crops, which led to increased ET rates during the growing season. In contrast, corn showed similar ET rates across different land-use histories, likely because the use of fertilizer compensated for differences in soil organic matter. This difference in finding between studies is plausibly due to the smaller time window consisting of the 7 days following a precipitation event used by this study. Organic matter is an important determinant of the average water-holding capacity (Hudson, 1994), and its greater abundance in the CRP field may play a more significant role as the days between precipitation events increase. Our findings across different vegetation types and land-use histories suggest a general uniformity on how these bioenergy crops respond to water availability in the week following a precipitation event.
4.3 Understanding seasonal and precipitation intensity effects on relative ET
4.3.1 Seasonal variations in relative ET
The findings of the study demonstrate that seasonal variations significantly impact the dynamics of relative ET (Méndez-Barroso et al., 2014; Villarreal et al., 2016; Williams et al., 2012) as fall begins a period of senescence for C4 grasses following seed production (Moore et al., 1991). The modest explanatory power (R2 value = 0.030) suggests that although seasonality significantly influences ET, it accounts for a small amount of the variability observed. This conclusion is supported by the “day of the year” analysis, which accounted for <1% of the variance in ET changes, underscoring the complexity of factors influencing ET beyond simple seasonal categorizations. This variability may also be impacted by lower temperatures during cooler months, which reduce the amount of water evaporated or transpired by plants, leading to decreased ET rates. Additionally, the presence of fully grown agricultural crops with complete canopy coverage during these months could help maintain soil moisture for longer periods than usual.
4.3.2 Impact of precipitation intensity on relative ET
The analysis of precipitation intensity reveals that precipitation events have a small but significant impact on ET (Villarreal et al., 2016; Williams et al., 2012; Xu et al., 2012). Moderate precipitation had small but significantly higher relative ET than both heavier and lighter precipitation levels. This observed pattern aligns with the findings of Villarreal et al. (2016) and Williams et al. (2012), showing a nonlinear relationship between precipitation volume and ET, where ET peaks at moderate precipitation levels and decreases with heavier precipitation. Light precipitation may not sufficiently saturate the soil. Following precipitation events, both soil moisture and relative ET decrease (Figure 9). A logical extension is that light precipitation events led to less soil moisture, limiting ET. Heavy precipitation may lead to saturated soil conditions that cause anaerobic soil. When corn roots lack oxygen, the nutrient update is slowed, and root tips begin to die. Anaerobic soil conditions also increase denitrification, leading to lower levels of mineralized nitrogen, which negatively affects plant growth (Abendroth et al., 2011). In the northeast part of the United States, switchgrass is best adapted to shallow, dry soils (Vandevender, 2024), perhaps because like corn, it too is affected by saturated soil conditions. The prairie field community includes switchgrass, so its relative ET would also likely decrease under saturated soil conditions. The low R2 value (0.00275) from these comparisons indicates that although significant, precipitation intensity explains only a small fraction of the variability in ET.
4.4 Implications for bioenergy crop management and water-use efficiency
The potential expansion of perennial biofuel crops such as switchgrass and restored prairies to meet increasing biofuel demand necessitates applying our understanding of corn’s water-use efficiency to the management of these perennial crops. Research indicates that in the immediate aftermath of precipitation events, the evapotranspiration (ET) rates of switchgrass and restored prairies do not significantly differ from that of corn, regardless of the land-use history (Hoover et al., 2023). When considering the entire growing season, the water-use efficiency of perennial crops on upland soils with a history of conventional row crop farming is comparable to that of corn. However, on lands that were previously part of the Conservation Reserve Program (CRP) or with high soil organic matter content, perennial crops may consume 5%–9% more water than corn.
The non-growing season presents a different scenario. Perennial crops, with their increased grass residue cover, demonstrate reduced evaporation compared to corn fields. This retained water can be partially stored in the soil, depending on soil texture, and becomes available for plant transpiration in the subsequent growing season (Weil et al., 2022). This could contribute to more efficient overall water use. This characteristic of perennial crops could prove advantageous in water-limited environments or during drought conditions.
Future research should focus on long-term studies to better understand how these water-use patterns evolve over multiple growing seasons and under various climate scenarios. Additionally, investigating the potential synergies between annual and perennial bioenergy crops in mixed cropping systems could lead to optimized water-use efficiency strategies for bioenergy production.
5 Conclusions
The study investigated the immediate response of evapotranspiration (ET) rates to precipitation events in common bioenergy crops, addressing a critical gap in the fine-scale understanding of ET dynamics. Relative ET was used to analyze ET during the 7-day period following growing season precipitation events in corn, switchgrass, and prairie fields grown for biofuel production. The findings indicated that average relative ET was highest the day following a precipitation event and gradually decreased linearly over subsequent days. The statistical analysis over 2010–2022 revealed the primary determinants of this decline include shortwave radiation, total radiation, and season. Furthermore, ambient temperature, day of the year, the square root of VPD, long wave radiation, precipitation amount, VPD, and soil moisture were all significant factors influencing ET patterns. Surprisingly, crop type and the land-use history before planting did not significantly impact relative ET following precipitation events. This indicates that the immediate ET response is more strongly governed by environmental and atmospheric conditions than by the specific characteristics of the bioenergy crops or their historical land use. These findings contribute to a deeper understanding of water cycle dynamics within bioenergy crops, especially in the context of sustainable agriculture and development of bioenergy crops.
Data availability statement
The original contributions presented in the study are included in the article/Supplementary Material; further inquiries can be directed to the corresponding author.
Author contributions
KP: conceptualization, data curation, formal analysis, investigation, methodology, project administration, software, supervision, validation, visualization, writing–original draft, and writing–review and editing. SM: conceptualization, data curation, formal analysis, investigation, project administration, supervision, validation, visualization, writing–original draft, and writing–review and editing. MS: data curation, investigation, and writing–review and editing. MK: data curation, investigation, and writing–review and editing. RB: writing–review and editing. AN: visualization and writing–review and editing. GD: investigation, project administration, software, writing–review and editing, and data curation. JC: funding acquisition, investigation, project administration, resources, software, supervision, validation, and writing–review and editing.
Funding
The author(s) declare that no financial support was received for the research, authorship, and/or publication of this article.
Acknowledgments
The authors thank Michael Abraha, who started this study at Kellogg Biological Station and began collecting eddy covariance data in 2009. The authors also acknowledge the Kellogg Biological Station LTER program. They acknowledge financial support from Michigan State University AgBioResearch and the US Department of Energy, Office of Science, Office of Biological and Environmental Research (Awards DE-SC0018409 and DE-FC02-07ER64494), by the National Science Foundation for the Long-term Ecological Research Program (DEB 1637653 and 1832042) the Kellogg Biological Research Station.
Conflict of interest
The authors declare that the research was conducted in the absence of any commercial or financial relationships that could be construed as a potential conflict of interest.
The reviewer MZH declared a shared affiliation with the authors KP, SM, MS, RB, AN, GD, and JC to the handling editor at the time of review.
Publisher’s note
All claims expressed in this article are solely those of the authors and do not necessarily represent those of their affiliated organizations, or those of the publisher, the editors, and the reviewers. Any product that may be evaluated in this article, or claim that may be made by its manufacturer, is not guaranteed or endorsed by the publisher.
Supplementary material
The Supplementary Material for this article can be found online at: https://www.frontiersin.org/articles/10.3389/fenvs.2024.1463852/full#supplementary-material
References
Abendroth, L. J., Elmore, R. W., Boyer, M. J., and Marley, S. K. (2011). Corn growth and development. Ames, Iowa: Iowa State University Extension.
Abraha, M., Chen, J., Chu, H., Zenone, T., John, R., Su, Y.-J., et al. (2015). Evapotranspiration of annual and perennial biofuel crops in a variable climate. GCB Bioenergy 7, 1344–1356. doi:10.1111/gcbb.12239
Abraha, M., Chen, J., Hamilton, S. K., and Robertson, G. P. (2020). Long-term evapotranspiration rates for rainfed corn versus perennial bioenergy crops in a mesic landscape. Hydrol. Process. 34, 810–822. doi:10.1002/hyp.13630
Abraha, M., Gelfand, I., Hamilton, S. K., Chen, J., and Robertson, G. P. (2018). Legacy effects of land use on soil nitrous oxide emissions in annual crop and perennial grassland ecosystems. Ecol. Appl. 28 (5), 1362–1369. doi:10.1002/eap.1745
Akuraju, V. R., Ryu, D., George, B., Ryu, Y., and Dassanayake, K. (2017). Seasonal and inter-annual variability of soil moisture stress function in dryland wheat field, Australia. Agric. For. Meteorology 232, 489–499. doi:10.1016/j.agrformet.2016.10.007
Bhardwaj, A. K., Zenone, T., Jasrotia, P., Robertson, G. P., Chen, J., and Hamilton, S. K. (2011). Water and energy footprints of bioenergy crop production on marginal lands. GCB Bioenergy 3, 208–222. doi:10.1111/j.1757-1707.2010.01074.x
Broda, M., Yelle, D. J., and Serwańska, K. (2022). Bioethanol production from lignocellulosic biomass-challenges and solutions. Molecules 27(24).
Chen, J. (2021). Biophysical models and applications in ecosystem analysis. East Lansing, Michigan: Michigan State University Press.
Chen, J., Paw U, K. T., North, M., and Franklin, J. F. (2024). The contributions of microclimatic information in advancing ecosystem science. Agric. For. Meteorology 355, 110105. doi:10.1016/j.agrformet.2024.110105
Cibin, R., Trybula, E., Chaubey, I., Brouder, S. M., and Volenec, J. J. (2016). Watershed-scale impacts of bioenergy crops on hydrology and water quality using improved SWAT model. GCB Bioenergy 8, 837–848. doi:10.1111/gcbb.12307
Eagleman, J. R., and Decker, W. L. (1965). The role of soil moisture in evapotranspiration. Agron. J. 57, 626–629. doi:10.2134/agronj1965.00021962005700060033x
Hamilton, S. K., Hussain, M. Z., Bhardwaj, A. K., Basso, B., and Robertson, G. P. (2015). Comparative water use by maize, perennial crops, restored prairie, and poplar trees in the US midwest. Environ. Res. Lett. 10, 064015. doi:10.1088/1748-9326/10/6/064015
He, B., Wang, H., Guo, L., and Liu, J. (2017). Global analysis of ecosystem evapotranspiration response to precipitation deficits. J. Geophys. Res. Atmos. 122 (13), 318. doi:10.1002/2017jd027817
Hoover, D. L., Abendroth, L. J., Browning, D. M., Saha, A., Snyder, K., Wagle, P., et al. (2023). Indicators of water use efficiency across diverse agroecosystems and spatiotemporal scales. Sci. Total Environ. 864, 160992. doi:10.1016/j.scitotenv.2022.160992
Hudson, B. D. (1994). Soil organic matter and available water capacity. J. Soil Water Conservation 49, 189–194.
Méndez-Barroso, L. A., Vivoni, E. R., Robles-Morua, A., Mascaro, G., Yépez, E. A., Rodríguez, J. C., et al. (2014). A modeling approach reveals differences in evapotranspiration and its partitioning in two semiarid ecosystems in northwest Mexico. Water Resour. Res. 50, 3229–3252. doi:10.1002/2013wr014838
Moore, K. J., Moser, L. E., Vogel, K. P., Waller, S. S., Johnson, B. E., and Pedersen, J. F. (1991). Describing and quantifying growth stages of perennial forage grasses. Agron. J. 83, 1073–1077. doi:10.2134/agronj1991.00021962008300060027x
Schotanus, P., Nieuwstadt, F. T. M., and De Bruin, H. A. R. (1983). Temperature measurement with a sonic anemometer and its application to heat and moisture fluxes. Boundary-Layer Meteorol. 26, 81–93. doi:10.1007/bf00164332
Thornthwaite, C. W. (1948). An approach toward a rational classification of climate. Geogr. Rev. 38, 55–94. doi:10.2307/210739
US Congress (2007). Energy independence and security act of 2007. Available at: https://gpo.gov/fdsys/pkg/BILLS-110hr6enr/pdf/BILLS-110hr6enr.pdf (Accessed May 19, 2024).
Vandevender, J. (2024). Switchgrass planting guide. Alderson, West Virginia: U.S. Department of Agriculture (USDA) Natural Resources Conservation Service. Available at: https://www.nrcs.usda.gov/plantmaterials/wvpmcpg7033.pdf (Accessed June 20, 2024).
Villarreal, S., Vargas, R., Yepez, E. A., Acosta, J. S., Castro, A., Escoto-Rodriguez, M., et al. (2016). Contrasting precipitation seasonality influences evapotranspiration dynamics in water-limited shrublands. J. Geophys. Res. Biogeosciences 121, 494–508. doi:10.1002/2015jg003169
Wang, J., Li, W., Ciais, P., Li, L. Z. X., Chang, J., Goll, D., et al. (2021). Global cooling induced by biophysical effects of bioenergy crop cultivation. Nat. Commun. 12, 7255. doi:10.1038/s41467-021-27520-0
Waring, R. H., and Running, S. W. (2007). Forest ecosystems: analysis at multiple scales. Amsterdam Boston: Elsevier/Academic Press.
Webb, E. K., Pearman, G. I., and Leuning, R. (1980). Correction of flux measurements for density effects due to heat and water vapor transfer. Q. J. R. Meteorological Soc. 106, 85–100. doi:10.1002/qj.49710644707
Wilczak, J. M., Oncley, S. P., and Stage, S. A. (2001) “Sonic anemometer tilt correction algorithms,”. 99. Boundary-Layer Meteorology, 127–150. doi:10.1023/A:1018966204465
Williams, C. A., Reichstein, M., Buchmann, N., Baldocchi, D., Beer, C., Schwalm, C., et al. (2012). Climate and vegetation controls on the surface water balance: synthesis of evapotranspiration measured across a global network of flux towers. Water Resour. Res. 48. doi:10.1029/2011WR011586
Xu, Q., Liu, S., Wan, X., Jiang, C., Song, X., and Wang, J. (2012). Effects of rainfall on soil moisture and water movement in a subalpine dark coniferous forest in southwestern China. Hydrol. Process. 26, 3800–3809. doi:10.1002/hyp.8400
Keywords: evapotranspiration, precipitation, bioenergy crops, covariance, biofuel
Citation: Postma K, Mane S, Shen M, Kussainova M, Beisenova R, Nanda A, Dong G and Chen J (2024) Water loss through evapotranspiration after precipitation events in bioenergy crops grown in similar climatic conditions. Front. Environ. Sci. 12:1463852. doi: 10.3389/fenvs.2024.1463852
Received: 12 July 2024; Accepted: 30 September 2024;
Published: 24 October 2024.
Edited by:
Michael Pollock, Northwest Fisheries Science Center, United StatesReviewed by:
Devaraju Narayanappa, CSC - IT Center for Science (Finland), FinlandMir Zaman Hussain, W.K. Kellogg Biological Station, College of Natural Science, Michigan State University, United States
Copyright © 2024 Postma, Mane, Shen, Kussainova, Beisenova, Nanda, Dong and Chen. This is an open-access article distributed under the terms of the Creative Commons Attribution License (CC BY). The use, distribution or reproduction in other forums is permitted, provided the original author(s) and the copyright owner(s) are credited and that the original publication in this journal is cited, in accordance with accepted academic practice. No use, distribution or reproduction is permitted which does not comply with these terms.
*Correspondence: Kevin Postma, cG9zdG1hazJAbXN1LmVkdQ==
†These authors have contributed equally to this work and share first authorship