 Yilong Zhao1,2
 Hongbo Fu
- 1Shanghai Key Laboratory of Atmospheric Particle Pollution and Prevention, Department of Environmental Science and Engineering, Institute of Atmospheric Sciences, Fudan University, Shanghai, China
- 2Collaborative Innovation Centre of Atmospheric Environment and Equipment Technology (CICAEET), Nanjing University of Information Science and Technology, Nanjing, China
- 3Jiangxi Key Laboratory of Environmental Pollution Control, Jiangxi Academy of Eco-Environmental Science and Planning, Nanchang, China
- 4Institute of Eco–Chongming (SIEC), Shanghai, China
Field observations have confirmed that halide ions are widely distributed among aerosols from the marine boundary layer and on the surfaces of ice and snow in polar regions. Consequently, the coexistence of halide ions may play a more significant role in nitrate photolysis than previously thought. In this study, we simultaneously measured HONO, NO2, and NO2− in situ to gain a deeper understanding of the coexisting system, including the photogenerated nitrogen products and the effects on nitrate photolysis rates due to enhanced aqueous nitrite and HONO transfer rates by halides. The presence of halides significantly increased the photogenerated nitrogen products across various molar ratios ([X–]/[NO3−]) at pH 3.5. By eliminating oxygen flux, the transformation of the primary photogenerated products was affected, resulting in higher concentrations of N(III) as both HONO and NO2−. Experiments involving OH scavengers indicated that the attack from·OH initiated by halides leads to side reactions that enhance nitrate photolysis. Both theoretical calculations and nitrate actinometry were used to determine the photolysis rate of nitrate solutions, which together indicated that the presence of halides enhances nitrate photolysis. A newly developed model was used to determine the HONO transfer rate, finding that the presence of halides ([X–]/[NO3−] = 0.2) enhanced the evaporation of N(III) in solution by factors of 0.68, 0.95, and 1.27 for Cl−, Br−, and I−, respectively. To our knowledge, this is the first determination of halide effects on the mass transfer of HONO. The enhanced nitrate photolysis rate can be attributed to the differential surface effects of halides and parallel reactions initiated via ·OH stemming from nitrate photolysis, with varying rates leading to different quantities of nitrogenous products. Additionally, simultaneous measurements of photoproducts in both gas and condensed phases are recommended to better constrain the rate constants of NO3− photolysis.
1 Introduction
Nitrate ions (NO3−) commonly coexist with halide ions (X−) in aged sea salt particles; in addition, they are also present within the quasi-liquid layer found in polar snowpack (Koop et al., 2000; Bogdan et al., 2003). It is well known that sea salt aerosols undergo heterogeneous reactions with gaseous nitrogen oxides, such as NO2 and HNO3, resulting in chloride depletion, with a concomitant increase in NO3− in the condensed phase (Dall’Osto et al., 2004; Wingen et al., 2008). The particle composition has been observed to range from no chloride depletion to complete chloride loss, and a strong anticorrelation of chloride ion (Cl−) with NO3− has been found (Peng et al., 2022). Mixtures of sea salts and NO3− are also found on high-altitude snowpack because of the deposition of nitrogen oxides generated at lower latitudes (Richards and Finlayson-Pitts, 2012). The NO3− levels in such mixtures can be quite high in sea salts, ∼100–300 mM, and on the order of μM on the snowpack (Blaszczak-Boxe and Saiz-Lopez, 2018).
NO3− photolysis can be further enhanced by the presence of halide ions (Wingen et al., 2008; Richards et al., 2011; Richards and Finlayson-Pitts, 2012). The halide-enhanced NO3− photolysis at the interfacial region (operationally defined as ca. 10–100 monolayers thick) has been proposed based on observations of the enhanced production of gas-phase oxidant concentrations of NO2 and X2 (X = Cl/Br/I), in particular Br− and I−, both of which may penetrate the solvent cage and react directly with OH radicals (Das et al., 2009; Richards et al., 2011). A generally accepted notion is that the proximity of coexisting X− to the air–water interface is thought to strongly influence the NO3− level at the interface and the photolysis that followed (Wingen et al., 2008; Hong et al., 2013; Richards-Henderson et al., 2013). Piatkowski et al. (2014) used time-resolved sum frequency generation spectroscopy to reveal remarkably higher surface propensities for X− corresponding to surface ion concentrations several times that of the bulk, well-consistent with a previous study by Jungwirth and Tobias (2006). These were further interpreted using molecular dynamics simulations as being a consequence of the known surface activity of X− at an atom level, whereby excess X− at the water surface causes an increase in the cation concentration immediately below; in turn, the cation draws up NO3− to the interface region due to a double-layer effect, resulting in less efficient recombination of the fragments initially generated upon photolysis, and hence an increased NO3− photolysis (Wingen et al., 2008). To date, although significant advances have been made in elucidating the NO3− photolysis enhanced by halogenic anions, the pertinent kinetics and mechanisms responsible for active nitrogen species release, including those associated with reactive intermediates, such as secondary formation of HONO and superoxide radical (O2−), are not well-understood. In particular, the transfer rate constants of HONO involved in X− are not reported, yet.
This study simultaneously measured the photoinduced generation of gaseous NO2 and HONO and aqueous NO2− from nitrate solutions in the presence of X−. The photolysis rate constants of NO3− were calculated under different aqueous conditions. Additionally, the effects of the mixing ratio of X− to NO3−, varying pH, and coexisting cations on the photolysis rate constant were investigated in detail.
2 Experimental methods
2.1 Chemicals
All chemicals were used as received, without further purification, including the following: NaNO3 (99.9%; J.T. Baker), NaNO2 (99.7%; J.T. Baker), HCl (37%; Sigma-Aldrich), NaOH (98%; Sigma-Aldrich), N-(1-naphthyl)ethylenediamine dihydrochloride (NEDA;
2.2 Photochemical experiments
Solutions of 10 mM NO3− were prepared using NaNO3 and 18.2 MΩ·cm water. The acidity of the solution was measured by using a pH meter (Thermo Scientific Orion Star A211) both before and after the photochemical experiments with little difference.
Experiments were conducted in a cylindrical glass cell (i.d. = 2.0 cm, l = 5.0 cm) equipped with 6.35-mm i.d. inlet and outlet ports for gas and solution transport. The working solution with halides present was added to the cell followed by the buffer solution, and finally 18.2 MΩ·cm ultrapure water was added to control the total solution volume at 7.5 mL. The working solution was irradiated from the side using an Xe lamp (7ILX150A, OSRAM, Germany) coupled with a UV cutoff filter. The spectrum of the Xe light source was provided elsewhere (Li et al., 2024). The carrier gas of wet zero air was flowed through the reactor headspace at a rate of 1,600 sccm and then connected directly with the equipment for online measurement of the HONO and NO2 emitted from the mixed solution irradiated, as shown in Supplementary Figure S1. The photochemical experiments were performed at 25°C ± 1°C by using the water-cooling bath system and in ambient pressure. The air flow was identified as laminar flow by the calculated Reynolds number (Re) of 219.2 (see Supplementary Material S1).
2.3 Measurements of reactive nitrogen
HONO, NO2, and NO2− were measured simultaneously in the experiments. HONO was measured via a commercial long-path absorption photometer (LOPAP-03, QUMA Elektronik & Analytik, Wuppertal, Germany) by the absorption difference between twin sample coils both measuring the calibration solution (every 2 days) and continuous gaseous sample (Cui et al., 2018; Cui et al., 2019; Cui et al., 2021). NO2 was measured via cavity-enhanced absorption spectroscopy (CEAS) by the enhanced absorption of NO2 between two coupled high-reverse lenses, of which the reflectance was calibrated every week (Fiedler et al., 2003; Gherman et al., 2008; Reeser et al., 2013). NO2− was measured via the Griess method, of which, by forming a strongly absorbing azo–dye complex with nitrite, both the daily calibration solution and sample solution absorption could be determined using a UV/VIS spectrophotometer (4802 UV/VIS Double Beam Spectrophotometer) at 540 nm (Pratt et al., 1995; Ridnour et al., 2000; Moorcroft et al., 2001; Huang et al., 2002). Further details of the measurements of the reactive nitrogen species are given in Supplementary Material S2 and Supplementary Figure S2.
2.4 Determination of the photolysis rate constants by using a nitrate actinometer
The nitrate actinometer is an effective tool used for the determination of the nitrate photolysis rate constant (Jankowski et al., 1999; Jankowski et al., 2000; Baergen and Donaldson, 2013; Ye et al., 2016a; Ye et al., 2016b; Ye et al., 2017; Bao et al., 2018). In this method, BA was selected to be the ·OH scavenger during irradiation, which would react to generate SA. By determining the production rate of SA, the production rate of ·OH was concurrently obtained as ·OH is the key product during nitrate photodissociation. Consequently, the nitrate photolysis rate constant (jact) under specific xenon irradiation conditions (consistent with all subsequent experiments) was calculated. Combining with the measurement of generated profiles, the normalized nitrate photolysis rates (
where
All the photolysis products were measured during the determination of nitrogenous profiles including HONO, NOX, and NO2−. A short time interval (5 min) was chosen to prevent further interruption from side reactions. A detailed description of this section is given in Supplementary Material S3. It should be noted that the rate constant derived from Equation 1 is still underestimated since the NO concentration was lower than the limit of detection in this system. The NO concentration was lower by an order of magnitude than the NO2 concentration, as reported by Mack and Bolton (1999). Therefore, the possible underestimation should be relatively small.
2.5 Calculation of the photolysis rate constants
The photolysis rate constant was theoretically calculated, while the evidence of ion accumulation at the air/aqueous interface illustrates surface enrichment rates (Jungwirth and Tobias, 2000; Jungwirth and Tobias, 2001; Jungwirth and Tobias, 2002b). The quantitative calculation measures for the contribution of reactions from the enrichment of surface ion concentration rely on molecular dynamics simulation and the incomplete solvent cage formed by the neat arrangement of droplets at the interface. The surface contribution is traditionally calculated through geometric optics or Rayleigh/Mie scattering theory for droplet balls, the difference between which mainly focuses on the scale relationship between the selected liquid droplets and the wavelength of illumination. The classic calculation method for NaNO3 in 864 water molecules, as introduced by molecular dynamics simulations led by Jennie L. Thomas, adheres to rigorous academic standards (Allen and Tildesley, 2017). In this method, a flat plate model is used on the surface, with droplet points set to crystal cells of dimensions 30 Å × 30 Å × 100 Å. This setup aims to determine reasonable values for the number of layers, comprising several layers of liquid droplets with a thickness of 1 nm and a radius of 1 nm, arranged together. Subsequently, these multiple layers are consolidated into a single-layer droplet, with adjustments made using the Mie scattering theory to account for changes in scale. This approach ensures both precision and logical coherence in the simulation process, facilitating accurate analysis of the behavior of NaNO3 within the water molecule system. In order to solve the effect of any selected molecule, Nissenson et al. (2006) proposed a numerical model for evaluating the internal strength distribution within surface-arranged droplets (Equation 2). Considering the non-uniform illumination of droplets under atmospheric conditions, the model discretizes the spectrum into discrete polarized plane waves, while pertinent parameters are also used to characterize the relative intensity distribution, which is averaged across angles. This distribution, described as a function of the normalized radius, facilitates the calculation of numerical values for specific lighting directions (Equation 3). Subsequently, it obtains the average intensity by eliminating angle and wavelength differences through weighted averaging (Equation 4).
where r,
where G(
It is important to note that the refractive index, denoted by
where
2.6 Calculation of the mass transfer rate of HONO
We first assumed an equal volume of balanced HONO(g)/HNO2(aq) to evaluate the distribution and found that much (>99.92%) of the HNO2(aq) in this system is trapped in solution, which indicates that mass transfer could not significantly decrease the concentration of HNO2(aq).
The mass transfer process between two phases is believed to be a typical reversible reaction, and the transfer rate can be described by Equation 7. The same equation (Equation 8) was used to determine the halides that presented mass transfer. Nevertheless, the halide-influenced mass transfer process is supposed to be different since the halides are acknowledged to lead a surface effect, which may take part in transfer (Richards and Finlayson-Pitts, 2012; Piatkowski et al., 2014; Zhang et al., 2020). Thus, the determination of the mass transfer rate constant (
where [HONO] represents the HONO concentration changed by evaporation at the air/liquid interface,
To compare the mass transfer rate of evaporation and dissolution in our system,
where
Assuming there exists a specific zone where the HONO(g) dissolution rate equals to the HNO2(aq) evaporation rate (described as Equation 11),
Due to the unchanging concentration of HNO2(g), the averaged concentration of HNO2(aq) (
Clearly,
Thus,
By comparing the measured HONO(g) concentrations with the theoretically balanced HONO(g) concentrations, the relative dissolution rate (
where
As noted earlier, the nitrite concentration measured using the Griess method represents the combined presence of H2NO2+(aq), HNO2(aq), and NO2−(aq) in solution, which coexist in equilibrium as reactions (Equations 15, 16) (pKa1 = 1.7 and pKa2 = 3.25 at 298 K) (Lide, 2004). It is important to note that the subscript (aq) is used here specifically to emphasize the pH-dependent distribution of N(III) forms in solution [H2NO2+(aq)/HNO2(aq)/NO2−(aq)]. The relationship between the measured NO2− and HNO2(aq) concentration is given in Supplementary Material S2.3 and shown in Supplementary Figure S2. From these data, the concentration of HNO2(aq) was calculated to be 37.89% using Equation 17 at pH 3.46, aligning with the measured HONO(g) concentrations derived from the partitioning between gaseous and aqueous phases, in accordance with Henry’s law. Henry’s law constant for HONO is 0.48 mol·m–3·Pa−1 at 25°C, as established in various studies (Schwartz and White, 1981; Chameides, 1984; Park and Lee, 1988; Sander, 2023).
where [
It should be noted that there exist a few side reactions involved during the demonstration, which are discussed as follows, with a time scale of 0.28 s (the retention time of gas flow in the reactor). A significantly fast nitrate photolysis rate of 1.0 × 10⁻⁵ s−1 was assumed to evaluate the nitrate photolysis, and the photolyzed nitrate concentration was calculated to be 0.028 μmol·L−1, which is lesser than the determined lowest nitrite concentration (0.533 μmol·L−1) by an order. In addition, the photolysis rate of nitrite was assumed to be 1.0 × 10⁻⁴ s−1 (Scharko et al., 2014), and the photolyzed concentration of nitrite was calculated to be 0.003%. Thus, the nitrite concentration during the retention time was overlooked. Among the headspace, the photolysis of HONO was also necessary to be considered. With a recommended rate of 5.0 × 10⁻³ s−1, the loss of HONO was calculated to be 0.14% (Wang et al., 2020). However, NO2 may also react with H2O to generate HONO. This pathway was also calculated theoretically by rates recommended by previous studies, and the contribution was derived to be 7.8 × 10⁻⁶ pptv (Schwartz, 1984; Cheung et al., 2000; Scharko et al., 2014).
3 Results and discussion
3.1 The release of active nitrogen species from the irradiated nitrate solutions
We initially studied the active nitrogen species evolved from the illumination of a cell containing the NO3− solution in the presence of the halide ions (Cl−, Br−, and I−), and the typical evaluation profiles are shown in Figure 2. One can see that the time-dependent profile of gaseous HONO (Figure 1A), NO2 (Figure 1B), and aqueous NO2− (Figure 1C) showed a similar trend, all of which increased in a step-like pattern under the initial irradiation, reaching a steady-state plateau and kept an almost constant concentration when the irradiation further continued. Once the light was switched off, all of the products were still observed but at a rather low rate and returned to background levels after 2–4 h. Such a scenario suggested that all of the active nitrogen species were yielded via the photochemical pathway. The fundamental photolysis mechanism (
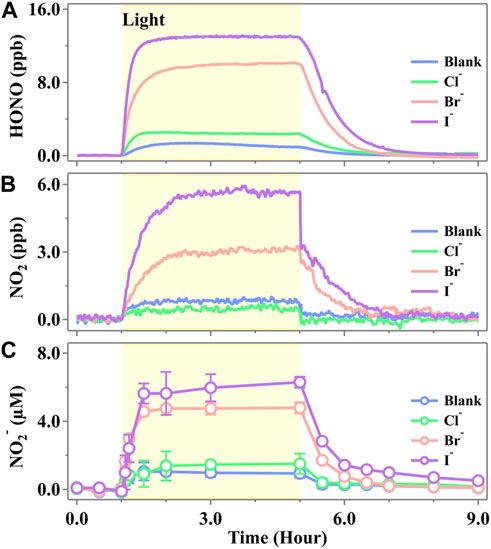
Figure 1. Released profiles of (A) HONO, (B) NO2, and (C) NO2− during simulated sunlight irradiation on the phosphate-buffered nitrate solution (pH 3.5 ± 0.1) in the presence of a halide ion, X− (Cl−, Br−, or I−). The yellow region corresponds to the irradiation period (duration of 4.0 h) starting at t = 1.0 h. The ion strength was calculated to be 0.112 mol·kg−1 for both blank and halogen-presented experiments. The standard error in the case of NO2− was calculated by at least three runs. Error bars present the 1-
As shown in Figure 1, the steady-state concentrations of HONO and NO2 emitted from the pure nitrate solution at pH 3.5 were 0.94 ± 0.01 ppb and 0.77 ± 0.09 ppb, respectively. These concentrations are comparable to those reported recently by Scharko et al. (2014), who simultaneously measured HONO and NO2 emissions from nitrate photolysis using cavity-enhanced absorption spectroscopy. The concentration of NO2− in the pure nitrate solution increased upon irradiation and stabilized at 1.01 ± 0.82 μM, which is consistent with the previous work reported by Benedict et al., who observed approximately 0.5 μM of nitrite after 1 min of irradiation in a solution containing 10 mM nitrate (Benedict et al., 2017). In the presence of halide ions, the photochemical production of HONO, NO2, and NO2− followed the order I− > Br− > Cl−. Notably, the presence of Br− and I− significantly enhanced the formation of active nitrogen species, whereas the product amounts showed no significant change in the presence of Cl− compared to the blank runs. The emitted HONO exhibited steady-state concentrations of 13.00 ± 0.06 ppb for I− and 10.05 ± 0.05 ppb for Br−, which were 12.8 times and 9.7 times higher, respectively, than those observed in the blank runs. NO2 exhibited steady-state concentrations of 5.66 ± 0.02 ppb for I− and 3.19 ± 0.08 ppb for Br−, which were 6.4 times and 3.1 times higher than those of the blank runs, respectively. In the solutions, NO2− reached the steady-state concentrations of 5.54 ± 1.64 μM for I− and 4.60 ± 0.54 μM for Br−, which were 4.5 and 3.6 times higher, respectively, than those in the blank runs. It was well known that nitric acid oxidizes Br−/I− and yields HONO in the dark (Lengyel et al., 1989; Simpson et al., 2015). However, a measurable level of HONO was not observed in the initial 1 h (Figure 1), suggesting that the HONO yielded by this pathway is insignificant. The additional evidence supported that the oxidation of Br−/I− did not lead to the additional generation of HONO since the total concentration of [HONO] + [NO2−] remained unchanged in both the blank and halide-containing experiments (Supplementary Figures S4, S5).
Recently, some research studies found that there may exist more N(III) products than quantum yield predicted in the photolysis of nitrate solution (Goldstein and Rabani, 2007; Roca et al., 2008; Benedict et al., 2017). Roca et al. discovered that the nitrate concentration, as well as the cation type (e.g., Na+ vs. Ca2+), would lead to a shift in the nitrate absorption curve and consequently cause enhanced quantum yields of Equation 16 (Roca et al., 2008). Our measurements also confirmed that there exist more N(III) products than N(IV) than the quantum yields predicted. Nevertheless, we discovered more N(III) during the photolysis, technically an order of magnitude than that in the research by Benedict et al. (2017), who found comparable quantum yields of NO2− and NO2. The unexpected NO2− production may be highly relevant with the side reaction involving halogens, which are photosensitive toward ·OH stemmed from nitrate photolysis and, thus, more reactions accompanied (Cao et al., 2014; Kim et al., 2014; Simpson et al., 2015; Yang and Pignatello, 2017; Zhang et al., 2020). By the activation from ·OH, further reactions would lead to the generation of X· (Huie and Neta, 1986; Cripps et al., 2011; Guo et al., 2017; Bulman et al., 2019). Thus, an extra reaction channel of HNO2 was provided through halide-presented reactions and led to a much higher production of N(III) in the system. However, the reaction rate constants were different. Due to the ionic radius of Cl−, Br−, and I−, as well as the water solvent cage completeness, Br− and I− tend to have faster speed than Cl− in the solution (Yang and Pignatello, 2017) (e.g., the reaction of Equation 21 with Br− and I− is adequate at any normal environmental pH, while the oxidation of Cl− is favorable only under acidic conditions (Jayson et al., 1973; Pignatello, 1992)).
3.2 The influence of different ratios of the halide ions on the reactive nitrogen species released
The steady-state concentrations of HONO, NO2, and NO2− as functions of the molar ratio ([X−]/[NO3−]) ranging from 0.001 to 0.5 were measured, and the results are presented in Figure 2. It is obvious that both Br− and I− significantly enhanced the release rate of the active nitrogen species of HONO, NO2, and NO2− as the [X−]/[NO3−] ratios increased. The presence of Cl− shows the insignificant changes compared to the blank runs. In the case of [X−]/[NO3−] = 0.5, the release rates of HONO for Cl−, Br−, and I− are (2.88 ± 0.29) × 10–9 mol·min−1, (1.77 ± 0.24) × 10–9 mol·min−1, and (1.73 ± 0.17) × 10–10 mol·min−1, respectively. The released NO2 was (4.06 ± 0.37) × 10–10 mol·min−1, (1.74 ± 0.21) × 10–10 mol·min−1, and (4.27 ± 1.66) × 10–11 mol·min−1 for I−, Br−, and Cl−, respectively. The NO2− in the irradiated solution was 15.87 ± 1.42 μM, 7.40 ± 0.64 μM, and 1.25 ± 0.27 μM for I−, Br−, and Cl−, respectively.
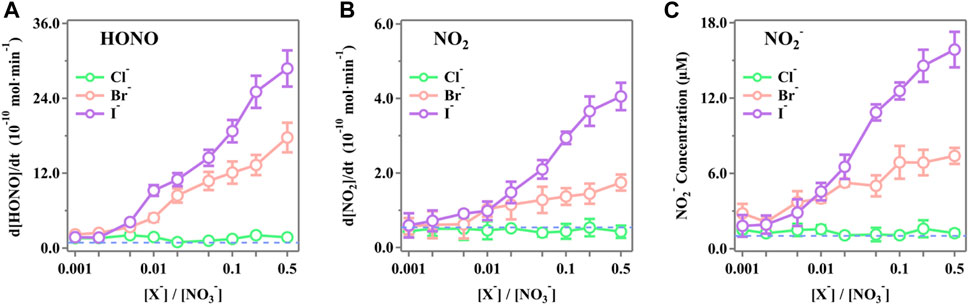
Figure 2. Production rates of (A) HONO, (B) NO2, and (C) NO2− during simulated sunlight irradiation on the phosphate-buffered nitrate solutions (pH 3.5 ± 0.1) as a function of the initial ratios [X−]/[NO3−] (X− = Cl−, Br−, or I−). The ion strength ranges from 0.111 mol·kg−1 to 0.116 mol·kg−1 (difference <5.0%) as the [X−]/[NO3−] ratio increases from 0.001 to 0.5. The standard errors were calculated by at least three runs. Error bars represent the 1-
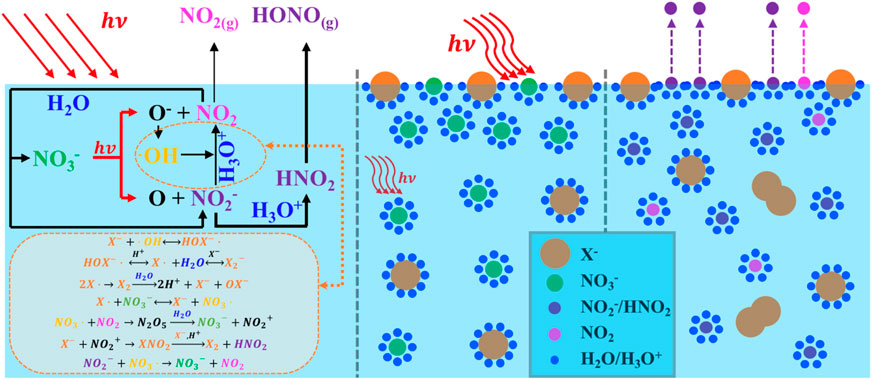
The significant enhancement by halogens is attributed to surface effects and additional reactions. Halogens can be activated by ·OH to form XOH− (Equation 21) (Zehavi and Rabani, 1972; Mulazzani and Buxton, 2006; Seinfeld and Pandis, 2016), which then reacts with X− to generate X2− (Equation 22) (Zehavi and Rabani, 1972; Bulman et al., 2019); the dissociation of X2- further produces X· and eventually X2 by self-quenching, leading to the formation of OX− (Equation 23) (Huie and Neta, 1986; Cripps et al., 2011; Guo et al., 2017; Yang and Pignatello, 2017; Bulman et al., 2019). X also reacts with NO3− to generate NO3·(Equation 24) (Neta and Huie, 1986; Poskrebyshev et al., 2003), which combines with the NO2 generated in the solution to form NO2+ (Equation 25) (Wayne et al., 1991) and, subsequently, produces X2 and HNO2 (Equation 26) (Schweitzer et al., 1998; Roberts et al., 2008). Consequently, the coexisting halides provided an extra channel for nitrate photolysis initiated via Equation 24 in the solution, thus leading to an enhanced generation of nitrogenous products. Additionally, halide ions are also known to prefer the surface over the bulk (Knipping et al., 2000; Jungwirth and Tobias, 2001; Tobias et al., 2001). Molecular dynamics simulations by Jungwirth et al. demonstrated that the surface concentrations of Cl−, Br−, and I− are 0.7, 3.1, and 3.9 times those of the bulk, respectively (Jungwirth and Tobias, 2001). Due to incomplete solvent cages at the interface, surface halogens are likely to undergo those reactions at a faster rate, leading to more efficient nitrate photolysis and secondary reactions. Surface halogens also maintain a double layer in shallow solutions, which attracts more nitrate ions to the subsurface and increases the concentration of surface-induced photochemical products via the drawn Na+ at the surface layer (Jungwirth and Tobias, 2001; Ottosson et al., 2010; Piatkowski et al., 2014). It is also reported that NO3− tends to accumulate at the interface with a higher concentration than at the bulk (Salvador et al., 2003; Zhang et al., 2020). Thus, it is probable that the surface space is dominated by nitrate ions and halogens, thereby enhancing the synergistic effects on nitrate photolysis at the surface, which may be more pronounced at higher [X−]/[NO3−] ratios (Wang et al., 2002; Cheng et al., 2006; Brown et al., 2009). Note that among all the selected [X−]/[NO3−] ratios, Cl− tends to be the most irrelevant halide for its most insignificant surface effect compared to Br− and I− (Jungwirth and Tobias, 2001).
3.3 The pH influence on active nitrogen species released in the presence of the halide ions
Figure 3 shows the maximum release rates of HONO, NO2, and NO2− from the irradiated nitrate solutions in the presence of the halide ions. It is evident that pH plays a critical role in the generation of these N-containing compounds. The presences of Br− and I− significantly enhanced the release of HONO, NO2, and NO2−, whereas the presence of Cl− showed an insignificant change compared to the blank runs. As shown in Figure 3A, the release rate of HONO decreases with increasing pH, displaying a notable trend of I− > Br− > Cl−. The highest HONO release rate was observed at pH 2.0, with the rates of (4.34 ± 0.81) × 10–8, (3.15 ± 0.32) × 10–8, and (2.80 ± 1.03) × 10–9 mol·s–1·cm–2·(mol NO3−)−1 for Cl−, Br−, and I−, respectively. Similarly, the release rates of NO2 followed the same order of I− > Br− > Cl−, with the rates of (2.66 ± 0.70) × 10–9, (3.87 ± 1.02) × 10–9, and (6.16 ± 1.42) × 10–9 mol·s–1·cm–2·(mol NO3−)−1 for Cl−, Br−, and I−, respectively. On the contrary, the NO2− in the solutions presented a reverse trend with gaseous NO2 and HONO, both of which apparently increased with decreasing pH, reflecting the pH-dependent distribution of N(III) compounds. The highest concentration of NO2− was observed at pH 4.3, with values of (2.01 ± 0.36) × 10–3, (1.65 ± 0.36) × 10–3, and (5.57 ± 1.06) × 10–4 mol·L–1·(mol NO3−)−1 for I−, Br−, and Cl−, respectively. This indicates a strong potential for HONO release from the bulk phase, temporarily stored as NO2−. It was well-reported that a pH-driven distribution of N(III) consists of H2NO2+(aq), HNO2(aq), NO2−(aq), and HONO(g) (Riordan et al., 2005; Scharko et al., 2014; Benedict et al., 2017). The concentration of HNO2(aq) correlates with the released HONO(g) through the partitioning of HNO2(aq) and HONO(g), which is restrained by Henry’s law (Collins et al., 2018; Pandit and Grassian, 2022). The pH increase shifts the equilibrium of H2NO2+(aq)/HNO2(aq)/NO2−(aq) to the right, increasing the N(III) concentration in the solution as a potential HONO source and decreasing HONO release.
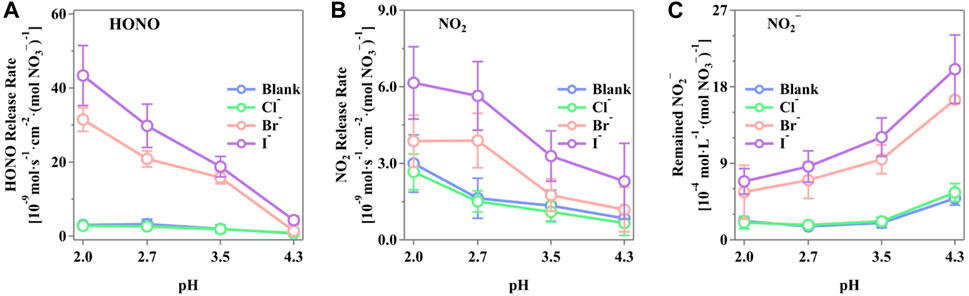
Figure 3. Production rate of active nitrogen species of (A) HONO, (B) NO2, and (C) NO2− from the irradiated phosphate-buffered nitrate solutions. The solution with different pH (2.0 ± 0.1, 2.7 ± 0.2, 3.5 ± 0.1, and 4.3 ± 0.2) was adjusted by H3PO4/H2PO4−, and the total concentration of P was controlled to be 0.2 M to prevent possible inferences. The pH value was measured both before and after the experiments with insignificant differences. The standard errors were calculated by at least three runs. Error bars present the 1-
Scharko et al. (2014) simulated a constant level of NO2 release using a steady-state box model based on several reported reactions. However, the NO2 release showed a decrease with an improved pH level in this study, indicating that via the presence of halides, the H+-related reactions were more sensitive toward the shift in pH, leading to different NO2 release rates. Such a scenario was not unique. Peng et al. confirmed that the production of Cl2 was relevant with the acidity of aerosol particles (Peng et al., 2022). Wang et al. (2021) also found that the halide-coexisted reactions were pH-sensitive. Thus, the introduction of halides simultaneously caused a pH-relevant production of NO2. It is important to note that the nitrate photolysis process itself was not significantly influenced by pH changes. The variation in nitrogenous products was due to secondary reactions and the pH-dependent distributions of the N-containing products, both of which have an insignificant effect on the total amount of active nitrogen species production.
3.4 Investigation of the oxygen effect on the nitrate photolysis in the presence of halide ions
The observed production rate of active nitrogen species from irradiated nitrate solutions, particularly in the presence of halide ions under O2/N2 air conditions, is shown in Figure 4. Notably, the presence of O2 in the carrier gases emerges as an important factor influencing nitrate photolysis. Across all scenarios, O2 substantially enhances the photochemical rates of both gaseous NO2 and NO2− in solution. Conversely, O2 inhibits the formation of HONO. This underscores the intricate interplay between oxygen, halide ions, and the photolytic processes of nitrates, shedding light on the complex mechanisms governing these reactions.
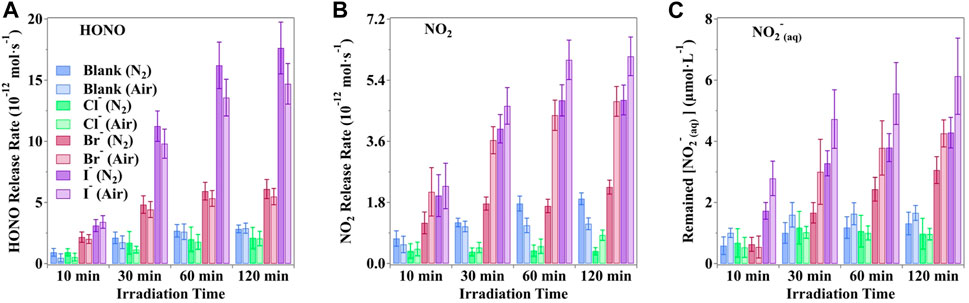
Figure 4. Production rate (A) HONO, (B) NO2 and (C) hosted nitrite of nitrogenous substances under the photodissociation of nitrate driven by simulated sunlight in buffered solution in the presence of halogens. Typical moments were selected to reveal different statuses of the photochemical system. All the pH values were buffered to 3.5 ± 0.1 by H3PO4/H2PO4− with an unchanged ion strength of 0.113 mol·kg−1. The error bars present the 1-
Under a pure nitrogen atmosphere, the maximum release rates of HONO increased by a factor of 2.39%, 11.34%, and 19.89% when coexisted with Cl−, Br−, and I−, respectively. Conversely, the NO2 release rates were reduced by 56.2%, 52.85%, and 21.07% for Cl−, Br−, and I−, respectively, due to the absence of O2. Furthermore, the NO2− concentration was also lower in the absence of O2, with factors of 1.32%, 28.19%, and 30.08% when coexisted with Cl−, Br−, and I−, respectively. Such a scenario suggested that O2 may participate in active nitrogen formation in the irradiated solution. Reeser et al. (2013) reported that a steady generation rate coupled with a swift phase transfer rate results in lower concentrations of intermediate products like dissolved N(III) and higher concentrations of evaporated products, such as HONO.
It is detected that halide ions could be initiated via the ·OH radical (Equation 21) to produce XOH−, and further reactions (Equations 22, 23) would finally generate OX−. The combined effect with the photodissociation of OX− and Equation 16 would produce extra O(3P) and lead to the production of O3 via O2 (Equation 27) (Francisco et al., 1996; Minaev, 1999; Forsyth et al., 2013). Thus, the presence of O2 makes contributions to increase the generation of O3 and consequently accelerate the oxidation of NO2 and NO2− (Equations 28–30) (Daniels, 1969; Huie, 1994; Seinfeld and Pandis, 2016).
In order to study the mechanism of nitrate photolysis by halogen elements, we first start with the clearing function of halogen on ·OH. Using a concentration of 2 mM isopropanol ensured the complete scavenging of ·OH derived from irradiated nitrate solutions, based on the findings obtained by Scharko et al. (2014). However, halide ions, especially Br− and I−, can also scavenge ·OH (Mopper and Zhou, 1990; Plewa et al., 2008). While halides can protect against ·OH, the resulting halide-containing products are strong oxidants themselves. Isopropanol, a typical ·OH scavenger, was chosen for its strong reducibility to evaluate radical performance, encompassing both ·OH and halides (Yang and Pignatello, 2017).
The maximum releases of nitrogenous substances are shown in Figure 5. Clearly, the concentrations of HONO, NO2, and NO2− were suppressed in the presence of the scavenger. The decreases in HONO release were 20.8%, 72.0%, and 74.7% for Cl−, Br−, and I−, respectively, while NO2 releases decreased by 39.0%, 65.0%, and 70.3%, respectively. This indicates a negative effect caused by the scavenging process. It should be noted that NO3· from Equations 24, 28, X· from Equation 22, and ·OH from nitrate photolysis (Equation 31) were all scavenged by isopropanol by robbing the α-H (Seinfeld and Pandis, 2016; Yang and Pignatello, 2017). Although some of these may still react through competing reactions (e.g., Equation 26: X− + NO2+), the products remain oxidants and are also easily captured by isopropanol.
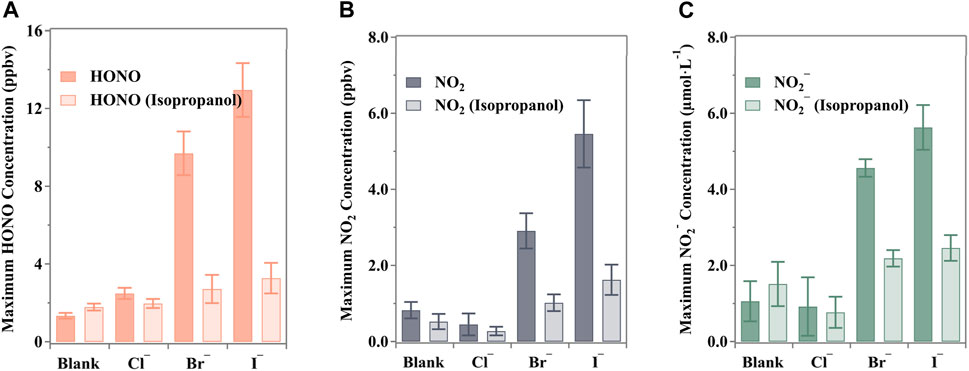
Figure 5. Maximum nitrogenous product concentration under the ·OH scavenger (isopropanol, (CH3)2CHOH) from the halide-presented aqueous nitrate photolysis: (A) HONO, (B) NO2 and (C) NO2−. All the pH values were buffered to 3.5 ± 0.1 by H3PO4/H2PO4− with an unchanged ion strength of 0.113 mol·kg−1 (0.111 mol·kg−1 for blank experiments). The error bars present the 1-
Despite the presence of halides, the photolysis of nitrates remains the primary photochemical process in the solution. Isopropanol significantly reduced the production of HONO/NO2− and NO2 in the presence of halides, but these levels were still slightly higher than those observed in blank runs. For instance, the halide-enhanced release of HONO exceeded the blank by factors of 0.10, 0.52, and 0.83 for Cl−, Br−, and I−, respectively. This discrepancy could be attributed to variations in rate constants for the enhanced photolysis of nitrate under halide conditions, as reported in various aqueous solutions and molecular dynamics calculations (Mopper and Zhou, 1990; Pignatello, 1992; Grebel et al., 2010; Yang et al., 2014; Minakata et al., 2017). Notably, Br− and I− typically exhibit higher rate constants in reactions compared to Cl−, suggesting that the relevant side reactions, serving as additional photolysis channels, are more efficient (Yang and Pignatello, 2017).
The experimental data have confirmed that radical reactions play a crucial role in the photolysis of aqueous nitrate solutions containing halides. However, control experiments have also shown that N(III) can resist ·OH oxidation and contribute to NO2 production in the presence of scavengers. The observed shifts in HONO (33.6%), NO2− (42.9%), and NO2 (−36.4%) may be attributed to the termination of the reaction (Equation 32), resulting in reduced NO2 release and increased preservation of N(III) and protonated HONO in the solution. A similar pattern of reduced NO2 release coupled with increased HONO release in the presence of an ·OH scavenger was also noted in the research by Scharko et al., where 10 mM ethylene glycol or 5 mM benzoate was used as the ·OH scavenger during the photolysis of 125 mM nitrate solution (Scharko et al., 2014).
3.5 The photolysis rate constant of aqueous nitrate in the presence of the halides
Due to the presence of numerous secondary channels in the photolysis mechanism of nitrate, the actual photolysis rate constant can be slightly higher than the value calculated theoretically. In this study, based on the unique adsorption characteristics of the water–nitrate–water system and supported by related data, it was demonstrated that the enrichment of nitrate crystals on the surface is inversely proportional to the surface tension (Bertozzi and Sternheim, 1964; Jungwirth and Tobias, 2006; Wick et al., 2006; Allen and Tildesley, 2017). This relationship is succinctly formulated using classical calculation methods, as shown in Equation 33 (Jungwirth and Tobias, 2006; Wick et al., 2006). By comparing the differences in surface tension between sodium nitrate and water plates, we can derive specific changes, which align with the dilution curve fitted by Thomas et al. (2007) for a dilute solution. Following this, the Gibbs equation is applied to quantitatively assess the amount of nitrate enriched at the surface (Equation 34).
where Pii are the components of the pressure tensor (calculated in the usual way from the virial expression), Lzz is the length of the simulation cell in the z-direction (normal to the slab), the angular brackets denote a time average, and the factor of 1/2 accounts for the slab having two interfaces.
It is noteworthy that the number of surface-active molecules aligns closely with the count of droplets determined by reverse calculations. These droplets have a surface area of 10 cm2 and an enriched molecular concentration of 18.9 mM. The photolysis of the inner layer is calculated based on homogeneous-phase chemical reactions. The photolysis rate constants are then comprehensively derived from specific cage simulations, as shown in Table 1. Notably, the photolysis rates were measured by using a nitrate actinometer, with the detection of nitrogenous products conducted at pH of 3.5 and [X−]/[NO3−] ratio of 0.2.
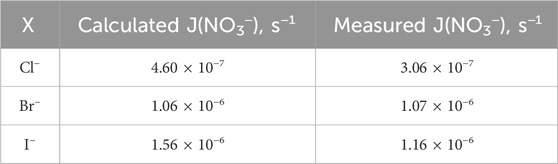
Table 1. Theoretical and calculated aqueous nitrate photolysis rates and corresponding rate constants derived from product measurements and using a nitrate actinometer.
In summary, the meticulous alignment between surface-active molecules and droplet count, alongside detailed calculations of photolysis rates derived from specific cage simulations and experimental measurements by using a nitrate actinometer, contributes to a deeper understanding of the complex interplay between molecular concentrations and photolysis phenomena under atmospheric conditions.
The photolysis rate constants were calculated and normalized to
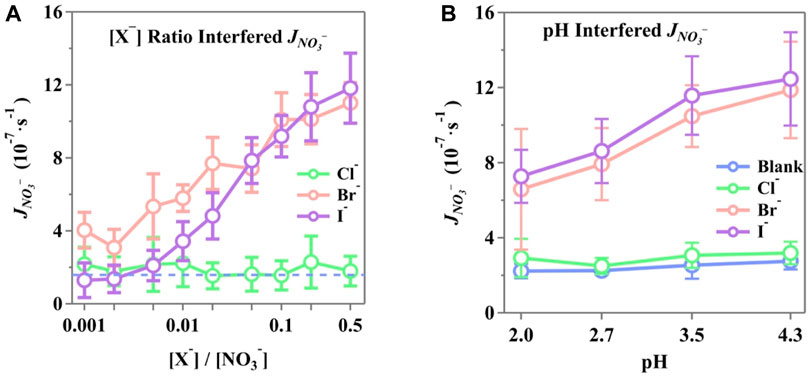
Figure 6. Normalized photolysis rate constant (JNO3-) of phosphate-buffered nitrate solution at the interference of (A) different [X−]/[NO3−] ratios and (B) different solution pH with [X−]/[NO3−] = 0.2. The solutions were buffered by phosphate to be 3.5 ± 0.1 in (A), while (B) is buffered as presented in horizontal ticks. Initial NO3− concentration, 10 mM; air flow, 1,600 sccm; T, 298 K.
Halides at the interface draw nitrate ions to form a double layer, leading to increased surface concentrations of NO3−. Incomplete solvent cages at the air/water interface are known to enhance quantum yields, and this effect is further amplified by the presence of halides (Nissenson et al., 2006; Nissenson et al., 2010). Br− and I− may disrupt the solvent cage or become part of it, significantly accelerating the photodissociation of nitrates once activated (Richards et al., 2011; Piatkowski et al., 2014; Zhang et al., 2020; Lin et al., 2021).
Furthermore, the photolysis rate showed an enhancement with increasing solution pH, with increments of 23.8%, 9.2%, 80.3%, and 71.2% for blank, Cl−, Br−, and I−, respectively, as the pH increased from 2.0 to 4.3. It is important to note that the rate constants were derived from all nitrogenous products at the onset of illumination, meaning that the detected products influenced the calculations. These were affected by the photolysis of incomplete nitrate cages at the surface and additional pathways initiated by X− + ·OH (Equation 21) or X· + NO3− (Equation 24) in the bulk. Bulk reactions were more sensitive to aqueous pH, thus altering the reaction rates of halide-involved reactions. These reactions facilitate both nitrate photolysis and the transformation of nitrogenous products, where a higher pH can result in complex effects on the generation and release of active nitrogenous products by halides. Yang and Pignatello (2017) reported that Cl− reactions are typically slower than those involving Br− and I−. This difference in side reaction rates leads to varied nitrogenous production by halides and, consequently, different rates of nitrate photolysis. Notably, surface I− concentrations are higher than those of Br−, which, in turn, leads to higher concentrations of surface nitrates. Surface radical reactions are much more efficient due to the incomplete solvent cages and the reduced diffusion distance.
The minimal enhancement of Cl− observed in this study is consistent with previous findings. Due to the absorption shift and the overlapping cross-section with the UV range, molecules and radicals containing Cl− tend to exhibit lower reactivity than those containing Br− and I−. This has been documented in some studies (Buxton and Subhani, 1972; Roberts et al., 2008; Forsyth et al., 2013). Molecular dynamics calculations have also suggested that the concentration of Cl− at the interface might be relatively low compared to that in the bulk solution (Jungwirth and Tobias, 2001; Jungwirth and Tobias, 2002a; Salvador et al., 2003). Nevertheless, even with shifted cross-sections, Cl−-containing molecules initiate more reactions compared to blank experiments, resulting in a photolysis rate constant for Cl−, that is, on average, 20% higher than that of the blank experiment.
Metal cations, commonly associated with nitrate drops under the marine boundary layer, also influence the photolysis of nitrate. Roca et al. (2008) reported that the type of cation could shift the nitrate absorption curve, subsequently enhancing the quantum yield of Equation 19. The effects of typical metal cations on aqueous nitrate photolysis rates in the presence of halides were investigated and are given in Supplementary Table S1. It was found that K+ and Al3+ tend to be more effective, while Mg2+, Ca2+, and Na+ showed minimal enhancement in halide-present aqueous nitrate photolysis, attributable to differing surface effects of the cations (Jungwirth and Tobias, 2002a, 2006; Salvador et al., 2003). However, Fe3+ undergoes severe hydrolysis, resulting in a pH of approximately 2.6, which disrupts the buffer range (pH 3.5 ± 0.1) and leads to a significantly higher concentration of photolysis products. The higher nitrogenous products may be due to the photochemical properties of Fe3+, as reported previously (Cwiertny et al., 2008; Wang et al., 2019). UV absorption curves were also measured with little variance (see Supplementary Figures S6, S7), suggesting that the shift in the absorption cross-section caused by metal cations is insignificant in this system, likely due to differentiated concentrations. Roca et al. (2008) reported that a higher concentration of Ca(NO3)2 would result in shifts toward a lower wavelength of the nitrate absorption curve. However, this is insignificant at a lower concentration.
3.6 The mass transfer rate of HONO in the presence of halides
The linear fitting results are shown in Figure 7. Clearly,
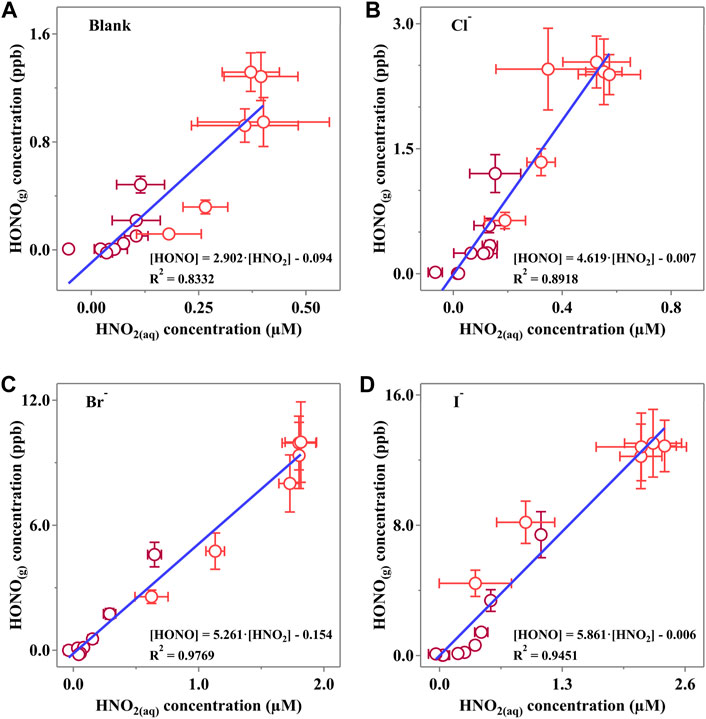
Figure 7. Linear correlation of the HONO(g) concentration and corresponding HNO2(aq) concentration of (A) Blank, (B) Cl, (C) Br and (D) I experiments. Dark red points represent data measured when the light is off, while red points reveal the data when photodissociation of NO3− occurs. Horizontal error bars were calculated via at least three independent measurements, while vertical bars were derived from the measurement status of LOPAP. All the error bars present 1-
It is confirmed that the halides would reduce the surface energy and consequently lead to a more active surface with more “mass exchange sites.” Interestingly, we also found that the calculated
4 Conclusion and environmental implication
The coexistence of halide ions and nitrates is commonly observed in aerosols from the marine boundary layer and on the surface of ice and snow in polar regions, which are typically low-NOX environments. Thus, the photolysis of nitrates coexisting with halides is expected to significantly contribute to local NOX levels and HONO, which would further influence the atmospheric oxidation capacity. In this study, the coexisting system was irradiated under simulated sunlight from a filtered Xe lamp, and the concentrations of gaseous products (HONO and NO2), as well as the solvated product (NO2−), were simultaneously measured. The presence of halides significantly increased the total release of nitrogenous products, particularly the generation of N(III) in both the aqueous and atmospheric phases, acting as a vital NOX source in the marine boundary layer and on the surface of ice and snow. The generation and release of nitrogenous products were found to be highly dependent on the [X−]/[NO3−] ratio in solution.
Experiments removing O2 confirmed that oxygen also participates in the transformation of photolysis products. Based on experiments containing ·OH scavengers, it is suggested that activated halides lead to further reactions, consequently resulting in a faster rate of N(III) generation. These phenomena underscore the significant role of radical reactions in the photolysis of nitrates containing halides.
Halide ions tend to accumulate at the air/water interface along with nitrate ions. As a result, the quantum yield associated with higher levels of surface components with incomplete solvent cages is greater than in the bulk, following the same order as the strength of its surface effect (Nissenson et al., 2006; Nissenson et al., 2010). Additionally, the varied rates of reactions involving halides contribute to further transformation of primary products from nitrate photolysis, leading to different product distributions. The presence of surface-accumulated halides also magnifies the release rate of aqueous nitrite. Specifically, the coexistence of Cl−, Br−, and I− has been shown to enhance the HONO transfer rate by factors of 0.67 ± 0.58, 0.95 ± 0.68, and 1.27 ± 0.74, respectively.
Overall, the coexistence of halides significantly enhances both the photolysis rate of nitrate and the evaporation rate of nitrite in solution. Therefore, in aerosols of the marine boundary layer and on surfaces of ice and snow in polar regions, this process may dominate the local NOX levels and the atmospheric oxidation capacity.
It should be emphasized that, although the determined nitrite concentration occupied most N(III) in the system, the evaporation speed of HONO is high enough to maintain a gas–liquid equilibrium within a small scale of range. Supplementary Table S2 shows that the equilibrium time of HONO/HNO2 was 8.87, 4.86, 4.04, and 3.09 s for blank, Cl−, Br−, and I−, respectively. Thus, HONO still exists as a highly evaporable compound with continuous release from the condensed phase among the air flow. However, the “highly soluble compound” indicated that when the equilibrium was satisfied, most N(III) was hosted in solution, which is a description from a thermodynamics perspective.
Data availability statement
The original contributions presented in the study are included in the article/Supplementary Material; further inquiries can be directed to the corresponding author.
Author contributions
YZ: writing–original draft, writing–review and editing, data curation, formal analysis, and methodology. CL: writing–original draft and writing–review and editing. XT: supervision and writing–original draft. WH: data curation, software, and writing–original draft. YL: writing–review and editing. HF: data curation, funding acquisition, methodology, supervision, writing–original draft, and writing–review and editing.
Funding
The authors declare that financial support was received for the research, authorship, and/or publication of this article. This work was supported by the National Key R&D Program of China (Grant No. 2022YFC3701102), the National Natural Science Foundation of China (Grant Nos 22376029, 22176038, 91744205, and 21777025), and the Natural Science Foundation of Shanghai City (Grant No. 22ZR1404700).
Conflict of interest
The authors declare that the research was conducted in the absence of any commercial or financial relationships that could be construed as a potential conflict of interest.
Publisher’s note
All claims expressed in this article are solely those of the authors and do not necessarily represent those of their affiliated organizations, or those of the publisher, the editors, and the reviewers. Any product that may be evaluated in this article, or claim that may be made by its manufacturer, is not guaranteed or endorsed by the publisher.
Supplementary material
The Supplementary Material for this article can be found online at: https://www.frontiersin.org/articles/10.3389/fenvs.2024.1466512/full#supplementary-material
References
Allen, M. P., and Tildesley, D. J. (2017). Computer simulation of liquids. New York, NY: Oxford University Press.
Baergen, A. M., and Donaldson, D. J. (2013). Photochemical renoxification of nitric acid on real urban grime. Environ. Sci. Technol. 47 (2), 815–820. doi:10.1021/es3037862
Bao, F. X., Li, M., Zhang, Y., Chen, C. C., and Zhao, J. C. (2018). Photochemical aging of Beijing urban PM2.5: HONO production. Environ. Sci. Technol. 52 (11), 6309–6316. doi:10.1021/acs.est.8b00538
Benedict, K. B., McFall, A. S., and Anastasio, C. (2017). Quantum yield of nitrite from the photolysis of aqueous nitrate above 300 nm. Environ. Sci. Technol. 51 (8), 4387–4395. doi:10.1021/acs.est.6b06370
Bertozzi, G., and Sternheim, G. (1964). Surface tension of liquid nitrate systems. J. Phys. Chem. 68 (10), 2908–2912. doi:10.1021/j100792a028
Blaszczak-Boxe, C. S., and Saiz-Lopez, A. (2018). Nitrate photolysis in ice and snow: a critical review of its multiphase chemistry. Atmos. Environ. 193, 224–241. doi:10.1016/j.atmosenv.2018.09.002
Bogdan, A., Kulmala, M., MacKenzie, A., and Laaksonen, A. (2003). Study of finely divided aqueous systems as an aid to understanding the surface chemistry of polar stratospheric clouds: case of HCl/H2O and HNO3/HCl/H2O systems. J. Geophys. Res. Atmos. 108 (D10). doi:10.1029/2002jd002606
Brown, M. A., Winter, B., Faubel, M., and Hemminger, J. C. (2009). Spatial distribution of nitrate and nitrite anions at the liquid/vapor interface of aqueous solutions. J. Am. Chem. Soc. 131 (24), 8354–8355. doi:10.1021/ja901791v
Bulman, D. M., Mezyk, S. P., and Remucal, C. K. (2019). The impact of pH and irradiation wavelength on the production of reactive oxidants during chlorine photolysis. Environ. Sci. Technol. 53 (8), 4450–4459. doi:10.1021/acs.est.8b07225
Buxton, G., and Subhani, M. (1972). Radiation chemistry and photochemistry of oxychlorine ions. Part 2: photodecomposition of aqueous solutions of hypochlorite ions. J. Chem. Soc., Faraday Trans. 1 68, 958–969. doi:10.1039/f19726800958
Cao, L., Sihler, H., Platt, U., and Gutheil, E. (2014). Numerical analysis of the chemical kinetic mechanisms of ozone depletion and halogen release in the polar troposphere. Atmos. Chem. Phys. 14 (7), 3771–3787. doi:10.5194/acp-14-3771-2014
Chameides, W. L. (1984). The photochemistry of a remote marine stratiform cloud. J. Geophys. Res. Atmos. 89 (Nd3), 4739–4755. doi:10.1029/jd089id03p04739
Cheng, J., Vecitis, C. D., Hoffmann, M., and Colussi, A. (2006). Experimental anion affinities for the air/water interface. J. Phys. Chem. B 110 (51), 25598–25602. doi:10.1021/jp066197k
Cheung, J., Li, Y., Boniface, J., Shi, Q., Davidovits, P., Worsnop, D., et al. (2000). Heterogeneous interactions of NO2 with aqueous surfaces. J. Phys. Chem. A 104 (12), 2655–2662. doi:10.1021/jp992929f
Collins, D. B., Hems, R. F., Zhou, S., Wang, C., Grignon, E., Alavy, M., et al. (2018). Evidence for gas–surface equilibrium control of indoor nitrous acid. Environ. Sci. Technol. 52 (21), 12419–12427. doi:10.1021/acs.est.8b04512
Cripps, R. C., Jackel, B., and Guntay, S. (2011). On the radiolysis of iodide, nitrate and nitrite ions in aqueous solution: an experimental and modelling study. Nucl. Eng. Des. 241 (8), 3333–3347. doi:10.1016/j.nucengdes.2011.06.031
Cui, L., Li, R., Fu, H., Li, Q., Zhang, L., George, C., et al. (2019). Formation features of nitrous acid in the offshore area of the East China sea. Sci. Total Environ. 682, 138–150. doi:10.1016/j.scitotenv.2019.05.004
Cui, L., Li, R., Fu, H., Meng, Y., Zhao, Y., Li, Q., et al. (2021). Nitrous acid emission from open burning of major crop residues in Mainland China. Atmos. Environ. 244, 117950. doi:10.1016/j.atmosenv.2020.117950
Cui, L., Li, R., Zhang, Y., Meng, Y., Fu, H., and Chen, J. (2018). An observational study of nitrous acid (HONO) in Shanghai, China: the aerosol impact on HONO formation during the haze episodes. Sci. Total Environ. 630, 1057–1070. doi:10.1016/j.scitotenv.2018.02.063
Cwiertny, D. M., Baltrusaitis, J., Hunter, G. J., Laskin, A., Scherer, M. M., and Grassian, V. H. (2008). Characterization and acid-mobilization study of iron-containing mineral dust source materials. J. Geophys. Res. Atmos. 113 (D5). doi:10.1029/2007jd009332
Dall’Osto, M., Beddows, D. C., Kinnersley, R. P., Harrison, R. M., Donovan, R. J., and Heal, M. R. (2004). Characterization of individual airborne particles by using aerosol time-of-flight mass spectrometry at Mace Head, Ireland. J. Geophys. Res. Atmos. 109 (D21). doi:10.1029/2004jd004747
Daniels, M. (1969). Radiation chemistry of the aqueous nitrate system. III. Pulse electron radiolysis of concentrated sodium nitrate solutions. J. Phys. Chem. 73 (11), 3710–3717. doi:10.1021/j100845a027
Das, R., Dutta, B. K., Maurino, V., Vione, D., and Minero, C. (2009). Suppression of inhibition of substrate photodegradation by scavengers of hydroxyl radicals: the solvent-cage effect of bromide on nitrate photolysis. Environ. Chem. Lett. 7, 337–342. doi:10.1007/s10311-008-0176-8
Fiedler, S. E., Hese, A., and Ruth, A. A. (2003). Incoherent broad-band cavity-enhanced absorption spectroscopy. Chem. Phys. Lett. 371 (3-4), 284–294. doi:10.1016/s0009-2614(03)00263-x
Forsyth, J. E., Zhou, P., Mao, Q., Asato, S. S., Meschke, J. S., and Dodd, M. C. (2013). Enhanced inactivation of Bacillus subtilis spores during solar photolysis of free available chlorine. Environ. Sci. Technol. 47 (22), 12976–12984. doi:10.1021/es401906x
Francisco, J. S., Hand, M. R., and Williams, I. H. (1996). Ab initio study of the electronic spectrum of HOBr. J. Phys. Chem. 100 (22), 9250–9253. doi:10.1021/jp9529782
Gherman, T., Venables, D. S., Vaughan, S., Orphal, J., and Ruth, A. A. (2008). Incoherent broadband cavity-enhanced absorption spectroscopy in the near-ultraviolet: application to HONO and NO2. Environ. Sci. Technol. 42 (3), 890–895. doi:10.1021/es0716913
Goldstein, S., and Rabani, J. (2007). Mechanism of nitrite formation by nitrate photolysis in aqueous solutions: the role of peroxynitrite, nitrogen dioxide, and hydroxyl radical. J. Am. Chem. Soc. 129 (34), 10597–10601. doi:10.1021/ja073609+
Grebel, J. E., Pignatello, J. J., and Mitch, W. A. (2010). Effect of halide ions and carbonates on organic contaminant degradation by hydroxyl radical-based advanced oxidation processes in saline waters. Environ. Sci. Technol. 44 (17), 6822–6828. doi:10.1021/es1010225
Guo, K., Wu, Z., Shang, C., Yao, B., Hou, S., Yang, X., et al. (2017). Radical chemistry and structural relationships of PPCP degradation by UV/chlorine treatment in simulated drinking water. Environ. Sci. Technol. 51 (18), 10431–10439. doi:10.1021/acs.est.7b02059
Hong, A. C., Wren, S. N., and Donaldson, D. (2013). Enhanced surface partitioning of nitrate anion in aqueous bromide solutions. J. Phys. Chem. Lett. 4 (17), 2994–2998. doi:10.1021/jz4015772
Huang, G., Zhou, X. L., Deng, G. H., Qiao, H. C., and Civerolo, K. (2002). Measurements of atmospheric nitrous acid and nitric acid. Atmos. Environ. 36 (13), 2225–2235. doi:10.1016/s1352-2310(02)00170-x
Huie, R. E. (1994). The reaction kinetics of NO2. Toxicology 89 (3), 193–216. doi:10.1016/0300-483x(94)90098-1
Huie, R. E., and Neta, P. (1986). Kinetics of one-electron transfer reactions involving chlorine dioxide and nitrogen dioxide. J. Phys. Chem. 90 (6), 1193–1198. doi:10.1021/j100278a046
Jankowski, J. J., Kieber, D. J., and Mopper, K. (1999). Nitrate and nitrite ultraviolet actinometers. Photochem. Photobiol. 70 (3), 319–328. doi:10.1562/0031-8655(1999)070<0319:nanua>2.3.co;2
Jankowski, J. J., Kieber, D. J., Mopper, K., and Neale, P. J. (2000). Development and intercalibration of ultraviolet solar actinometers. Photochem. Photobiol. 71 (4), 431–440. doi:10.1562/0031-8655(2000)071<0431:daious>2.0.co;2
Jayson, G., Parsons, B., and Swallow, A. J. (1973). Some simple, highly reactive, inorganic chlorine derivatives in aqueous solution. Their formation using pulses of radiation and their role in the mechanism of the Fricke dosimeter. J. Chem. Soc., Faraday Trans. 1 69, 1597–1607. doi:10.1039/f19736901597
Jungwirth, P., and Tobias, D. J. (2000). Surface effects on aqueous ionic solvation: a molecular dynamics simulation study of NaCl at the air/water interface from infinite dilution to saturation. J. Phys. Chem. B 104 (32), 7702–7706. doi:10.1021/jp000941y
Jungwirth, P., and Tobias, D. J. (2001). Molecular structure of salt solutions: a new view of the interface with implications for heterogeneous atmospheric chemistry. J. Phys. Chem. B 105 (43), 10468–10472. doi:10.1021/jp012750g
Jungwirth, P., and Tobias, D. J. (2002a). Chloride anion on aqueous clusters, at the air−water interface, and in liquid water: solvent effects on Cl-polarizability. J. Phys. Chem. A 106 (2), 379–383. doi:10.1021/jp012059d
Jungwirth, P., and Tobias, D. J. (2002b). Ions at the air/water interface. J. Phys. Chem. B 106, 6361–6373. ACS Publications. doi:10.1021/jp020242g
Jungwirth, P., and Tobias, D. J. (2006). Specific ion effects at the air/water interface. Chem. Rev. 106 (4), 1259–1281. doi:10.1021/cr0403741
Kim, M. J., Farmer, D. K., and Bertram, T. H. (2014). A controlling role for the air−sea interface in the chemical processing of reactive nitrogen in the coastal marine boundary layer. Proc. Natl. Acad. Sci. 111 (11), 3943–3948. doi:10.1073/pnas.1318694111
Knipping, E., Lakin, M., Foster, K., Jungwirth, P., Tobias, D., Gerber, R., et al. (2000). Experiments and simulations of ion-enhanced interfacial chemistry on aqueous NaCl aerosols. Science 288 (5464), 301–306. doi:10.1126/science.288.5464.301
Koop, T., Kapilashrami, A., Molina, L. T., and Molina, M. J. (2000). Phase transitions of sea-salt/water mixtures at low temperatures: implications for ozone chemistry in the polar marine boundary layer. J. Geophys. Res. Atmos. 105 (D21), 26393–26402. doi:10.1029/2000jd900413
Lengyel, I., Nagy, I., and Bazsa, G. (1989). Kinetic study of the autocatalytic nitric acid-bromide reaction and its reverse, the nitrous acid-bromine reaction. J. Phys. Chem. 93 (7), 2801–2807. doi:10.1021/j100344a021
Li, Q., Ma, S., Liu, Y., Wu, X., Fu, H., Tu, X., et al. (2024). Phase state regulates photochemical HONO production from NaNO3/dicarboxylic acid mixtures. Environ. Sci. Technol. 58 (17), 7516–7528. doi:10.1021/acs.est.3c10980
Lin, K.-C., Muthiah, B., Chang, H.-P., Kasai, T., and Chang, Y.-P. (2021). Halogen-related photodissociation in atmosphere: characterisation of atomic halogen, molecular halogen, and hydrogen halide. Int. Rev. Phys. Chem. 40 (1), 1–50. doi:10.1080/0144235x.2020.1822590
Mack, J., and Bolton, J. R. (1999). Photochemistry of nitrite and nitrate in aqueous solution: a review. J. Photochem. Photobiol. A Chem. 128 (1-3), 1–13. doi:10.1016/s1010-6030(99)00155-0
Minaev, B. F. (1999). The Singlet−Triplet absorption and photodissociation of the HOCl, HOBr, and HOI molecules calculated by the MCSCF quadratic response method. J. Phys. Chem. A 103 (36), 7294–7309. doi:10.1021/jp990203d
Minakata, D., Kamath, D., and Maetzold, S. (2017). Mechanistic insight into the reactivity of chlorine-derived radicals in the aqueous-phase UV–chlorine advanced oxidation process: quantum mechanical calculations. Environ. Sci. Technol. 51 (12), 6918–6926. doi:10.1021/acs.est.7b00507
Moorcroft, M. J., Davis, J., and Compton, R. G. (2001). Detection and determination of nitrate and nitrite: a review. Talanta 54 (5), 785–803. doi:10.1016/s0039-9140(01)00323-x
Mopper, K., and Zhou, X. (1990). Hydroxyl radical photoproduction in the sea and its potential impact on marine processes. Science 250 (4981), 661–664. doi:10.1126/science.250.4981.661
Mulazzani, Q. G., and Buxton, G. V. (2006). On the kinetics and mechanism of the oxidation of I by OH/O in alkaline aqueous solution. Chem. Phys. Lett. 421 (1-3), 261–265. doi:10.1016/j.cplett.2006.01.088
Neta, P., and Huie, R. E. (1986). Rate constants for reactions of nitrogen oxide (NO3) radicals in aqueous solutions. J. Phys. Chem. 90 (19), 4644–4648. doi:10.1021/j100410a035
Nissenson, P., Dabdub, D., Das, R., Maurino, V., Minero, C., and Vione, D. (2010). Evidence of the water-cage effect on the photolysis of NO3− and FeOH2+. Implications of this effect and of H2O2 surface accumulation on photochemistry at the air−water interface of atmospheric droplets. Atmos. Environ. 44 (38), 4859–4866. doi:10.1016/j.atmosenv.2010.08.035
Nissenson, P., Knox, C. J. H., Finlayson-Pitts, B. J., Phillips, L. F., and Dabdub, D. (2006). Enhanced photolysis in aerosols: evidence for important surface effects. Phys. Chem. Chem. Phys. 8 (40), 4700–4710. doi:10.1039/b609219e
Ottosson, N., Heyda, J., Wernersson, E., Pokapanich, W., Svensson, S., Winter, B., et al. (2010). The influence of concentration on the molecular surface structure of simple and mixed aqueous electrolytes. Phys. Chem. Chem. Phys. 12 (36), 10693–10700. doi:10.1039/c0cp00365d
Pandit, S., and Grassian, V. H. (2022). Gas-phase nitrous acid (HONO) is controlled by surface interactions of adsorbed nitrite (NO2−) on common indoor material surfaces. Environ. Sci. Technol. 56 (17), 12045–12054. doi:10.1021/acs.est.2c02042
Park, J. Y., and Lee, Y. N. (1988). Solubility and decomposition kinetics of nitrous-acid in aqueous-solution. J. Phys. Chem. 92 (22), 6294–6302. doi:10.1021/j100333a025
Peng, X., Wang, T., Wang, W., Ravishankara, A., George, C., Xia, M., et al. (2022). Photodissociation of particulate nitrate as a source of daytime tropospheric Cl2. Nat. Commun. 13 (1), 939. doi:10.1038/s41467-022-28383-9
Piatkowski, L., Zhang, Z., Backus, E. H., Bakker, H. J., and Bonn, M. (2014). Extreme surface propensity of halide ions in water. Nat. Commun. 5 (1), 4083. doi:10.1038/ncomms5083
Pignatello, J. J. (1992). Dark and photoassisted iron (3+)-catalyzed degradation of chlorophenoxy herbicides by hydrogen peroxide. Environ. Sci. Technol. 26 (5), 944–951. doi:10.1021/es00029a012
Plewa, M. J., Muellner, M. G., Richardson, S. D., Fasano, F., Buettner, K. M., Woo, Y.-T., et al. (2008). Occurrence, synthesis, and mammalian cell cytotoxicity and genotoxicity of haloacetamides: an emerging class of nitrogenous drinking water disinfection byproducts. Environ. Sci. Technol. 42 (3), 955–961. doi:10.1021/es071754h
Poskrebyshev, G. A., Huie, R. E., and Neta, P. (2003). The rate and equilibrium constants for the reaction NO3· + Cl- ⇄ NO3- + Cl· in aqueous solutions. J. Phys. Chem. A 107 (12), 1964–1970. doi:10.1021/jp0215724
Pratt, P. F., Nithipatikom, K., and Campbell, W. B. (1995). Simultaneous determination of nitrate and nitrite in biological samples by multichannel flow injection analysis. Anal. Biochem. 231 (2), 383–386. doi:10.1006/abio.1995.0067
Quan, X., and Fry, E. S. (1995). Empirical equation for the index of refraction of seawater. Appl. Opt. 34 (18), 3477–3480. doi:10.1364/ao.34.003477
Ray, A. K., and Bhanti, D. D. (1997). Effect of optical resonances on photochemical reactions in microdroplets. Appl. Opt. 36 (12), 2663–2674. doi:10.1364/ao.36.002663
Reeser, D. I., Kwamena, N.-O. A., and Donaldson, D. J. (2013). Effect of organic coatings on gas-phase nitrogen dioxide production from aqueous nitrate photolysis. J. Phys. Chem. C 117 (43), 22260–22267. doi:10.1021/jp401545k
Richards, N. K., and Finlayson-Pitts, B. J. (2012). Production of gas phase NO2 and halogens from the photochemical oxidation of aqueous mixtures of sea salt and nitrate ions at room temperature. Environ. Sci. Technol. 46 (19), 10447–10454. doi:10.1021/es300607c
Richards, N. K., Wingen, L. M., Callahan, K. M., Nishino, N., Kleinman, M. T., Tobias, D. J., et al. (2011). Nitrate ion photolysis in thin water films in the presence of bromide ions. J. Phys. Chem. A 115 (23), 5810–5821. doi:10.1021/jp109560j
Richards-Henderson, N. K., Callahan, K. M., Nissenson, P., Nishino, N., Tobias, D. J., and Finlayson-Pitts, B. J. (2013). Production of gas phase NO2 and halogens from the photolysis of thin water films containing nitrate, chloride and bromide ions at room temperature. Phys. Chem. Chem. Phys. 15 (40), 17636–17646. doi:10.1039/c3cp52956h
Ridnour, L. A., Sim, J. E., Hayward, M. A., Wink, D. A., Martin, S. M., Buettner, G. R., et al. (2000). A spectrophotometric method for the direct detection and quantitation of nitric oxide, nitrite, and nitrate in cell culture media. Anal. Biochem. 281 (2), 223–229. doi:10.1006/abio.2000.4583
Riordan, E., Minogue, N., Healy, D., O’Driscol, P., and Sodeau, J. R. (2005). Spectroscopic and optimization modeling study of nitrous acid in aqueous solution. J. Phys. Chem. A 109 (5), 779–786. doi:10.1021/jp040269v
Roberts, J. M., Osthoff, H. D., Brown, S. S., and Ravishankara, A. (2008). N2O5 oxidizes chloride to Cl2 in acidic atmospheric aerosol. Science 321 (5892), 1059. doi:10.1126/science.1158777
Roca, M., Zahardis, J., Bone, J., El-Maazawi, M., and Grassian, V. H. (2008). 310 nm irradiation of atmospherically relevant concentrated aqueous nitrate solutions: nitrite production and quantum yields. J. Phys. Chem. A 112 (51), 13275–13281. doi:10.1021/jp809017b
Salvador, P., Curtis, J. E., Tobias, D. J., and Jungwirth, P. (2003). Polarizability of the nitrate anion and its solvation at the air/water interface. Phys. Chem. Chem. Phys. 5 (17), 3752–3757. doi:10.1039/b304537d
Sander, R. (2023). Compilation of Henry’s law constants (version 5.0.0) for water as solvent. Atmos. Chem. Phys. 23 (19), 10901–12440. doi:10.5194/acp-23-10901-2023
Scharko, N. K., Berke, A. E., and Raff, J. D. (2014). Release of nitrous acid and nitrogen dioxide from nitrate photolysis in acidic aqueous solutions. Environ. Sci. Technol. 48 (20), 11991–12001. doi:10.1021/es503088x
Schwartz, S. (1984). “Gas-aqueous reactions of sulfur and nitrogen oxides in liquid-water clouds,” in SO2, NO and NO2 oxidation Mechanisms: atmospheric considerations. Editor J. G. Calvert (Boston: Butterworth), 173–208.
Schwartz, S., and White, W. (1981). Solubility equilibria of the nitrogen oxides and oxyacids in dilute aqueous solution. Adv. Environ. Sci. Eng.;(United States) 4.
Schweitzer, F., Mirabel, P., and George, C. (1998). Multiphase chemistry of N2O5, ClNO2, and BrNO2. J. Phys. Chem. A 102 (22), 3942–3952. doi:10.1021/jp980748s
Seinfeld, J. H., and Pandis, S. N. (2016). Atmospheric chemistry and physics: from air pollution to climate change. West Sussex County, United Kingdom: John Wiley & Sons.
Shi, Q. W., Tao, Y., Krechmer, J. E., Heald, C. L., Murphy, J. G., Kroll, J. H., et al. (2021). Laboratory investigation of renoxification from the photolysis of inorganic particulate nitrate. Environ. Sci. Technol. 55 (2), 854–861. doi:10.1021/acs.est.0c06049
Simpson, W. R., Brown, S. S., Saiz-Lopez, A., Thornton, J. A., and von Glasow, R. (2015). Tropospheric halogen chemistry: sources, cycling, and impacts. Chem. Rev. 115 (10), 4035–4062. doi:10.1021/cr5006638
Thomas, J. L., Roeselová, M., Dang, L. X., and Tobias, D. J. (2007). Molecular dynamics simulations of the solution−air interface of aqueous sodium nitrate. J. Phys. Chem. A 111 (16), 3091–3098. doi:10.1021/jp0683972
Tobias, D. J., Jungwirth, P., and Parrinello, M. (2001). Surface solvation of halogen anions in water clusters: an ab initio molecular dynamics study of the Cl−(H2O)6 complex. J. Chem. Phys. 114 (16), 7036–7044. doi:10.1063/1.1360200
Wang, X., Dalton, E. Z., Payne, Z. C., Perrier, S., Riva, M., Raff, J. D., et al. (2020). Superoxide and nitrous acid production from nitrate photolysis is enhanced by dissolved aliphatic organic matter. Environ. Sci. Technol. Lett. 8 (1), 53–58. doi:10.1021/acs.estlett.0c00806
Wang, X., Jacob, D. J., Downs, W., Zhai, S., Zhu, L., Shah, V., et al. (2021). Global tropospheric halogen (Cl, Br, I) chemistry and its impact on oxidants. Atmos. Chem. Phys. 21 (18), 13973–13996. doi:10.5194/acp-21-13973-2021
Wang, X., Yang, X., Wang, L., and Nicholas, J. B. (2002). Photodetachment and theoretical study of free and water-solvated nitrate anions, NO3−(H2O)n (n=0–6). J. Chem. Phys. 116 (2), 561–570. doi:10.1063/1.1427067
Wang, Z., Wang, T., Fu, H., Zhang, L., Tang, M., George, C., et al. (2019). Enhanced heterogeneous uptake of sulfur dioxide on mineral particles through modification of iron speciation during simulated cloud processing. Atmos. Chem. Phys. 19 (19), 12569–12585. doi:10.5194/acp-19-12569-2019
Wayne, R. P., Barnes, I., Biggs, P., Burrows, J., Canosa-Mas, C., Hjorth, J., et al. (1991). The nitrate radical: physics, chemistry, and the atmosphere. General Top. 25 (1), 1–203. doi:10.1016/0960-1686(91)90192-a
Wick, C. D., Dang, L. X., and Jungwirth, P. (2006). Simulated surface potentials at the vapor-water interface for the KCl aqueous electrolyte solution. J. Chem. Phys. 125 (2), 24706. doi:10.1063/1.2218840
Wingen, L. M., Moskun, A. C., Johnson, S. N., Thomas, J. L., Roeselová, M., Tobias, D. J., et al. (2008). Enhanced surface photochemistry in chloride–nitrate ion mixtures. Phys. Chem. Chem. Phys. 10 (37), 5668–5677. doi:10.1039/b806613b
Yang, Y., and Pignatello, J. J. (2017). Participation of the halogens in photochemical reactions in natural and treated waters. Molecules 22 (10), 1684. doi:10.3390/molecules22101684
Yang, Y., Pignatello, J. J., Ma, J., and Mitch, W. A. (2014). Comparison of halide impacts on the efficiency of contaminant degradation by sulfate and hydroxyl radical-based advanced oxidation processes (AOPs). Environ. Sci. Technol. 48 (4), 2344–2351. doi:10.1021/es404118q
Ye, C. X., Gao, H. L., Zhang, N., and Zhou, X. L. (2016a). Photolysis of nitric acid and nitrate on natural and artificial surfaces. Environ. Sci. Technol. 50 (7), 3530–3536. doi:10.1021/acs.est.5b05032
Ye, C. X., Zhang, N., Gao, H. L., and Zhou, X. L. (2017). Photolysis of particulate nitrate as a source of HONO and NOx. Environ. Sci. Technol. 51 (12), 6849–6856. doi:10.1021/acs.est.7b00387
Ye, C. X., Zhou, X. L., Pu, D., Stutz, J., Festa, J., Spolaor, M., et al. (2016b). Rapid cycling of reactive nitrogen in the marine boundary layer. Nature 532 (7600), 489–491. doi:10.1038/nature17195
Zehavi, D., and Rabani, J. (1972). Oxidation of aqueous bromide ions by hydroxyl radicals. Pulse radiolytic investigation. J. Phys. Chem. 76 (3), 312–319. doi:10.1021/j100647a006
Keywords: HONO, nitrate photolysis, photolysis rate constant, halide, transfer rate
Citation: Zhao Y, Liu C, Tu X, Huang W, Liu Y and Fu H (2024) Enhanced photochemical formation of active nitrogen species from aqueous nitrate in the presence of halide ions. Front. Environ. Sci. 12:1466512. doi: 10.3389/fenvs.2024.1466512
Received: 18 July 2024; Accepted: 31 July 2024;
Published: 20 August 2024.
Edited by:
Rui Li, East China Normal University, ChinaReviewed by:
Changlun Tong, Zhejiang University, ChinaWeigang Wang, Chinese Academy of Sciences (CAS), China
Mingjin Tang, Chinese Academy of Sciences (CAS), China
Copyright © 2024 Zhao, Liu, Tu, Huang, Liu and Fu. This is an open-access article distributed under the terms of the Creative Commons Attribution License (CC BY). The use, distribution or reproduction in other forums is permitted, provided the original author(s) and the copyright owner(s) are credited and that the original publication in this journal is cited, in accordance with accepted academic practice. No use, distribution or reproduction is permitted which does not comply with these terms.
*Correspondence: Hongbo Fu, ZnVoYkBmdWRhbi5lZHUuY24=