 Zou Jia-Wen1
 Miaoshuo2*
- 1School of Economics and Management, Changsha Institute of Technology, Changsha, China
- 2School of International Business, Hunan University of Information Technology, Changsha, China
The influencing factors of corporate greenwashing have consistently captivated scholarly attention. Drawing from Upper Echelons Theory and Strategic Recognition Theory, this study proposes that the green cognition of top management plays a critical role in shaping greenwashing practices. Furthermore, it is argued that this relationship may be moderated by factors such as political connections and the stringency of environmental regulations. To clarify these issues, this study utilizes a panel model with samples of Chinese listed firms that contain fundamental data and variables from 2012 to 2020. The results show that: 1) TMT environmental cognition restrain greenwashing behavior significantly by promoting genuine environmental efforts. 2) The inhibitory effect of TMT environmental cognition on greenwashing behavior is more pronounced in firms without political connections than those with political connections. 3) TMT environmental cognition has a significantly positive impact on environmental disclosure scores for private owned or political connection firms, except for state-owned or no political connection firms. 4) The level of political connection of firms and the intensity of environmental regulations have respectively strengthened or weakened the link between TMT environmental cognition and greenwashing behavior.
1 Introduction
In recent years, sustainable development has increasingly gained acceptance by the international community. The green behavior of firms is a key factor in achieving global sustainable development goals, naturally becoming a focus of public and government attention. An observable fact is that the public’s expectations for green firms and the government’s environmental regulations on firms are both increasing year by year. In response to this situation, many firms have taken a series of environmental actions and emphasized their own environmental friendliness. However, there may be an irreconcilable contradiction between achieving green development goals and maximizing profitability, leading to greenwashing behavior of some firms.
Greenwashing occurs when a firm promotes itself as eco-friendly but spends more time and money on advertising its environmental friendliness than on developing genuine sustainability efforts (Laufer, 2003; Zhang et al., 2023). These firms attempt to gain the favor of consumers or evade environmental regulations by excessively or deceptively promoting their own environmental characteristics. Because of greenwashing behavior, some studies have attempted to explain the causes (Lyon and Montgomery, 2015; Pizzetti et al., 2021), consequences (Nyilasy et al., 2014; Hahn et al., 2015), and governance measures related to it, aiming to help government agencies find more effective ways to enhance sustainable development and address businesses’ greenwashing practices (Wang et al., 2023).
In reality, the behavior of any organization is closely related to its decision-makers and managers. The Upper Echelons Theory posits that firms mirror the will of top management team (TMT). Variances in individual background characteristics can lead to differences in cognitive structures, risk preferences and other psychological dimensions. Therefore, when managers face external situations and choices, their bounded rationality will lead them to make highly personalized interpretations and decisions, which then influence their strategic decision-making and firm behavior, and ultimately affect firm performance (Hambrick and Mason, 1984). Therefore, some studies attempt to explain the behavior of firms from the personal characteristics of decision makers and managers (Kind et al., 2023; Mukherjee and Sen, 2022; Shan et al., 2023).
Greenwashing behavior is also a type of firm behavior in essence. The Upper Echelons Theory suggests that the traits of TMT members are likely to have an impact on firm greenwashing. This paper investigates whether TMT environmental cognition will affect greenwashing, especially in the current situation where there is a controversy over whether green behavior can improve the economic benefits of firms (Li, et al., 2022), and whether Strategic Sensemaking Theory still have sufficient explanatory power in this context. If TMT environmental cognition has an impact on greenwashing, what are the attributes of this impact? Considering China’s extensive governmental framework, is the relationship between TMT environmental cognition and greenwashing still influenced by the political connection of firms and the intensity of environmental regulations?
In order to identify the causal relationship between TMT environmental cognition and greenwashing behavior, this study utilizes a panel model with samples of Chinese listed firms that contain fundamental data and variables from 2012 to 2020, and finds that the TMT environmental cognition diminishes greenwashing. Furthermore, it has a significantly positive effect on real performance scores but lacks a significant impact on on disclosure scores. In addition, heterogeneity effects exist among firms of different ownership and political connection. TMT environmental cognition has a significantly positive impact on environmental disclosure scores for private owned or political connection firms, but not for state-owned or no political connection firms. Moreover, the level of political connection of firms and the intensity of environmental regulations have respectively strengthened or weakened the link between TMT environmental cognition and greenwashing behavior.
This paper offers several contributions: Firstly, this study enriches the Upper Echelons Theory and Strategic Sensemaking Theory by exploring additional impact outcomes of TMT cognition. Previous studies have generally focused on the impact of TMT cognition on financial performance (Henry and Dietz, 2012; Yi et al., 2022) and innovation performance (Raffaelli et al., 2019; Wang et al., 2022), paying less attention to environmental strategy. Secondly, this study enriches the influencing factors of greenwashing. Previous studies have focused on external factors impacting on greenwashing, such as social media (Lyon and Montgomery, 2013), religiosity (Gomes et al., 2023), government regulations (Sun and Zhang, 2019), and stakeholder pressure (Testa et al., 2018), while few studies have focused on TMT. Finally, this study demystifies the relationship between TMT cognition and greenwashing by revealing the moderating effect of corporate political connection level and environmental regulatory intensity.
The remainder of the paper is structured as follows: Section two reviews relevant literature and presents the hypotheses; Sections three and four detail the data, model specifications and findings; section five presents robustness tests; and lastly, section six summarizes the study’s key conclusions and discusses their practical and societal implications.
2 Literature review and hypothesis development
2.1 TMT green cognition and greenwashing behavior
Over the years, a lot of studies have been deeply engaged in enhancing our understanding of the managerial outcomes related to TMT personality. These studies mainly inspired by the Upper Echelons Theory which posits that corporate strategies are greatly influenced by the cognitive foundations of its TMT (Bromiley and Rau, 2016; Neely Jr et al., 2020). And the theory has been applied to empirically investigate a number of strategic outcomes, such as innovation, digital transformation, financial health (Bedford et al., 2022; Attah-Boakye et al., 2023; Chen et al., 2023). Furthermore, some research examines how CEO cognition styles and metacognitive experiences affect decision-making. (Plambeck and Weber, 2009; Mitchell et al., 2011). Additionally, a modest body of research on TMT investigates how organizational outcomes are impacted by TMT cognitive diversity, cognitive representations, and the complexity of TMTs’ cognitive model of the domestic industry. (Alexiev et al., 2010; Wei and Wu, 2013). These studies directly or indirectly illustrate that TMT cognition influence a variety of corporate outcomes through strategic decisions.
Greenwashing behavior is also a kind of corporate outcomes, which is the result of environmental strategic decisions (Yang et al., 2020). Therefore, TMT cognition has an impact on greenwashing through strategic decisions. According to theory of bounded rationality, strategic decisions are often characterized by the decision makers’ bounded rationality (Abatecola et al., 2013), which is influenced by decision makers’ cognition. So the impact of TMT cognition on greenwashing can be explained from the perspective of bounded rationality.
TMTs with strong environmental cognition are more likely to recognize the harm that greenwashing can bring to the company. This type of cognition is based on TMT members’ understanding of resource and environmental issues, forming their understanding and knowledge structure of resource and environment, as well as their psychological experience when assuming responsibilities for resource conservation and environmental protection (Hameed et al., 2021; Zhou and Jin, 2023). TMTs with strong environmental cognition will prioritize resource and environmental issues and are more likely to be exposed to information about the negative impact of greenwashing on enterprises so that the occurrence of greenwashing behavior can be avoided.
TMTs with high levels of environmental cognition tend to make environmentally friendly decisions and try to promote genuine environmental efforts. As makers of corporate strategic decisions, TMTs’ responses to environmental changes are affected by their own cognition of environmental issues, and they integrate environmental cognition into their daily management activities (Simon, 1979; Wang et al., 2020). They endeavor to fulfill their environmental responsibilities while ensuring the economic profitability of the enterprise, and to meet their own spiritual needs. Thus, we formulate the following hypothesis:
Hypothesis 1:. TMT environmental cognition restrain greenwashing behavior
Hypothesis 2:. TMT environmental cognition promote genuine environmental efforts
2.2 The moderating role of political connection
Political connections are regarded by resource dependence theorists as boundary-spanning initiatives to lessen external uncertainty between the focus firm and the environment (Tihanyi et al., 2019). They are viewed as an essential resource for the company, one that is difficult for other companies to copy. According to some research, political connections significantly influence the environmental strategies adopted by businesses (Hillman, 2005). For example, they help ease the financial restrictions on environmental investments, reduce the cost of capital for businesses investing in environmental initiatives, and share the government’s risk associated with the development of new environmental technologies.
Firms with political connections have the opportunity to interact with government departments, stay informed about government policy directions, and effectively mitigate innovation risks (Zhang, 2017). Different degrees of political connection intensity will lead to varying levels of resource acquisition. The higher the intensity of an entrepreneur’s political connection, the more favorable it is for resource acquisition. These firms are motivated to obtain additional resources by genuinely implementing environmental protection practices. In addition, from the perspective of local governments, they also tend to seek out more familiar firms to assist in addressing local environmental issues. Therefore, we believe that political connections will reinforce the inhibitory effect of TMT environmental cognition on greenwashing, and accordingly, we put forth the following hypothesis:
Hypothesis 3:. Political connections enhance the inhibitory effect of TMT environmental cognition on greenwashing
2.3 The moderating role of environmental regulations
Environmental regulation comprises a set of laws and regulations established and enforced with the aim of safeguarding the environment (Testa et al., 2011). Numerous studies have explored the influence of environmental regulation on corporate performance. Among these, several argue that stringent environmental regulations, which restrict business operations, adversely affect productivity and competitiveness (López-Gamero et al., 2010; Shao et al., 2020). Firms incur costs related to environmental protection, potentially resulting in the forfeiture of investment opportunities in other profitable ventures. Conversely, some studies present contrasting findings. According to this research, regulations that are effectively designed and implemented can benefit both the environment and the firm, potentially providing a competitive edge over unregulated firms (Stanwick and Stanwick, 1998; Zhou et al., 2022).
Environmental regulation refers to the collection of laws and regulations created and put into effect with the intention of protecting the environment (Testa et al., 2011). Numerous studies have examined the impact of environmental regulation on corporate performance. Among these, several studies contend that onerous environmental regulations that impose limits on business activity have a negative impact on productivity and competitiveness (López-Gamero et al., 2010; Shao et al., 2020). Firms face costs related to environmental protection, which may lead to the loss of investment opportunities in other profitable projects. Some studies have reached conclusions that differ. According to these researches, regulations that are well designed and implemented can be advantageous for both the environment and the firm, potentially providing a competitive advantage over unregulated firms (Stanwick and Stanwick, 1998; Zhou et al., 2022).
Some studies suggest that it is under varying environmental regulatory intensities that the behaviors or outcomes of firms differ (Buysse and Verbeke, 2003; Berrone and Gomez-Mejia, 2009; Li and Ramanathan, 2018; Zhang, D., 2023). These studies consider environmental management benefits as a crucial tool to explain this phenomenon. When the intensity of environmental regulation is at a low level, the environmental management costs of enterprises are low, and the environmental management benefits brought by TMT environmental cognition exceed those of greenwashing, which weakens motivation of the TMT to engage in greenwashing. Conversely, as environmental regulatory intensity increases, this situation reverses. Consequently, we propose the following hypothesis:
Hypothesis 4:. Environmental regulations may weaken the inhibitory effect of TMT environmental cognition on greenwashing.
3 Data and empirical design
3.1 Basic empirical model
This study’s basic econometric formula was previously modified in accordance with (Zhang, 2022; Zhang, 2023), which is shown as Equation 1:
To show the role of the political connection and environmental regulation mechanism on the relationship between TMT environmental cognition and greenwashing, we construct Equations 2, 3:
In these equations, the firm-individual is denoted by the subscript i, and the time interval t is from 2012 to 2020., the variable GW indicates greenwashing level, EC indicates TMT environmental cognition, PCL indicates political connection level, ER indicates environmental regulation intensity. In addition, Xi,t contains a series of control variables, specifically the Size, Lev, ROA, Board, Indep, Dual, ListAge, and SOE. Additionally, the industry fixed effect and the fixed time impacts are recorded, and the idiosyncratic errors are represented by ε.
3.2 Data
The China Stock Market and Accounting Research Database (CSMAR) provides the fundamental variables. Environmental regulation intensity was obtained via the provincial statistical yearbook. The data used to measure greenwashing is derived from Bloomberg’s and Huazheng’s ESG Database. The data regarding the political connections of firms are manually gathered from executives’ personal documents in the CSMAR database, and some empty values are filled in by visiting the websites. Interestingly, financial and other ST corporations are not included.
3.3 Variable design
Regarding the degree of greenwashing, this study adheres to previous literature (Yu et al., 2020; Zhang, 2023), designs the greenwashing variable following Equation 4:
In this paper, ED represents a firm’s standing relative to its competitors in the ESG disclosure score distribution, which gauges the degree of environmental disclosure. EP represents a firm’s position relative to its competitors in the distribution of its ESG real performance scores, which measures the level of genuine environmental behavior.
For EC, this study selects pertinent terms for word frequency data, performs a textual analysis of listed firms’ annual reports, and creates an index representing the environmental cognition of listed firms’ TMT. (Duriau et al., 2007).
For ER, this study uses an index calculated as 100 times the ratio of an industry’s industrial output value to its pollution control costs (Wang and Shen, 2016).
For PC, this paper uses a dummy variable to quantify corporate political connections: assigning it a value of one if the chairman or CEO of a listed company is a former or current government figure, and zero otherwise (Deng et al., 2018). PCL is an ordinal variable, which is assigned values of 4, 3, 2, and 1 based on the administrative levels of government agencies with which senior executives establish political connections, categorized into four types: ministerial, departmental, divisional, and sectional (Faccio et al., 2006; Fan et al., 2007).
3.4 Summary and correlation statistics
Table 1 indicates that the mean and median values of greenwashing are −0.47 and −0.53, showing that the average level of greenwashing in the sample we used is relatively low; however, the maximum value is 5.69 and the minimum value is −4.71, showing significant variations in the greenwashing behavior of the sampled firms. The same applies to EC, ER and PC. For PC and SOE, the mean values are 0.34 and 0.51 respectively, which means that 34% of the firms in the sample are politically connected, while 51% are state-owned.

Table 1. Summary statistics.
Table 2 presents the Pearson’s correlation matrix, illustrating the relationships among the dependent, independent, and primary control variables used in our econometric analysis. Multicollinearity among the explanatory variables is indicated by a correlation coefficient greater than 0.9 (Zhang, 2023). Given that every coefficient in Table 2 is below 0.5, it is evident that there are no issues with the main explanatory variables in our analysis, in addition to correlation coefficient for PC and PCL. However, since PC and PCL will not appear in the regression equation simultaneously, they do not have an impact on the regression results.
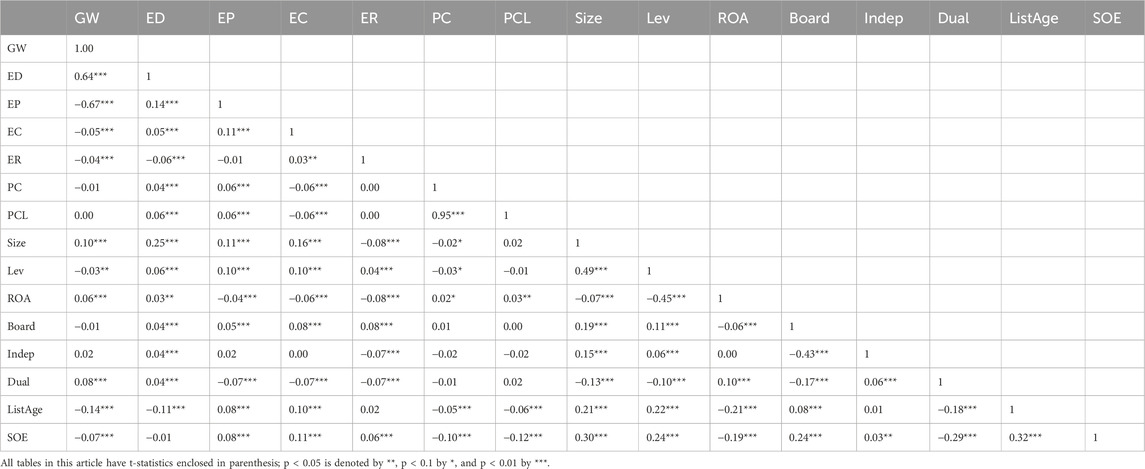
Table 2. Correlation statistics of main variables.
Additionally, Table 2 reveals a significant negative correlation between EC and GW, and a significant positive correlation between EC and both ED and EP. ER shows a significant negative correlation with GW and ED. PCL is significantly and positively correlated with ED and EP but is not related to GW. In terms of control variables, most of them are related to GW, ED, and EP.
4 Empirical results discussion
4.1 Baseline regression
This part presents the findings of our empirical regression after Equation 1 in order to confirm the connection between TMT environmental cognition and greenwashing. Table 3 columns 1-4 show that TMT environmental cognition has a negative impact on firm greenwashing at the 1% significance level. This suggests that the stronger the TMT environmental cognition, the more effective the inhibition of greenwashing behavior, validating the Hypothesis 1. Columns 5-6 show that the impact of TMT environmental cognition on the environmental scores disclosed is not significant, but it has a significantly positive effect on the actual environmental scores. Thus accepting hypothesis 2. Moreover, the table also indicates that Size and Dual has a positive effect on greenwashing behavior. Lev and ListAge has a negative impact on greenwashing behavior. Given the potential significant behavioral differences among SOE firms in the Chinese context and the unique nature of government-enterprise relations in China, a further heterogeneous analysis will be conducted in Section 4.2.
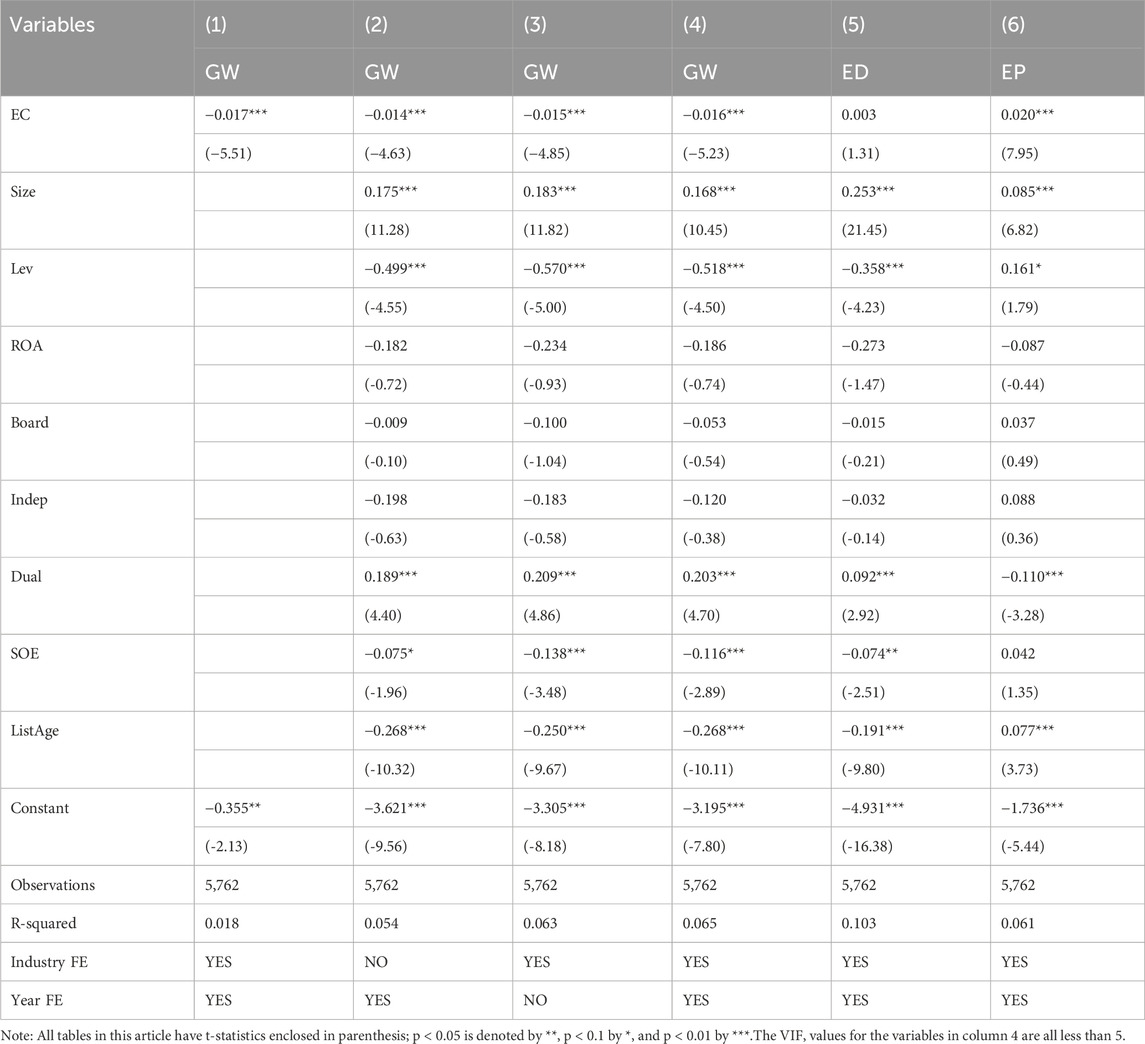
Table 3. Baseline estimation results.
4.2 Heterogeneous effects analysis
4.2.1 Ownership
After splitting the sample between state-owned and privately held companies, Table 4 displays the estimation findings. Columns 1-3 results show that for private-owned firms, EC has a significantly negative impact on GW but a significantly positive impact on ED and EP. Columns 4-6 indicate that for state-owned firms, EC does not exhibit a significant impact on ED. This may be because that for state-owned firms, they tend to communicate environmental information to the responsible government departments through formal documents, rather than using market-based means such as ESG disclosures.
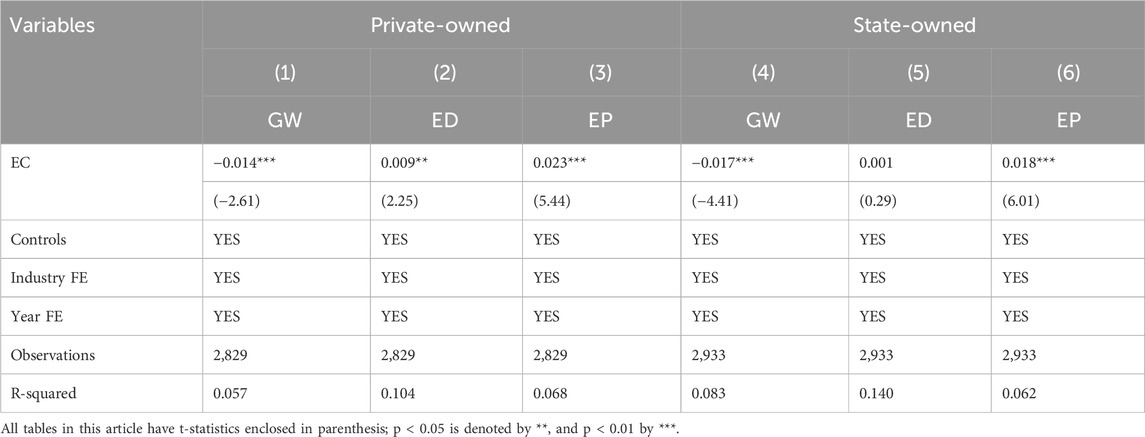
Table 4. Heterogeneous effects analysis: ownership.
To further investigate the differences between privately-owned and state-owned firms, this study further employs Fisher’s permutation test (Welch, 1990; Cleary, 1999; Van Borkulo et al., 2022) to examine the difference in estimated coefficients between private-owned and state-owned firms. Table 5 Column 4 shows a p-value of 0.03 for ED between private-owned and state-owned firms, indicating that the difference in ED between the two groups is 0.008, significant at the 0.05 level, further corroborating the aforementioned conclusion. Moreover, the study also reveals that Size, Lev, Board, and ListAge exhibit analogous characteristics.
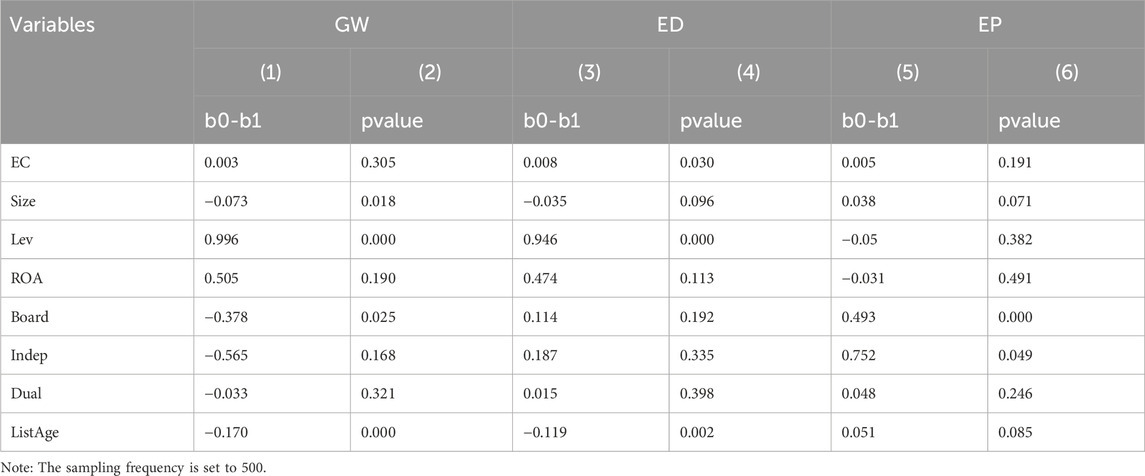
Table 5. Fisher’s permutation test: ownership.
4.2.2 Political relation
After splitting the sample into enterprises with and without political connections, Table 6 displays the estimation findings. Columns 1-3 show that TMT environmental cognition can significantly reduce greenwashing for firms without political connections, and significantly increase genuine environmental efforts. In contrast to firms without political connections, Columns 5 show that TMT environmental cognition can significantly increase environmental disclosure in political connection firms. It is possible that firms with political connections can obtain more information from other government officials and understand the role of environmental information disclosure, thus tending to present themselves in a more packaged manner.
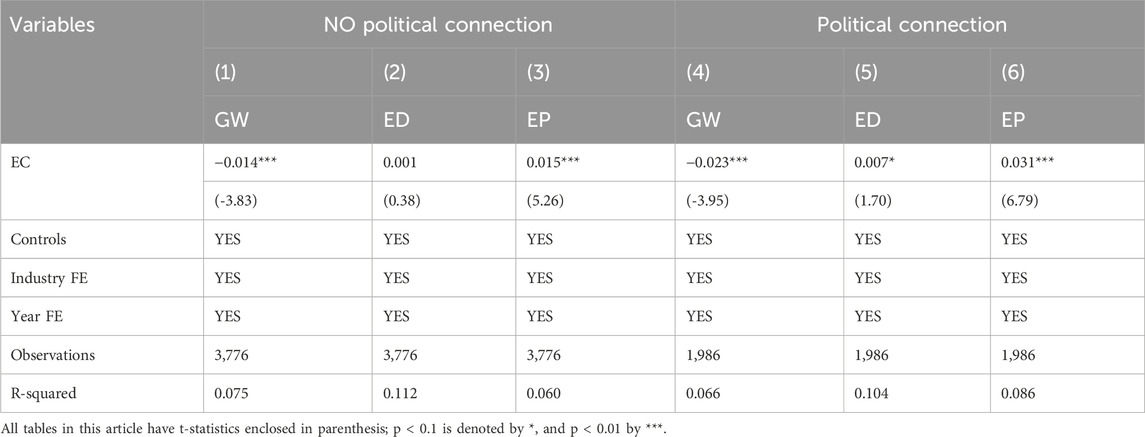
Table 6. Heterogeneous effects analysis: Political Connection.
Table 7 shows that the impact of TMT environmental cognition on greenwashing is significantly greater, particularly for firms with political connections. This finding partially validates hypothesis 3.
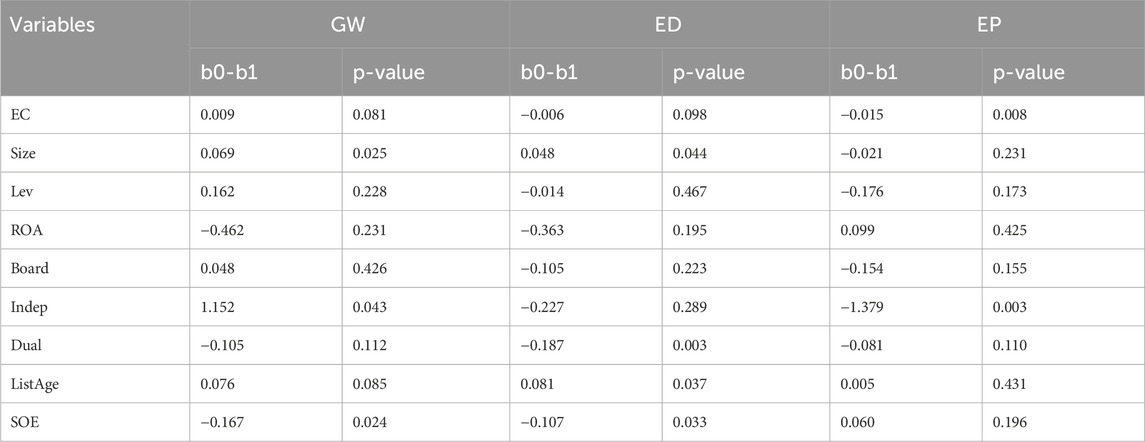
Table 7. Fisher’s permutation test: Political Connection.
4.3 Mechanism explorations
Table 8 reveals that the interaction coefficient between TMT environmental cognition and political connection level is −0.005, significant at the 1% level (Columns 1). This means that political connections can significantly enhance the inhibitory effects of TMT environmental cognition on greenwashing, thereby validating hypothesis 3. In addition, columns 2-3 also indicate that the moderation effects may be achieved by promoting the genuine environmental efforts.
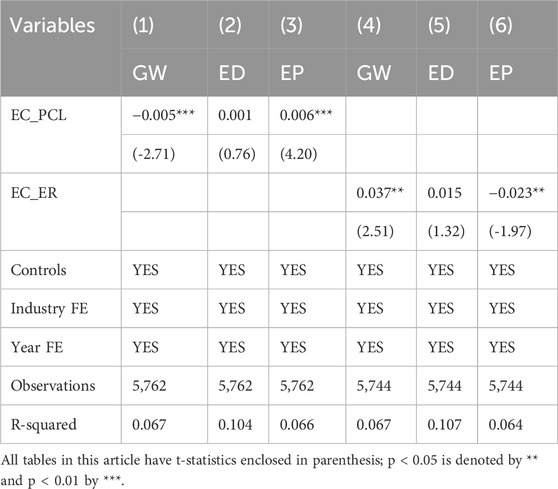
Table 8. Mechanism test: political connection and environmental regulation.
Column 4 shows that the interaction coefficient between TMT environmental cognition and environmental regulation intensity is 0.037, significant at the 5% level. This implies that environmental regulation can significantly weaken the inhibitory effects of TMT environmental cognition on greenwashing, thereby validating hypothesis 4. Furthermore, Columns 5-6 also suggest that this moderation effects may be achieved by reducing genuine environmental efforts.
5 Robustness tests
5.1 Alternative variable
To show that the results of this paper are independent of the measurement of greenwashing, we reference Li and Wang (2021), who used a dummy variable to represent whether a firm exhibits greenwashing behavior. The estimation findings obtained by evaluating greenwashing behavior indirectly using these alternative measurements are presented in Table 9. Column 1 shows that TMT environmental cognition decreases greenwashing at the 1% significance level.
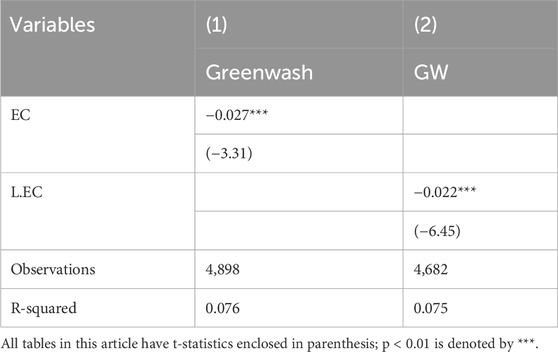
Table 9. Robustness test by alternative variable.
Furthermore, we use the lagged 1-period of EC as the explanatory variable to verify the existence of reverse causality. The regression results shown in Column 2 indicate that TMT environmental cognition decreases greenwashing at the 1% significance level.
5.2 Endogeneity problems by instrument variable method
Here, EC is lagged by one and two units to address the endogeneity problem using 2SLS and GMM with an instrument variable. A researh design is also introduced to ensure the reliability of the findings in this research (Chen et al., 2022; Zhang et al., 2023). Table 10 presents the relationship between TMT environmental cognition and greenwashing, showing that TMT environmental cognition decreases greenwashing at the 1% significance level.
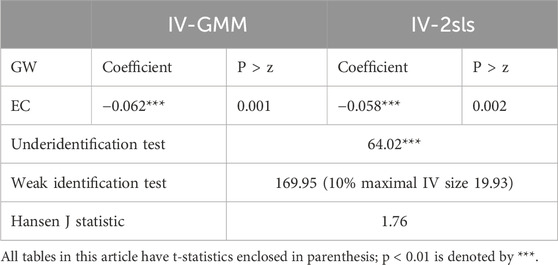
Table 10. Robustness test by instrument variable.
6 Conclusions and policy implications
6.1 Research conclusions
Based on Upper Echelons Theory and Strategic Recognition Theory, this study investigates the impact of TMT environmental cognition on greenwashing behavior in firms. After empirical testing, this article uses the imbalanced panel dataset of Chinese listed firms from 2012 to 2020 and draws the following conclusions:
Firstly, TMT environmental cognition restrains greenwashing behavior significantly by promoting genuine environmental efforts. Secondly, the inhibitory effect of TMT environmental cognition on greenwashing behavior is more pronounced in firms without political connections than those with political connections. Thirdly, TMT environmental cognition has a significantly positive impact on environmental disclosure scores for private owned or political connection firms, but not for state-owned or no political connection firms. Fourthly, the level of political connection of firms and the intensity of environmental regulations significantly have respectively strengthened or weakened the linkage between TMT environmental cognition and greenwashing behavior.
6.2 Policy implications and recommendations
From current studies, it can be seen that greenwashing will have a series of adverse consequences. Regulators, therefore, tend to suppress greenwashing. Based on research findings, this paper proposes the following suggestions from enhancing TMT environmental cognition in China:
Firstly, facilitate the dissemination of environmental information between government and firms. Local governments can invite firms to participate in the convening of environmental committees, and share internal information such as the ‘Yangtze River Economic Belt Ecological Environment Warning Film’ with relevant firms. Secondly, strengthen the political connections of firms. United Front Work Department, Political Consultative Conference, National People’s Congress, and other departments should actively support private entrepreneurs and executives to participate in environmental protection, giving them more political identities. Thirdly, increase financial penalties for greenwashing. The government can impose severe financial penalties on firms engaaging in greenwashing, which links their misconduct to access to economic resources such as policy loans, thereby increasing their financing costs in multiple aspects.
Data availability statement
The raw data supporting the conclusions of this article will be made available by the authors, without undue reservation.
Author contributions
ZJ-W: Writing–original draft, Writing–review and editing. Miaoshuo: Writing–original draft, Writing–review and editing.
Funding
The author(s) declare that financial support was received for the research, authorship, and/or publication of this article. This work is funded by The National Social Science Fund of China Youth Project (23CJY086).
Conflict of interest
The authors declare that the research was conducted in the absence of any commercial or financial relationships that could be construed as a potential conflict of interest.
Publisher’s note
All claims expressed in this article are solely those of the authors and do not necessarily represent those of their affiliated organizations, or those of the publisher, the editors and the reviewers. Any product that may be evaluated in this article, or claim that may be made by its manufacturer, is not guaranteed or endorsed by the publisher.
References
Abatecola, G., Mandarelli, G., and Poggesi, S. (2013). The personality factor: how top management teams make decisions. A literature review. J. Manag. and Gov. 17, 1073–1100. doi:10.1007/s10997-011-9189-y
Alexiev, A., Jansen, J., Van den Bosch, F., and Volberda, H. (2010). Top management team advice seeking and exploratory innovation: the moderating role of TMT heterogeneity. J. Manag. Stud. 47, 1343–1364. doi:10.1111/j.1467-6486.2010.00919.x
Attah-Boakye, R., Costanzo, L. A., Guney, Y., and Rodgers, W. (2023). The effects of top management team strategic cognition on corporate financial health and value: an interactive multi-dimensional approach. Eur. J. Finance 29 (13), 1461–1492. doi:10.1080/1351847X.2021.1977360
Bedford, D. S., Bisbe, J., and Sweeney, B. (2022). The joint effects of performance measurement system design and TMT cognitive conflict on innovation ambidexterity. Manag. Account. Res. 57, 100805. doi:10.1016/j.mar.2022.100805
Berrone, P., and Gomez-Mejia, L. R. (2009). Environmental performance and executive compensation: an integrated agency-institutional perspective. Acad. Manag. J. 52 (1), 103–126. doi:10.5465/amj.2009.36461950
Bromiley, P., and Rau, D. (2016). Social, behavioral, and cognitive influences on upper echelons during strategy process: a literature review. J. Manag. 42 (1), 174–202. doi:10.1177/0149206315617240
Buysse, K., and Verbeke, A. (2003). Proactive environmental strategies: a stakeholder management perspective. Strategic Manag. J. 24 (5), 453–470. doi:10.1002/smj.299
Chen, G., Xu, J., and Qi, Y. (2022). Environmental (de) centralization and local environmental governance: Evidence from a natural experiment in China. China Econ. Rev. 72, 101755. doi:10.1016/j.chieco.2022.101755
Chen, Y., Li, R., and Song, T. (2023). Does TMT internationalization promote corporate digital transformation? A study based on the cognitive process mechanism. Bus. Process Manag. J. 29 (2), 309–338. doi:10.1108/BPMJ-06-2021-0376
Cleary, S. (1999). The relationship between firm investment and financial status. J. Finance 54 (2), 673–692. doi:10.1111/0022-1082.00121
Deng, Z., Yan, J., and van Essen, M. (2018). Heterogeneity of political connections and outward foreign direct investment. Int. Bus. Rev. 27 (4), 893–903. doi:10.1016/j.ibusrev.2018.02.001
Duriau, V. J., Reger, R. K., and Pfarrer, M. D. (2007). A content analysis of the content analysis literature in organization studies: research themes, data sources, and methodological refinements. Organ. Res. methods 10 (1), 5–34. doi:10.1177/1094428106289252
Faccio, M., Masulis, R. W., and McConnell, J. J. (2006). Political connections and corporate bailouts. J. Finance 61 (6), 2597–2635. doi:10.1111/j.1540-6261.2006.01000.x
Fan, J. P., Wong, T. J., and Zhang, T. (2007). Politically connected CEOs, corporate governance, and Post-IPO performance of China's newly partially privatized firms. J. Financial Econ. 84 (2), 330–357. doi:10.1016/j.jfineco.2006.03.008
Gomes, M., Marsat, S., Peillex, J., and Pijourlet, G. (2023). Does religiosity influence corporate greenwashing behavior? J. Clean. Prod. 140151, 140151. doi:10.1016/j.jclepro.2023.140151
Hahn, T., Pinkse, J., Preuss, L., and Figge, F. (2015). Tensions in corporate sustainability: towards an integrative framework. J. Bus. ethics 127, 297–316. doi:10.1007/s10551-014-2047-5
Hambrick, D. C., and Mason, P. A. (1984). Upper echelons: the organization as a reflection of its top managers. Acad. Manag. Rev. 9 (2), 193–206. doi:10.5465/AMR.1984.4277628
Hameed, I., Hyder, Z., Imran, M., and Shafiq, K. (2021). Greenwash and green purchase behavior: an environmentally sustainable perspective. Environ. Dev. Sustain. 23 (9), 13113–13134. doi:10.1007/s10668-020-01202-1
Henry, A. D., and Dietz, T. (2012). Understanding environmental cognition. Organ. and Environ` 25 (3), 238–258. doi:10.1177/1086026612456538
Hillman, A. J. (2005). Politicians on the board of directors: do connections affect the bottom line? J. Manag. 31, 464–481. doi:10.1177/0149206304272187
Kind, F. L., Zeppenfeld, J., and Lueg, R. (2023). The impact of chief executive officer narcissism on environmental, social, and governance reporting. Bus. Strategy Environ. 32 (7), 4448–4466. doi:10.1002/bse.3375
Laufer, W. S. (2003). Social accountability and corporate greenwashing. J. Bus. ethics 43, 253–261. doi:10.1023/A:1022962719299
Li, R., and Ramanathan, R. (2018). Exploring the relationships between different types of environmental regulations and environmental performance: evidence from China. J. Clean. Prod. 196, 1329–1340. doi:10.1016/j.jclepro.2018.06.132
Li, X., Dai, J., He, J., Li, J., Huang, Y., Liu, X., et al. (2022). Mechanism of enterprise green innovation behavior considering coevolution theory. Int. J. Environ. Res. Public Health 19 (16), 10453. doi:10.3390/ijerph191610453
Li, Z., and Wang, W. (2021). Corporate environmental responsibility and bank credit: text analysis of words and deeds. J. Financial Res. (12), 116–132. doi:10.1016/j.irfa.2023.102556
López-Gamero, M. D., Molina-Azorín, J. F., and Claver-Cortés, E. (2010). The potential of environmental regulation to change managerial perception, environmental management, competitiveness and financial performance. J. Clean. Prod. 18 (10-11), 963–974. doi:10.1016/j.jclepro.2010.02.015
Lyon, T. P., and Montgomery, A. W. (2013). Tweetjacked: the impact of social media on corporate greenwash. J. Bus. ethics 118, 747–757. doi:10.1007/s10551-013-1958-x
Lyon, T. P., and Montgomery, A. W. (2015). The means and end of greenwash. Organ. and Environ. 28 (2), 223–249. doi:10.1177/1086026615575332
Mitchell, J., Shepherd, D., and Sharfman, M. (2011). Erratic strategic decisions: when and why managers are inconsistent in strategic decision making. Strategic Manag. J. 32, 683–704. doi:10.4337/9781784716042.00023
Mukherjee, T., and Sen, S. S. (2022). Impact of CEO attributes on corporate reputation, financial performance, and corporate sustainable growth: evidence from India. Financ. Innov. 8 (1), 40. doi:10.1186/s40854-022-00344-7
Neely Jr, B. H., Lovelace, J. B., Cowen, A. P., and Hiller, N. J. (2020). Metacritiques of upper echelons theory: verdicts and recommendations for future research. J. Manag. 46 (6), 1029–1062. doi:10.1177/0149206320908640
Nyilasy, G., Gangadharbatla, H., and Paladino, A. (2014). Perceived greenwashing: the interactive effects of green advertising and corporate environmental performance on consumer reactions. J. Bus. ethics 125, 693–707. doi:10.1007/s10551-013-1944-3
Pizzetti, M., Gatti, L., and Seele, P. (2021). Firms talk, suppliers walk: analyzing the locus of greenwashing in the blame game and introducing ‘vicarious greenwashing. J. Bus. Ethics 170, 21–38. doi:10.1007/s10551-019-04406-2
Plambeck, N., and Weber, K. (2009). CEO ambivalence and responses to strategic issues. Organ. Sci. 20, 993–1010. doi:10.1287/orsc.1090.0471
Raffaelli, R., Glynn, M. A., and Tushman, M. (2019). Frame flexibility: the role of cognitive and emotional framing in innovation adoption by incumbent firms. Strategic Manag. J. 40 (7), 1013–1039. doi:10.1002/smj.3011
Shan, B., Liu, X., Chen, B., and Ma, J. (2023). CEO narcissism and corporate performance in China. China Econ. Rev. 79, 101970. doi:10.1016/j.chieco.2023.101970
Shao, S., Hu, Z., Cao, J., Yang, L., and Guan, D. (2020). Environmental regulation and enterprise innovation: a review. Bus. strategy Environ. 29 (3), 1465–1478. doi:10.1002/bse.2446
Simon, H. A. (1979). Information processing models of cognition. Annu. Rev. Psychol. 30 (1), 364–377. doi:10.1002/asi.4630320517
Stanwick, P. A., and Stanwick, S. D. (1998). The relationship between corporate social performance, and organizational size, financial performance, and environmental performance: an empirical examination. J. Bus. ethics 17, 195–204. doi:10.1023/A:1005784421547
Sun, Z., and Zhang, W. (2019). Do government regulations prevent greenwashing? An evolutionary game analysis of heterogeneous enterprises. J. Clean. Prod. 231, 1489–1502. doi:10.1016/j.jclepro.2019.05.335
Testa, F., Boiral, O., and Iraldo, F. (2018). Internalization of environmental practices and institutional complexity: can stakeholders pressures encourage greenwashing? J. Bus. Ethics 147, 287–307. doi:10.1007/s10551-015-2960-2
Testa, F., Iraldo, F., and Frey, M. (2011). The effect of environmental regulation on firms’ competitive performance: the case of the building and construction sector in some EU regions. J. Environ. Manag. 92 (9), 2136–2144. doi:10.1016/j.jenvman.2011.03.039
Tihanyi, L., Aguilera, R. V., Heugens, P., Van Essen, M., Sauerwald, S., Duran, P., et al. (2019). State ownership and political connections. J. Manag. 45 (6), 2293–2321. doi:10.1177/0149206318822113
Van Borkulo, C. D., van Bork, R., Boschloo, L., Kossakowski, J. J., Tio, P., Schoevers, R. A., et al. (2022). Comparing network structures on three aspects: a permutation test. Psychol. methods 28, 1273–1285. doi:10.1037/met0000476
Wang, L., Zeng, T., and Li, C. (2022). Behavior decision of top management team and enterprise green technology innovation. J. Clean. Prod. 367, 133120. doi:10.1016/j.jclepro.2022.133120
Wang, Q., Ge, Y., and Hu, C. (2020). A relationship model between top management team cognitive heterogeneity and strategic decision quality and its implications for sustainability. Complexity 2020 (1), 8851711–8851712. doi:10.1155/2020/8851711
Wang, W., Ma, D., Wu, F., Sun, M., Xu, S., Hua, Q., et al. (2023). Exploring the knowledge structure and hotspot evolution of greenwashing: a visual analysis based on bibliometrics. Sustainability 15 (3), 2290. doi:10.3390/su15032290
Wang, Y., and Shen, N. (2016). Environmental regulation and environmental productivity: the case of China. Renew. Sustain. Energy Rev. 62, 758–766. doi:10.1016/j.rser.2016.05.048
Wei, L., and Wu, L. (2013). What a diverse top management team means: testing an integrated model. J. Manag. Stud. 50, 389–412. doi:10.1111/joms.12013
Welch, W. J. (1990). Construction of permutation tests. J. Am. Stat. Assoc. 85 (411), 693–698. doi:10.1080/01621459.1990.10474929
Yang, Z., Nguyen, T. T. H., Nguyen, H. N., Nguyen, T. T. N., and Cao, T. T. (2020). Greenwashing behaviours: causes, taxonomy and consequences based on a systematic literature review. J. Bus. Econ. Manag. 21 (5), 1486–1507. doi:10.3846/jbem.2020.13225
Yi, Y., Chen, Y., and He, X. (2022). CEO leadership, strategic decision comprehensiveness, and firm performance: the moderating role of TMT cognitive conflict. Manag. Organ. Rev. 18 (1), 131–166. doi:10.1017/mor.2021.10
Yu, E. Y., Luu, B. V., and Chen, C. H. (2020). Greenwashing in environmental, social and governance disclosures. Res. Int. Bus. Finance 52, 101192. doi:10.1016/j.ribaf.2020.101192
Zhang, C. (2017). Political connections and corporate environmental responsibility: adopting or escaping? Energy Econ. 68, 539–547. doi:10.1016/j.eneco.2017.10.036
Zhang, D. (2022). Environmental regulation and firm product quality improvement: how does the greenwashing response? Int. Rev. Financial Analysis 80, 102058. doi:10.1016/j.irfa.2022.102058
Zhang, D. (2023). Subsidy expiration and greenwashing decision: is there a role of bankruptcy risk? Energy Econ. 118, 106530. doi:10.1016/j.eneco.2023.106530
Zhang, D., Wang, J., and Wang, Y. (2023). Greening through centralization of environmental monitoring? Energy Econ. 123, 106753. doi:10.1016/j.eneco.2023.106753
Zhou, G., Liu, L., and Luo, S. (2022). Sustainable development, ESG performance and company market value: mediating effect of financial performance. Bus. Strategy Environ. 31 (7), 3371–3387. doi:10.1002/bse.3089
Keywords: green cognition, greenwashing, political connection, environmental regulation, ESG
Citation: Jia-Wen Z and Miaoshuo (2024) TMT environmental cognition and greenwashing behavior: evidence from Chinese firms. Front. Environ. Sci. 12:1486215. doi: 10.3389/fenvs.2024.1486215
Received: 25 August 2024; Accepted: 15 November 2024;
Published: 19 December 2024.
Edited by:
Jinyu Chen, Central South University, ChinaReviewed by:
Hailing Li, Hunan Agricultural University, ChinaJingxing Liu, Huaqiao University, China
Copyright © 2024 Jia-Wen and Miaoshuo. This is an open-access article distributed under the terms of the Creative Commons Attribution License (CC BY). The use, distribution or reproduction in other forums is permitted, provided the original author(s) and the copyright owner(s) are credited and that the original publication in this journal is cited, in accordance with accepted academic practice. No use, distribution or reproduction is permitted which does not comply with these terms.
*Correspondence: Miaoshuo, bWlhb3MyMDI0QDE2My5jb20=