 Temitope Mary Taiwo*
 Timothy Oyebamiji Ogunbode
- Environmental Management and Crop Production Unit, College of Agriculture, Engineering and Science, Bowen University, Iwo, Nigeria
Introduction: Water has been of paramount importance to humanity throughout history. Understanding the factors contributing to water pollution, particularly those that compromise its quality and sustainability, is essential. This study investigates the impact of quarry activities on the portability of rainwater within a quarry site, focusing on the relationship between quarry operations, heavy metals, and the physicochemical properties of rainwater.
Methods: The study was conducted at Sanlong Quarry Industry in Ifelodun, Southwestern Nigeria. Rainwater samples were collected along a 15–150 m transect within the quarry for analysis of heavy metals and physicochemical contents. Five heavy metals cadmium (Cd), chromium (Cr), zinc (Zn), lead (Pb), and magnesium (Mg) were determined using Atomic Absorption Spectrophotometer (AAS). Additionally, eight physicochemical properties, including electrical conductivity, pH, total solids, suspended solids, total dissolved solids, nitrate, turbidity, and total phosphorus, were analyzed using standard procedures. Variance and correlation analysis of the rainwater’s physicochemical parameters was conducted using Statistical Product for Service Solutions (SPSS).
Results: The analysis indicated general compliance with water quality standards. However, elevated levels of Pb and Cd in certain areas exceeded WHO, NAFDAC, and US-EPA limits, while Cr, Zn, and Mg were found to have minimal impact on rainwater quality.
Discussion: Rainwater collected at Sanlong Quarry may not be safe for consumption due to heavy metal contamination, particularly Pb and Cd. This finding underscores the need for alternative clean water sources for both quarry staff and the surrounding community. Quarry management must prioritize the provision of clean water and raise awareness among personnel about the risks associated with consuming contaminated rainwater.
1 Introduction
Water is an indispensable element of the earth’s crust, generously provided to humanity for a multitude of purposes. Its global significance cannot be overstated, serving as a vital resource for drinking, domestic use, sustaining both humans and livestock, facilitating plant growth, agricultural irrigation, construction activities, and dust control, among other benefits (Ogunbode and Ifabiyi, 2019; Ogunbode and Ifabiyi, 2019c; Falkenmark, 2020). Although water covers 71% of the earth’s crust, the accessibility of portable water is relatively scarce; only about 1% of freshwater is notably clean and readily available, with the majority locked within glaciers (WHO, 2017). Without water, survival becomes a precarious notion; indeed, water epitomises life itself, making it an essential necessity for all living organisms. What makes water unique is its irreplaceability; it is essential for the daily functioning of all living beings, with no immediate alternative. However, despite its critical importance to humanity, water quality is increasingly compromised by numerous factors (Nnamani, 2018). Anthropogenic influences are the primary threats to a sustainable water supply, including industrial effluent, quarrying and mining activities, unregulated waste disposal, and the leaching of pesticides and herbicides, all of which contribute to the contamination of water bodies (Ibrahim and Umar, 2015).
Furthermore, this situation exerts immense pressure on the already scarce portable water resources in today’s world, leading to a survival-of-the-fittest scenario (Panda et al., 2010; Ogunbode et al., 2016a). The adverse impacts of quarrying activities on surface and groundwater pollution cannot be underestimated, as they exacerbate the presence of heavy metals in the environment, thereby compromising its eco-friendliness (Kafu-Quvane and Mlaba, 2024; Paoletti et al., 2024). Human activities frequently disrupt the pristine quality of water in the pursuit of life’s necessities and livelihood demands, thereby compromising water availability and limiting access to clean and portable sources (WHO, 2017). Water reaches its optimal utility when its inherent qualities remain unchanged (Nigerian Industrial Standards (NIS, 2007; Sajitha and Vijayamma, 2016). Parameters such as turbidity, pH levels, total hardness, total dissolved solids, and electrical conductivity, among others, are crucial indicators of water’s suitability for consumption (Diersong et al., 2009). Any deviation from these physico-chemical parameters renders the water unsuitable for its intended purposes (United Nations Development of Economic and Social Affairs (UNDESA, 2005).
Moreover, water pollution arises from varieties of sources, both direct and indirect (Olutona and Ogunbode 2016b; Ogunbode et al., 2024), necessitating a comprehensive understanding of this phenomenon. This study, therefore, examines the physical and chemical aspects of water pollution within quarry sites, aiming to compare the impact of quarry activities on rainwater quality and assess compliance with recommended water usage standards (UNDESA, 2005; Arokoyu and Ukpere, 2014). These issues predominantly originate from anthropogenic influences, although natural causes occasionally contribute (Ogunbode and Akinola, 2019), while human activities have led to significant advancements in innovation, technology, and modernization (Akhtar et al., 2021), they have also created formidable challenges to human and ecological sustainability by placing undue pressure on the environment. This pressure is exacerbated by population growth, technological advancements that require changes in production methods, industrial discharges, and socio-economic factors such as poverty, all of which further strain already limited water resources (Kalu and Ogbonna, 2019).
Nevertheless, the quarry industry offers a multitude of opportunities across various aspects of life, driving development through the extraction and use of previously untapped natural resources by artisanal miners (Kalu and Ogbonna, 2019). The benefits of quarry industry are extensive, including job creation and the provision of stones and aggregates essential for construction (such as bridges, culverts, and road and rail infrastructure), erosion control, and decorative elements (such as flooring, tiles, and sculptures). This industry also supplies raw materials for industries like glass, chalk, and paper production (Tahseen et al., 2016). However, the adverse effects of quarrying ranging from excavation and stone blasting to crushing have significantly exposed the natural environment to various threats, complicating efforts towards environmental sustainability (Tahseen et al., 2016). Quarry operations contribute to several forms of pollution, including water, air, soil, and noise pollution (Kalu, 2018; Kalu and Ogbonna, 2019). For example, heavy metals released during quarrying notably compromise water quality (Yury et al., 2018).
In addition, these pollutants often enter ecosystems through various pathways, posing risks to air, water, and soil quality. Moreover, water’s natural tendency to absorb contaminants makes it particularly vulnerable to pollution (Okafor and Njoku, 2021). Heavy metals discharged by quarrying operations infiltrate surface and groundwater through leaching and direct runoff from rainfall, thereby degrading water quality and making it unsuitable for consumption and other uses (Olutona and Ogunbode 2016b; Ogunbode and Ifabiyi, 2019). The scarcity of portable water remains a significant issue in many developing countries, where access to clean water is a daily challenge exacerbated by population growth (Ogunbode et al., 2023). While various water sources exist, this study focuses on the impact of quarry operations on rainwater, a crucial natural resource for sustaining life. Rainwater, often regarded as a valuable resource during periods of scarcity, can be harnessed for various purposes, including water management strategies and coping mechanisms during shortages. Moreover, rainwater harvested in quarry areas requires careful consideration, as heavy metals suspended in the quarry environment may affect its quality (Alahacoon et al., 2022).
To determine the environmental impact of quarrying on rainwater quality, it is crucial to evaluate the presence of heavy metals and the physico-chemical properties of the water to assess its suitability for various uses. Rainwater is a significant source of water, particularly in tropical regions where the study was conducted, and is often available for up to 8 months of the year (March to October). This investigation is essential for safeguarding the health of the local population who rely on untreated rainwater. In view of this, this study aims to elucidate the adverse effects associated with using rainwater collected from quarry sites for domestic purposes. This motivation underpins the objectives of the research, which seeks to establish the relationship between quarry operations and rainwater quality and to evaluate the extent of their environmental impact. The objectives of the study are to;
(1). Investigate the relationship between quarry operations and the quality of rainwater.
(2). Assess the impact of quarry operations on the physicochemical properties of rainwater and evaluate its portability against international standards.
(3). Determine the concentration and distribution of heavy metals in collected rainwater.
2 Research methodology
2.1 Study area
This research was conducted at the Sanlong Quarry Industry, located along the Iree/Ikirun Road in the quaint town of Obaagun, Osun State, Nigeria (see Figure 1). Situated within the administrative jurisdiction of Ifelodun Local Government Area, the Sanlong Quarry covers a substantial area. Since its full-scale operation began in 2018, the quarry has been managed by Chinese authorities. Daily operations commence at 8 a.m. and conclude at 6 p.m., according to worker testimonies. The quarry is a major employer for many young people, significantly contributing to their livelihoods and bolstering the local economy. Sanlong Quarry Industry is a multifaceted entity with several sectors requiring human expertise and labour. These sectors include the mechanic workshop, the powerhouse, the weighing and inspection station, the tractor and excavator operation division, the drilling and crushing sector, transportation, financial transactions, as well as recreational facilities such as a canteen and designated playgrounds. The use of diverse and sophisticated machinery highlights the technological advancement of Sanlong Quarry, establishing it as one of the leading quarries in Osun State. Geographically, the quarry is bordered by Ikirun, Iree, and Eripa towns, and neighbouring villages to Obaagun such as Iragbiji, Ologoro, and Eweta.
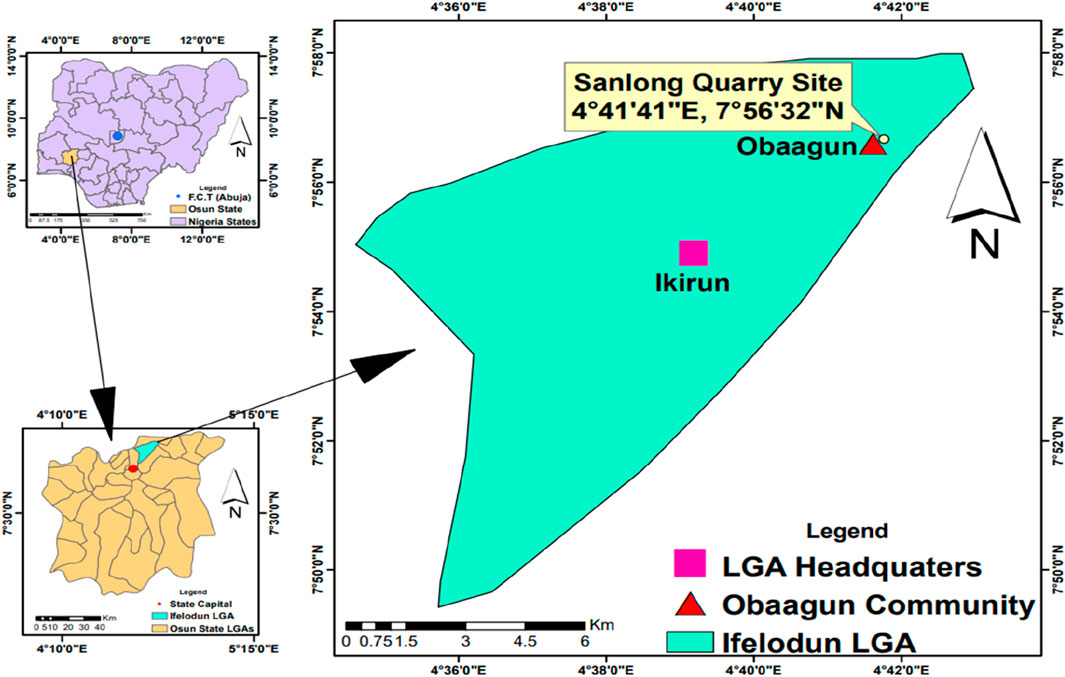
Figure 1. Map of Osun State, Nigeria pinpointing the study area, Obaagun and Sanlong Quarry.
Furthermore, Obaagun, known for its abundance of hills and rocky outcrops, has earned the nickname “the home of rocks” due to the rich reservoir of rock resources in the area. This geological feature has led to the establishment of quarry industries in the region. Despite ongoing operations, the full extent of rock exploitation remains untapped. Obaagun, located within the tropical rainforest belt of Southern Nigeria, has geographical coordinates of latitude 7° 55′ 43″ N and longitude 4° 40′ 32″ E, with an elevation of 400 m (1,312 feet) above sea level. According to the 2006 census, the population of Obaagun was 21,543 residents. The town is inclusive and welcomes settlers from various ethnic backgrounds, with the Yoruba being the predominant ethnic group. Obaagun also exhibits religious diversity, with Christianity and Islam being the main faiths. Likewise, agriculture is the primary occupation in Obaagun due to the abundant arable land. The cultivation of cash crops such as palm trees, cocoa, bitter kola, kola nuts, yam, and cassava thrive in the region, supplemented by other trades, while literacy rates remain moderate.
2.2 Rainwater collection techniques
Rainwater was collected during daylight hours at the Sanlong quarry site in Obaagun, Ifelodun Local Government Area of Osun State. The collection equipment included four 4-L kegs, a measuring tape, pegs, a cutlass and funnels each playing a crucial role in the data collection process. The measuring tape and pegs were used for precise measurements and marking of the collection spots. The cutlass was employed to dig shallow holes for keg placement, ensuring stability. Funnels were used to direct the water flow into the kegs. The kegs were monitored by the on-site field assistant to prevent the kegs from being displaced by the wind and to ensure adequate rain collection into the kegs while raining. The kegs were covered immediately after the rainwater collection and removed from their respective places.
2.3 Collection techniques
Four 4-L kegs were strategically positioned at designated distances within the Sanlong quarry site, as detailed in Table 1. On 28 September 2023, these kegs were labelled and placed at distances of 15 m, 30 m, and 45 m (Figure 2), with one keg positioned 150 m away from the quarry site (the control point) as shown in Figure 3.
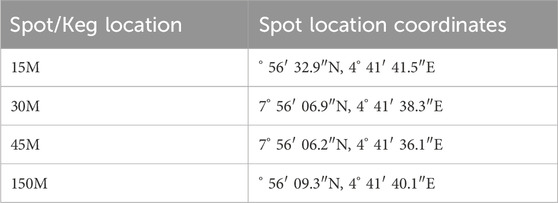
Table 1. Displayed the coordinates of the spot (kegs) location on the field.
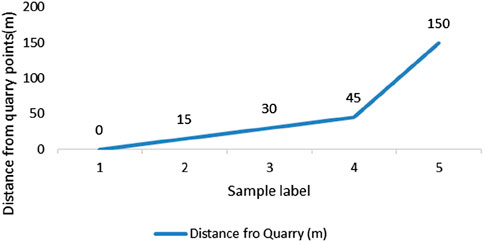
Figure 2. Sample points’ distances from Quarry site (metres).
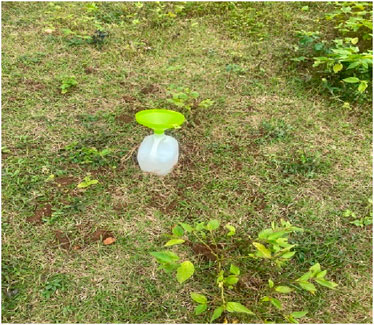
Figure 3. Rain water collection procedure.
The coordinates of the kegs’ locations are detailed in Table 1. The kegs were left in place for a day, from 28th to 29th September, coinciding with heavy rainfall on the 28th. Following collection, the kegs were promptly covered by the field assistant on-site, as instructed, to prevent contamination. On 29th September 2023, the labelled kegs were collected and transported to the Bowen University Central Laboratory for elemental and physicochemical analysis.
2.4 Rainwater digestion techniques
The methodology for analyzing rainwater employed in this study follows Ademoroti’s (1996) methods for assessing heavy metals in water samples. Nitric acid served as the digestion reagent in this process. Initially, 50 mL of the water sample was carefully transferred into 100 mL glassware and vigorously mixed to ensure thorough blending. Subsequently, 5 mL of concentrated HNO₃ was introduced into the mixture, which was then gently heated until the volume was reduced to 5 mL. Following these steps, the solution was accurately transferred to a 25 mL beaker. A portion of this solution was then used for heavy metals analysis. To ensure accuracy, a blank test was conducted using distilled water to detect any potential error in the method. The mixtures were analyzed for heavy metals using a Buck Scientific Model PG 990 Flame Atomic Absorption Spectrophotometer. Recent publications that have successfully adopted Ademoroti’s (1996) digestion procedures for water samples under AAS assessment are (Aminu, 2020; Wyasu, 2020; Uba et al., 2020).
2.5 Detection limits of heavy metals using buck scientific model PG 990 flame atomic absorption spectrophotometer
Cadmium (Cd): detection limit 0.0028 mg/L and wavelength 228.8 nm
Chromium (Cr) detection limit 0.005 mg/L and wavelength 357.9 nm
Zinc (Zn) detection limit 0.003 mg/L and wavelength 213.9 nm
Lead detection limit 0.012 mg/L and wavelength 217.0 nm
Manganese (Mg) detection limit 0.0018 mg/L and wavelength 285.2 nm
2.6 Determination of rainwater physico-chemical properties
Five heavy metals (Cd, Cr, Zn, Pb, and Mg) were determined using Atomic Absorption Spectrophotometer (AAS). Additionally, eight physico-chemical properties (Electrical Conductivity, pH, Total Solids, Suspended Solids, Total Dissolved Solids, Nitrate, Turbidity, and Total Phosphorus) were analyzed using standard procedures (Adefemi and Awokunmi, 2010). The selection of these properties was influenced by time constraints and the available funding for the investigation. The determination of each parameter was carried out using standard procedures as follows as shown in Table 2.
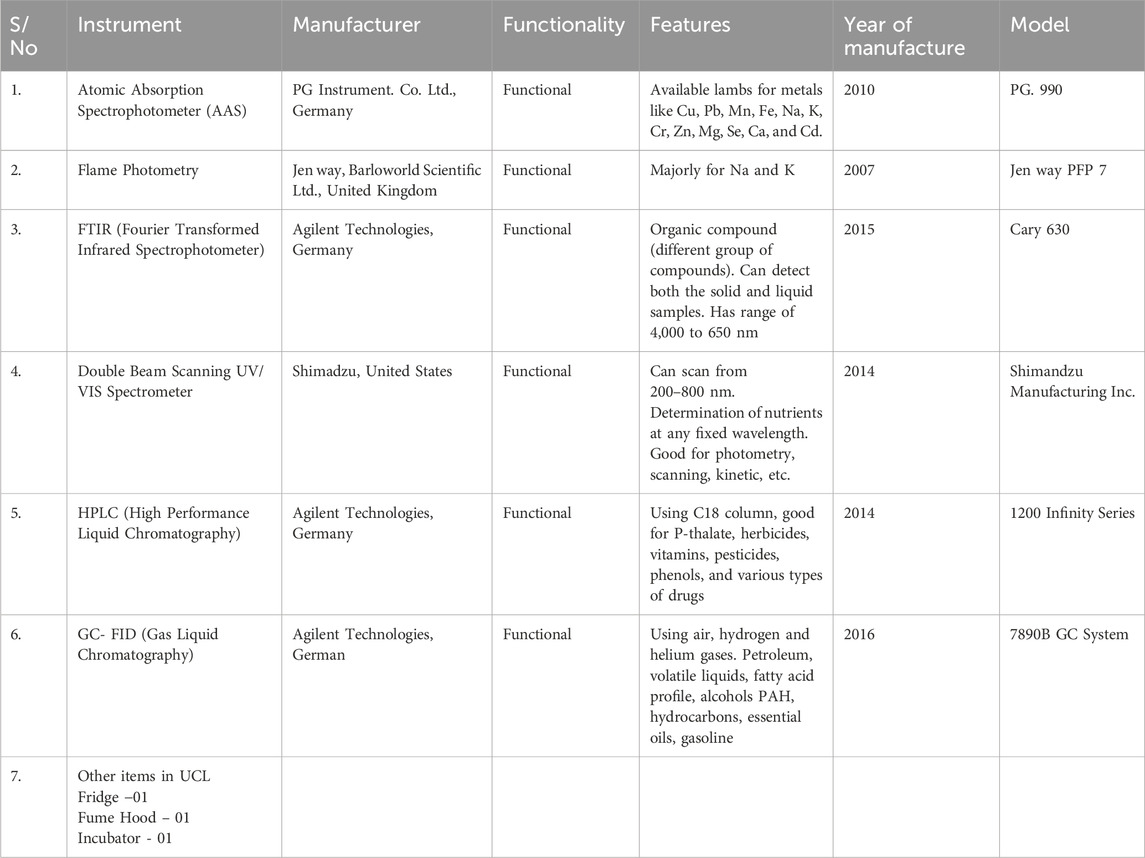
Table 2. Model and origin of UV spectrometer and used other instrument.
2.6.1 EC determination
Electrical Conductivity (EC) was determined using a Jenway model 5028 Electrical Conductivity Meter. This meter was calibrated using a standard Potassium Chloride solution at room temperature, after which the conductivities of the samples were measured in µS/cm by immersing the electrode of the meter into each sample sequentially. The electrode was sterilized with distilled water and cleaned with high-quality tissue paper before being immersed into the next sample (Hendershot et al., 1993).
2.6.2 pH determination
The pH of samples was measured using a Testr 2 waterproof digital pH meter (Hendershot et al., 1993). Before use, the pH meter was calibrated with buffer solutions of pH 4 and 9. The pH of each sample was determined by immersing the electrode into the sample sequentially. The electrode was rinsed with distilled water and dried with high-quality tissue paper before dipping into the next sample.
2.6.3 Determination of total solids (TS)
The principle involves evaporating 50 mL of each well-mixed water sample to dryness in a pre-weighed dish at approximately 105°C. The weight increase over the empty dish represents the total solids. Initially, the weight of the empty dish (W1) was recorded after drying it in an oven to a constant weight. Then, 50 mL of well-mixed water samples were placed into the evaporating dishes and evaporated in the oven. After evaporation, the dishes were cooled in a desiccator. The weight of the cooled dishes (W2) was recorded. Total solids (TS) were determined using the gravimetric method.
2.6.4 Determination of suspended solids (SS)
Whatman No.1 filter paper was dried to constant weight in an oven set at 105°C. The filter paper was then cooled in a desiccator, and its weight was recorded as W1. An accurately measured 50 mL of each well-mixed water sample was filtered through the pre-weighed dry filter paper. The residue on the filter paper was dried to constant weight in the oven at 105°C. The weight of the dried filter paper with residue was recorded as W2. The increase in the weight of the filter paper represents the suspended solids in mg/L.
2.6.5 Determination of total dissolved solids (TDS)
Total dissolved solids (TDS) were calculated as the difference between total solids (TS) and suspended solids (SS): TDS = TS–SS. For the Effluent Treatment Plant (ETP), the TDS was calculated as (76–11) = 65 mg/L. For the partition coefficient (P), the TDS was (48–5.6) = 42.4 mg/L. For oxygen (O), the TDS was (36–4.2) = 31.8 mg/L. For electrical resistance (R), the TDS was (28–2.0) = 26 mg/L.
2.6.6 Nitrate (NO3-) determination
The ultraviolet spectrophotometric screening method (American Public Health Association, 1995) was used to determine NO3- concentrations by measuring ultraviolet absorption at 220 nm. Since dissolved organic matter may also absorb at 220 nm while NO3- does not absorb at 275 nm, a second measurement at 275 nm was used to correct the NO3- values. For the nitrate concentration, potassium nitrate (KNO3) was dried at 105°C for 24 h. Then, 0.0722 g of KNO3 was dissolved and diluted to the mark in a 100 mL volumetric flask to create a 100 mg/L standard solution. From this stock solution, concentrations of 2 mg/L, 4 mg/L, 6 mg/L, 8 mg/L, and 12 mg/L were prepared to plot the calibration curve at 220 nm. Each 25 mL sample of the standards was treated with 0.5 mL of HCl. Additionally, 1.0 mL of HCl was added to 25 mL of clean samples and mixed thoroughly. Absorbance was then measured at both 220 nm and 275 nm.
2.6.7 Turbidity
The nephelometric method 150.1 (EPA 600/4–79 – 020) was used, requiring a Turbidimeter 2100p Hach or filter photometer and sample tubes. For reagents, a 4,000 mg/L Formazin standard solution was prepared by diluting 1, 5, and 20 mL of the 4000 NTU stock solution to 200 mL in a volumetric flask to achieve 20,100, and 800 NTU standards, respectively. Additionally, a hydrazine sulphate solution was prepared by dissolving 5 g of hydrazine sulphate ((NH2)2.H2SO4) in distilled water and diluting to 400 mL in a flask, which was prepared monthly. A hexamethylene tetramine (HMTA) solution was similarly prepared by dissolving 50 g of hexamethylene tetramine ((CH2)6N4) in distilled water and diluting to 400 mL in a volumetric flask, also prepared monthly. Both solutions were combined in a 1 L volumetric flask, diluted to the mark with distilled water, and allowed to stand for 48 h at 25°C. The 4000 NTU stock solution was mixed for at least 10 min before use. To calibrate the equipment, the prepared standards were used, starting with the 20 NTU standard or higher standards if the samples had a high concentration of suspended solids. For sample measurement, the sample was thoroughly shaken, allowed to stand for air bubbles to disappear, and the nephelometer sample tube was cleaned with a soft tissue before reading the turbidity directly from the instrument, with results displayed in NTU units.
2.6.8 Total phosphorus determination
The two most widely used methods for total phosphorus extraction are digestion with perchloric acid (HClO4) and fusion with sodium carbonate (Na2CO3). The HClO4 digestion method is recommended, followed by colorimetric determination. In this procedure, 2 g of the pulverised sample was placed into a 250 mL conical flask, and 30 mL of HClO4 was added. The mixture was digested on a hot plate in a fume cupboard at 130°C until the solution appeared clear. The flask was then cooled to room temperature, and 50 mL of distilled water was added. The solution was filtered into a 100 mL standard flask and diluted to the 100 mL mark. Phosphorus was determined using a spectrophotometer at 420 nm (Table 3).
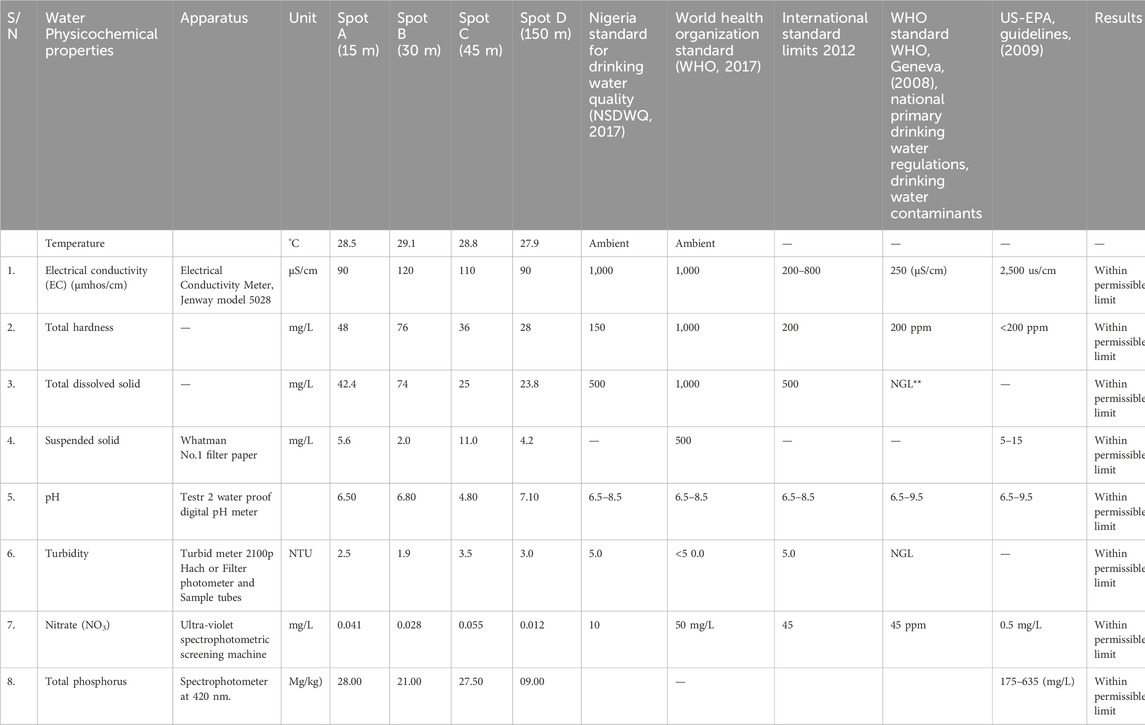
Table 3. Physico-chemical properties of rainwater in Sanlong Quarry site.
2.7 Data analysis
The analysis of heavy metal deposition in the collected rainwater involved descriptive statistics, analysis of variance (ANOVA), and correlation procedures. Mean values were determined using the Duncan Multiple Range Test (DMRT). The results were presented in tables for clarity, drawing on previous studies by authors such as Okafor et al. (2023) to contextualise the significance of the analytical methods employed.
3 Results
Table 4 discusses the heavy metal content found in rainwater samples collected at the quarry site. Cadmium levels exceeded WHO and NAFDAC standards but remained below guidelines (Bakamwesiga et al., 2022). Chromium levels varied across sampling points, with some exceeding WHO standards. Zinc levels were generally lower compared to established standards. Lead concentrations surpassed WHO (2017/2022) limits at all sampling points but remained below (Dharani and Vidya, 2019) thresholds. Manganese levels were generally within acceptable limits but exceeded WHO standards at some points. Overall, the presence of cadmium and lead suggests that the harvested rainwater may not be safe for human consumption.
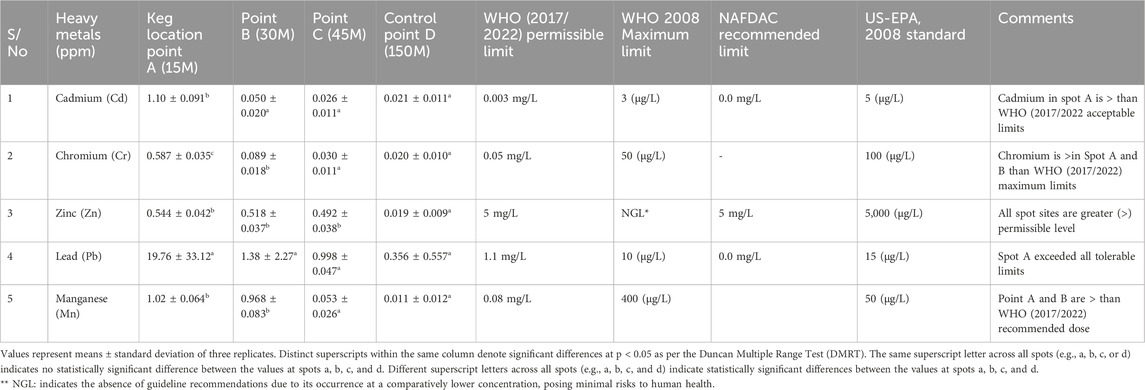
Table 4. Heavy metal determination.
Table 5 examines the differences in heavy metal accumulation between and within sampling points. All heavy metal concentrations showed statistically significant differences, except for lead. Lead’s distinct behaviour suggests minimal correlation with other metals, likely due to its higher accumulation levels.
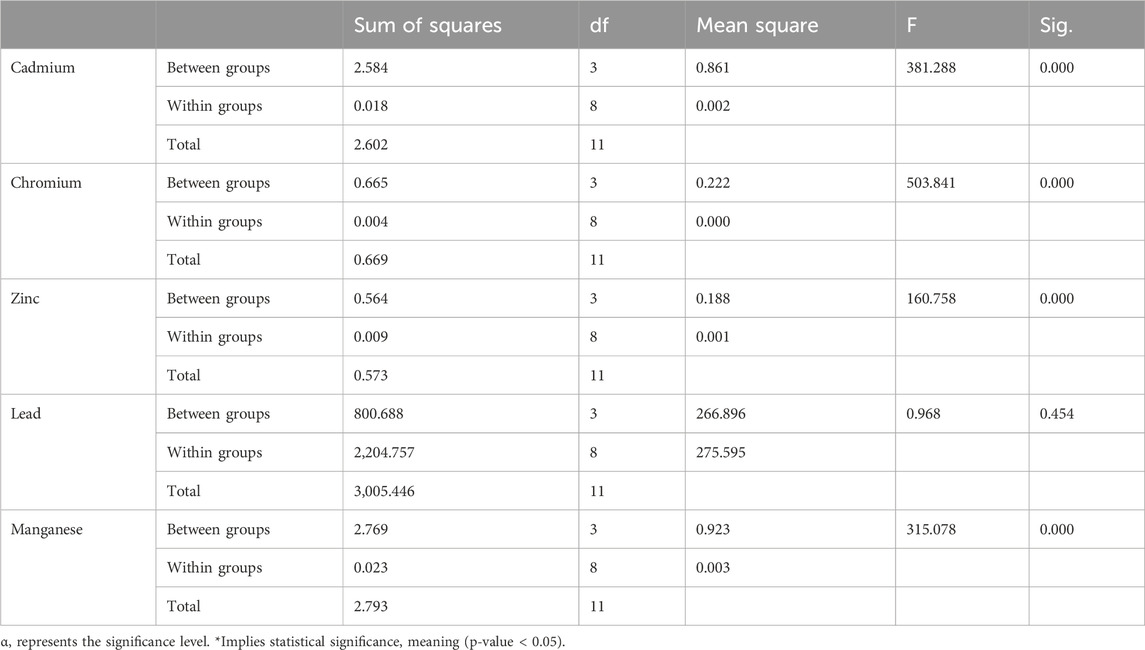
Table 5. Statistical analysis of variance (ANOVA) for heavy metals in rainwater samples.
Table 6 illustrates strong correlations between various heavy metals, indicating a mutual influence among them.
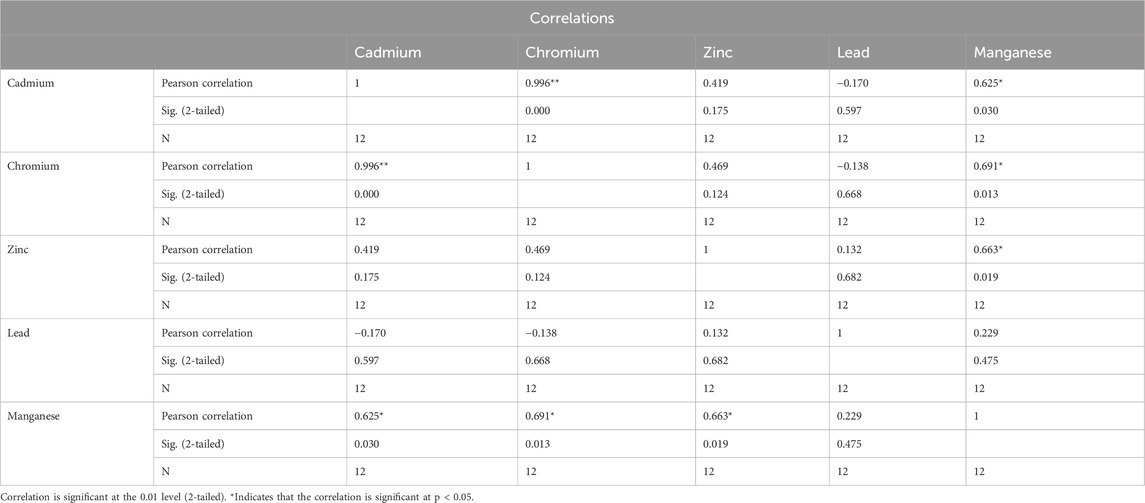
Table 6. Relationship existing between heavy metals in rainwater samples.
Table 5 confirms that the physico-chemical properties of the collected rainwater meet established standards for portability, suggesting its suitability for non-consumptive uses. However, further analysis of additional parameters may be necessary to fully assess its suitability for other purposes.
4 Discussion
Water, as one of the most vital and widespread environmental parameters, is highly susceptible to pollution through various pathways inherent in its nature (Punitha and Selvarajan, 2018; Okafor et al., 2023). Its propensity to accumulate pollutants is unparalleled. The study revealed that rainwater collected at the Sanlong quarry site exhibited higher deposition of lead and cadmium metals. The risks associated with using water rich in Pb and Cd extend significantly to human health, as these metals belong to the category of hazardous substances capable of causing detrimental effects (Hou et al., 2022; Ngatia et al., 2023). Cadmium, particularly toxic, has been linked to various disorders such as cancers, diabetes, kidney, and cardiac abnormalities (Genchi et al., 2020; Amadou et al., 2021). Lead, on the other hand, poses significant harm to the body by dispersing to other organs, leading to systemic deterioration (Charkiewicz and Backstrand, 2020). It also interferes with cognitive abilities, particularly in children, leading to brain damage upon exposure (Sanders et al., 2009; Jaishankar et al., 2014). Moreover, lead exacerbates the health conditions of individuals with existing health challenges, such as those with high blood sugar levels (Obeng-Gyasi et al., 2021). Also, it adversely affects the growth of male children and disrupts the normal secretion of sex hormones (Dehghan et al., 2019). Furthermore, lead induces stress on vital organs such as the liver, kidneys, cardiac system, white blood cells, creatinine, and urea ((Jaishankar et al., 2014).
In addition, anthropogenic, occupational, and industrial activities each uniquely impact water pollution, necessitating a comparative understanding of their contributions. Anthropogenic activities, including urbanisation, agriculture, and waste disposal, introduce pollutants such as heavy metals, pesticides, and chemicals into water bodies through runoff and improper waste management (Nyairo et al., 2015; Le Thai-Hoang et al., 2022; Ngatia et al., 2023). Supporting this view (Hoang et al., 2018; Roșca et al., 2020), reported that these activities result in widespread diffuse pollution that cumulatively degrades water quality over time. Occupational activities, particularly in mining, construction, and manufacturing, often lead to localized but severe contamination events (Briffa et al., 2020). Mining operations, for instance, release heavy metals like lead and cadmium into water sources, posing direct risks to workers and nearby communities (Briffa et al., 2020; Stewart, 2020). Likewise, industrial activities, encompassing chemical manufacturing, metal processing, and energy production, are significant point sources of pollution (Bashir et al., 2020; Lin et al., 2022). These activities discharge complex mixtures of hazardous substances, including toxic chemicals and heavy metals, into water bodies (Akhtar et al., 2021; Hou et al., 2022). This necessitates stringent regulatory controls and advanced treatment technologies to mitigate their impacts. The distinct nature and severity of water pollution from these activities highlight the need for comprehensive and targeted pollution prevention and control strategies. Therefore, effective management must involve stringent regulations, innovative treatment technologies, and public awareness to mitigate the adverse effects on water resources. However, a limitation of this research lies in the timing of data collection, which was conducted at the end of the rainy season. The results might differ if data were collected at the beginning of the wet season. Moreover, it is essential to conduct further studies on other physicochemical properties not investigated in this study.
5 Conclusion and recommendation
A quality assessment of rainwater at the Sanlong quarry site in Osun State, Nigeria, was conducted. Rainwater samples, collected at various distances from the quarry, were analysed using standard procedures. SPSS analysis of rainwater physicochemical parameters indicated general compliance with water quality standards; however, elevated levels of lead (Pb) and cadmium (Cd) in certain areas exceeded recommended limits. Chromium (Cr), zinc (Zn), and magnesium (Mg) had minimal impact. The rainwater is deemed unsafe for consumption due to heavy metal contamination, necessitating alternative clean water sources for the community. Elevated levels of lead and cadmium pose significant ecological and health risks, affecting local water sources, biodiversity, soil quality, and diminishing agricultural productivity. Human health is at risk from consuming polluted water. The study highlights the need for sustainable quarry management, stricter regulations, and community education to mitigate environmental damage and protect public health. A similar investigation at other quarry sites is recommended to validate or refute the findings of this study.
Data availability statement
The original contributions presented in the study are included in the article/Supplementary Material, further inquiries can be directed to the corresponding author.
Author contributions
TT: Data curation, Formal Analysis, Investigation, Methodology, Project administration, Resources, Software, Writing–original draft, Writing–review and editing. TO: Conceptualization, Data curation, Methodology, Supervision, Visualization, Writing–original draft, Writing–review and editing.
Funding
The author(s) declare that no financial support was received for the research, authorship, and/or publication of this article.
Conflict of interest
The authors declare that the research was conducted in the absence of any commercial or financial relationships that could be construed as a potential conflict of interest.
Publisher’s note
All claims expressed in this article are solely those of the authors and do not necessarily represent those of their affiliated organizations, or those of the publisher, the editors and the reviewers. Any product that may be evaluated in this article, or claim that may be made by its manufacturer, is not guaranteed or endorsed by the publisher.
References
Adefemi, S. O., and Awokunmi, E. E. (2010). Determination of physico-chemical parameters and heavy metals in water samples from Itaogbolu area of Ondo-State, Nigeria. Afr. J. Environ. Sci. Technol. 4 (3), 145–148. doi:10.5897/ajest09.133
Ademoroti, C. M. A. (1996). Standard methods for the examination of water and wastewater. 2nd Edn. Ibadan University Press.
Akhtar, N., Syakir, I. M. I., Bhawani, S. A., and Umar, K. (2021). Various natural and anthropogenic factors responsible for water quality degradation: a review. Water 13 (19), 2660. doi:10.3390/w13192660
Alahacoon, N., Edirisinghe, M., Simwanda, M., Perera, E., Nyirenda, V. R., and Ranagalage, M. (2022). Rainfall variability and trends over the african continent using TAMSAT data (1983–2020): towards climate change resilience and adaptation. Remote Sens. 14 (1), 96. doi:10.3390/rs14010096
Amadou, A., Praud, D., Coudon, T., Danjou, A. M. N., Faure, E., Deygas, F., et al. (2021). Exposure to airborne cadmium and breast cancer stage, grade and histology at diagnosis: findings from the E3N Cohort Study. Sci. Rep. 11, 23088. doi:10.1038/s41598-021-01243-0
American Public Health Association (1995). Standard Methods for the Examination of Water and Wastewater. 19th Ed. American Public Health Association.
Aminu, I. (2020). Determination of selected heavy metals in drinking water commonly used in the main campus of Usmanu Danfodiyo University Sokoto. Sci. World J. 15 (3). doi:10.47514/swj/15.03.2020.016
Arokoyu, S. B., and Ukpere, D. R. (2014). Access to safe water supply and sanitation in lower Orashi Otamiri-oche River basin, Rivers State, Nigeria. ARPN J. Sci. Technol. 4 (11), 639–646. doi:10.5897/AJEST2014.1701
Bakamwesiga, H., Mugisha, W., Kisira, Y., and Muwanga, A. (2022). An assessment of air and water pollution accrued from stone quarrying in mukono district, Central Uganda. J. Geoscience Environ. Prot. 10, 25–42. doi:10.4236/gep.2022.105003
Bashir, I., Lone, F. A., Bhat, R. A., Mir, S. A., Dar, Z. A., and Dar, S. A. (2020). Concerns and threats of contamination on aquatic ecosystems. Bioremediation Biotechnol. Sustain. Approaches Pollut. Degrad., 1–26. doi:10.1007/978-3-030-35691-0_1
Briffa, J., Sinagra, E., and Blundell, R. (2020). Heavy metal pollution in the environment and their toxicological effects on humans. Heliyon 6 (9), e04691. doi:10.1016/j.heliyon.2020.e04691
Charkiewicz, A. E., and Backstrand, J. R. (2020). Lead toxicity and pollution in Poland. Int. J. Environ. Res. Public Health 17 (12), 4385. doi:10.3390/ijerph17124385
Dehghan, S. F., Mehrifar, Y., and Ardalan, A. (2019). The relationship between exposure to lead-containing welding fumes and the levels of reproductive hormones. Ann. Glob. Health 85, 125. doi:10.5334/aogh.2617
Dharani, P. T., and Vidya, A. K. (2019). Evaluation of water quality index using physicochemical parameters of treated domestic sewage water. Res. J. Life Sci. Bio Inf. Pharm. Chem. Sci. 5 (2), 98–112. doi:10.26479/2019.0502.08
Diersong, N. (2009). Water quality; Frequently asked questions. Key West: Florida Brooks National Marine Sanctuary, 1–2.
Falkenmark, M. (2020). Water resilience and human life support - global outlook for the next half century. Int. J. Water Resour. Dev. 36 (2–3), 377–396. doi:10.1080/07900627.2019.1693983
Genchi, G., Carocci, A., Lauria, G., Sinicropi, M. S., and Catalano, A. (2020). Nickel: human health and environmental toxicology. Int. J. Environ. Res. Public Health 17, 679. doi:10.3390/ijerph17030679
Hendershot, W. H., Lalande, H., and Duquette, M. (1993). Soil reaction and exchangeable acidity. In Soil sampling and methods of analysis. Editors M. R. Carter (Boca Raton, FL: Lewis Publishers), 141–145.
Hoang, H. T. T., Duong, T. T., Nguyen, K. T., Le, Q. T. P., Luu, M. T. N., Trinh, D. A., et al. (2018). Impact of anthropogenic activities on water quality and plankton communities in the day river (red river delta, vietnam). Environ. Monit. Assess. 190, 67. doi:10.1007/s10661-017-6435-z
Hou, S., Zhao, X., Liu, Y., Tillotson, M. R., Weng, S., Wang, H., et al. (2022). Spatial analysis connects excess water pollution discharge, industrial production, and consumption at the sectoral level. npj Clean. Water 5 (4), 4. doi:10.1038/s41545-022-00152-7
Ibrahim, U., and Jimoh, W. O. (2015). Determination of trace metal concentration in drinking water samples from Sani Mainagge Quarter, Gwale local government area, Kano state, Nigeria. Int. J. Sci. Res. Environ. Sci. 3 (9), 341–349. doi:10.12983/ijsres-2015-p0341-0349
Jaishankar, M., Tseten, T., Anbalagan, N., Mathew, B. B., and Beeregowda, K. N. (2014). Toxicity, mechanism and health effects of some heavy metals. Interdiscip. Toxicol. 7 (2), 60–72. doi:10.2478/intox-2014-0009
Kafu-Quvane, B., and Mlaba, S. (2024). Assessing the impact of quarrying as an environmental ethic crisis: a case study of limestone mining in a rural community. Int. J. Environ. Res. public health 21 (4), 458. doi:10.3390/ijerph21040458
Kalu, E. (2018). Environmental impact of stone quarrying activities in Ebonyi state, Nigeria. J. Adv. Stud. Agric. Biol. Environ. Sci. 5 (2), 7.
Kalu, I. E., and Ogbonna, N. J. (2019). Investigation of the environmental effect of stone quarrying activities on soil and water in Akpoha and Ishiagu communities of Ebonyi state, Nigeria. J. Adv. Stud. Agric. Biol. Environ. Sci. 5 (2), 7–22. doi:10.1080/15623599.2019.1604115
Le Thai-Hoang, T. T., Hoang, T. C. L., Pham, T. T. V., Pham, T. P. T., Tran, L. T., and Thuoc, T. L. (2022). Influences of anthropogenic activities on water quality in the saigon river, Ho chi minh city. J. Water Health 20 (3), 491–504. doi:10.2166/wh.2022.233
Lin, L., Yang, H., and Xu, X. (2022). Effects of water pollution on human health and disease heterogeneity: a review. Front. Environ. Sci. 10, 880246. doi:10.3389/fenvs.2022.880246
Ngatia, M., Kithiia, S. M., and Voda, M. (2023). Effects of anthropogenic activities on water quality within ngong river sub-catchment, nairobi, Kenya. Water 15 (4), 660. doi:10.3390/w15040660
NIS (Nigerian Industrial Standards) (2007). Nigerian standard for drinking water quality. NIS554, 2007. ICS 13.060.20, approved by the standard organisation of Nigeria (SON) Governing Council, 14–18.
Nnamani, E. C. (2018). Lack of access to potable water supply and its impact on the Nigerian rural communities.
Nyairo, W. N., Owuor, P. O., and Kengara, F. O. (2015). Effect of anthropogenic activities on the water quality of Amala and Nyangores tributaries of River Mara in Kenya. Environ. Monit. Assess. 187 (11), 691. doi:10.1007/s10661-015-4913-8
Obeng-Gyasi, E., Ferguson, A. C., Stamatakis, K. A., and Province, M. A. (2021). Combined effect of lead exposure and allostatic load on cardiovascular disease mortality – a preliminary study. Int. J. Environ. Res. Public Health 18, 6879. doi:10.3390/ijerph18136879
Ogunbode, T., and Akinola, O. T. (2019). Hydrochemistry and water quality index application in the assessment of ground water quality in Oyo State, Nigeria. Int. J. Hydrol. Sci. Technol. 9 (6), 657–674. doi:10.1504/ijhst.2019.103446
Ogunbode, t.O., Akintunde, E. O., and Akinola, O. T. (2016a). Assessment of underground water quality and pollution sources apportionment in a growing urban centre in Osun state south western Nigeria. Eur. J. Geogr. 7 (3), 70–84.
Olutona, G. O., and Ogunbode, T. O. (2016b). Spatial characteristics of groundwater chemistry in some selected area of Ogbomoso zone of Oyo State, Nigeria. Eur. J. Earth Environ. 3 (1), 17–30.
Ogunbode, T. O., Esan, V. I., and Akande, J. A. (2024). Water resources endowment and the challenge of underutilization in a tropical community in Nigeria. Sustain. Resour. Manag. 10 (2), 72. doi:10.1007/s40899-024-01061-y
Ogunbode, T. O., and Ifabiyi, I. P. (2019a). Relationship between evapotranspiration and water availability in the tropical regions: a case study of a southwestern city in Nigeria. Archives Curr. Res. Int. 16 (4), 1–10. doi:10.9734/acri/2019/v16i430097
Ogunbode, T. O., and Ifabiyi, I. P. (2019b). Temporal water balance analysis in different climatic scenarios in oyo state, Nigeria. Sustain. Agri, Food Environ. Res. 7 (2), 163–177. doi:10.7770/safer-V0N0-art1476
Ogunbode, T. O., and Ifabiyi, P. I. (2019c). Rainfall trends and its implications on water resources management: a case study of Ogbomoso city in Nigeria. Int. J. Hydro 3 (3), 210–215. doi:10.15406/ijh.2019.03.00182
Ogunbode, T. O., Oyebamiji, V. O., Aromolaran, O., Faboro, O. O., and Ogunbode, I. R. (2023). Impact of human management of hand-dug well facility and its accessories on groundwater quality. Environ. health insights 17, 11786302231190988. doi:10.1177/11786302231190988
Okafor, O. C., and Njoku, C. (2021). Water quality as affected by quarry activities in Ebonyi State. Nigeria: Posted.
Okafor, O. C., Njoku, C., and Akwuebu, A. N. (2023). Environmental impact of quarrying on air quality in Ebonyi state, Nigeria. Environ. Sci. PollutionRes 35 (2), 98. doi:10.1186/s12302-023-00793-6
Panda, U. C., Rath, P., Bramha, S., and Sahu, K. C. (2010). Application of factor analysis in geochemical speciation of heavy metals in the sediments of a lake system—Chilika (India): a case study. J. Coast Res. 26 (5), 860–868. doi:10.2112/08-1077.1
Paoletti, M., Piscopo, V., Sbarbati, C., and Scarelli, A. (2024). Categorization of the potential impact of Italian quarries on water resources through a multi-criteria decision aiding-based model. Sustainability 16 (7), 2804. doi:10.3390/su16072804
Punitha, S., and Selvarajan, G. (2018). Analysis of heavy metals concentration in ground water from kilvelur taluk, nagapattinam district,Tamil nadu, India. India. J. Coast Res. 8 (3), 538–547. doi:10.29055/jccs/608
Roșca, O. M., Dippong, T., Marian, M., Mihali, C., Mihalescu, L., Hoaghia, M. A., et al. (2020). Impact of anthropogenic activities on water quality parameters of glacial lakes from Rodnei mountains, Romania. Environ. Res. 182, 109136. doi:10.1016/j.envres.2020.109136
Sajitha, V., and Vijayamma, S. A. (2016). Study of physico-chemical parameters and pond water quality assessment by using water quality index at Athiyannoor Panchayath, Kerala, India. Emerg. Life Sci. Res. 2, 46–51.
Sanders, T., Liu, Y., Buchner, V., and Tchounwou, P. B. (2009). Neurotoxic effects and biomarkers of lead exposure: a review. Rev. Environ. health 24 (1), 15–45. doi:10.1515/reveh.2009.24.1.15
Stewart, A. G. (2020). Mining is bad for health: a voyage of discovery. Environ. Geochem. health 42 (4), 1153–1165. doi:10.1007/s10653-019-00367-7
Tahseen, S., Yamen, H., and Basheer-Salimia, R. (2016). Impact of air pollution from quarrying and stone cutting industries on agriculture and plant biodiversity. Resour. Environ. 6 (6), 122–126. doi:10.5923/j.re.20160606.04
Uba, A., Liman, M. G., Yahaya, M., Abdullahi, M. I., and Yusuf, A. J. (2020). Treated water and sludge samples from a treatment plant in Sokoto, Nigeria. Sci. World J. 15 (3). doi:10.47514/swj/15.03.2020.016
World Health Organization (WHO), United Nations International Children's Emergency Fund (UNICEF) (2017). Progress on sanitation and drinking water: 2017 update.
Wyasu, G. (2020). Determination of physicochemical pollutants in wastewater and some food crops grown along Kakuri Brewery wastewater channels, Kaduna State, Nigeria. Sci. World J. 15 (3), 111–115.
Keywords: Sanlong Quarry, heavy metals, water pollution, physico-chemical properties, rainwater
Citation: Taiwo TM and Ogunbode TO (2025) Analysis of rainwater quality in a quarry site in southwestern Nigeria. Front. Environ. Sci. 12:1496960. doi: 10.3389/fenvs.2024.1496960
Received: 16 September 2024; Accepted: 03 December 2024;
Published: 10 January 2025.
Edited by:
Yalçın Tepe, Giresun University, TürkiyeReviewed by:
Rajesh Kumar Ranjan, Central University of South Bihar, IndiaGehan El Zokm, National Institute of Oceanography and Fisheries (NIOF), Egypt
Copyright © 2025 Taiwo and Ogunbode. This is an open-access article distributed under the terms of the Creative Commons Attribution License (CC BY). The use, distribution or reproduction in other forums is permitted, provided the original author(s) and the copyright owner(s) are credited and that the original publication in this journal is cited, in accordance with accepted academic practice. No use, distribution or reproduction is permitted which does not comply with these terms.
*Correspondence: Temitope Mary Taiwo, dGltb3RoeS5vZ3VuYm9kZUBib3dlbi5lZHUubmc=