 Claudia E. Rodriguez-Zevallos
 Jessica K. Sanchez-Altamirano
 Marco A. Sanchez-Peña
 Kenny Diaz
- 1Professional School of Environmental Engineering, Faculty of Engineering, Universidad Privada del Norte, Cajamarca, Peru
- 2Laboratory of Biology, Faculty of Engineering, Universidad Privada del Norte, Cajamarca, Peru
It has been determined that there is air pollution within wastewater treatment plants and their surrounding areas. This impacts the health of nearby populations. Therefore, this research aimed to evaluate the air’s microbiological quality in the area of influence of the former Wastewater Treatment Plant (WWTP) in the city of Cajamarca. Microbiological air sampling was conducted during the rainy and dry seasons using the RCS Standard Hycon air sampler, planting on tryptic soy agar medium to determine the total count of all microorganisms, bacteria, and fungi separately. OSHA (Occupational Safety and Health Administration), PN-89/Z-04111/02, and PN-89/Z-04111/03 were the standards used to determine the air quality of the study area since Peru currently does not have such regulation standards. The highest values obtained were 4560 CFU/m³ and 4360 CFU/m³ during the dry season. Sixteen concentrations of the total microorganism count exceeded the limits established by OSHA standards, and ten concentrations of bacteria exceeded the Polish standard PN-89/Z-04111/02. Although the concentrations of fungi were high, they did not exceed any reference limits. We determined a positive correlation between the concentration of microorganisms and the relative humidity, with a maximum of 85.67% humidity during the dry season. Additionally, a negative correlation with wind speed was found, with values ranging from 0.37 m/s to 2.58 m/s during the dry season and from 0.37 m/s to 1.87 m/s during the rainy season. Genera of public health importance such as Staphylococcus and Penicillium were identified. Finally, a survey was conducted among the nearby population to assess the impact on public health. And, it was established that the health impact on the surrounding populations is mainly low.
1 Introduction
Worldwide, there are numerous wastewater treatment plants (WWTPs) consisting of various infrastructures and treatment processes (Ministry of Housing, Construction and Sanitation of Peru, 2006). Studies have determined air pollution both within the WWTP, where concentrations of airborne bacteria can reach up to 4878 CFU/m³ in areas such as aeration tanks (Yang et al., 2018) and concentrations of fungi up to 5386 CFU/m³ in areas like pumping stations (Staszowska, 2022). This reduces the microbiological quality of the surrounding air and impacts the health of nearby populations (Fracchia et al., 2006) due to the dispersion of contaminants from these points of high concentration (Fula and Rey, 2005). The World Health Organization (2021) indicates that air pollution is a major environmental risk, affecting human health, and emphasizes the importance of governments promoting its study and monitoring. This contributes to formulating mitigation measures and improving air quality (Xie et al., 2021).
Microbiological air pollution is a problem described in various countries such as Poland (Michałkiewicz, 2018; Staszowska, 2022; Pasmionka, 2019), China (Li et al., 2013; Yang et al., 2018; Han et al., 2018), and Iran (Malakootian et al., 2013; Fathi et al., 2017; Niazi et al., 2015). In Peru, the microbiological quality of indoor air has been studied in places like solid waste treatment plants - SWTP (Mendoza et al., 2020), hospitals (Izquierdo, 2016), markets (Chuquilin et al., 2021), and classrooms (Olivera et al., 2020; Sotelo, 2020). However, the microbiological quality of outdoor air is relatively new. National regulations such as the Air Quality Index or the Environmental Air Quality Standards established by the Ministry of the Environment in Peru do not include measures, control plans, or parameters to determine the microbiological quality of air (Izquierdo, 2016).
The city of Cajamarca has not had a wastewater treatment system since 2007, and its former WWTP facility still receives effluents but has ceased to operate as an active treatment plant for over 20 years. In its current state, wastewater is temporarily stored and then discharged untreated into the river (Tapia, 2017). This exposes the contiguous population and people transiting the area to high levels of pollution as WWTPs generate bioaerosols containing pathogenic bacteria, fungi, and viruses (Gregova et al., 2009) which can disperse and reach long distances (De la Rosa et al., 2002). These can infect the nearby population through inhalation, ingestion, and skin contact (Niazi et al., 2015).
For that reason, this research project aimed to describe the microbiological quality of the air in the area of influence of the former WWTP of Cajamarca. Additionally, it aimed to determine the concentration of microorganisms and relevant genera. Finally, it aimed to understand the incidence of health problems related to the microbiological quality of the air in the study area.
2 Materials and methods
2.1 To determine the concentration of microorganisms present in the air
Microbiological air sampling was conducted in triplicate for each season (dry and rainy) at 5 monitoring points (Figure 1). At each established point, three samplings were carried out in the morning from 7:00 to 9:00 a.m., in the afternoon from 1:00 to 3:00 p.m., and in the evening from 6:00 to 8:00 p.m.
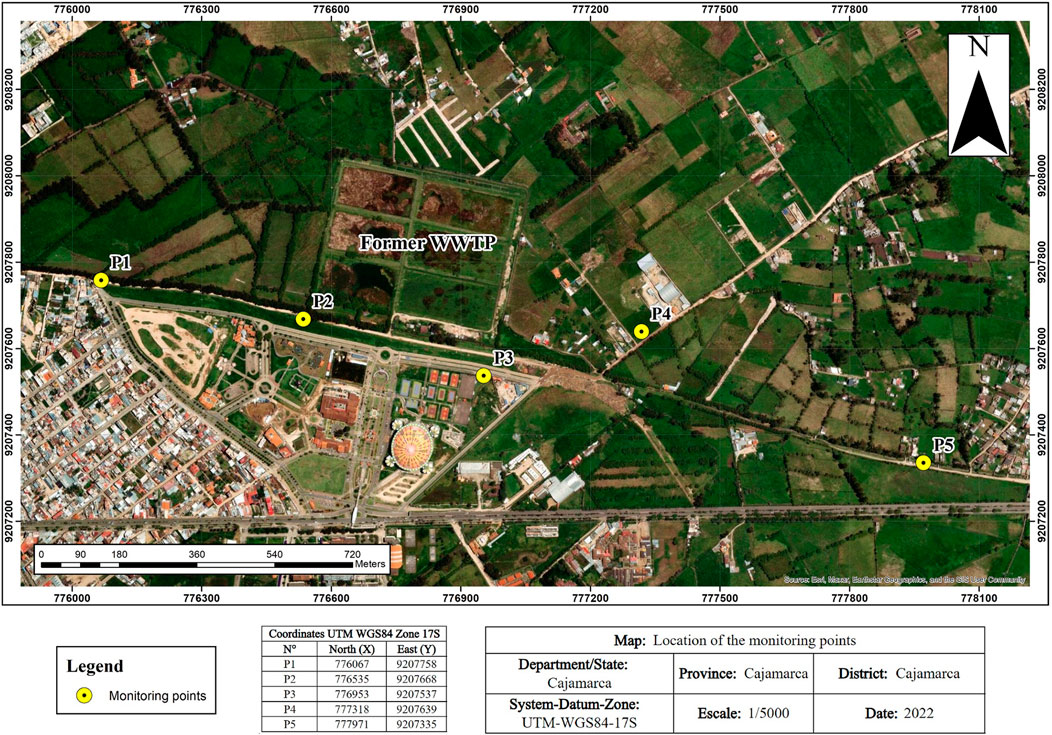
Figure 1. Distribution of monitoring points in the area of influence of the former Cajamarca WWTP.
In Figure 1, the coordinates of sampling points P1-P5 can be observed. These points were carefully selected based on wind direction and speed obtained from a compass rose (Figure 2) and the proximity to the San Lucas River, where untreated wastewater from the old treatment plant is discharged. Using this information, the sampling points were located at different distances from the plant to capture the dispersion of contaminants representatively. Specifically, P1 is situated before the plant, at 0.5 km P2 and P3 are 0.05 km and 0.1 km far from the plant, respectively. P4 is at 0.34 km, and P5 is at 1.0 km from the plant, both near the urban area.
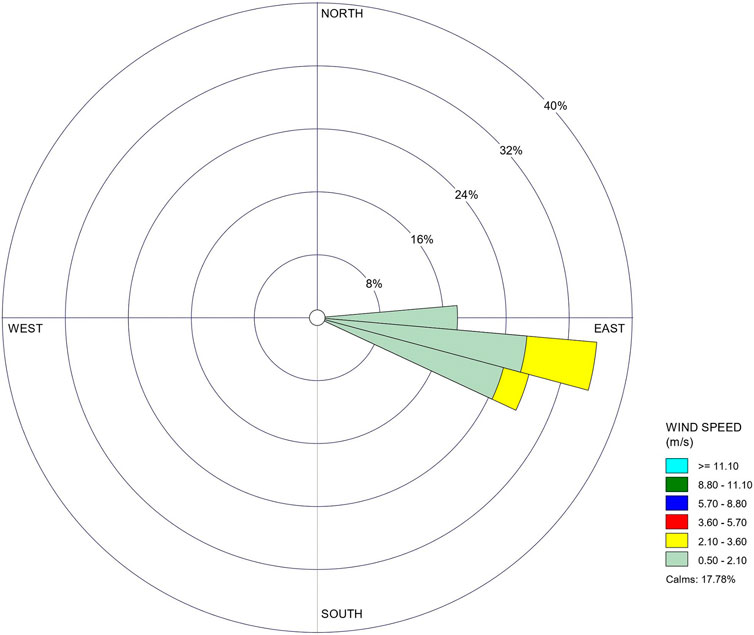
Figure 2. Compass rose of the study area.
For monitoring, a height of 2 m above ground level was chosen to represent human exposure in urban areas. This choice is based on the guidelines of the National Air Quality Monitoring Protocol of Peru (MINAM, 2019), which recommends a height between 1.5 and 3 m to reflect the human breathing zone. Similarly, the Environmental Protection Agency (2017) suggest heights close to 2 m in urban settings to reflect people’s exposure to air contaminants.
Sampling was conducted at a flow rate of 40 L/min for 5 min using the HYCON RCS Standard microbiological sampler by Merck Millipore and tryptic soy agar strips. Temperature and humidity were measured with a Boeco SH-110 thermohygrometer by Boeco Germany. Wind direction and speed were measured with an Extech AN200 anemometer from Extech Instruments Corporation. Using these data, a compass rose was created (Figure 2) to define wind variation in the study area for locating the monitoring points (Figure 1).
The samples were preserved and transported to the laboratory of the Universidad Privada del Norte, where they were incubated at 37°C for 24 h. After the incubation period, colony counts were performed for each tryptic soy agar strip, which contains 34 grids. Then, the conversion from CFU to CFU/m³ was carried out using the conversion factor described in Equation 1.
The results were compared to the OSHA (Occupational Safety and Health Administration) indoor air quality standard since there is no official international standard for outdoor microbiological air quality that establishes values for total microorganism counts. The results for bacteria and fungi concentrations were compared to two Polish standards, PN-89/Z-04111/02 and PN-89/Z-04111/03, respectively. Additionally, for data analysis, the ANOVA test was used to determine if there were significant differences in microorganism concentrations concerning seasons, time of day, and sampling points. Tukey’s Honestly Significant Difference (HSD) test was also employed to identify statistically significant differences between points and monitoring times. Finally, Pearson’s Correlation was used to compare the microorganism values with the meteorological variables recorded in the field.
2.2 To determine the microorganism genera present in the air
The microbial morphology of the colonies that grew on the stripes was analyzed by performing Gram staining for bacteria and lactophenol blue staining for fungi, using a ZEISS Primostar compound microscope manufactured by Carl Zeiss AG. This facilitated the identification of the species present. After the isolation and morphological observation of the colonies, bacterial strains were sent to a commercial clinical laboratory, where standard biochemical tests were performed to identify genera. The data analysis was carried out using IBM SPSS Statistics version 26 to create tables for the identified genera of bacteria and fungi.
2.3 To understand the incidence of health problems related to the microbiological quality of the air
A survey was designed with closed-ended and multiple-choice questions, based on the Likert scale (Likert, 1932), which assigns values to the incidence of health problems: very frequently (5), frequently (4), occasionally (3), rarely (2), and never (1).
The questionnaire was then administered in person to 130 individuals living in the most populated blocks within the area influenced by the former WWTP. Questions that included the Likert scale were identified, and the corresponding scores were assigned to proceed with summing the results. The sum of these scores established the levels of incidence of health problems related to the microbiological quality of the air (Supplementary Table S1). Additionally, Cronbach’s alpha statistical test was applied to the questions following the Likert scale to indicate the degree of internal consistency among the scale’s items (Casas et al., 2003), using IBM SPSS Statistics version 26.
3 Results and discussion
3.1 Concentration of bacteria and fungi
The results presented in Table 1 show elevated levels of bioaerosol concentrations in the area of influence of the former WWTP in Cajamarca. The highest concentrations were 4560 CFU/m³ at the monitoring point P2 during the afternoon and 4115 CFU/m³ at the point P4 during the evening. Sixteen measurements exceeded the limits established by OSHA (2001) for determining air quality concerning the total count of microorganisms (Figure 3). Ten measurements exceeded the PN-89/Z-04111/02 standard for bacteria (Figure 4). This standard classifies air as moderately contaminated when concentrations range between 1,000 CFU/m³ and 3,000 CFU/m³. On the other hand, although fungal levels were elevated, they did not exceed the 5,000 CFU/m³ limit established by the PN-89/Z-04111/03 standard (Figure 5).
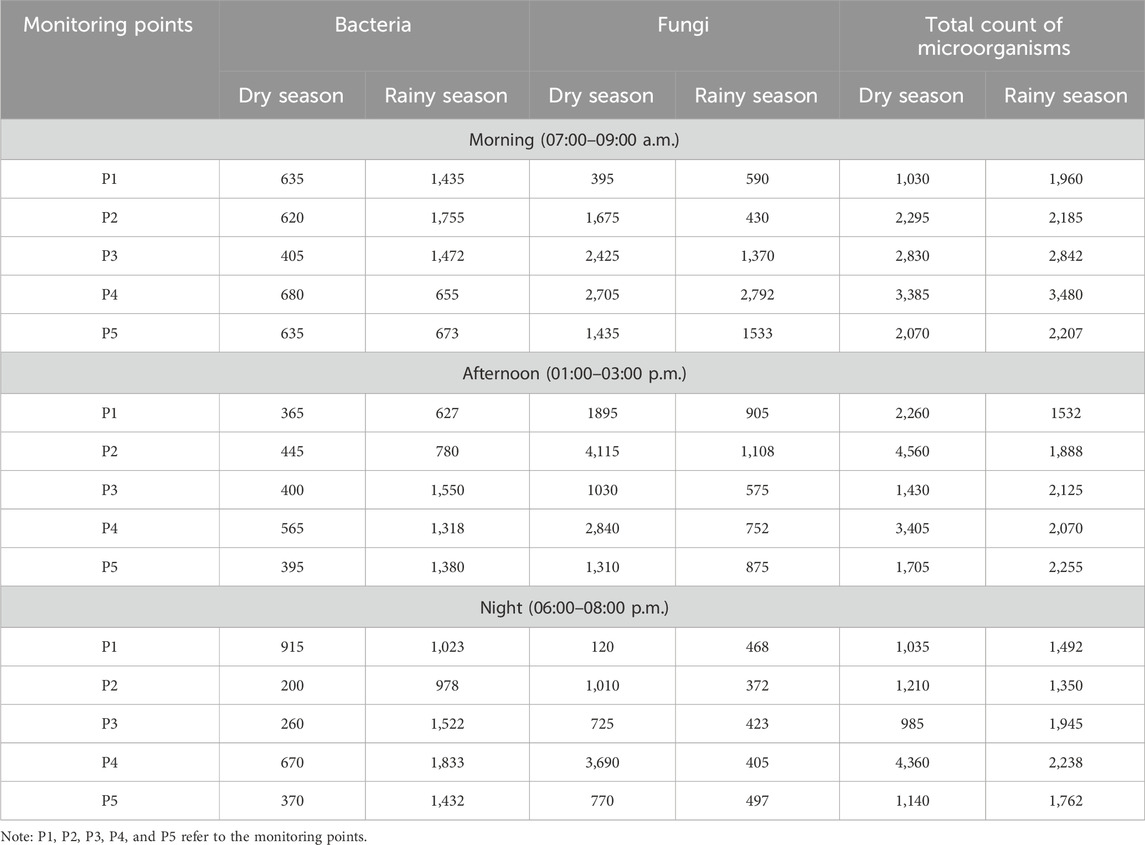
Table 1. Average concentration of bacteria and fungi and total count of microorganisms (CFU/m3) in regards to sampling Schedule, monitoring point, and season.
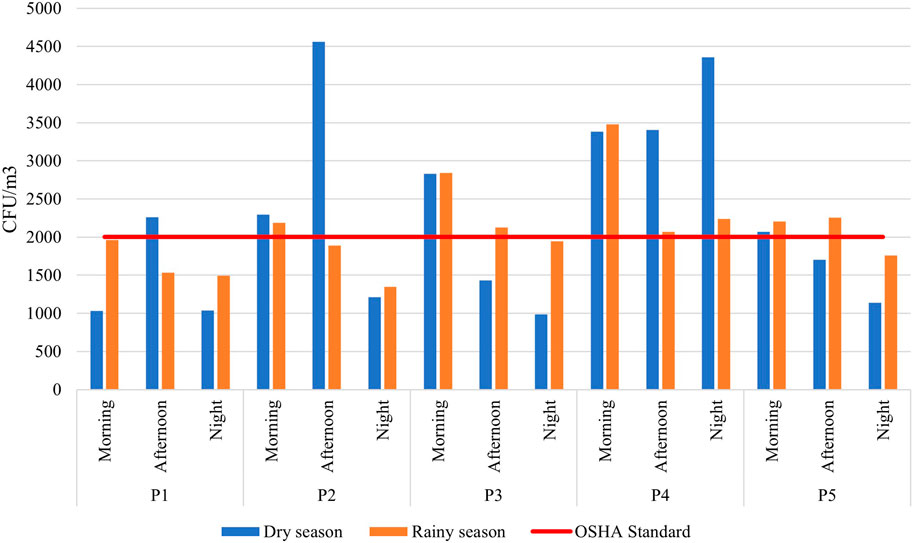
Figure 3. Concentration of total microorganisms (CFU/m3) concerning the OSHA standard.
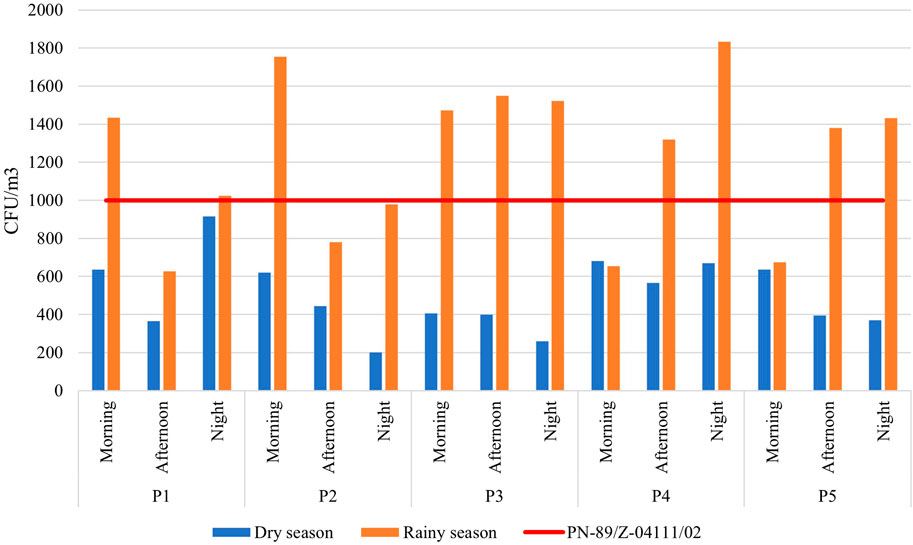
Figure 4. Concentration of bacteria (CFU/m3) concerning the PN-89/Z-04111/02 standard.
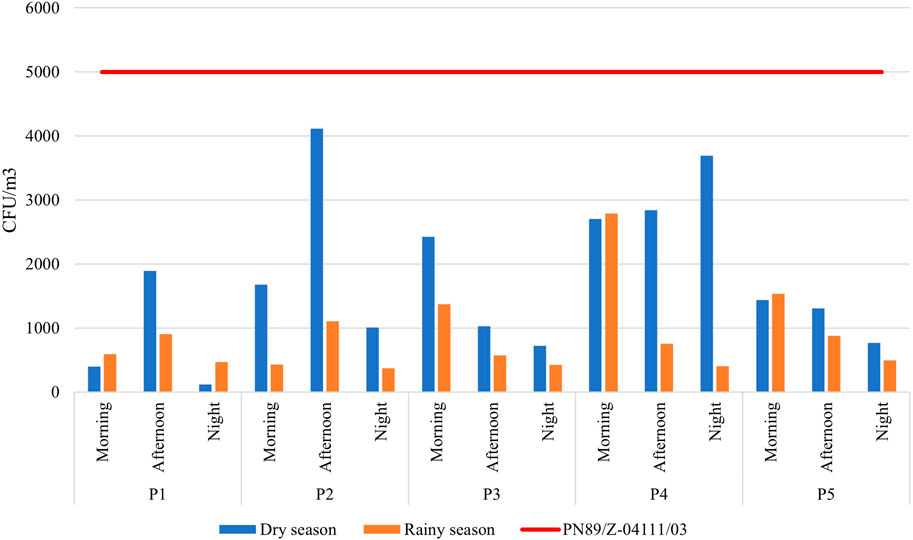
Figure 5. Concentration of fungi (CFU/m3) concerning the PN-89/Z-04111/03 standard.
These results underscore the impact of the former WWTP on local air quality, especially in the absence of an adequate wastewater treatment system. Staszowska (2022) conducted a study in a municipal WWTP in Poland, where the highest outdoor bacterial concentration was 3617 CFU/m³. Our study also revealed higher fungal concentrations compared to similar studies. In an Indonesian WWTP, the highest recorded fungal concentration was 1955 CFU/m³ (Kristanto and Rosana, 2017), while a study in Brazil recorded a maximum concentration of 330 CFU/m³ (Papais et al., 2022). These differences could be related to the characteristics of the infrastructure and the specific environmental conditions of Cajamarca, which favor the accumulation of bioaerosols in the air (Castro et al., 2021).
Water quality studies have determined high levels of fecal coliforms such as Escherichia coli and Enterococcus in the San Lucas River in areas near our monitoring points (García, 2014; Escalante, 2018; Autoridad Nacional del Agua del Perú, (2019). For instance, up to 490,000 MPN/100 mL of fecal coliforms and 110,000 MPN/100 mL of Escherichia coli were found in the river (ANA, 2020). Additionally, studies at WWTPs in various locations have demonstrated that wastewater management releases pathogenic microorganisms into the air (Niazi et al., 2015; Kermani et al., 2016; Kristanto and Rosana, 2017; Małecka-Adamowicz et al., 2017; Pasmionka, 2019; Staszowska, 2022). Therefore, the high concentration of bioaerosols in the study area and surrounding zones is due to the presence, discharge, and runoff of wastewater, such as that generated by the former WWTP, into the San Lucas River. This exposes the nearby population to a higher risk of inhaling potentially pathogenic bioaerosols.
3.1.1 Variation of concentrations
To evaluate the differences in microorganism concentrations according to season, sampling point, and monitoring time, a one-way ANOVA was applied with a 95% confidence interval (Table 2). The analysis revealed no significant differences in microorganism concentrations between the dry and rainy seasons, as the P-value was greater than 0.05.
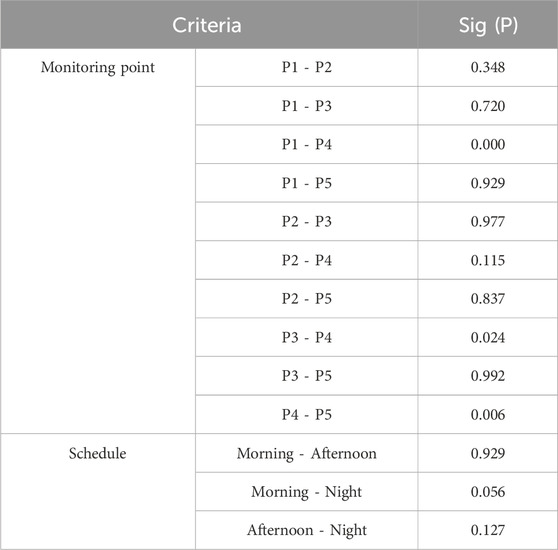
Table 2. P-value results from comparing multiple monitoring points and schedules.
However, when analyzing the concentrations between different sampling points and monitoring times, the P-values were less than 0.05, suggesting that at least one of the values is significantly different. This result may be related to the dispersion of microorganisms from the former WWTP towards the San Lucas River and the proximity of the sampling points to its course (Figure 1). Regarding the monitoring times, the highest concentrations were recorded in the afternoon (4560 CFU/m³) and at night (4360 CFU/m³), which could be related to an increase in humidity during these times (Table 3; Figures 6, 7), as documented in previous studies at the SWTP in Cajamarca (Mendoza et al., 2020).
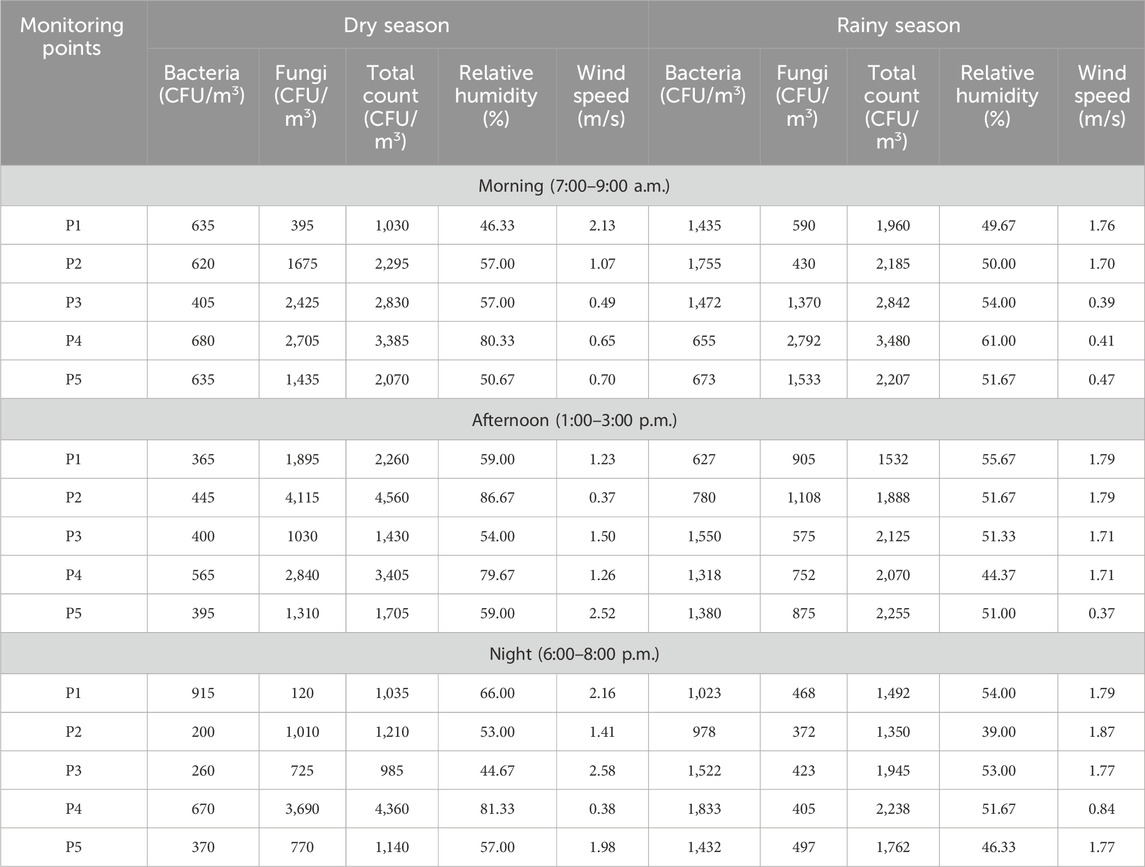
Table 3. Average concentration of bacteria, fungi, and total count of CFU m–3 and meteorological variables.
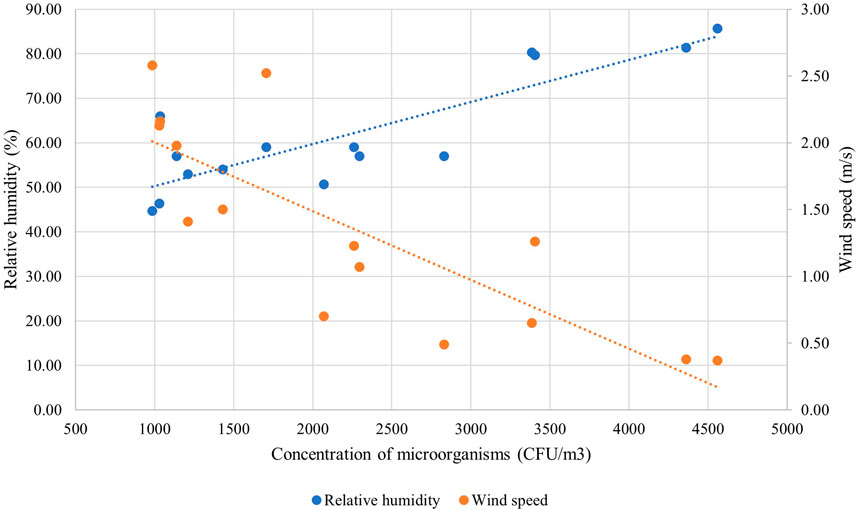
Figure 6. Concentration of microorganisms according to relative humidity and wind speed in the dry season.
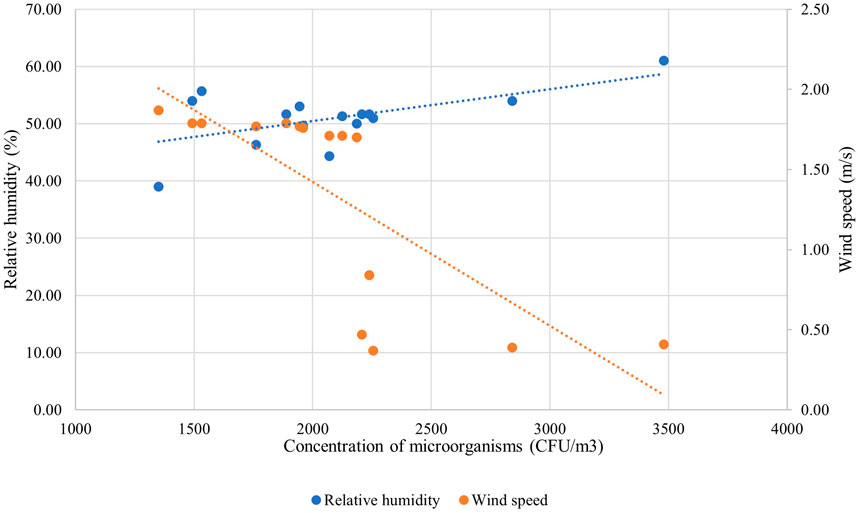
Figure 7. Concentration of microorganisms according to relative humidity and wind speed in the rainy season.
To identify specific differences between points and times, Tukey’s Honestly Significant Difference (HSD) test was applied, allowing the comparison of P-values for all times and points in pairs (Table 2). For the monitoring times, no significant differences were found. In contrast, for the sampling points, Table 2 shows significant differences between P1 and P4 (p = 0.000), P3 and P4 (p = 0.024), and P4 and P5 (p = 0.006). Michalska et al. (2021) link high microorganism concentrations with increased humidity in a study conducted in five cities in the Gulf of Gdansk, Poland. This would explain why point P4 presents significantly different concentrations since humidity levels at this location were higher (Table 3).
Table 1 shows the average concentrations of microorganisms by monitoring point, determined considering the proximity to the former WWTP (Figure 1) and the wind direction (Table 3; Figure 2). The lowest concentration of 2260 CFU/m³ was recorded at point P1, located before the plant. Point P2, situated near the former WWTP, presented the highest concentrations of microorganisms, reaching up to 4560 CFU/m³, and Point P3 also located near the plant had a maximum concentration of 2842 CFU/m³. The highest concentration for point P4 in a populated area was 4360 CFU/m³. Finally, for point P5, the highest concentration was 2255 CFU/m³. This is consistent with previous studies in WWTPs, which document elevated concentrations in areas near discharge sources (Pasmionka, 2019; Fathi et al., 2017).
3.1.2 Influence of meteorological variables in the concentration of microorganisms
The concentrations of airborne microorganisms showed a positive correlation with relative humidity and a negative correlation with wind speed, as shown in Table 3 and Figures 6, 7. During the dry season, the relative humidity reached a maximum value of 85.67%, whereas, in the rainy season, the maximum was 61%. The Pearson correlation coefficient between relative humidity and microorganism concentration was 0.86 in the dry season and 0.59 in the rainy season. It is worth noting that the study area in Cajamarca has a semi-dry climate with abundant humidity that is constant throughout the year (Castro et al., 2021). Similar situations were documented by Kristanto and Rosana (2017) and Dehghani et al. (2018), who concluded that higher humidity levels are correlated with higher microorganism concentrations.
Regarding wind speed, the highest value recorded in the dry season was 2.58 m/s, and 1.87 m/s during the rainy season. The correlation coefficients were −0.82 in the dry season and −0.76 in the rainy season, indicating that an increase in wind speed reduces microorganism concentration. This phenomenon occurs because the wind disperses microorganisms, decreasing their concentration in areas close to the emission source and expanding it to more distant areas (Wang et al., 2018; Yang et al., 2018). Altogether, these results suggest that microorganism concentrations in the air are influenced by humidity, which favors their persistence in the air, and wind speed, which facilitates their dispersion. Both factors play a crucial role in the distribution and exposure to these microorganisms in the study area.
3.2 Microorganism genera present in the air
Table 4 presents the genera of microorganisms found in the air at the five sampling points. Eight bacterial genera were identified: Micrococcus, Rhodococcus, Bacillus, Staphylococcus, Streptococcus, Enterococcus, Escherichia, and Proteus. These bacteria are common in natural and urban environments, and some are known for their pathogenic potential, making their monitoring crucial in urban settings (Chen et al., 2020). Regarding fungi, five genera were identified: Aspergillus, Penicillium, Rhodotorula, Mucor, and Rhizopus. These microorganisms are particularly relevant due to their ability to produce mycotoxins and cause infections, especially in immunocompromised individuals (Brown et al., 2021). The presence of these pathogenic microorganisms in inhabited areas near the former WWTP highlights the potential risk for residents, as prolonged exposure to these bioaerosols could lead to health issues, particularly in vulnerable groups (Jahne et al., 2015).
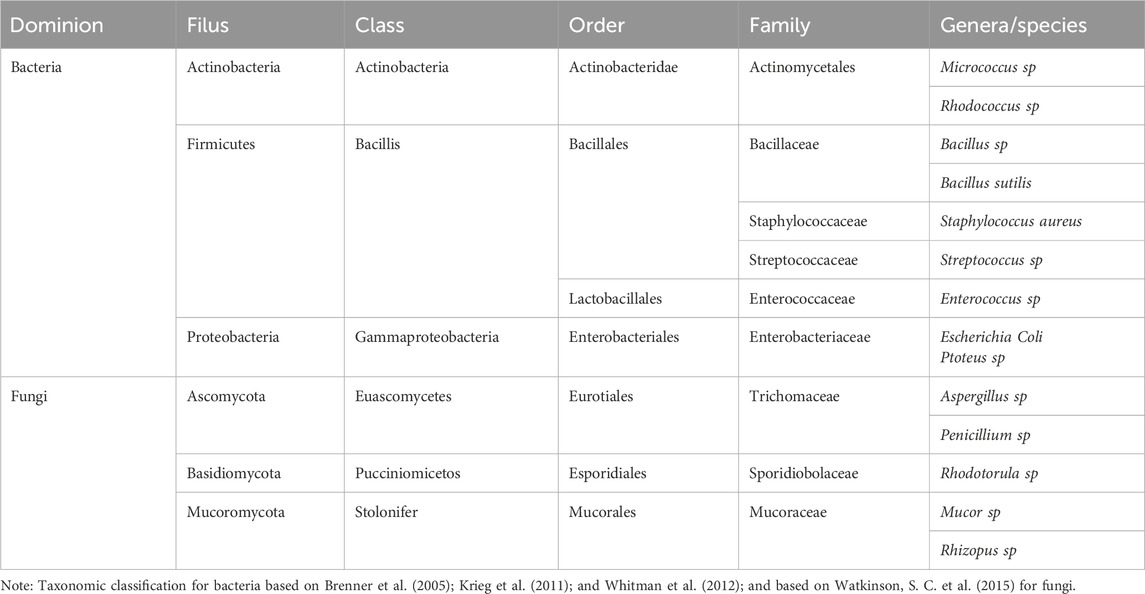
Table 4. Microorganisms found at the 5 monitoring points.
Regarding bacteria, a study conducted at a wastewater treatment plant (WWTP) in Bydgoszcz, Poland, revealed that Staphylococcus was the most abundant bacterial genus at all monitoring points throughout the WWTP (Małecka-Adamowicz et al., 2017). As for fungi, our results align with those found at a WWTP in Tehran, Iran (Niazi et al., 2015). Here, genera known for thriving in unfavorable environments due to their metabolic capabilities, such as Cladosporium spp., Penicillium spp., Aspergillus spp., and Alternaria spp., were identified. Similarly, in the Gulf of Gdansk, Poland, fungi of the genera Penicillium and Aspergillus were identified in the wastewater discharge area, reinforcing the prevalence of these genera in contaminated aquatic environments (Michalska et al., 2021).
3.3 Incidence of health problems related to the microbiological quality of the air
The statistical analysis of the information obtained from the survey was conducted using IBM SPSS version 26, where Cronbach’s alpha was applied to evaluate the reliability of the scale used. The obtained value was 0.823, which is within the acceptable range, as the minimum acceptable value is 0.70 and the maximum expected value is 0.90 (Oviedo and Campo, 2022). This result indicates that the scale used is reliable and has good internal consistency.
Figure 8 presents the impact of microorganisms on the health of the population in the area of influence of the former WWTP. Of the total respondents, 34% reported a low level of health problems, followed by 29% with a normal level. 18% indicated a high level of incidence, and 15% reported a very low level. Only 4% showed a very high level of incidence. These results may be influenced by various factors, such as age, location, and length of residence, which affect the population’s vulnerability to the microorganisms present in the air (Vargas, 2005). Herrera et al. (2009) suggested that exposure to microbiological contamination does not necessarily translate into high levels of health incidence. The lack of health knowledge and constant exposure to this environment influence the subjective perception of the respondents. This causes individuals to not fully identify the effects of these microorganisms on their wellbeing.
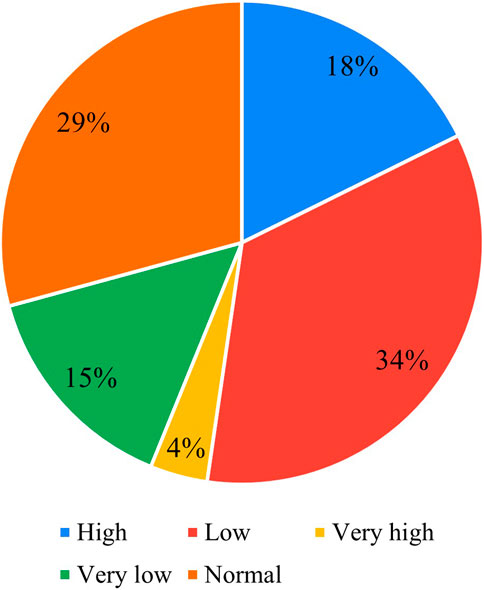
Figure 8. Level of incidence of health problems related to the microbiological quality of the air in the area of influence of the former WWTP.
Table 5 presents the relationship between the symptoms reported by the population and the microorganisms identified in the microbiological sampling. 77% of the reported symptoms were nasal problems, such as sneezing, rhinitis, congestion, and dryness, which are commonly associated with bacteria such as Bacillus sp., B. subtilis, Rhodococcus sp., Micrococcus sp. (Chen et al., 2020) and fungi such as Aspergillus sp., Mucor sp., and Rhizopus sp. (Brown et al., 2021). Suaza and Valoyes (2019) in Antioquia, Spain, established a close relationship between air pollution and respiratory problems in the population, particularly in children and the elderly. Additionally, particulate matter has been identified as a factor that influences the development and persistence of bioaerosols. That is why it is necessary to further explore the interaction between these variables and their potential long-term health effects (Liu et al., 2020).
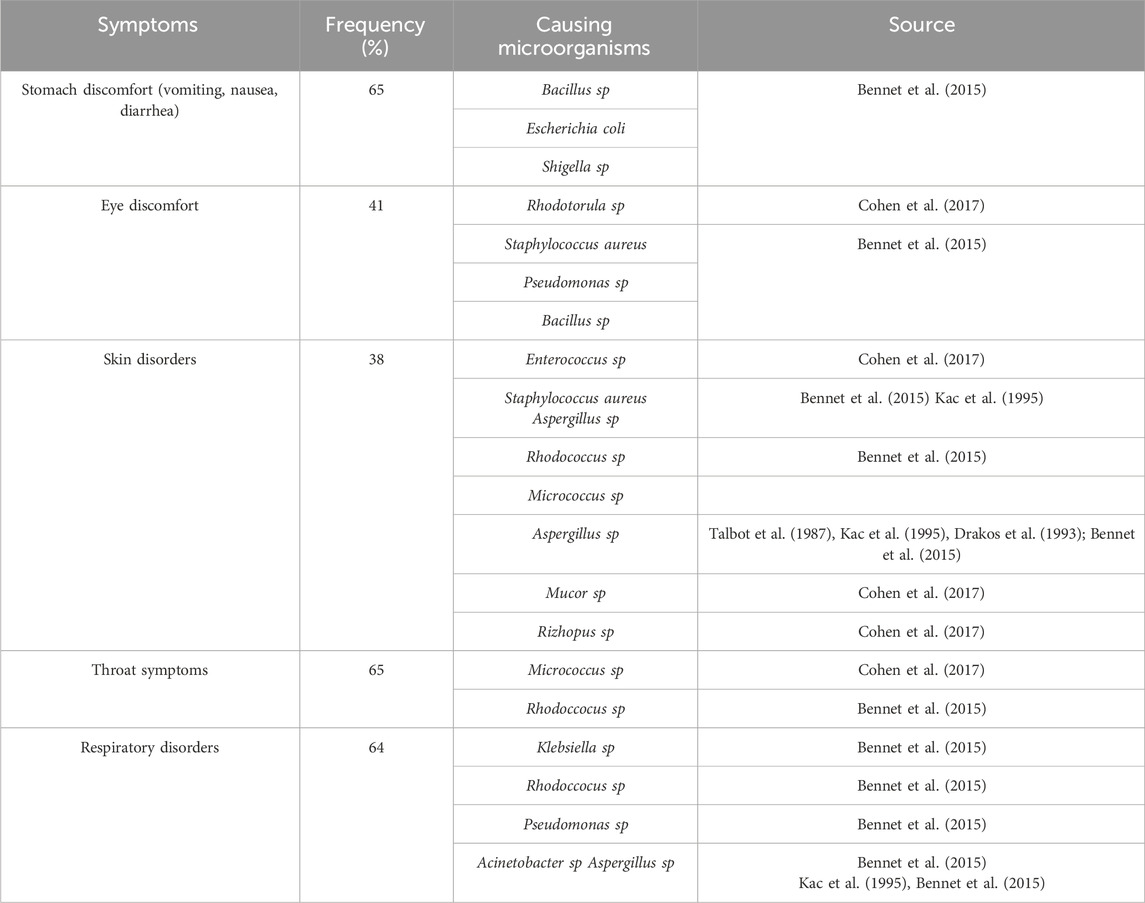
Table 5. Health issue-causing microorganisms linked to the air quality in the area of influence near Cajamarca’s former WWTP.
4 Conclusion
The results of this research project show that the microbiological quality of the air in the area influenced by the former WWTP in Cajamarca is not optimal. There are elevated concentrations of microorganisms, especially bacteria, exceeding the limits established by international standards OSHA and PN-89/Z-04111/02. Fungal levels, although elevated, do not exceed the limits of the PN-89/Z-04111/03 standard. Additionally, it was observed that microorganism concentrations are statistically similar between seasons and monitoring times, but differ according to the monitoring point. Furthermore, the concentrations have a positive correlation with relative humidity and a negative correlation with wind speed for both seasons.
Eight bacterial genera and five fungal genera were identified, with notable bacteria genera including Micrococcus, Rhodococcus, Bacillus, Staphylococcus, Streptococcus, Enterococcus, Escherichia coli, and Proteus, and notable fungi genera including Aspergillus, Penicillium, Rhodotorula, Mucor, and Rhizopus. Despite the high concentrations of microorganisms, a low incidence of health problems related to the microbiological quality of the air was observed in the surrounding population, with occasional respiratory illnesses mainly commonly associated with Bacillus sp., B. subtilis, Rhodococcus sp., Micrococcus sp., and fungi such as Aspergillus sp., Mucor sp., and Rhizopus sp.
The limitations of this research include the scarcity of bibliographic data in the national and regional context, although international studies provided valuable information for the discussion. Our study suggests the need to implement regular air and water quality monitoring in areas near WWTPs to have a comprehensive view of environmental risks. Additionally, we suggest evaluating the dispersion of bioaerosols at different sampling heights and during various seasons of the year. This would provide more complete data to develop effective public health policies in areas adjacent to WWTPs.
Data availability statement
The original contributions presented in the study are included in the article/Supplementary Material, further inquiries can be directed to the corresponding authors.
Author contributions
CR-Z: Conceptualization, Formal Analysis, Funding acquisition, Investigation, Methodology, Project administration, Resources, Supervision, Validation, Visualization, Writing–original draft, Writing–review and editing. JS-A: Conceptualization, Formal Analysis, Investigation, Methodology, Resources, Validation, Writing–original draft, Writing–review and editing. MS-P: Conceptualization, Funding acquisition, Methodology, Resources, Supervision, Writing–review and editing. KD: Conceptualization, Formal Analysis, Investigation, Methodology, Resources, Supervision, Visualization, Writing–review and editing.
Funding
The author(s) declare that financial support was received for the research, authorship, and/or publication of this article. This work was supported by the Universidad Privada del Norte (UPN) from Peru.
Acknowledgments
The authors wish to thank the Universidad Privada Del Norte for funding this article and allowing the use of the Biology Laboratory.
Conflict of interest
The authors declare that the research was conducted in the absence of any commercial or financial relationships that could be construed as a potential conflict of interest.
Publisher’s note
All claims expressed in this article are solely those of the authors and do not necessarily represent those of their affiliated organizations, or those of the publisher, the editors and the reviewers. Any product that may be evaluated in this article, or claim that may be made by its manufacturer, is not guaranteed or endorsed by the publisher.
Supplementary material
The Supplementary Material for this article can be found online at: https://www.frontiersin.org/articles/10.3389/fenvs.2024.1496978/full#supplementary-material
References
Autoridad Nacional del Agua del Perú (ANA) (2019). “Monitoreo de Calidad de Agua 2019-I en la Cuenca Crisnejas del Río Mashcon (RMash2),” in Visor por cuencas del ANA. Available at: https://snirh.ana.gob.pe/VisorPorCuenca/.
Autoridad Nacional del Agua del Perú (ANA) (2020). “Monitoreo de Calidad de Agua 2020-I en la Cuenca Crisnejas del Río Mashcon (RMash2),” in Visor por cuencas del ANA. Available at: https://snirh.ana.gob.pe/VisorPorCuenca/.
Bennet, J., Dolin, R., Blaser, M., and Mandell, D. (2015). Bennett’s principles and practice of infectious diseases. Elsevier. doi:10.1016/C2012-1-00075-6
D. J. Brenner, N. R. Krieg, J. T. Staley, and G. M. Garrity (2005). Bergey’s manual of systematic bacteriology. The proteobacteria (Springer).
Brown, R., Priest, E., Naglik, J. R., and Richardson, J. P. (2021). Fungal toxins and host immune responses. Front. Microbiol. 12, 643639. doi:10.3389/fmicb.2021.643639
Casas, J., Repullo, J., and y Donado, J. (2003). La encuesta como técnica de investigación. Elaboración de cuestionarios y tratamiento estadístico de los datos (I). Atención primaria 31 (8), 527–538. doi:10.1016/S0212-6567(03)70728-8
Castro, A., Davila, C., Laura, W., Cubas, F., Avalos, G., López, C., et al. (2021). Climas Del Perú – Mapa de Clasificación Climática Nacional. S. Red Activa Soluciones Gráficas. Available at: https://www.senamhi.gob.pe/load/file/01404SENA-4.pdf.
Chen, X., Kumari, D., and Achal, V. (2020). A review on airborne microbes: the characteristics of sources, pathogenicity and geography. Atmosphere 11 (9), 919. doi:10.3390/atmos11090919
Chuquilin, D., Rojas, N., Sánchez, M., and Flores, J. (2021). “Calidad microbiológica del aire interior del mercado central de Cajamarca - perú,” in Proceedings of the 19th LACCEI International Multi-Conference for Engineering, Education, and Technology: “Prospective and trends in technology and skills for sustainable social development” “Leveraging emerging technologies to construct the future.” Latin American and Caribbean Consortium of Engineering Institutions. doi:10.18687/LACCEI2021.1.1.335
J. Cohen, W. Powderly, and S. Opal (2017). Infectious diseases. 4th edn. (Elsevier). doi:10.1016/C2013-1-00044-3
Dehghani, M., Sorooshian, A., Ghorbani, M., Fazlzadeh, M., Miri, M., Badiee, P., et al. (2018). Seasonal variation in culturable bioaerosols in a wastewater treatment plant. Aerosol Air Qual. Res. 18 (11), 2826–2839. doi:10.4209/aaqr.2017.11.0466
De la Rosa, M., Mosso, M., and Ullán, C. (2002). El aire: hábitat y medio de transmisión de microorganismos. Obs. Medioambient. 5, 375–402. Available at: https://revistas.ucm.es/index.php/OBMD/article/view/OBMD0202110375A.
Drakos, P. E., Nagler, A., Or, R., Naparstek, E., Kapelushnik, J., Engelhard, D., et al. (1993). Invasive fungal sinusitis in patients undergoing bone marrow transplantation. Bone Marrow Transplant. 12 (3), 203–208.
Environmental Protection Agency (EPA) (2017). Quality assurance handbook for air pollution measurement systems: volume II. Ambient air quality monitoring program. Washington, D.C.: EPA.
Escalante, J. (2018). Caracterización de las aguas del río Mashcón y San Lucas y del efluente de las lagunas de estabilización de la ciudad de Cajamarca con fines de evaluación ambiental, marzo-agosto del 2007. Tesis de maestría. Perú: Universidad Nacional de Cajamarca, Cajamarca.
Fathi, S., Hajizadeh, Y., Nikaeen, M., and Gorbani, M. (2017). Assessment of microbial aerosol emissions in an urban wastewater treatment plant operated with activated sludge process. Aerobiologia 33 (4), 507–515. doi:10.1007/s10453-017-9486-2
Fracchia, L., Pietronave, S., Rinaldi, M., and Giovanna Martinotti, M. (2006). Site-related airborne biological hazard and seasonal variations in two wastewater treatment plants. Water Res. 40 (10), 1985–1994. doi:10.1016/j.watres.2006.03.016
Fula, Y., and Rey, I. (2005). Evaluación de la contaminación de aire por microorganismos patógenos en los bioaerosoles en una zona de alta actividad industrial y flujo vehicular de la localidad de Puente Arana. Bogotá Univ. Salle.
García, F. (2014). “Calidad y uso del agua en la subcuenca del San Lucas (Cajamarca) en función del índice de Brown,” in Tesis doctoral. Perú: Universidad Nacional de Cajamarca, Cajamarca.
Gregova, G., Venglowsky, J., Kmet, V., Vargova, M., Sasakova, N., Lakticova, K., et al. (2009). “Biological hazard resulting from wastewater treatment related of bioaerosol concentration,” in Proceedings of the 14th international congress of the international society for animal hygiene, vechta, Germany 19-23 july, 909–912. Available at: https://typeset.io/papers/biological-hazard-resulting-from-wastewater-treatment-3xf3ka3vei.
Han, Y., Wang, Y., Li, L., Xu, G., Liu, J., and Yang, K. (2018). Bacterial population and chemicals in bioaerosols from indoor environment: sludge dewatering houses in nine municipal wastewater treatment plants. Sci. Total Environ. 618, 469–478. doi:10.1016/j.scitotenv.2017.11.071
Herrera, K., Cóbar, O., León, J., Jáuregui, E., Rodas, A., Gudiel, H., et al. (2009). Proyecto FODECYT: Impacto de la calidad microbiológica del aire externo en el ambiente interno en la salud del personal de cuatro laboratorios de instituciones públicas en la Ciudad de Guatemala y Bárcenas Villa Nueva. (N002-08). Univ. San Carlos Guatem.
Izquierdo, G. (2016). Calidad microbiológica del aire en los interiores del hospital EsSalud en Tingo María. Univ. Nac. Agrar. Selva. Available at: https://web2.unas.edu.pe/sites/default/files/web/archivos/actividades_academicas/CALIDAD%20MICROBIOLOGICA%20AMBIENTAL%20DEL%20AIRE%20EN%20LOS%20INTERIORES%20DEL%20HOSPITAL%20EsSALUD%20EN%20TINGO%20MARIA.pdf.
Jahne, M. A., Rogers, S. W., Holsen, T. M., Grimberg, S. J., and Ramler, I. P. (2015). Emission and dispersion of bioaerosols from dairy manure application sites: human health risk assessment. Environ. Sci. and Technol. 49 (16), 9842–9849. doi:10.1021/acs.est.5b01981
Kac, G., Roux, P., Poirot, J. L., Meyohas, M. C., Cadranel, J., Chouaid, C., et al. (1995). Aspergillus and aspergillosis: a retrospective study in two Paris hospitals. J. Mycol. Med. (Paris) 5 (2), 75–85.
Kermani, M., Dehghani, A., Farzadkia, M., Asl, F. B., and y Zeinalzadeh, D. (2016). Assessment of bioaerosol contamination in an urban wastewater treatment plant in Tehran, Iran. J. Air Pollut. Health 1 (3), 161–170. Available at: https://japh.tums.ac.ir/index.php/japh/article/view/48.
N. R. Krieg, J. T. Staley, D. R. Brown, B. P. Hedlund, B. J. Paster, N. L. Wardet al. (2011). Bergey's manual of systematic bacteriology: vol. 4. The bacteroidetes, spirochaetes, tenericutes (mollicutes), acidobacteria, fibrobacteres, fusobacteria, dictyoglomi, gemmatimonadetes, lentisphaerae, verrucomicrobia, chlamydiae, and planctomycetes (Springer).
Kristanto, G., and Rosana, F. (2017). Analysis of microbial air quality in the surrounding hospital’s wastewater treatment plants in jakarta, Indonesia. MATEC Web Conf. 138, 08004. doi:10.1051/matecconf/201713808004
Li, Y., Zhang, H., Qiu, X., Zhang, Y., and Wang, H. (2013). Dispersion and risk assessment of bacterial aerosols emitted from rotating-brush aerator during summer in a wastewater treatment plant of xi’an, China. Aerosol Air Qual. Res. 13, 1807–1814. doi:10.4209/aaqr.2012.09.0245
Liu, M., Nobu, M. K., Ren, J., Jin, X., Hong, G., and Yao, H. (2020). Bacterial compositions in inhalable particulate matters from indoor and outdoor wastewater treatment processes. J. Hazard. Mater. 385, 121515. doi:10.1016/j.jhazmat.2019.121515
Malakootian, M., Radhakrishna, N., Mazandarany, M. P., and Hossaini, H. (2013). Bacterial-aerosol emission from wastewater treatment plant. Desalination Water Treat. 51 (22–24), 4478–4488. doi:10.1080/19443994.2013.769668
Małecka-Adamowicz, M., Kubera, Ł., Donderski, W., and Kolet, K. (2017). Microbial air contamination on the premises of the sewage treatment plant in Bydgoszcz (Poland) and antibiotic resistance of Staphylococcus spp. Archives Environ. Prot. 43 (4), 58–65. doi:10.1515/aep-2017-0040
Mendoza, L., Sanchez, M., Velasquez, M., and Jambo, L. (2020). “Evaluación de la calidad microbiológica del aire en el área de influencia de la planta de tratamiento de residuos sólidos de Cajamarca,” in 18th laccei international multi-Conference for engineering, education, and technology: engineering, integration, and Alliances for A sustainable development” “hemispheric Cooperation for Competitiveness and Prosperity on A knowledge-based economy.” Latin American and caribbean consortium of engineering institutions. doi:10.18687/LACCEI2020.1.1.489
Michałkiewicz, M. (2018). Comparison of wastewater treatment plants based on the emissions of microbiological contaminants. Environ. Monit. Assess. 190 (11), 640. doi:10.1007/s10661-018-7035-2
Michalska, M., Waz, P., Kurpas, M., Marcks, R., and Zorena, K. (2021). Higher number of yeast-like fungi in the air in 2018 after an emergency discharge of raw sewage to the Gulf of gdańsk—use of contingency tables. Symmetry 13 (8), 1522. doi:10.3390/sym13081522
Ministerio del Ambiente (MINAM) (2019). Protocolo Nacional de Monitoreo de la Calidad del Aire. Lima, Perú: MINAM.
Ministry of Housing, Construction and Sanitation of Peru (Ministerio de Vivienda, Construcción y Saneamiento) (2006). Reglamento nacional de edificaciones (ds N 011-2006-VIVIENDA). Lima, Perú: El Peruano. Available at: https://ww3.vivienda.gob.pe/Direcciones/Documentos/RNE_Actualizado_Solo_Saneamiento.pdf.
Niazi, S., Hassanvand, M. S., Mahvi, A. H., Nabizadeh, R., Alimohammadi, M., Nabavi, S., et al. (2015). Assessment of bioaerosol contamination (bacteria and fungi) in the largest urban wastewater treatment plant in the Middle East. Environ. Sci. Pollut. Res. 22 (20), 16014–16021. doi:10.1007/s11356-015-4793-z
Olivera, L., Oré, L., Loarte, W., Oré, J., García, G. y., and Diaz, J. (2020). Calidad microbiológica del aire en seis áreas de la microestación biológica zoocriadero de la Universidad Nacional Agraria de la Selva, Tingo María, Perú. Bol. Malariol. Salud Ambient. 61 (4), 620–632. Available at: http://iaes.edu.ve/iaespro/ojs/index.php/bmsa/article/view/298.
Osha, O. S. (2001). Indoor air quality, occupational safety health administration. Fed. Regist. 66, 6494.
Oviedo, H., and Campo, A. (2022). Aproximación al uso del coeficiente alfa de Cronbach. Rev. Colomb. Psiquiatr. 34 (4), 572–580. Available at: http://www.scielo.org.co/scielo.php?script=sci_arttext&pid=S003474502005000400009.
Papais, I., Silva, D., Goncalves, F., Miranda, R., and Duo Filho, V. (2022). Análise de bioaerossóis em estação de tratamento de esgotos. Rev. Ibero Am. Ciências Ambient. 13, 166–182. doi:10.6008/CBPC2179-6858.2022.011.0014
Pasmionka, I. (2019). Assessment of microbial contamination of atmospheric air in a selected wastewater treatment plant. Archives Environ. Prot., 60–67. doi:10.24425/aep.2019.130242
Sotelo, B. (2020). Calidad microbiológica del aire en las aulas de la Facultad de Ciencias Forestales y del Ambiente de la Universidad Nacional del Centro del Perú durante el semestre 2018 – I. Univ. Peru. los Andes. Available at: https://repositorio.upla.edu.pe/handle/20.500.12848/1754.
Staszowska, A. (2022). Microbiological quality of indoor and outdoor air in a municipal wastewater treatment plant - a case study. J. Ecol. Eng. 23 (2), 185–190. doi:10.12911/22998993/145202
Suaza, A., and Valoyes, C. (2019). Bioaerosoles asociados a la polución del aire y sus efectos en la salud humana: un scoping review de las investigaciones a nivel mundial, 2005–2019. Available at: http://hdl.handle.net/10495/19825.
Talbot, G. H., Weiner, M. H., Gerson, S. L., Provencher, M., and Hurwitz, S. (1987). Serodiagnosis of invasive Aspergillosis in patients with hematologic malignancy: validation of the Aspergillus fumigatus antigen radioimmunoassay. J. Infect. Dis. 155 (1), 12–27. doi:10.1093/infdis/155.1.12
Tapia, S. (2017). Proyecto de ley: Ley que declara de necesidad pública e interés nacional la construcción del proyecto. Instalación Sist. Trat. aguas residuales ciudad Cajamarca, Prov. Dep. Cajamarca. Available at: https://www.leyes.congreso.gob.pe/Documentos/2016_2021/Proyectos_de_Ley_y_de_Resoluciones_Legislativas/PL0292720180524.pdf.
Vargas, F. (2005). La contaminación ambiental como factor determinante de la salud. Rev. Española Salud Pública 79 (2), 117–127. Available at: http://scielo.isciii.es/scielo.php?script=sci_arttext&id=S1135-57272005000200001&lng=es&tlng=es.
Wang, Y., Li, L., Han, Y., Liu, J., and Yang, K. (2018). Intestinal bacteria in bioaerosols and factors affecting their survival in two oxidation ditch process municipal wastewater treatment plants located in different regions. Ecotoxicol. Environ. Saf. 154, 162–170. doi:10.1016/j.ecoenv.2018.02.041
W. B. Whitman, M. Goodfellow, P. Kämpfer, H.-J. Busse, M. E. Trujillo, W. Ludwiget al. (2012). Bergey’s manual of systematic bacteriology. The actinobacteria. Vol. 5 (Springer).
World Health Organization (2021). Patógenos multirresistentes que son prioritarios para la OMS. Organización Panamericana de la Salud. Available at: https://www.paho.org/es/noticias/4-3-2021-patogenos-multirresistentes-que-son-prioritarios-para-oms.
Xie, W., Li, Y., Bai, W., Hou, J., Ma, T., Zeng, X., et al. (2021). The source and transport of bioaerosols in the air: a review. Front. Environ. Sci. and Eng. 15 (3), 44. doi:10.1007/s11783-020-1336-8
Keywords: wastewater treatment plant (WWTP), air pollution, bioaerosols, microbiological quality of air, concentration of microorganisms
Citation: Rodriguez-Zevallos CE, Sanchez-Altamirano JK, Sanchez-Peña MA and Diaz K (2025) Microbiological quality of the air in the area of influence of the former wastewater treatment plant in Cajamarca, Peru. Front. Environ. Sci. 12:1496978. doi: 10.3389/fenvs.2024.1496978
Received: 16 September 2024; Accepted: 13 December 2024;
Published: 13 January 2025.
Edited by:
Rui Li, East China Normal University, ChinaReviewed by:
Amelia Beata Staszowska, Lublin University of Technology, PolandKeunje Yoo, Korea Maritime and Ocean University, Republic of Korea
Copyright © 2025 Rodriguez-Zevallos, Sanchez-Altamirano, Sanchez-Peña and Diaz. This is an open-access article distributed under the terms of the Creative Commons Attribution License (CC BY). The use, distribution or reproduction in other forums is permitted, provided the original author(s) and the copyright owner(s) are credited and that the original publication in this journal is cited, in accordance with accepted academic practice. No use, distribution or reproduction is permitted which does not comply with these terms.
*Correspondence: Claudia E. Rodriguez-Zevallos, TjAwMTY2ODMzQHVwbi5wZQ==; Marco A. Sanchez-Peña, bWFyY28uc2FuY2hlekB1cG4ucGU=
†These authors have contributed equally to this work and share first authorship
‡ORCID: Kenny Diaz, orcid.org/0000-0002-8904-2041