 Xiongtian Shi
 Zhenghao Zhou2*†
 Zhengyong Yu
- 1School of Business Administration and Tourism Management, Yunnan University, Kunming, China
- 2School of Economics and Management, Sichuan Aba Vocational College, Aba, China
This research analyzes the spatio-temporal evolution and driving factors of agricultural land use carbon emissions (ALUCE) in China from 2013 to 2022, utilizing LMDI and STIRPAT models. Key findings include: (1) Significant regional disparities exist, with eastern provinces exhibiting high and increasing ALUCE levels, while western provinces remain low and stable, necessitating targeted regional strategies and technological support. (2) Total ALUCE in China decreased by 8.6%, highlighting the need to optimize high carbon emission sources for sustainable agriculture. (3) ALUCE inequality is stable yet slightly variable, driven by inter-provincial differences, with spatial polarization evident. (4) Agricultural production efficiency inhibits ALUCE, while output increases and labor scale positively contribute. A novel environmental organizational framework is proposed to reduce ALUCE, offering policy implications for developing countries focused on regional strategies, technical support, and sustainable practices.
1 Introduction
The plantation industry is a core component of agriculture. It plays a crucial role in maintaining ecological balance and ensuring national food and economic security (Suarez, 2024). Over time, with the development of agricultural mechanization and agrochemicals, the economic efficiency of China’s plantation industry has increased significantly. However, due to traditional development models, the major challenges faced by the farming industry include high energy consumption, severe environmental pollution, and high emissions (Chen et al., 2024). These problems not only damage ecosystem health but also gradually reduce the quality of arable land resources, seriously hindering the sustainable development of the plantation industry. In response, China introduced the “dual-carbon” strategy, aiming for carbon peaking and carbon neutrality. The government has elevated green development as a core concept, emphasizing a shift from high-speed growth to high-quality development (Zhang et al., 2024). This strategic pivot highlights the need for a low-carbon transformation within the agricultural sector, making the plantation industry a key focus of sustainable development efforts. According to recent data, cropping activities account for approximately 30%–40% of the total agricultural carbon emissions in China, with the use of chemical fertilizers, energy consumption in irrigation, and changes in land use being significant contributors (Xu et al., 2022; Liao and Zhou, 2023). This underscores the critical role of the plantation industry in achieving carbon reduction goals and promoting sustainable agricultural practices. Therefore, addressing agricultural land use carbon emissions (ALUCE) is crucial, as it plays a significant role in reducing overall carbon emissions and advancing the low-carbon transition in the agricultural sector.
The research on ALUCE has been extensively conducted, covering multiple aspects including measurement methods, spatiotemporal evolution, driving factors, and low-carbon transition pathways. (1) Regarding the calculation method of ALUCE, the carbon emission coefficient method has become the primary tool for assessing ALUCE. This method estimates total carbon emissions by calculating the carbon emissions associated with each agricultural activity’s inputs and outputs. Although this method is widely applied in assessing agricultural land carbon emissions, it faces challenges in terms of accuracy and spatial-temporal adaptability. Therefore, more precise carbon emission measurement and modeling techniques need further development to improve the accuracy and temporal resolution of the data (Cederlöf, 2016; Xuan et al., 2023). (2) Concerning the spatiotemporal evolution of ALUCE, different methods and regional differences are crucial factors to consider. Carbon emission trends show significant regional variation, which is closely related to factors such as natural ecology, agricultural resource distribution, and economic development levels. For example, the eastern and southern regions, characterized by intensive and efficient agricultural production, exhibit more concentrated carbon emissions, while the western and northern regions have lower emissions due to resource and climatic constraints (Li et al., 2024; Liu and Lin, 2024). Furthermore, analyzing the spatiotemporal evolution of ALUCE not only requires attention to total carbon emissions but also necessitates an in-depth examination of specific regional production structures and policy backgrounds, providing essential regional references and policy guidance for the low-carbon transition of agriculture. (3) The driving factors of ALUCE are influenced by various elements, including agricultural production efficiency, production structure, agricultural output level, and agricultural labor scale. Specifically, agricultural production efficiency is a key driving factor as it directly reflects the resources and energy required per unit of output. Improving production efficiency typically reduces resource waste and carbon emissions, thus negatively correlating with ALUCE (Wang et al., 2022). The production structure reflects the relative contributions of different agricultural sectors, such as crop farming, forestry, animal husbandry, and fisheries, each with varying sources and intensities of carbon emissions. Significant regional differences exist in agricultural production structures, with the eastern regions generally characterized by intensive agriculture, while the western regions rely more on traditional farming practices (Gnayem et al., 2024). The agricultural output level is closely related to carbon emissions, as regions with higher output may experience variations in carbon emissions due to technological innovations or increased resource inputs (Tian et al., 2024). Agricultural labor scale, which reflects the number of individuals engaged in agricultural activities, can indirectly influence carbon emissions by affecting production methods and efficiency (Huang et al., 2024). The study of these driving factors helps reveal the intrinsic relationship between agricultural carbon emissions across regions and provides feasible pathways for low-carbon agriculture. (4) The low-carbon transition pathways for ALUCE involve improving agricultural production efficiency, optimizing agricultural production structures, increasing output levels, and rationally adjusting labor scales. First, improving agricultural production efficiency helps reduce the resource consumption per unit of output, thus reducing carbon emissions (Wu et al., 2024). Second, optimizing agricultural production structures by reducing high-carbon agricultural inputs and increasing sustainable agricultural practices will significantly lower carbon emissions. The increase in agricultural output levels is often accompanied by technological innovations that enhance carbon emission efficiency (Deng et al., 2024). Lastly, changes in agricultural labor scale, particularly the transition from labor-intensive to mechanized agriculture, can reduce labor demand and indirectly lower carbon emissions. Through these multidimensional transition pathways, the low-carbon development of agricultural land use can be effectively promoted, supporting the achievement of China’s dual-carbon goals.
The research on the spatiotemporal evolution of ALUCE has made certain progress, but there are still several gaps. Firstly, although existing studies have revealed differences in ALUCE across regions, there is a lack of in-depth exploration of the interaction between socioeconomic factors and carbon emissions. Most studies focus on natural ecology, agricultural resource distribution, and climatic conditions, while less attention has been paid to how economic development, policy implementation, and other factors influence the spatiotemporal evolution of ALUCE. Secondly, although static analyses have identified spatial differences in ALUCE across regions, there is limited understanding of its dynamic temporal changes. Existing research has not fully considered the role of agricultural technological development, industrial structural adjustments, and other factors in the spatiotemporal evolution of ALUCE. Lastly, while the spatial distribution of ALUCE has been explored, the specific reasons for low ALUCE provinces remain insufficiently analyzed. In particular, the role of technological innovations and low-carbon agricultural practices in low-emission areas needs further clarification.
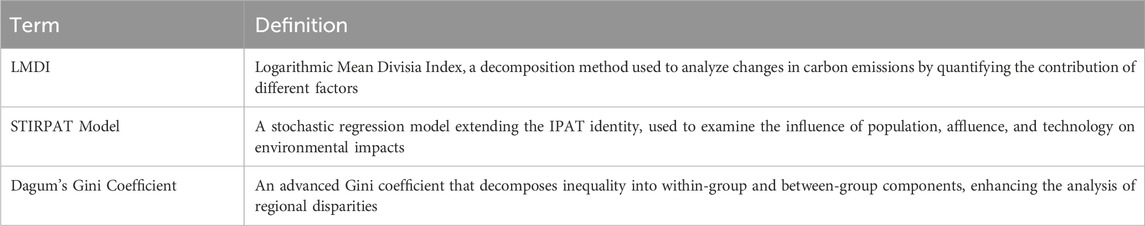
Based on the above analysis, the innovations of this paper are as follows: First, this study introduces a novel combination of the LMDI (Logarithmic Mean Divisia Index) and STIRPAT models (Stochastic Impacts by Regression on Population, Affluence, and Technology), leveraging their complementary strengths to provide a comprehensive, multi-dimensional analysis of the driving factors behind ALUCE and its spatio-temporal evolution. By combining the LMDI’s ability to decompose emission changes and the STIRPAT model’s focus on socioeconomic variables, this research offers a more nuanced and holistic understanding than previous studies, which often focused on a single perspective. The combination of these models allows for a deeper exploration of micro-level agricultural practices and how they contribute to regional differences in ALUCE, filling a critical gap in the existing literature. Second, the research uncovers significant regional disparities in ALUCE between eastern and western China. It provides a detailed analysis of how agricultural practices, such as crop selection, irrigation techniques, and technology adoption, impact emissions. Additionally, it examines how socio-economic conditions influence these practices. This analysis emphasizes the need for region-specific policies that are tailored to the unique agricultural and socio-economic conditions of each region. Third, empirical findings show that agricultural production efficiency strongly inhibits ALUCE. This provides solid evidence supporting policies that improve agricultural efficiency through technological innovations and better resource management, which can help reduce emissions. Finally, the study introduces an innovative Environmental Organizational Framework, grounded in the γ-multiple helix model, which integrates stakeholder collaboration and dynamic adaptation. This framework bridges the gap between theory and practice, offering actionable strategies for sustainable agricultural development, particularly in developing countries, and presents a multi-layered approach that aligns with both immediate emission reduction needs and long-term carbon neutrality goals. The integration of micro-level agricultural practices and regional disparities into this framework further enhances its relevance and practical applicability.
2 Research design
2.1 Overview of the research area
This research focuses on China’s ALUCE in the plantation sector, spanning diverse climates and topographies from the northeast to the tropical south. The study covers 30 provinces, including economically developed coastal areas, agricultural hubs in the central region, resource-rich western areas, and the vast northeastern plains. These regions, with varying agricultural practices and emissions, provide insights into ALUCE dynamics under different climatic and economic conditions, offering strategies for low-carbon development applicable to China and similar countries.
ALUCE distribution for 2013, 2018, and 2022 was mapped using ArcGIS (Figures 1–3), with darker colors indicating higher emissions. Provinces like Henan, Shandong, Jiangsu, and Anhui consistently showed high ALUCE due to large-scale production, mechanization, and heavy fertilizer use. Despite emission reduction efforts, ALUCE continued to rise. In contrast, western provinces like Qinghai and Gansu maintained lower ALUCE due to smaller agricultural scales and natural constraints. Moderate ALUCE provinces such as Hubei, Hunan, Zhejiang, and Sichuan showed fluctuations driven by agricultural technologies and policy measures.
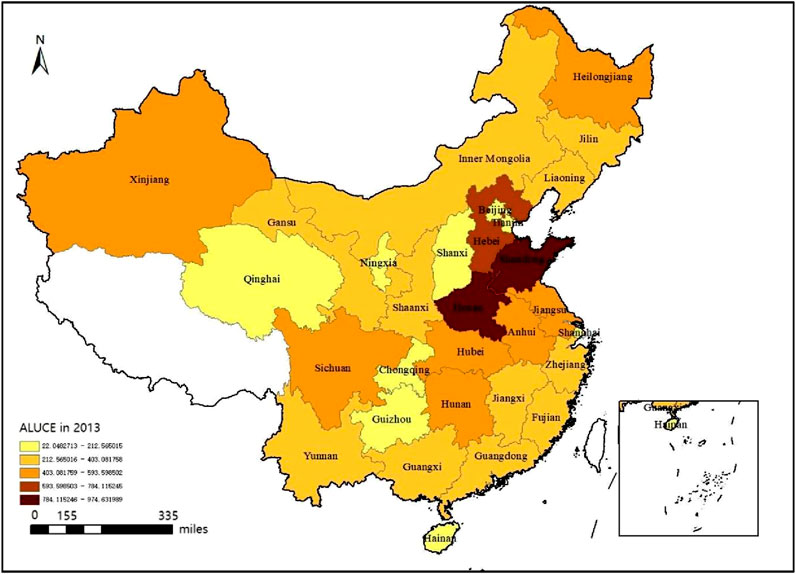
Figure 1. ALUCE in 2013.
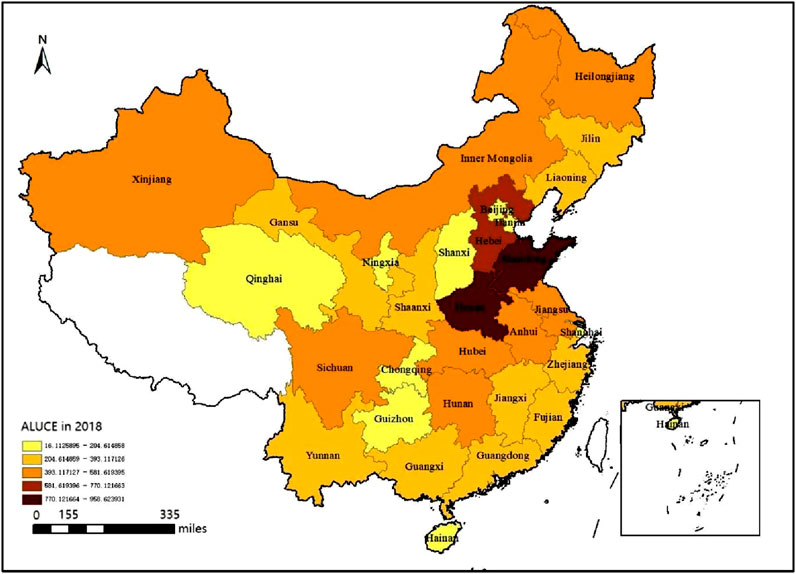
Figure 2. ALUCE in 2018.
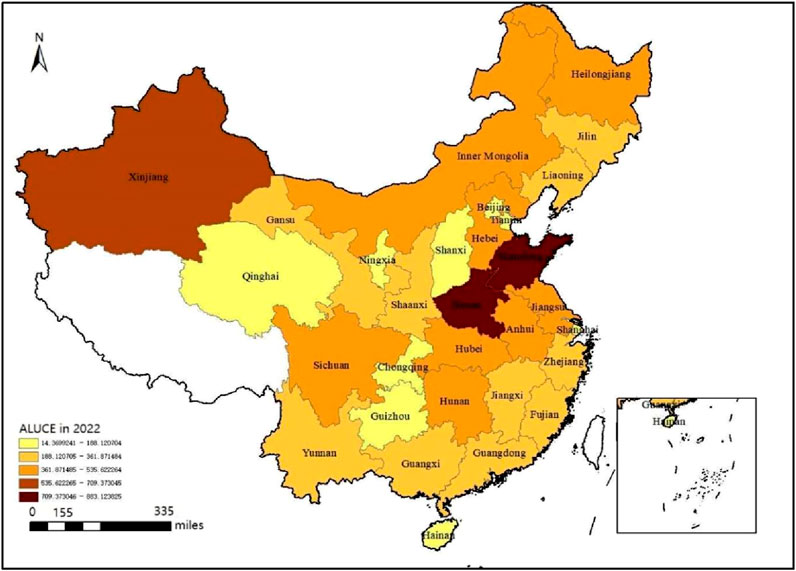
Figure 3. ALUCE in 2022.
The trends reveal a differentiated pattern: eastern provinces have higher and increasing emissions, while western and central regions remain more stable. This highlights the need for region-specific strategies, technological support, and policy guidance to reduce ALUCE and promote sustainable agricultural development.
2.2 Research methodology
2.2.1 Dagum Gini coefficient method
The Dagum Gini coefficient is an advanced measure of inequality that extends the traditional Gini coefficient by incorporating a decomposition approach, with specific definitions provided in the Appendix 1. This coefficient not only captures the overall inequality but also distinguishes between intra-group and inter-group inequality. In the context of ALUCE, Dagum Gini coefficient helps to identify whether disparities in carbon emissions are primarily driven by differences within individual provinces or between different regions, providing a clearer understanding of the sources of inequality. Referring to Hu and Deng (2023), the Dagum Gini coefficient and its decomposition are calculated using the following:
where G denotes the overall Gini coefficient of ALUCE, and yij denotes ALUCE in the jth province of the ith region, k is the number of regions, n is the number of provinces, and μ is the average value of ALUCE in each region, and Gii is the Gini coefficient of the ith region, and Gim is the Gini coefficient between the ith and mth regions, and Dim is the relative impact of ALUCE for cultivation between the ith and mth region. dim is the difference in ALUCE between regions, and pim is the difference in ALUCE between the i and m regions, ymr-yij is the mathematical expectation of the sum of the >0 sample values in the i and m regions.
2.2.2 Spatial kernel density estimation methods
Spatial autocorrelation testing is a critical preliminary step in the analysis of spatial kernel density distribution dynamics (Kariminejad et al., 2022). It not only ensures the accuracy and relevance of the analysis but also aids in the rational interpretation of the spatial characteristics of ALUCE. By calculating the Moran’s I statistic, it can assess the spatial correlation of ALUCE distribution across Chinese provinces, laying a solid foundation for further dynamic analysis of spatial distribution. The calculation formula for Moran’s I is represented as follows:
Where Yi and Yj represent the observed ALUCE values for provinces i and j respectively, and Wij is the spatial adjacency weight matrix, implemented as a 0–1 matrix.
The spatial kernel density estimation method is used to analyze the distribution dynamics of ALUCE in China. The traditional kernel density estimation method is represented by Equations 4, 5. In contrast, the spatial kernel density estimation method incorporates time and space factors into the traditional kernel density estimation method. This approach uses continuous density curves to describe the distribution conditions of the random variables under spatio-temporal evolution, as shown in Equations 6, 7.
Where
2.2.3 Driver decomposition model
The Logarithmic Mean Divisia Index (LMDI) method is a type of index decomposition analysis widely applied in environmental and energy economics, with specific definitions provided in Appendix 1. The LMDI method was chosen for this research due to its ability to decompose changes in carbon emissions into several explanatory factors, including production efficiency, industrial structure, and scale effects. Unlike traditional decomposition methods, LMDI is known for its robustness and lack of residuals, making it ideal for analyzing the drivers of carbon emissions in complex systems like agriculture.
To better understand the driving factors of ALUCE, this research employs the LMDI model. The LMDI model was selected because it effectively decomposes changes in carbon emissions, revealing the factors that have the most significant impact on the increase or decrease of ALUCE. Specifically, the LMDI model can break down changes in carbon emissions into key influencing factors such as agricultural production efficiency, industrial structure, and labor scale (Wu et al., 2016). This decomposition analysis provides important insights for policymakers, helping them identify priority areas to focus on for carbon reduction.
Another advantage of the LMDI model is its ability to handle data from different time periods and regions, allowing for precise analysis of regional carbon emission variations (Wang and Yan, 2022). For example, by using this model, this study can compare the impact of agricultural production efficiency on carbon emissions between eastern and western China, offering targeted policy recommendations for low-carbon transitions. Therefore, the application of the LMDI model is crucial for a comprehensive analysis of the driving factors of carbon emissions across different regions. An LMDI model is constructed to quantitatively decompose the driving factors of ALUCE, with its specific formulation as follows:
Where ALUCE represents the total carbon emissions from agricultural land use (t), with the variables defined in Table 1; G represents the total output value of the plantation industry (yuan), GBig represents the total output value of agriculture, forestry, animal husbandry, and fishery (yuan); P represents the scale of agricultural labor (persons); β1 represents agricultural production efficiency (kg/yuan), β2 represents agricultural production structure (%), and β3 represents agricultural output level (yuan/person).
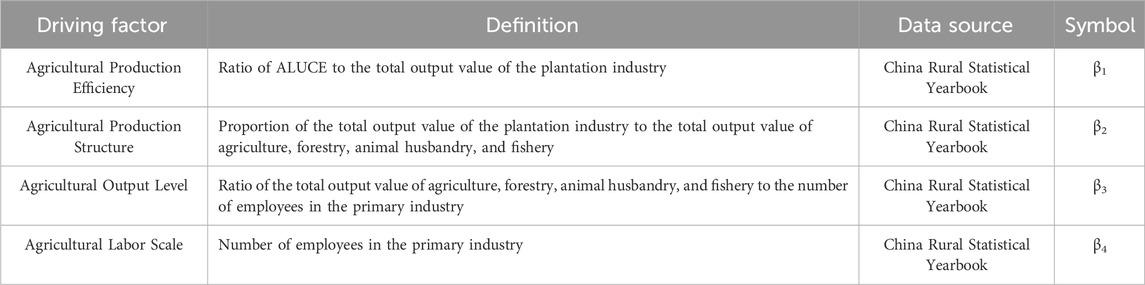
Table 1. Driving factors of ALUCE.
By applying logarithmic, additive, and decomposition methods to Equation 12, the contribution values of each decomposed factor of ALUCE are obtained. The formula is expressed as follows:
Where
2.2.4 STIRPAT model
The STIRPAT model (Stochastic Impacts by Regression on Population, Affluence, and Technology) extends the IPAT identity, allowing for the examination of how population dynamics, economic growth, and technological progress collectively impact environmental variables like carbon emissions. This model is particularly suited for analyzing the combined effects of multiple socio-economic factors on carbon emissions, including population size, economic development, and technological advancement. The STIRPAT model is flexible in capturing nonlinear relationships and accounting for regional and temporal variations, providing deeper insights into the socio-economic drivers of ALUCE, with specific definitions provided in the Appendix 1. It not only quantifies the direct effects of each factor but also reveals their interactions. This makes it a powerful tool for understanding long-term trends in ALUCE. Unlike traditional decomposition methods, its multidimensional analytical capability allows for a more comprehensive understanding of the complex environmental impacts. The specific formula is as follows:
Where a represents the model coefficient; b, c, d, and e represent the coefficients of the driving factors; and e represents the error term.
Taking the logarithm of Equation 18, can obtain the following formula:
To analyze the impact of driving factors on ALUCE, path analysis is used to decompose the correlation coefficients based on the STIRPAT model. This approach estimates the total, direct, and indirect effects of driving factors on ALUCE. By analyzing the influence of driving factors on ALUCE from both individual and common perspectives, this method serves as an important approach for exploring the driving patterns of ALUCE.
This research selects the LMDI and STIRPAT models based on their extensive application in carbon emission analysis and their complementary strengths. The LMDI model is renowned for its efficient decomposition capabilities. It allows for precise identification of the driving factors behind changes in carbon emissions, such as agricultural production efficiency, production structure, and output levels. This model enables a quantitative analysis of these factors’ contributions to changes in ALUCE, providing valuable insights for policymakers to identify priority areas for emission reduction. On the other hand, the STIRPAT model excels at analyzing the complex relationships between socio-economic variables and environmental pressures, particularly in capturing nonlinear and dynamic changes. The STIRPAT model can address a broader range of socio-economic factors, such as population size, economic development level, and technological progress, revealing their comprehensive impacts on carbon emissions. By combining the decomposition analysis capability of the LMDI model with the dynamic regression analysis of the STIRPAT model, this research constructs a more comprehensive analytical framework that not only quantifies the effects of driving factors but also uncovers the deeper relationships between socio-economic variables and carbon emissions. This approach provides new theoretical support for the study of ALUCE and offers greater explanatory power and practical value in regional disparity analysis and policy formulation.
2.3 Variable selection and data description
2.3.1 Measurement of ALUCE
The ALUCE specific formula is as follows:
In Equation 18, Ti represents the input amount of the ith carbon source, and εi represents the carbon emission coefficient of the ith carbon source. The main carbon sources and their emission coefficients for ALUCE are shown in Table 2.
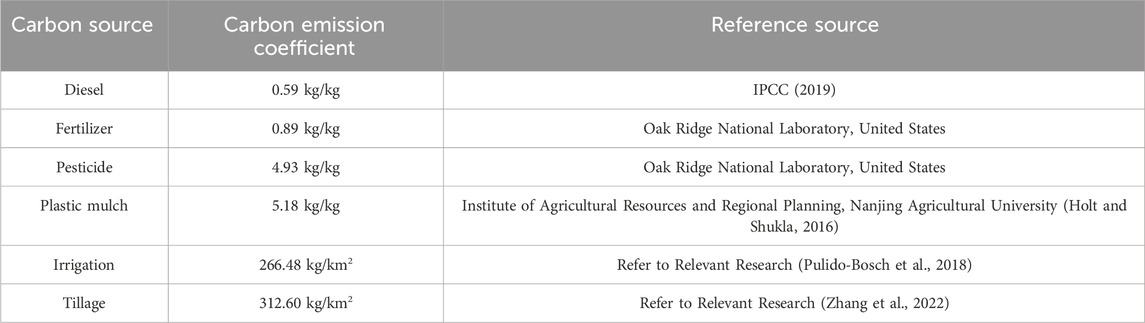
Table 2. Major carbon sources and emission coefficients of ALUCE.
Table 3 displays ALUCE for 2013 and 2022, in conjunction with the average ALUCE from 2013 to 2022. ALUCE 2013/2022: ALUCE for each province in 2013 and 2022. Mean ALUCE 2013–2022: Average ALUCE across the 2013–2022 period for each province.
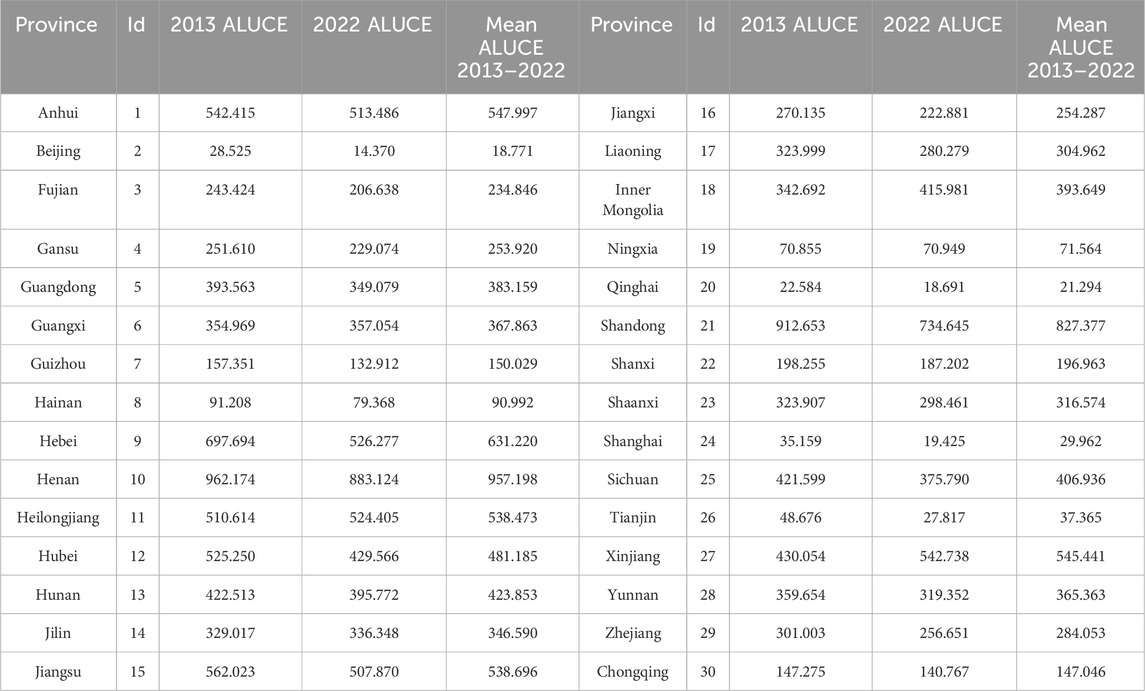
Table 3. Partial sample of ALUCE in 30 provinces of China (ten thousand tons).
2.3.2 Factors affecting ALUCE
This study focuses on four key driving factors: agricultural production efficiency, production structure, output level, and labor scale, all of which directly influence carbon emissions and are crucial for understanding ALUCE. Agricultural production efficiency (β1) reflects the resources and energy required per unit of output; improvements in efficiency typically reduce resource waste and carbon emissions, thus negatively correlating with ALUCE. Agricultural production structure (β2) represents the contribution of various agricultural sectors (such as crop farming, forestry, and animal husbandry) to carbon emissions. The differences in agricultural structures, with intensive farming in the eastern regions and traditional farming in the western regions, affect ALUCE. Agricultural output level (β3) indicates the overall economic output of agriculture, directly linked to carbon emissions. High-output regions may experience variations in carbon emissions due to technological innovations or increased resource inputs. Agricultural labor scale (β4) reflects the number of people involved in agricultural activities, which can influence production methods and efficiency, indirectly impacting carbon emissions, especially between labor-intensive and mechanized agricultural regions.
Descriptions of each variable can be found in Table 3. By considering these standards, the selected factors not only possess scientific validity and practicality but also provide an effective theoretical framework for understanding and addressing agricultural carbon emissions.
2.3.3 Data description
The data used in this research, including fertilizer, agricultural film, pesticides, diesel for agricultural machinery, crop sown area, irrigated area, total output value of the plantation industry, agricultural output value, and agricultural labor force size, were sourced from the China Rural Statistical Yearbook (2013–2022) and the provincial statistical yearbooks of the 30 mainland provinces (excluding Hong Kong, Macao, Taiwan, and Tibet). These data were manually collected. Provincial-level data was selected for its representativeness and consistency, providing valuable insights for national policy formulation and the overall analysis of ALUCE patterns across China.
Descriptive statistics for the variables were conducted using Stata16, and the results are shown in Table 4. The ALUCE variable shows substantial variability, with values ranging from 11.651 to 995.753. The β1 and β2 variables exhibit concentrated distributions with small standard deviations, indicating that most data points cluster around the mean. The β3 variable has a wider range and higher standard deviation, indicating greater variability. The β4 variable shows significant disparities across provinces.
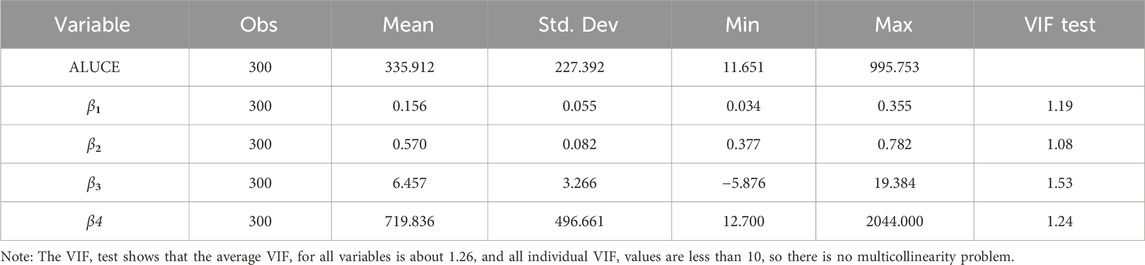
Table 4. Descriptive statistics for each variable.
Pearson correlation tests conducted in Stata16 are shown in Table 5. The correlation between ALUCE and β1 is 0.260, suggesting that higher production efficiency is associated with increased carbon emissions. The ALUCE-P correlation is 0.439, indicating that a larger agricultural labor force correlates with higher emissions. The β1-β3 correlation is −0.358, suggesting that increased production efficiency may reduce output. The β2-β3 correlation is −0.243, implying that structural changes in agriculture could lower output. Lastly, the β3-β4 correlation is −0.418, highlighting inefficiencies in labor-intensive agricultural models. VIF values are all below 10, confirming no multicollinearity among the variables.
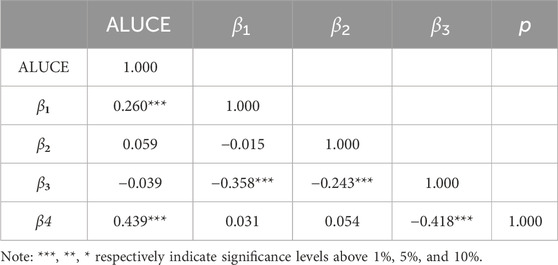
Table 5. Correlation test.
3 Empirical analysis
3.1 Analysis of the results of measuring ALUCE in China
Figure 4, calculated using Stata16 based on Equations 18 and 20, reveals substantial inter-provincial disparities in ALUCE and carbon emission intensity across 30 Chinese provinces. Provinces such as Henan, Shandong, and Hebei report the highest total ALUCE, primarily due to their large-scale, intensive agricultural activities. Henan, as a major grain-producing area, relies heavily on chemical inputs like fertilizers and pesticides to enhance crop yields, contributing significantly to higher emissions. For example, in 2022, Henan used over 1.8 million tons of chemical fertilizers, contributing significantly to carbon emissions. Based on the carbon emission coefficients from Table 3, the use of chemical fertilizers in Henan results in substantial emissions, with a coefficient of 0.89 kg of CO2 per kg of fertilizer. The heavy use of pesticides (4.93 kg CO2 per kg) and plastic films (5.18 kg CO2 per kg) in agriculture further exacerbates emissions in the region. These data highlight the significant role of agricultural inputs in driving ALUCE and the region’s overall carbon emissions. In contrast, provinces like Qinghai, Beijing, and Shanghai exhibit the lowest total ALUCE, driven by limited agricultural activities and a focus on industrial and service sectors. Qinghai’s reliance on traditional, low-input farming methods and a smaller agricultural land area further explain its lower carbon emissions, highlighting the impact of different economic structures and land use priorities.
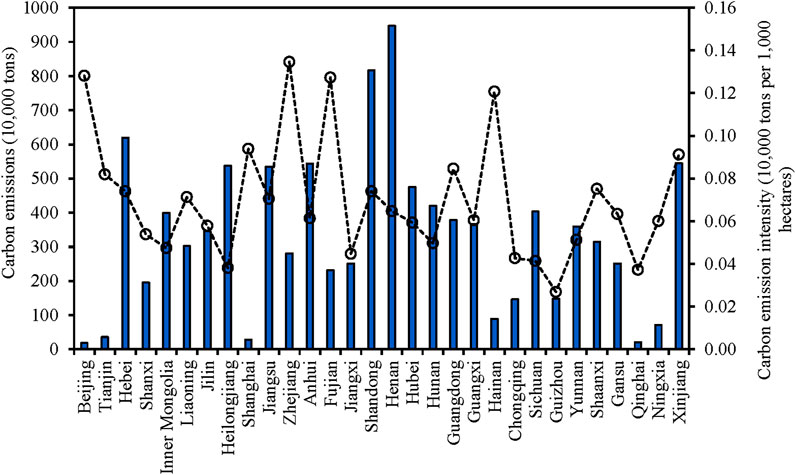
Figure 4. Average ALUCE and ALUCE intensity in 30 Chinese provinces during the sample period.
In terms of carbon emission intensity, Zhejiang, Fujian, and Beijing rank the highest. These southeastern provinces employ high-input, high-output farming models aimed at maximizing productivity, relying heavily on synthetic inputs such as plastic films, chemical fertilizers, and advanced irrigation systems. This intensive approach significantly increases carbon emissions per unit area of farmland. Conversely, Guizhou, Sichuan, and Chongqing show the lowest carbon emission intensities, primarily due to their adoption of traditional, low-input agricultural practices and more diverse cropping systems. The agroecological approaches in these southwestern provinces, focusing on soil health and resource conservation, naturally limit carbon emissions and promote sustainability.
The observed regional disparities in ALUCE can be attributed to differences in agricultural practices, technological access, economic development, and policy focus. High-emission provinces like Shandong and Jiangsu have greater access to advanced agricultural technologies, yet their focus on maximizing output often leads to excessive use of high-carbon inputs. In contrast, western provinces such as Qinghai and Ningxia typically use less mechanized, lower-input farming methods, resulting in lower emissions. Moreover, eastern provinces tend to prioritize economic growth and intensive farming, whereas western regions often emphasize environmental conservation and sustainable land use. This variation suggests the need for region-specific policies that account for local agricultural practices and socio-economic conditions.
Figure 5, calculated using Stata16 and plotted with Excel, shows that China’s total ALUCE decreased from 3,426,950 tons in 2013 to 3,132,320 tons in 2022, reflecting an 8.6% decline over 10 years. This reduction likely results from energy-saving technologies, improved agricultural practices, and green development initiatives. Fertilizer emissions peaked at 1,784,900 tons in 2016 but decreased to 1,538,900 tons by 2022, remaining the largest contributor to ALUCE. Plastic mulch emissions also peaked in 2016 at 449,230 tons and decreased to 406,840 tons by 2022. Pesticide and diesel emissions rose until 2016, then declined, with pesticide emissions dropping sharply from 296,770 tons in 2015 to 203,560 tons in 2022. Irrigation emissions increased from 557,704 tons in 2013 to 612,120 tons in 2022, reflecting expanded irrigation infrastructure. Tillage emissions remained stable, with a small annual increase from 17,002 tons in 2013 to 17,560 tons in 2022.
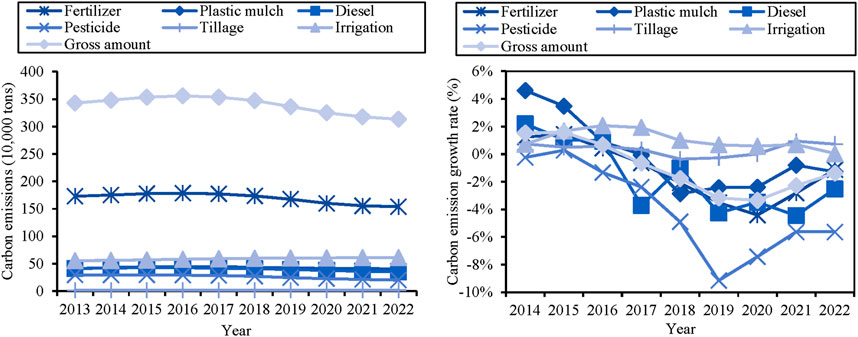
Figure 5. Time series trends of ALUCE and its growth rate in China during the sample period.
Overall, the analysis shows that while there have been reductions in emissions from fertilizers, plastic mulch, pesticides, and diesel, the increase in irrigation emissions highlights areas for further efficiency improvements. The stable tillage emissions indicate a consistent approach to land management. These findings highlight the need for actionable measures, such as promoting the adoption of precision irrigation technologies and incentivizing the use of low-carbon fertilizers. Additionally, improving water-use efficiency through advanced irrigation systems and reducing pesticide use by supporting integrated pest management could further help in reducing ALUCE. With the advancement of energy-saving and emission-reduction technologies and green agricultural policies, the carbon emissions from the main sources of ALUCE showed a significant decline during the sample period. This reflects the effectiveness of measures aimed at reducing chemical inputs and improving resource use efficiency.
China’s vast geographical expanse leads to significant regional differences in climate, arable land resources, agricultural structures, and economic development, which in turn cause disparities in ALUCE carbon emissions across provinces (Figure 6). Fertilizer is the primary ALUCE source, with provinces like Shaanxi, Henan, Hubei, and Jilin showing high fertilizer reliance to boost crop yields. Plastic mulch usage is high in Shanghai, Beijing, Gansu, and Xinjiang, improving efficiency but contributing to emissions. Diesel usage is notably high in Guizhou, Heilongjiang, Inner Mongolia, and Qinghai, driven by mechanization. Pesticide input is significant in Jiangxi, Hunan, Hainan, and Zhejiang. While irrigation and tillage-related emissions are less variable, regions like Heilongjiang and Qinghai report higher irrigation emissions. These regional differences reflect varying agricultural practices and resource usage, highlighting the need for region-specific emission reduction strategies, particularly for high-ALUCE sources like fertilizers, plastic mulch, and diesel, to promote sustainable agriculture.
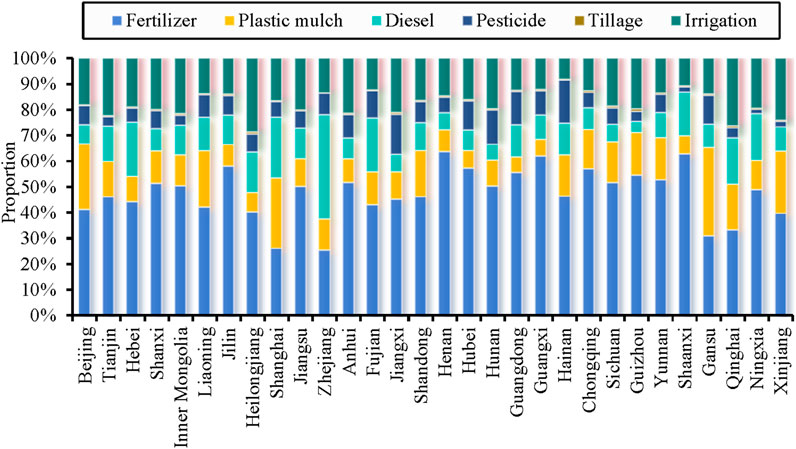
Figure 6. Proportion of ALUCE sources.
3.2 Analysis of regional differences in ALUCE
The measurement results of the Gini coefficient and contribution rate of ALUCE in the regional divisions of China, calculated using Equation 1, are shown in Figure 7. It was calculated using MATLAB 2022b and plotted using Excel.
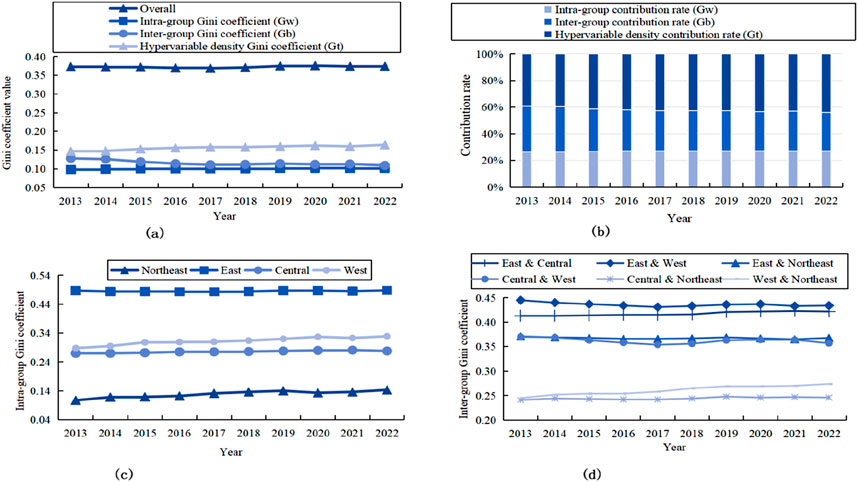
Figure 7. Changes in the Gini coefficient of ALUCE. (a) Gini coefficient. (b) contribution rate. (c) Gini coefficient within group. (d) Inter-group Gini coefficient.
The measurement results of the Gini coefficient and contribution rate of ALUCE across China’s regional divisions are presented in Figure 7, calculated using MATLAB 2022b and plotted using Excel. From Figure 7A, the overall Gini coefficient reflects the level of inequality in ALUCE across different regions of China, fluctuating between 0.369 and 0.376 from 2012 to 2019. This indicates a relatively stable, yet slightly variable, degree of inequality in ALUCE. The within-group Gini coefficient (Gw), measuring inequality within individual provinces, remains around 0.1, suggesting that internal provincial inequality has shown minimal variation over time. In contrast, the between-group Gini coefficient (Gb), which captures the inequality between different provinces, has declined from 0.128 in 2012 to 0.109 in 2021. This trend may be associated with a narrowing of disparities between provinces, though the underlying causes likely include multiple factors such as regional policies, economic changes, and shifts in agricultural practices. The transition density Gini coefficient (Gt), which represents both within- and between-group differences, increased from 0.147 to 0.164 during the same period. This indicates a growing complexity in the distribution of ALUCE disparities. The higher between-group Gini coefficient compared to the within-group coefficient suggests that inter-provincial differences are more pronounced than intra-provincial differences. To address these disparities, targeted emission reduction policies should be designed for high-emission provinces, such as promoting precision agriculture and incentivizing the use of low-carbon technologies. In provinces with lower emissions, policies could focus on maintaining sustainable practices while enhancing agricultural efficiency. These tailored policies would ensure that emission reduction efforts are more effectively aligned with regional characteristics.
In Figure 7B, the stable contribution of within-group inequality to ALUCE disparities contrasts with the gradual decline in the between-group contribution rate. This pattern suggests a relative reduction in inter-provincial disparities over time, which may be influenced by broader socio-economic trends or regional agricultural adjustments. However, the increasing trend in transition density contribution points to a rise in the complexity of ALUCE inequality, potentially driven by factors like divergent regional policies and varied levels of technology adoption. These findings indicate that while narrowing inter-provincial disparities is important, addressing the combined effects of both within- and between-group differences is equally crucial for achieving balanced and sustainable agricultural development.
From Figure 7C, the data reveal significant regional disparities in ALUCE within China. The inequality within the Northeast and Western regions has increased, suggesting an expansion of internal disparities. This trend may be related to differences in local agricultural practices, economic conditions, or access to technology, but further investigation is needed to pinpoint specific drivers. In the Eastern region, the consistently high level of inequality likely reflects the diverse range of agricultural practices and varying levels of economic development. Conversely, the Central region shows lower and more stable inequality, which might be associated with relatively uniform agricultural practices and balanced economic growth. These findings suggest that regional policies should be tailored to address the unique characteristics and challenges of each area. This is especially important in the Northeast and Western regions, where internal disparities are widening.
Figure 7D illustrates significant disparities between regions, with a general trend of decreasing inequality in ALUCE between the Eastern and Western, as well as Central and Western regions. This suggests a narrowing gap in ALUCE levels among these regions, which could be linked to shared advancements in agricultural technologies or policy harmonization efforts. The increasing disparity between the Western and Northeastern regions points to diverging trends. These differences may be influenced by varying regional policies, technology access, or economic conditions. This highlights the need for targeted interventions in these areas, such as increased investment in technology and better resource allocation, to reduce disparities and promote more balanced development in agriculture.
3.3 Distribution dynamics of ALUCE
The results from Table 6's global spatial auto-correlation test and Figure 8’s local indices show that from 2013 to 2022, Moran’s I indices were greater than zero and passed the 5% significance test, indicating a significant positive spatial correlation of ALUCE among provinces in China. This necessitates further analysis of ALUCE distribution dynamics using the spatial kernel density method. Both global and local Moran’s I were calculated using Stata16, based on Equations 2, 3.
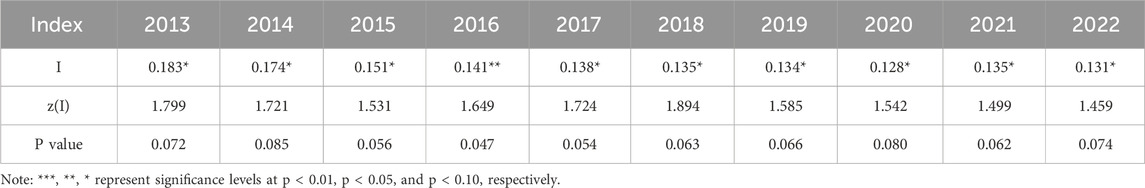
Table 6. Global spatial auto-correlation measurement results for ALUCE.
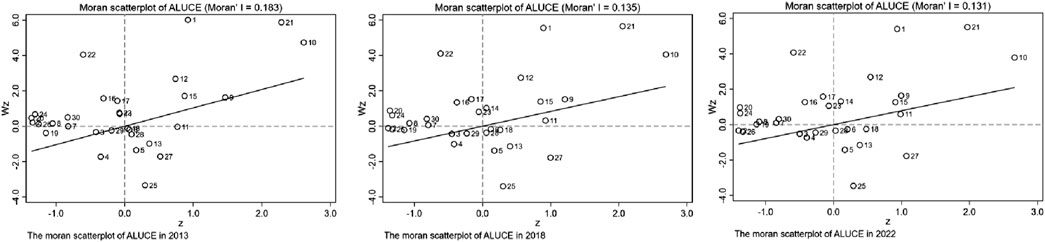
Figure 8. Local Moran’s indices for Year 2013, 2018, and 2022.
The spatial conditional static kernel density and contour distribution of ALUCE are shown in Figure 9. It was calculated and plotted using MATLAB, based on Equations 4–7.
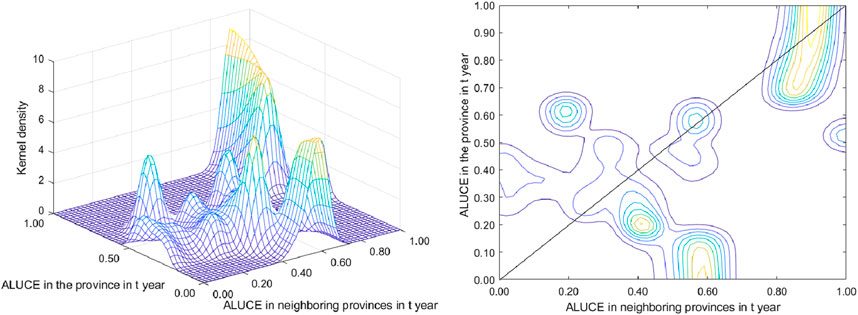
Figure 9. Spatial static kernel density and contours of ALUCE.
From the kernel density plot, the main peak appears on the center line, indicating that these provinces have ALUCE values similar to those of their neighboring provinces. This suggests a high level of uniformity in agricultural production methods, resource use efficiency, and emission reduction measures among neighboring provinces. Besides the main peak, the density plot shows a tailing phenomenon in some areas, particularly where ALUCE values are lower. This indicates that the ALUCE values in these provinces are more widely distributed and include some extremely low values.
The contour plot peaks, with one located along the diagonal line and another below it, indicate a phenomenon of polarization in China’s ALUCE. When the contour peak is positioned on the diagonal line, it suggests that the ALUCE values of the province are approximately equal to those of its neighboring provinces. This implies that some provinces exhibit similarities in agricultural practices, resource use efficiency, and emission reduction measures. Conversely, when the contour peak is below the diagonal line, it indicates that some provinces have lower ALUCE values than their neighboring provinces. These provinces perform better in terms of ALUCE, exhibiting lower carbon emissions. They play a demonstrative role in low-carbon agricultural development, and their successful experiences and technologies can be extended to neighboring provinces to help achieve ALUCE reduction goals. This information is crucial for formulating regional and targeted emission reduction policies, contributing to more balanced and sustainable agricultural development.
Figure 10, calculated using MATLAB based on Equations 4–7, presents the spatial dynamic kernel density and contour maps of ALUCE. The results show that ALUCE values in certain provinces are influenced by neighboring regions. In the Eastern region, high-density areas with high ALUCE reflect intensive agricultural activities and resource utilization, though some balance exists. The Western region has more low-density areas, indicating uneven distribution, with certain provinces having high ALUCE values likely due to low resource efficiency. In the Central region, the main peaks are aligned along the y-axis, with high-density areas above the diagonal line, suggesting that ALUCE in these provinces will continue to increase in the next 3 years (t+3). The Northeastern region’s high-density areas are concentrated on and below the diagonal line, indicating a more balanced ALUCE distribution, with some provinces exhibiting low emissions. Overall, the Eastern region has higher ALUCE, while the Central and Northeastern regions show more balance and lower ALUCE, serving as models for low-carbon agricultural development. The Western region needs improvements in resource use efficiency and agricultural technology to reduce ALUCE.
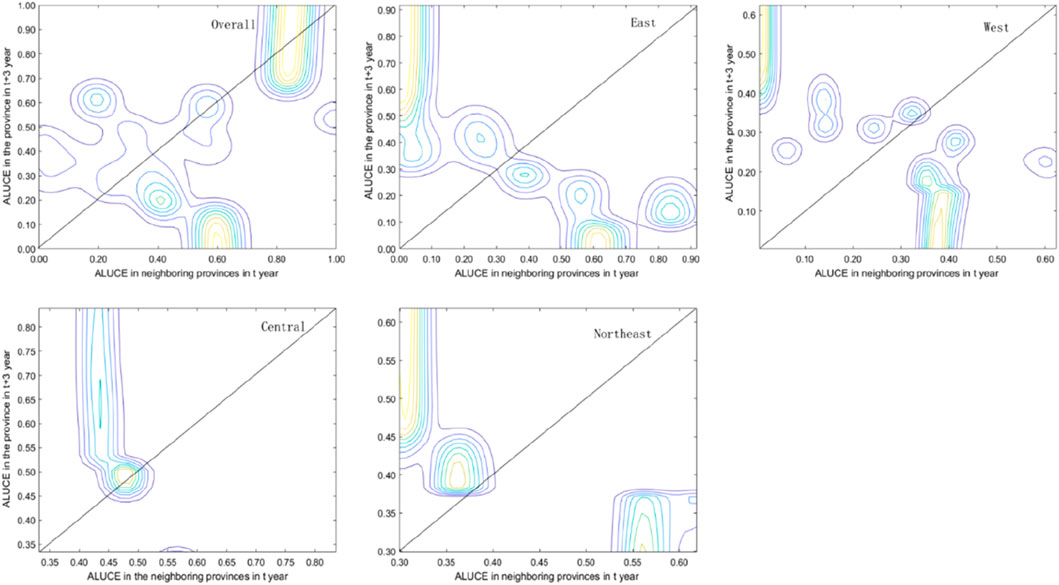
Figure 10. Spatial dynamic contours of ALUCE in each region.
4 Driver analysis
4.1 Key driving factors analysis for ALUCE
Decomposition of driving factors for ALUCE using the LMDI model, as illustrated in Figure 11. Figure 11 was calculated using Stata16, based on Equations 8–17.
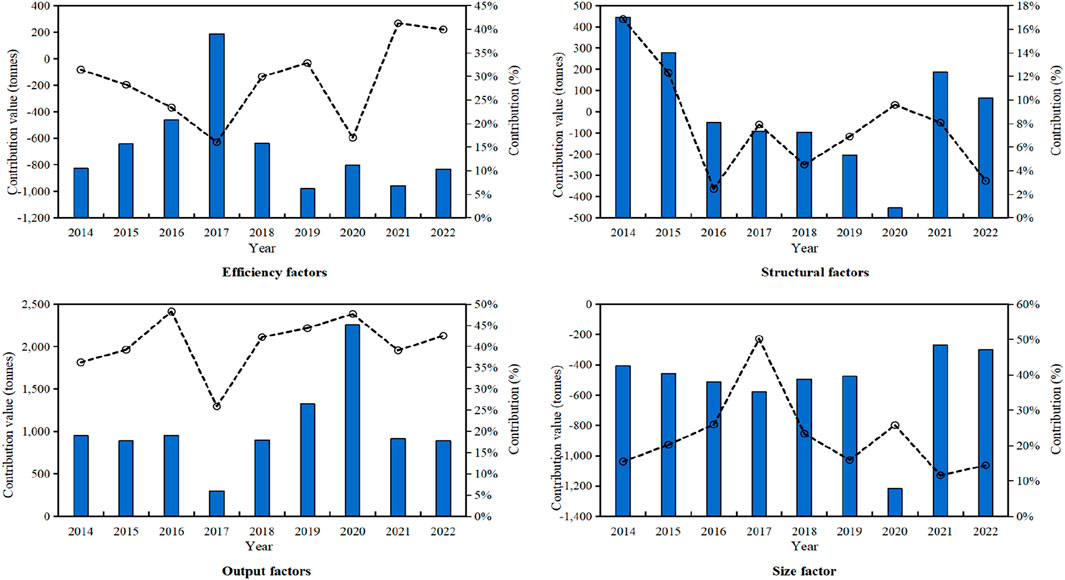
Figure 11. Contribution values and contribution rates of each driving factor in ALUCE.
4.1.1 Efficiency Factor
The efficiency factor exhibited noticeable fluctuations across the analyzed years. The most prominent positive contribution occurred in 2017, suggesting that improvements in agricultural efficiency were likely associated with reduced ALUCE during that year. This may reflect advancements in technology and the adoption of more efficient production methods, which are generally expected to help mitigate carbon emissions. In contrast, negative contributions observed in 2016 and 2022 indicate that efficiency gains were less pronounced, potentially pointing to external factors or varying levels of technology adoption. The peak contribution rate of the efficiency factor, which exceeded 40% in 2017, underscores its potential role in reducing emissions during certain years. Moving forward, policies that promote precision agriculture and increased mechanization could help enhance efficiency, though the extent of their impact on long-term carbon reduction requires further investigation.
4.1.2 Structural Factor
The impact of the agricultural production structure factor varied across the years, with alternating positive and negative contributions. This variation suggests that shifts in agricultural structure may have different effects on ALUCE depending on the context and specific changes made. For example, the structural factor had its highest positive contribution in 2014, while 2018 and 2020 showed notable negative contributions, possibly reflecting changes in the composition of high-emission agricultural sectors. Although the overall contribution rate of the structural factor was generally below 15%, its fluctuations indicate that structural adjustments in agriculture could be linked to changes in carbon emissions. Policymakers may benefit from exploring strategies that support low-carbon agricultural practices, such as organic farming and sustainable cropping systems, while further analyzing the specific effects of different sectors on ALUCE.
4.1.3 Output Factor
The output factor consistently showed a positive contribution, indicating a strong association between increased agricultural output and rising ALUCE. The significant contributions in 2016 and 2020 align with periods of notable agricultural expansion. However, this expansion is often accompanied by increased use of high-carbon inputs, such as fertilizers and machinery, which are associated with elevated carbon emissions. This finding highlights the potential need for stricter measures to encourage energy-saving and emission-reduction practices, including the adoption of energy-efficient machinery and eco-friendly fertilizers. Future policy efforts should aim to balance agricultural output growth with strategies that reduce carbon intensity, though additional research is necessary to clarify the relationship between output increases and carbon emissions.
4.1.4 Scale Factor
The agricultural labor scale consistently contributed positively to ALUCE, suggesting a significant association between labor scale and carbon emissions in certain years. The peak contributions observed in 2017 and 2020 may reflect an expansion of the agricultural labor force during these periods. However, as mechanization and modern agricultural technologies have advanced, the contribution of the labor scale has gradually diminished, indicating a potential shift away from labor-intensive farming. This trend suggests that future policy initiatives could prioritize the promotion of mechanized agriculture, especially in regions that still rely heavily on manual labor. Reducing dependence on human labor while increasing the use of technology may help lower carbon emissions, although the specific impact of these changes warrants further examination.
4.2 Analysis of flux diameters
This research uses ridge regression analysis to enhance parameter estimation stability and address correlations between factors like production efficiency, industrial structure, output level, and labor scale. By applying ridge regression, a model was established to analyze the influence of these factors on ALUCE. Ridge trace plots and coefficient of determination (RSQ) charts for each factor, shown in Figure 12, were calculated based on Equation 19 using SPSS26.
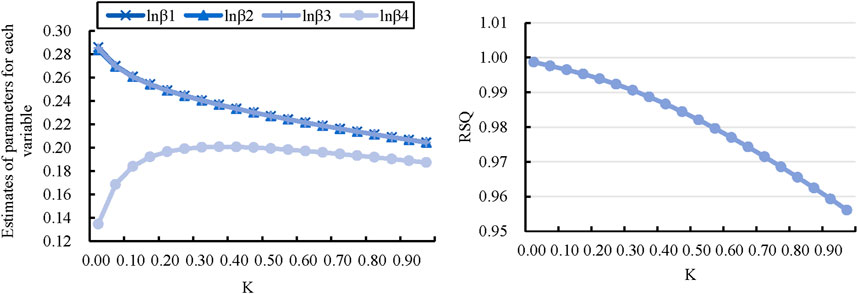
Figure 12. Ridge plot of drivers of ALUCE and changes in the coefficient of determination.
The regression equation was fitted using SPSS26, with the ridge coefficient K selected at 0.05 after analysis of the ridge trace curve (Table 7). The goodness-of-fit for the equation was above 89%, and each driving factor passed the significance test at the 10% level, confirming the strong relationship between the factors and ALUCE. Validation through an independent sample T-test showed a P-value of 0.951, indicating a good fit between the predicted and actual values of ALUCE, suggesting that the model is suitable for further analysis of ALUCE’s driving factors.
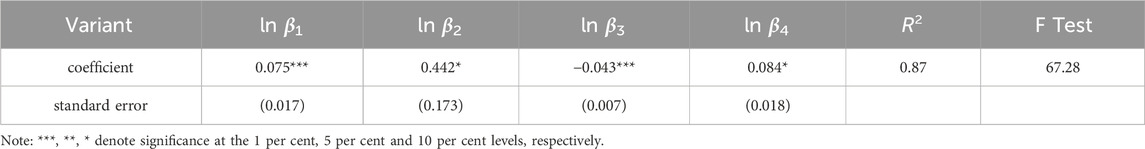
Table 7. Ridge regression fitting results for factors influencing ALUCE.
Although the STIRPAT model successfully reveals the impact of variables such as population, affluence, and technology on ALUCE, it has certain limitations in predicting how changes in future socio-economic indicators (such as a decrease in the number of farmers, the expansion of agricultural management scale, and the improvement of agricultural economic development) will affect carbon emissions. The STIRPAT model primarily captures current or historical relationships but does not account for long-term structural changes or feedback effects brought about by agricultural practices, technological innovations, or economic transformations. To overcome these limitations, future research could combine the STIRPAT model with dynamic models or scenario simulation methods to predict the long-term impact of these changes on carbon emissions. For example, integrating system dynamics models or agent-based models could better simulate the process of future socio-economic and agricultural transformations, thereby improving the accuracy of carbon emissions forecasts and providing stronger support for the formulation of carbon neutrality policies.
To analyze the impact of various driving factors on ALUCE, path analysis based on the STIRPAT model is used to decompose the correlation coefficients, measuring the total, direct, and indirect effects of production efficiency, industrial structure, output level, and labor scale on ALUCE. The total effect represents the correlation between each driving factor and ALUCE, the direct effect is shown by the standardized regression coefficients, and the total indirect effect is calculated by summing the products of the direct and indirect effects. Specific results are presented in Table 8, calculated using SPSS26. Since the STIRPAT model accommodates partial errors, a small residual impact is considered reasonable.
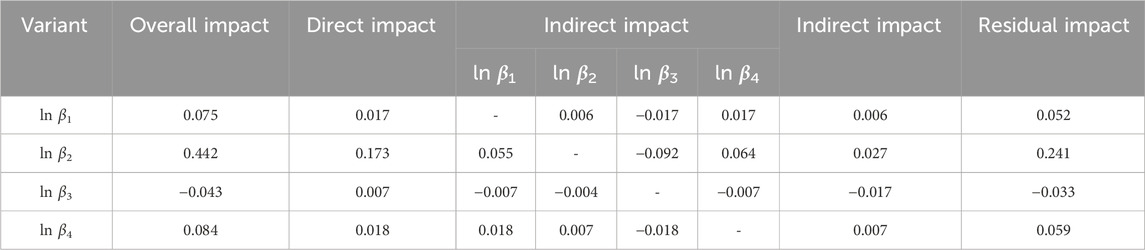
Table 8. Results of path analysis for factors influencing ALUCE.
The path analysis in this research indicates that lnβ2 plays a significant role in influencing ALUCE, with a total effect of 0.442, the highest among all factors. The agricultural production structure not only exerts a direct effect (0.173) on carbon emissions but also amplifies the emission reduction effects of lnβ1 and lnβ4 through positive indirect effects (0.055 and 0.064, respectively). However, lnβ2 shows a negative indirect effect (−0.092) through lnβ3, suggesting that in the absence of structural adjustments, an increase in output level could lead to higher carbon emissions. Thus, the agricultural production structure functions as a bidirectional transmission mechanism at the systemic level, enhancing production efficiency while controlling the negative impact of output levels on carbon emissions. This finding underscores the systemic importance of optimizing the agricultural production structure to achieve more effective carbon reduction, an area that policymakers should prioritize.
lnβ1 has a total effect of 0.075 on ALUCE, with a direct effect of only 0.017, indicating its limited direct influence on carbon emissions. Notably, the impact of production efficiency is largely realized through the agricultural production structure, as evidenced by its indirect effect (0.006) and transmission through labor scale (0.017). Therefore, policies aimed at improving production efficiency must also focus on optimizing the agricultural production structure to maximize the indirect emission reduction effects. Specific policy measures should include promoting precision agriculture and energy-efficient machinery. These can improve production efficiency and reduce reliance on high-carbon inputs, leading to greater carbon reduction.
Conversely, lnβ3 shows a negative total effect on ALUCE (−0.043), with both its direct and indirect effects being negative (0.007 and −0.017, respectively). This indicates that, in the absence of structural adjustments, increasing output levels will likely lead to higher carbon emissions. While improving output is critical for meeting agricultural demand, policymakers must ensure that output growth is accompanied by structural adjustments to mitigate its negative impact on carbon emissions.
Based on the results of the path analysis in this study, the interactions between driving factors play a crucial role in influencing ALUCE, particularly the complex relationships between efficiency improvements, structural adjustments, labor scale, and output levels. While agricultural production efficiency (lnβ1) and agricultural production structure (lnβ2) are key drivers of emission reductions, their interactions with other factors, such as labor scale and output levels, have not been fully explored. Improving production efficiency can indirectly reduce carbon emissions by optimizing the agricultural production structure, but this process is not unidirectional. Without corresponding structural adjustments, efficiency improvements may lead to overutilization of resources or high-carbon inputs, potentially offsetting the reduction effect. Therefore, efficiency enhancement and structural adjustment must evolve in coordination, and interventions focusing on a single factor may be ineffective. Furthermore, there are potential feedback effects between labor scale (lnβ4) and output level (lnβ3). Increasing agricultural output often leads to greater labor input, thereby raising carbon emissions, particularly in labor-intensive agricultural sectors. To achieve carbon neutrality, policies should encourage appropriate adjustments in labor scale, reduce reliance on traditional labor, and promote agricultural mechanization and smart technologies to enhance production efficiency and lower carbon emissions. Therefore, policies should integrate both efficiency improvements and production structure optimization, reduce high-carbon inputs, and promote sustainable agriculture. At the same time, when increasing output levels, adjusting labor scale to reduce reliance on manual labor will help achieve carbon emission reductions. Lastly, policies should support the green transformation of the agricultural supply chain, encourage the application of low-carbon technologies, and promote a coordinated low-carbon transition across sectors. By comprehensively considering the interactions of these factors, policymakers can develop more precise and effective low-carbon transition pathways, thereby advancing the achievement of carbon neutrality in the agricultural sector.
4.3 Drivers organizational framework
Based on the empirical results, an innovative environmental organizational framework for reducing ALUCE in China is constructed according to the γ-multiple helix model (Xue and Gao, 2022), comprising the main layer, the behavioral layer, the functional layer, and the objective layer, as depicted in Figure 13.
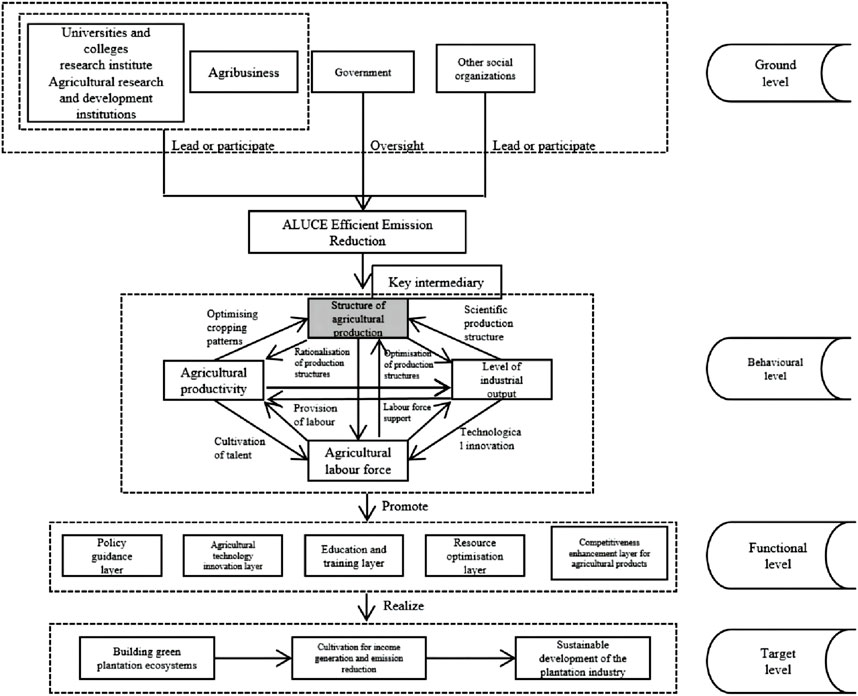
Figure 13. The innovative environmental organizational framework for ALUCE emission reduction.
The ground level plays a crucial role in reducing ALUCE, involving collaboration among various institutions and organizations. Universities and colleges contribute by conducting research, providing technical support, and training personnel, thus offering scientific foundations and human resources for ALUCE reduction. Research institutes focus on developing and promoting low-carbon agricultural technologies and methods. Agricultural research and development institutions tailor emission reduction strategies to local conditions, offering feasible solutions for farmers. Agribusinesses lead in implementing advanced technologies and management practices to enhance production efficiency and reduce carbon emissions, while also promoting greener agricultural products. Governments play a pivotal role in policy formulation, financial support, and overseeing the effectiveness of emission reduction measures. Social organizations, including NGOs and community groups, advocate, educate, and raise awareness, mobilizing public participation in emission reduction efforts. Together, these actors form a collaborative network that drives effective ALUCE reduction and promotes sustainable agricultural development.
The behavioral level integrates strategies to enhance agricultural efficiency and reduce carbon emissions, supporting sustainable agriculture. Key actions include optimizing cropping patterns, improving soil quality, and reducing the use of fertilizers and pesticides; enhancing productivity through high-efficiency crop varieties and modern technologies; adjusting the agricultural production structure to optimize resource use; developing the agricultural labor force with education and training; and promoting technological innovation, such as precision agriculture and water-saving irrigation systems. These measures collectively foster sustainable agricultural development.
The functional level includes key components: policy guidance, agricultural technology innovation, education and training, resource optimization, and agricultural product competitiveness enhancement. These layers aim to create a supportive policy environment, develop and promote environmentally efficient technologies, enhance farmers’ skills, optimize resources like water and soil, and improve market competitiveness through better product quality and marketing strategies. Together, they form a comprehensive framework for reducing ALUCE and promoting sustainability.
The target level focuses on three core objectives: (1) promoting green agricultural ecosystems through organic farming and eco-friendly methods to reduce carbon emissions; (2) increasing farmers’ income by improving efficiency and adopting low-carbon technologies, while reducing the carbon footprint; and (3) fostering sustainable agricultural development through R&D investment, policy support, and a conducive business environment. This framework emphasizes both immediate improvements and long-term sustainability through economic, ecological, and social dimensions.
5 Conclusions and implications
Based on the empirical analysis, this research draws the following conclusions: (1) Significant regional disparities in ALUCE are observed across Chinese provinces. Central provinces like Henan exhibit the highest emissions, primarily due to the scale of agricultural activities, rather than technological advancements. This suggests that policy interventions should focus not only on technological improvements but also on controlling the expansion of intensive farming practices. Western provinces, such as Qinghai, report lower emissions due to traditional farming methods. However, these methods are still susceptible to rising emissions as farming areas expand. Economically developed eastern regions, including Shandong and Jiangsu, show high ALUCE due to resource-intensive agricultural practices. The increase in emissions in these regions is not just driven by economic growth but also by the lack of sustainable practices in large-scale production. Lastly, southwestern provinces like Guizhou and Sichuan have lower emissions, which is largely due to slower agricultural modernization and lower industrialization levels, rather than purely traditional practices. (2) The inequality in ALUCE across regions remains relatively stable over time, with minor fluctuations observed. This aligns with Ke et al. (2022), who noted persistent regional disparities in agricultural emissions. While both intra-provincial and inter-provincial disparities contribute, inter-provincial differences are the main driver. Our research highlights that socio-economic factors, such as industrialization and rural-urban migration, also play a significant role in shaping these disparities. This emphasizes the need for region-specific policies that align agricultural practices with broader socio-economic development goals. (3) Improvements in agricultural production efficiency significantly reduce ALUCE. However, our research finds that efficiency improvements alone are not enough to reduce emissions at the regional level without structural changes in agricultural practices. Technological advances can reduce emissions, but their impact is often overshadowed by factors like the use of high-carbon inputs and large-scale monoculture. Some structural changes, such as shifting to more resource-intensive crops, can even increase emissions. (4) Path analysis demonstrates that the agricultural production structure serves as a key intermediary, enhancing the positive effects of increased efficiency while mitigating the negative impacts of higher output levels. We highlight the need to integrate environmental sustainability, particularly in high-emission sectors like livestock farming and industrialized crop production. This contrasts with Delandmeter et al. (2024), who focused on optimizing crop production techniques. Our findings suggest that sustainable practices in livestock and crop rotation are equally important, indicating a broader scope for policy interventions. Additionally, understanding farmers’ adoption of low-carbon practices, influenced by socio-economic factors such as income, technology access, and government policies, is essential for achieving carbon neutrality.
This research provides several key policy implications for reducing ALUCE in developing countries. (1) Region-specific strategies. Governments should implement targeted policies based on regional differences in ALUCE. In high-ALUCE regions, the focus should be on precision agriculture and identifying emission hotspots, while in lower-ALUCE areas, efforts should prioritize capacity-building, such as training local farmers and promoting sustainable agricultural practices. The EU’s emphasis on sustainable land management and conservation tillage offers valuable lessons for addressing high-carbon practices in regions with intensive agriculture. (2) Technology transfer. Governments should prioritize the transfer of sustainable agricultural technologies through the establishment of technology centers and research partnerships. This will enhance agricultural efficiency and emissions management tailored to local conditions. Learning from the EU’s Common Agricultural Policy (CAP), which supports technological innovation and sustainable practices across member states, China and other developing countries can facilitate knowledge-sharing and capacity-building in agriculture. (3) Sustainable agricultural practices. It is essential to optimize the use of high-carbon inputs like fertilizers and fossil fuels by promoting efficient fertilizer use, adopting biodegradable mulches, and investing in energy-efficient machinery. These practices, commonly promoted by the EU’s green agricultural policies, can reduce emissions while improving productivity. Implementing similar measures, such as eco-friendly fertilization strategies and integrated pest management, would enhance China’s low-carbon transition. (4) Addressing regional inequalities. Policies should aim to reduce intra- and inter-regional ALUCE disparities by improving access to resources, technology, and markets, particularly in marginalized areas. Financial incentives, along with improved access to land and water, will encourage the adoption of sustainable practices and help balance regional inequalities. Drawing from the EU’s experience, policies that provide financial support and technical assistance to underdeveloped regions can accelerate the adoption of sustainable agricultural technologies, thus reducing the carbon footprint of agriculture in these areas.
This study contributes to understanding Agricultural Land Use Carbon Emissions (ALUCE) by using the LMDI and STIRPAT models to analyze driving factors and spatio-temporal evolution. It offers theoretical support for policymakers by identifying key areas for carbon reduction and emphasizing the impact of regional disparities. The analysis of ALUCE changes across provinces provides data-driven insights for developing targeted emission reduction policies, highlighting the importance of optimizing agricultural production structures and improving efficiency. However, the study has limitations. Firstly, while the dataset covers 2013–2022, it may not capture long-term trends, and recent agricultural practices and policy changes might not be fully reflected. The use of provincial-level data provides a national overview but overlooks micro-level differences, suggesting that future research should use city or county-level data for more precision. Secondly, the LMDI and STIRPAT models, while effective in decomposing driving factors, oversimplify the complexity of agricultural systems. Future studies should consider dynamic systems models to explore long-term effects of agricultural transformation and technological innovations. Thirdly, indirect effects such as changes in market demand and international trade were not fully addressed in this study, and future research should explore these to provide more comprehensive policy recommendations. Finally, while focused on China, expanding this research to other developing countries or regions with similar agricultural practices could validate the findings and offer insights into socio-economic and environmental contexts. Future work could also explore scenario-based modeling to predict long-term ALUCE trends under different conditions, providing more systematic solutions for achieving carbon neutrality.
Data availability statement
The original contributions presented in the study are included in the article/supplementary material, further inquiries can be directed to the corresponding authors.
Author contributions
XS: Conceptualization, Data curation, Formal Analysis, Investigation, Methodology, Project administration, Software, Writing–original draft, Writing–review and editing. ZZ: Formal Analysis, Funding acquisition, Resources, Supervision, Validation, Visualization, Writing–review and editing. ZY: Conceptualization, Data curation, Formal Analysis, Funding acquisition, Investigation, Resources, Validation, Writing–original draft.
Funding
The author(s) declare that financial support was received for the research and/or publication of this article. The Yunnan University Research Foundation Program (Grant No. KC-23233830).
Conflict of interest
The authors declare that the research was conducted in the absence of any commercial or financial relationships that could be construed as a potential conflict of interest.
Publisher’s note
All claims expressed in this article are solely those of the authors and do not necessarily represent those of their affiliated organizations, or those of the publisher, the editors and the reviewers. Any product that may be evaluated in this article, or claim that may be made by its manufacturer, is not guaranteed or endorsed by the publisher.
References
Cederlöf, G. (2016). Low-carbon food supply: the ecological geography of Cuban urban agriculture and agroecological theory. Agric. Hum. Values 33 (4), 771–784. doi:10.1007/s10460-015-9659-y
Chen, L., Zhang, Z., Li, H., and Zhang, X. (2024). Farmland transformation to reduce costs: an empirical analysis of the cost efficiency of agricultural mechanization from the perspective of the level of farmland suitability for agricultural machinery operations based on spatial econometric models. J. Nat. Resour. 39 (9), 2188–2205. doi:10.31497/zrzyxb.20240911
Delandmeter, M., Colinet, G., Pierreux, J., Bindelle, J., and Dumont, B. (2024). Combining field measurements and process-based modelling to analyse soil tillage and crop residues management impacts on crop production and carbon balance in temperate areas. Soil Use Manag. 40 (3). doi:10.1111/sum.13098
Deng, C., Xu, T., Zhang, L., Yang, S., Yin, H., Guo, J., et al. (2024). Review of the water-land-food-carbon nexus focused on regional low-carbon and high-quality agricultural development. Water 16 (13), 1770. doi:10.3390/w16131770
Gnayem, N., Magadley, E., Haj-Yahya, A., Masalha, S., Kabha, R., Abasi, A., et al. (2024). Examining the effect of different photovoltaic modules on cucumber crops in a greenhouse agrivoltaic system: a case study. Biosyst. Eng. 241, 83–94. doi:10.1016/j.biosystemseng.2024.03.012
Holt, N., and Shukla, S. (2016). Transforming the plasticulture production system through novel bed geometry design. Trans. Asabe 59 (3), 993–1003. doi:10.13031/trans.59.11408
Hu, J. F., and Deng, Y. (2023). Resource misallocation and unbalanced growth in green total factor productivity in Chinese agriculture. J. Environ. Plan. Manag. 35, 49–83. doi:10.1080/09640568.2023.2238120
Huang, X., Braga, L. P. P., Ding, C. X., Yang, B. K., Ge, T. D., Di, H. J., et al. (2024). Impact of viruses on prokaryotic communities and greenhouse gas emissions in agricultural soils. Adv. Sci. 13, e2407223. doi:10.1002/advs.202407223
Kariminejad, N., Shariati, M., Hosseinalizadeh, M., Pourghasemi, H. R., and Maleki, S. (2022). Investigating geometrical characteristics of collapsed pipes and the changing role of driving factors. J. Environ. Manag. 312, 114910. doi:10.1016/j.jenvman.2022.114910
Ke, N., Zhang, X., Lu, X., Kuang, B., and Jiang, B. (2022). Regional disparities and influencing factors of eco-efficiency of arable land utilization in China. Land 11 (2), 257. doi:10.3390/land11020257
Li, H. B., Jin, X. B., Shan, W., Han, B., Zhou, Y. K., and Tittonell, P. (2024). Optimizing agricultural management in China for soil greenhouse gas emissions and yield balance: a regional heterogeneity perspective. J. Clean. Prod. 452, 142255. doi:10.1016/j.jclepro.2024.142255
Liao, Y., and Zhou, X. (2023). Can digital finance contribute to agricultural carbon reduction? Evidence from China. Sustainability 15 (22), 15824. doi:10.3390/su152215824
Liu, F. S., and Lin, J. (2024). The impact of high-standard farmland construction policies on the carbon emissions from agricultural land use (CEALU). Land 13 (5), 672. doi:10.3390/land13050672
Pulido-Bosch, A., Rigol-Sanchez, J. P., Vallejos, A., Andreu, J. M., Ceron, J. C., Molina-Sanchez, L., et al. (2018). Impacts of agricultural irrigation on groundwater salinity. Environ. Earth Sci. 77 (5), 197. doi:10.1007/s12665-018-7386-6
Suarez, A. (2024). Understanding the normalization of plantation agriculture: the case of hass avocado in Colombia. Land 13 (11), 1911. doi:10.3390/land13111911
Tian, H., Zhao, T. P., Wu, X. Q., and Wang, P. Q. (2024). The impact of digital economy development on carbon emissions-based on the perspective of carbon trading market. J. Clean. Prod. 434, 140126. doi:10.1016/j.jclepro.2023.140126
Wang, X. D., Yan, C., Liu, W., and Liu, X. H. (2022). Research on carbon emissions prediction model of thermal power plant based on SSA-LSTM algorithm with boiler feed water influencing factors. Sustainability 14 (23), 15988. doi:10.3390/su142315988
Wang, X. G., and Yan, L. (2022). Driving factors and decoupling analysis of fossil fuel related-carbon dioxide emissions in China. Fuel 314, 122869. doi:10.1016/j.fuel.2021.122869
Wu, X., Xie, M., Xu, S., Fei, R., and Pan, A. (2024). Does agricultural fiscal policy improve green development in China's agriculture sector? Evidence from energy and environmental perspectives. Environ. Dev. Sustain. doi:10.1007/s10668-024-04770-8
Wu, Y. Z., Shen, J. H., Zhang, X. L., Skitmore, M., and Lu, W. S. (2016). The impact of urbanization on carbon emissions in developing countries: a Chinese study based on the U-Kaya method. J. Clean. Prod. 135, 589–603. doi:10.1016/j.jclepro.2016.06.121
Xu, X., Li, J., Xue, Y., Sun, M., Niu, K., Jin, S., et al. (2022). Synergistic mechanism to incorporate the targets of greenhouse gas emission reduction and carbon sequestration into agricultural green development policies under a carbon-neutral background. J. Agro-Environment Sci. 41 (10), 2091–2101.
Xuan, X., Zhang, F., Deng, X. Z., and Bai, Y. P. (2023). Measurement and spatio-temporal transfer of greenhouse gas emissions from agricultural sources in China: a food trade perspective. Resour. Conservation Recycl. 197, 107100. doi:10.1016/j.resconrec.2023.107100
Xue, L., and Gao, Y. C. (2022). From modeling the interactions among institutions to modeling the evolution of an ecosystem: a reflection on the triple helix model and beyond. Triple Helix 9 (1), 54–64. doi:10.1163/21971927-bja10027
Zhang, Q., Zhang, Y. H., Wang, X. M., Li, H. Y., Liu, P. Z., Wang, X. L., et al. (2022). Change of tillage system affects the soil carbon pools characters, reduces carbon emissions and improves maize yield in the Loess Plateau. Eur. J. Agron. 141, 126614. doi:10.1016/j.eja.2022.126614
Zhang, Z., Mao, Z., and Wang, J. (2024). Harnessing the potential: exploring development opportunities and charting strategic pathways for China's enhanced engagement in international blue carbon cooperation. Environ. Res. Lett. 19 (9), 094049. doi:10.1088/1748-9326/ad5e9b
Appendix 1
Keywords: agricultural land use carbon emissions, spatio-temporal evolution, LMDI model, STIRPAT model, regional disparities, sustainable agriculture
Citation: Shi X, Zhou Z and Yu Z (2025) Carbon emissions from agricultural land use in China: spatio-temporal dynamics and pathways to neutrality. Front. Environ. Sci. 13:1455151. doi: 10.3389/fenvs.2025.1455151
Received: 26 June 2024; Accepted: 14 March 2025;
Published: 31 March 2025.
Edited by:
Sérgio António Neves Lousada, University of Madeira, PortugalReviewed by:
Changming Cheng, Nanjing Forestry University, ChinaJingjie Li, Tianjin University of Commerce, China
Ming Li, China Agricultural University, China
Xinjian Chen, Guangxi University, China
Copyright © 2025 Shi, Zhou and Yu. This is an open-access article distributed under the terms of the Creative Commons Attribution License (CC BY). The use, distribution or reproduction in other forums is permitted, provided the original author(s) and the copyright owner(s) are credited and that the original publication in this journal is cited, in accordance with accepted academic practice. No use, distribution or reproduction is permitted which does not comply with these terms.
*Correspondence: Xiongtian Shi, c2hpeGlvbmd0aWFuQHN0dS55bnUuZWR1LmNu; Zhenghao Zhou, bGNzd2R4bGNAMTYzLmNvbQ==; Zhengyong Yu, eXV6aGVuZ3lvbmdAc3R1LnludS5lZHUuY24=
†These authors have contributed equally to this work