 Changyi Liang
 Jing Zhao1
- 1School of Business, Anhui University of Technology, Ma’anshan, China
- 2School of Economics and Management, Southeast University, Nanjing, China
As China’s urbanization advances, it is necessary to explore the path of reducing air pollution from the perspective of urban spatial compactness. We established a dataset containing Landcover data, PM2.5 surface annual average concentration data, urban economic statistics, and geospatial data to construct a geometric form index for Chinese prefecture level and above cities. We used OLS as well as the instrumental variable method to examine the impact of urban geometric form on air pollution from the horizontal spatial dimension, and analyzed the heterogeneity and mechanism of urban geometric form on air pollution. Our research found that compact urban geometric form significantly reduces PM2.5 concentration, indicating that the urban spatial compactness is beneficial for alleviating air pollution. A series of robustness checks and endogeneity treatment results support our benchmark conclusion. The results of heterogeneity analysis show that cities with relatively lower population density have a greater impact on reducing air pollution by adopting the compact spatial development mode. The mechanism test results indicate that the compact urban geometric form reduces air pollution by reducing traffic congestion and residents' energy consumption. However, compact geometric form may exacerbate the urban heat island effect and thus increase PM2.5 concentrations, indicating a potential negative environmental externality of urban spatial compactness. Overall, the total effect is a trade-off, with the positive environmental externalities of urban spatial compactness outweighing the negative ones.
1 Introduction
With the long-term and rapid economic growth, China’s urbanization process continues to advance. However, in the process of development, Chinese cities are generally faced with the “urban disease” represented by air pollution. In recent years, the air pollution problem in China mainly caused by PM2.5 pollutant emissions has increasingly received extensive attention from governmental departments and scholars (Qin et al., 2019). Air pollution in China is characterized by wide coverage and high frequency of occurrence. Deteriorating air quality is extremely harmful to the population (Kim et al., 2003; Chay and Greenstone, 2005; Luechinger, 2009; Ito and Zhang, 2020; Gao et al., 2022), and it can especially cause immeasurable health effects on infants, young children and the elderly (Tanaka, 2015; Schlenker and Walker, 2016; Cheung et al., 2020). Hence, Chinese Government has proposed to “continue to deepen the battle to protect the blue sky, clear water and pure land”. The improvement of urbanization level and the expansion of urban population are the objective laws of urban development, which means that cities will absorb more population in the future. It is not feasible to solve the problem of air pollution by slowing down or even reversing urbanization. In this context, how to adopt a reasonable urban spatial development mode should be paid attention to. Therefore, it is an important topic of current research to actively explore the formation law of air pollution and seek the idea of tackling air pollution, which has profound theoretical and practical significance.
In the related studies of urban spatial form, the urban spatial compact index such as Richardson index, Cole index and Gibbs index have been widely used to measure the compact level of urban geometry. From the perspective of the spatial distribution of economic activities, compact development mode is regarded as a necessary means to alleviate urban environmental pollution (Duranton and Puga, 2020). Most of studies on urban compactness and environmental performance believe that compact and intensive urban forms will reduce the emission of polluting gases, and help to improve air quality (Newman and Kenworthy, 1989; Mouratidis, 2019; Tao et al., 2020).
This paper utilizes a disconnection index borrowed from the urban planning literature (Angel et al., 2010). This index is defined as the average Euclidean distance between any two points within a polygon. Based on geography, this paper proposes that in the horizontal spatial dimension, the urban geometric form emphasizes the geographic distance of the population within the city from the city center. The closer any point in the horizontal space is to the city center, the more compact the urban spatial development. It can be seen that the geometric form of the city can be described by calculating the average geographical distance between any point in the city and the city center to reflect the urban spatial compactness (Harari, 2020). The more regular the urban geometry, i.e., the more the geometry tends to be circular, this means the more compact the urban development. From the perspective of urban horizontal space, we try to answer the following three questions: (1) Will the urban spatial compactness have a positive or negative impact on air pollution? (2) What are the key mechanisms for compact urban geometric form to affect air pollution? (3) Considering the differences between different cities in density and other aspects, will the urban spatial compactness have a heterogeneous impact on air pollution?
The main contributions of our paper are as follows. Firstly, the urban geometric form was measured to gauge the urban horizontal spatial compactness, and OLS as well as instrumental variable method were used to identify the impact of urban geometric form on PM2.5 concentration. Secondly, expanding the research from the perspective of urban density heterogeneity is beneficial for proposing relevant policy recommendations to promote air quality improvement in response to the urban spatial compactness. Thirdly, analyzing the mechanism of how urban geometric form affects air pollution, and conducting corresponding tests on how the urban spatial ompactness affects the PM2.5 concentration, provides strong empirical evidence for relevant theories.
2 Literature review and research hypotheses
2.1 Literature review
Most of the related literature focuses on using traditional indicators to represent the urban compact development mode, such as total population and population density (Kahn, 2010; Halkos and Paizanos, 2013; Ma et al., 2016). However, existing studies have not only concluded that urban compact development marks the aggregation of population and economic activity in the vertical space (Ewing, 1997; Liang et al., 2023), and also paid attention to the compactness of urban horizontal spatial development. The concept of “compactness” in urban geometry is derived from the literature on urban planning and landscape ecology (Angel et al., 2010). Neuman (2005) Related studies believed that compact cities emphasize a development concept of “smart growth” (Neuman, 2005), and compact development is one of the most important conditions for environmental-friendly cities. Therefore, compact city is considered as a core concept and means to solve the disorderly spread of cities and realize the sustainable urban development, which has attracted wide attention of the society. It can be seen that the compact development of urban horizontal space means paying more attention to the intensive layout of land, rather than advocating for decentralized distribution.
At present, most of the relevant studies on the relationship between urban geometric form and air pollution believe that a more compact urban form is conducive to improving air quality (Holden and Norland, 2005; Clark et al., 2011; Lee and Lee, 2014; Kang et al., 2019; She et al., 2017). Few studies have found a positive relationship between urban compactness and air pollution (Tao et al., 2020), which may be due to the specificity of the study subjects. Specifically, Clark et al. (2011) found a negative correlation between urban compact development mode and PM2.5 concentration, indicating that compact urban form plays an important role in achieving long-term air quality goals (Clark et al., 2011). Lee and Lee (2014) found that compact and intensive urban form can significantly reduce commuting emissions and residential energy use (Lee and Lee, 2014). This study emphasizes the importance of smart growth policies and provides support for building more compact and traffic friendly cities. Kang et al. (2019) found that compact urban form is beneficial for improving air quality (Kang et al., 2019). In addition, She et al. (2017) found that the compactness of urban form contributes to the improvement of air quality, and further studies found a significant correlation between urban geometric form and forest coverage, indicating that the urban compact spatial development mode is beneficial for increasing forest coverage and thereby alleviating air pollution (She et al., 2017). Most studies examining the mechanisms have provided empirical evidence for the impact of urban form on air quality from the perspective of energy consumption. For example, Holden and Norland (2005) studied the relationship between urban compactness and household energy use, and found that the improvement of urban compactness leads to lower household energy consumption (Holden and Norland, 2005). Since saving household energy consumption is beneficial for improving air quality, this result provides support for compactness as a sustainable urban spatial development mode. Ishii et al. (2010) studied the impact of urban geometric form on greenhouse gas emission reduction potential, and found that the compactness of urban geometry has a great role in promoting energy-saving technology in alleviating greenhouse gas emissions (Ishii et al., 2010). Due to the fact that a more compact urban geometric form can reflect the shortened commuting distance within the city, relevant literature suggested that improving traffic congestion and reducing motor vehicle exhaust emissions are also considered the main way to alleviate air pollution (Mouratidis, 2019). It can be seen that from the perspective of urban geometric form, most existing studies believe that the compact development mode of urban horizontal space is more conducive to reducing air pollution.
2.2 Research hypothesis
The theory of agglomeration economy was first put forward by Marshall in the late 19th century, and became an important theoretical basis for the integration of new economic geography and traditional regional economics. The theory of agglomeration economy mainly emphasizes the spillover effect of spatial agglomeration of population and economic activities on improving productivity. Our paper analyzes the mechanism of urban spatial development mode on air pollution from the perspective of urban geometric form and mainly use the average geographic distance between any point in the city and the city center to measure urban geometric form. On the one hand, urban horizontal spatial compact development will alleviate the level of air pollution. Firstly, the length of people’s commuting time is influenced by the spatial separation of homes and workplaces and by the prevailing urban structure, which increases commuting distances if cities are not spatially compactly developed (Zhao et al., 2014). Irregular urban geometries can lead to longer commuting distances, especially when public transportation is not able to fully satisfy the dispersed urban space. Residents are less likely to use public transportation to get around, and an increase in private cars can cause worse traffic congestion. For example, in canyon cities with narrow geometries, there is not enough land for sprawl and the population is concentrated in a limited space. During peak commuting hours, severe traffic congestion is inevitable, leading to more pollutant emissions. On the contrary, cities with rounded geometries tend to have more compact horizontal spatial development, with more land available for planning and building transportation infrastructure, which improves street accessibility and enhances public transportation (Newman, 1978). Closer commuting distances also make residents more inclined to use public transportation, walking and other green modes of transportation, traffic congestion will be eased and the city will have better air quality. Secondly, form ratio, compactness ratio and elongation ratio exhibited positive correlations with resource efficiency, indicating that city compactness can be a contributing factor to improved resource efficiency. Compact cities tend to use fewer materials and less energy per capita for infrastructure construction (e.g., reduced lengths of pipelines and roads), preserve heat and energy more efficiently due to decreased exposed wall and roof areas per capita, and feature more multi-family residences that share foundations and resources. These factors can play a significant role in promoting urban eco-efficiency and resource efficiency (Liu et al., 2011). Due to the regular urban geometric form, a large number of people gather in the core area, which is conducive to the centralized supply and use of energy, thus saving energy consumption and reducing pollutant emissions. Specifically, residents living in dispersed areas are more likely to live in larger houses, whereas urban centers with compact spatial development mode have smaller average housing sizes, which contributes to reduced emissions from residential energy use and improved air quality.
On the other hand, when the agglomeration level of a city is too high, exceeding the carrying capacity of the city’s transportation facilities, environment and other aspects, the over-agglomeration of economic activities can also lead to agglomeration diseconomies. Therefore, urban compact development can also bring some negative impacts on the environment (Vuong and Nguyen, 2024), and this paper focuses on analyzing the relationship between urban compact development and urban heat island (UHI) effect. Due to the increase in urban horizontal spatial compactness, the greater the density of urbanized land, the increase in impermeable surfaces, the decrease in thermal inertia and the vegetation index limit evaporation, which reduces heat loss from latent heat fluxes, weakens air circulation from cities to rural areas, hinders heat diffusion within the city, and increases the temperature difference between urban and rural areas, which leads to an increase in the UHI effect (Qiao et al., 2014). Based on the above analysis, the first research hypothesis is proposed.
Hypothesis 1:. From the horizontal spatial dimension, compact urban geometries affect air pollution by relieving traffic congestion, reducing energy consumption and exacerbating the urban heat island effect, and the total effect is a trade-off between positive and negative environmental externalities of agglomeration.
In addition, the geometric form of cities with different population density may have varying impacts on air pollution. Therefore, it is necessary to analyze the heterogeneity of urban density in our study. Due to the phenomenon of excessive agglomeration in high-density cities, more compact urban geometric form can have less positive environmental externalities for these cities. At the same time, considering the need to avoid other urban diseases, moderate compact development in the horizontal space of large cities may be the best spatial development mode. On the contrary, for relatively low-density cities with less agglomeration negative externalities such as traffic congestion, population and economic activities are far from reaching the level of excessive agglomeration. Hence, the compact urban horizontal spatial development mode has positive environmental externalities in reducing PM2.5 concentration. Based on this, the second research hypothesis of our article is proposed.
Hypothesis 2:. The compact urban geometric form is more effective in alleviating PM2.5 concentration in cities with relatively low population density.
3 Model and variable introduction
3.1 Benchmark model
The benchmark model is constructed as follows:
In formula 1, i is the cross-section unit of the city, and t represents the year. PM2.5 is used to characterize the air pollution level, measured by the annual average PM2.5 concentration, and is the dependent variable in the model. Disco_ns characterizes the urban geometric form, obtained by calculating the average distance between various points within the city, and is used to measure the urban spatial development mode. It is the core explanatory variable in the model. Controls represent a series of control variables that change over time, including urban area (Area), proportion of secondary industry (Second), level of economic openness (Pfdi), per capita road area (Proad), per capita GDP (Pgdp), and the quadratic term of per capita GDP (Pgdp2). Considering that the core explanatory variable of urban geometric form has very little variation in the time dimension (Harari, 2020), the variation of the sample mainly comes from between cities. If the city fixed effect is controlled, it will affect the accuracy of the estimation results. Therefore, by referring to relevant literature, the city fixed effect is not controlled in our benchmark model. Instead, a set of urban characteristic variables that do not change over time are added to address possible omitted variable biases (Faberman and Freedman, 2016; Duranton and Turner, 2018). Di represents a series of urban characteristic variables that do not change with time, including whether it is a provincial capital city (Capital), whether it is a travel city (Travelcity), the number of historical sites (Historicalsite), summer average temperature (Summertemp) and geographical latitude (Latitude). Furthermore, γt is the year fixed effect. α0、α1、αx、βx are the estimated coefficients. ε is the error term. In the regression, the average PM2.5 concentration (PM2.5), per capita GDP (Pgdp), the number of historical sites (Historicalsite), summer average temperature (Summertemp) and geographical latitude (Latitude) were logarithmically calculated.
3.2 Variable introduction and data sources
3.2.1 Urban geometric form index
We characterize urban spatial compactness by measuring the geometric form index in the horizontal spatial dimension. This paper draws on the measurement of the urban geometric form index in the relevant literature (Angel et al., 2010; Harari, 2020). Intuitively, the concept of urban spatial compactness is based on the idea that a circle is the most compact geometry. The degree to which a polygonal shape deviates from a circular shape can be measured by a number of different indices, all of which are based on the distribution of points within the polygon (Angel et al., 2010). In this paper, the urban geometric form index is defined as a calculation of the average distance between any point within the city and the city center. The smaller the index, the more compact the urban geometric form.
The specific calculation method of the urban geometric form index is as follows. Our research is based on Landcover data observed by the European Space Agency (ESA) through remote sensing. The following operations are carried out: First, China’s Landcover data is extracted, and the grid data of built-up areas is transformed into vector polygon data using ArcGIS. Then, the polygon with the largest internal area of each city is selected and defined as urban footprint. According to the city footprint extract the internal 300 m × 300 m grids, and calculate the average distance, maximum distance between any two points. Finally, calculate the circular radius equal to the urban footprint area, divide the above indicators by this radius for standardization, and obtain the urban geometric form index. The calculation formula of the urban geometric form index is shown as follows:
In formula 2, c represents the city, and Disco_nsc refers to the geometric form index of city c, dx,y represents the average distance between any two points in city c. In addition, by calculating the maximum distance between any two points in city c and the average distance between any point with the city center, we can respectively calculate the alternative indicators of urban geometric form (Disco_nsc), namely, Range_nsc and Remo_nsc, which will be used in the robustness check section below.
In this study, the geometric form indices of all municipalities and first-tier cities from 2000 to 2016 was calculated, as well as the overall average of China. The smaller the urban geometric form index, the higher the urban horizontal spatial compactness. Figure 1 shows the evolution trend of the geometric form indices of some important cities in China. Among them, the geometric form index of Beijing increased from 2000 to 2006, and then changed little from 2007 to 2016, indicating that the urban spatial compactness. in Beijing decreased first and then basically stabilized. Similarly, the urban spatial compactness. in Tianjin, Guangzhou and Shenzhen has also experienced a basically flat process after a decline. In addition, the geometric form indices of Shanghai and Chongqing appeared basically unchanged after the rising trend. On the whole, the geometric form indices of municipalities and first-tier cities is significantly higher than the overall level of China, indicating that the urban horizontal spatial compactness. Of these cities is relatively low, which can reflect the phenomenon such as urban sprawl caused by the disorderly expansion of horizontal space in big cities.
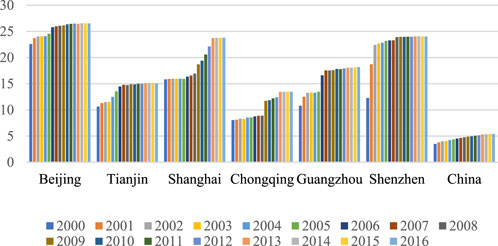
Figure 1. Evolution trend and comparison of geometric form indices of municipalities and first-tier cities in China.
3.2.2 PM2.5 concentration
In this paper, the average annual PM2.5 surface concentration was used to represent the air pollution level. The data were obtained from the global average annual PM2.5 concentrations data (1998–2016) provided by the Socioeconomic Data and Applications Center (SEDAC) of Columbia University. The average annual PM2.5 concentration was extracted by ArcGIS software, combined with the vector map of urban administrative area division in China.
3.2.3 Control variables
(1) Urban area (Area) refers to the area of the largest continuous built-up area within the urban zoning; (2) The proportion of secondary industry (Second) is measured by the proportion of the value of the secondary industry in GDP; (3) The level of economic openness (Pfdi) is measured by the ratio of foreign direct investment to GDP; (4) Per capita road area (Proad) is calculated by the proportion of the total road area and the total population; (5) Per capita GDP (Pgdp) is measured by the ratio of the GDP to the total population; (6) The square of per capita GDP (Pgdp2) used to study the inverted U-shaped relationship between per capita GDP and air pollution; (7) Whether it is a provincial capital city (Capital) refers to the virtual variable of the provincial capital city; (8) Whether it is a travel city (Travelcity) refers to the virtual variable set according to the list of tourist cities; (9) The number of historical sites (Historicalsite) refers to the number of key cultural relics units under national protection (10) summer temperature (Summertemp) refers to the summer average temperature of the city between 1970 and 2010 (11) Geographical latitude (Latitude) refers to the latitude of the geographical location of the city.
The data of the above variables are mainly from the China Urban Statistical Yearbook (2001–2017), the National Center for Basic Geographic Information and the National Climate Center. The description of variables and the descriptive statistics are described in Table 1 below.
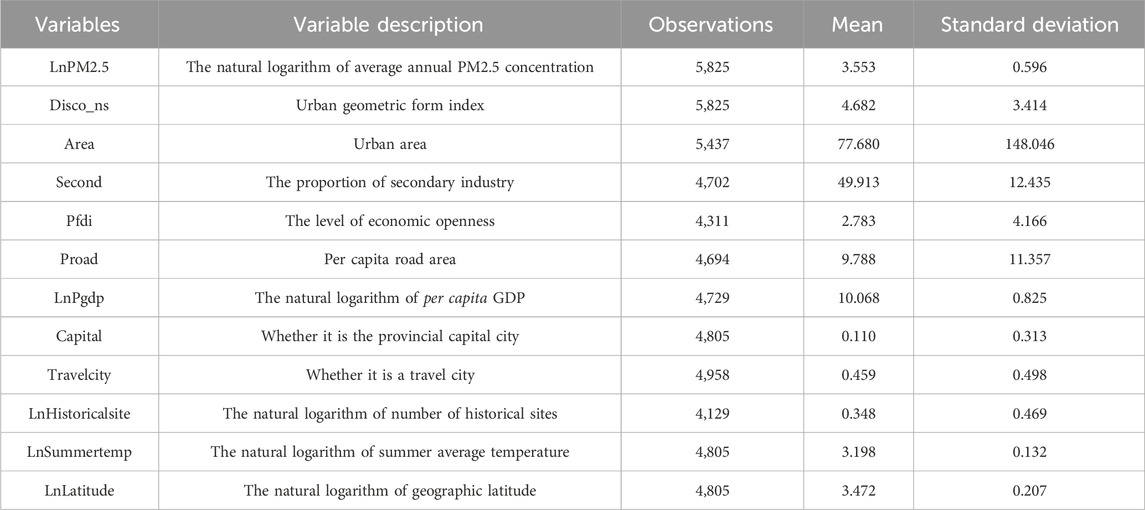
Table 1. Description of the variables and the descriptive statistics.
4 Empirical result and discussion
4.1 Benchmark regression results
This section analyzes the benchmark regression results of the impact of urban geometric form on air pollution, and discusses the relationship between the urban spatial compactness and air pollution. In Table 2, only the core explanatory variable urban geometric form index (Disco_ns) is added in the first column. The results show that the coefficient value of urban geometric form index is 0.057, which is significant at the 1% level, indicating that the dispersion degree of urban geometric form increases by 1 unit, and the air pollution will increase by 5.7%. The second column controls the urban area (Area) on the basis of the first column to exclude the possible influence of the urban area on the estimated results. The third column adds year fixed effect to the second column to control for the impact of the national policy shocks not changing with cities on the regression results. In the basis of third column, the fourth column added a series of urban characteristic variables, including whether it is the provincial capital city (Capital), whether it is the tourist city (Travelcity), the natural logarithm of number of historical sites (LnHistoricalsite), the natural logarithm of summer average temperature (LnSummertemp) and the natural logarithm of geographic latitude (LnLatitude), used to alleviate the interference of omitted variables that do not change over time at the city level on estimation results. Among them, the results in the second to fourth columns show that the coefficient of urban geometric form index is significantly positive at the 1% level. In the fifth column, a series of city-level control variables were added on the basis of the fourth column, and the results show that the coefficient value of the urban geometric form index is 0.019, and the significance level is still 1%. This indicates that if the urban geometric form is made more compact by one unit, the air pollution will be reduced by 1%. It can be seen that adopting the compact spatial development mode is conducive to the improvement of air quality. Overall, the positive environmental externalities exerted by agglomeration economies are greater compared to the negative environmental externalities exerted by agglomeration diseconomies, suggesting that more compact geometric form is beneficial for reducing PM2.5 concentrations, responding to the doubt about tradeoffs in Hypothesis 1.
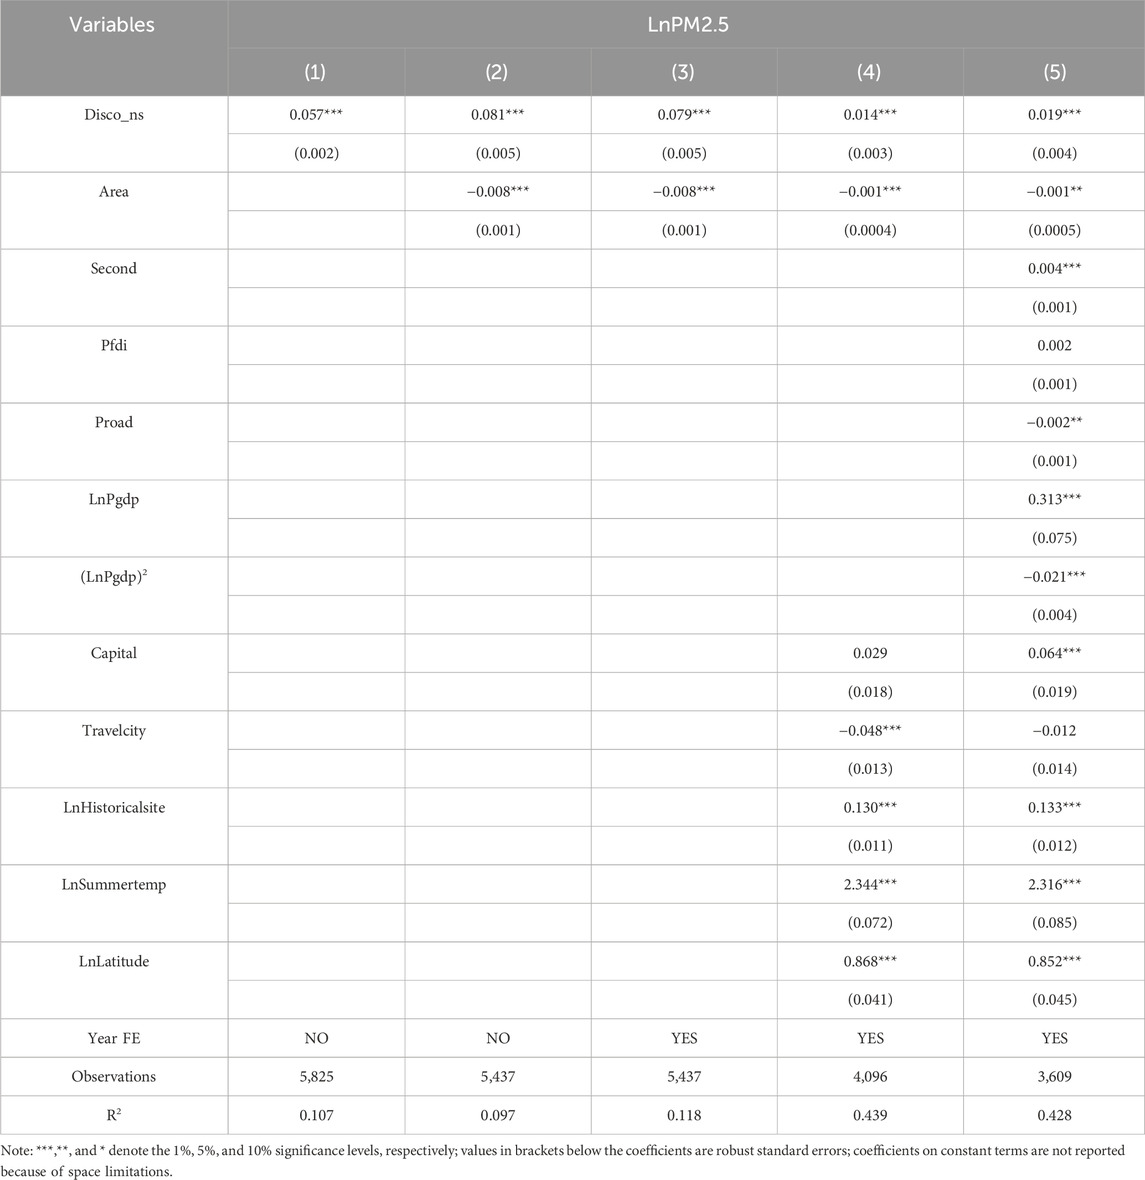
Table 2. Benchmark regression results.
The estimated results of the control variables in the fifth column of Table 2 were then analyzed next. Among them, the urban area (Area) estimated coefficient are significantly negative in each column, shows that the expansion of urban area is beneficial to alleviate air pollution, may be due to the urban area expansion attracted more environmentally friendly enterprises, and promote the enterprise clean production technology sharing, played a positive agglomeration economic environmental externalities, and improve the air quality. The regression coefficient of the proportion of secondary industry (Second) is significantly positive at the level of 1%, indicating that the development of secondary industry will aggravate the local air pollution level. The coefficient of the level of economic openness (Pfdi) is positive but not significant, indicating that this result cannot indicate whether foreign direct investment alleviates or aggravates the air pollution in cities. The estimated coefficient of per capita road area (Proad) was significantly negative at the 5% level, indicating that improvements in urban road area can reduce the PM2.5 concentration. The estimated coefficients of per capita GDP (Pgdp) and the square of per capita GDP (Pgdp2) were 0.313 and −0.021, respectively, and both were significant at the 1% level, indicating an inverted U-shaped relationship between the economic development level and air pollution. In addition, in this study, a series of urban characteristic variables were added to the regression, mainly to exclude the interference of possible missing variables in terms of urban development characteristics, administrative grade and geographical climate, so the coefficient values and significance of these urban characteristic variables will not be analyzed.
4.2 Robustness check results
4.2.1 Replace the core explanatory variable
In the previous benchmark regression, the average distance between the points in the city to represent the urban geometric form, and then measure the urban spatial compactness. Considering that the urban geometric form can not only be obtained by calculating the average distance between the points in the city, the maximum distance between the points, and the average distance between the points and the city center can also reflect the compact urban geometric form. Therefore, we replace the core explanatory variables to adopt robustness test.
Specifically, in the first and second columns of Table 3, the two surrogate indicators of the maximum distance among the points within the city (Range_ns) and the average distance between the points and the city center (Remo_ns) are used as surrogate variables of the urban geometric form index (Disco_ns). In addition, a series of control variables and year fixed effect were added in both the first and second columns of Table 3. It can be seen that in the first column, the coefficient of urban geometric form index (Range_ns) is 0.009, which is significant at the 1% level, indicating that if the compactness of the urban geometric form is increased by 1 unit, the air pollution will decrease by 0.9%. In the second column, the coefficient of the urban geometric form index (Remo_ns) is significantly positive at the 1% level, and the coefficient value is 0.023, indicating that the degree of urban geometric form dispersion is increased by 1 unit, the air pollution will increase by 2.3%. It can be seen that the results of the robustness test by using the strategy of replacing different urban geometric form indexes further support the benchmark conclusion, that is, adopting the compact spatial development mode can alleviate the air pollution.
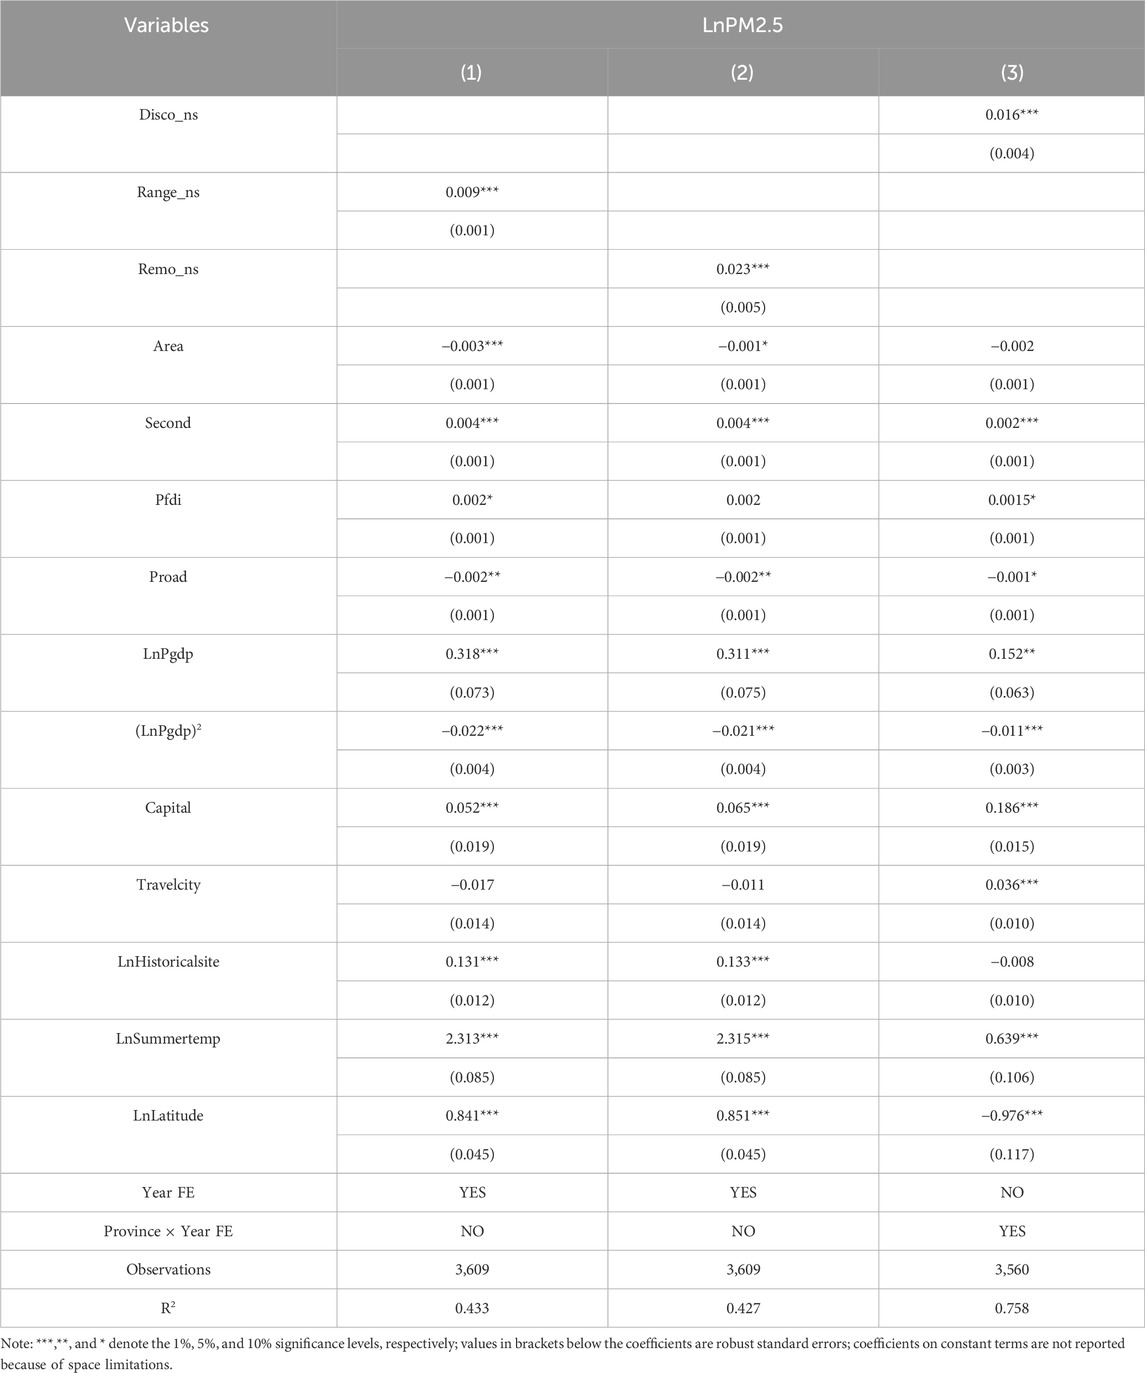
Table 3. Results of the robustness check.
4.2.2 Change the fixed effect
Considering the potential interference of missing variables at the province level, in the third column of Table 3, the year fixed effect is no longer controlled, but the interaction fixed effect of province and year is added, and a series of city-level control variables were added in the regression to conduct the robustness test. It can be seen that the coefficient value of urban geometric form index is 0.016, and it is significant at the 1% level, indicating that the compactness of urban geometric form is improved by 1 unit, and the air pollution will decrease by 1.6%. This result is consistent with the results in the benchmark regression, indicating that the possible missing variables at the province level do not significantly interfere with the estimated results, and the conclusions drawn in the benchmark regression have strong robustness.
4.3 Endogeneity treatment results
OLS method is used in the previous benchmark regression. Although a series of city-level control variables and year fixed effect are controlled, it is still difficult to avoid the endogenous problems caused by mutual causal or missing variables, which leads to the bias of OLS estimator. At this point, compared with the OLS method, the instrumental variable method can effectively deal with the potential endogeneity.
The primary considerations for constructing instrumental variables are their exogeneity and relevance. This paper draws on the methodology in Harari (2020), an instrumental variable for the urban geometric form index (Disco_iv) is constructed based on China’s four censuses in 1953, 1964, 1982, and 1990, as well as data on China’s land-use types, and combining both historical and geographic factors. Furthermore, we calculated Range_iv and Remo_iv as instrumental variables for the surrogate urban geometric form indices Range_ns and Remo_ns, respectively.
Next, we explain the rationality of the selection of the instrumental variables in this study. First, as the distribution of urban undevelopable land and the historical population size of the city will not be disturbed by unrecognizable confounding factors during the sample period, and will not affect haze pollution during the sample period through factors other than urban geometric form, the instrumental variables satisfy the principle of exogeneity. Second, since urban development is a continuous process, and the historical population size of a city affects urban boundaries, infrastructure and government-related policies, which in turn act on urban geometry. For instance, the urban undevelopable areas limit the direction of outward expansion of the city and have an impact on the development pattern of the internal structure of the city, which affects the urban geometric form. Therefore, the instrumental variables constructed in this paper satisfy the principle of relevance.
The regression results for the correlation of the instrumental variables are presented in Table 4. Among them, the explanatory variable in the first column is the urban geometric form index (Disco_ns) characterized by the average distance between the points within the city, and the explanatory variable is the instrumental variable (Disco_iv). It can be seen that the coefficient value of the instrumental variable is 1.591 and is significant at the 1% level, indicating a strong correlation between the instrumental variables and the urban geometric form index. The explained variables in the second and third columns are Range_ns and Remo_ns, and the explanatory variables are the corresponding instrumental variables. The results show that the coefficient of the instrumental variables is significantly positive at the 1% level, which further verifies that the instrumental variables meet the principle of correlation. Furthermore, R2 values in the first to third columns of Table 4 are 0.391, 0.422 and 0.387, respectively, which also indicate that the instrumental variables have strong explanatory power.

Table 4. Results for the correlation of the instrumental variables.
In Table 5, the two-stage least squares method (2SLS) was used to estimate the causal relationship between urban geometric form and air pollution. A series of urban characteristic variables and the year fixed effect are controlled in each column. It can be seen that the first stage F-statistics is significantly higher than the empirical value of 10 in each column, indicating that our instrumental variables are not weak.
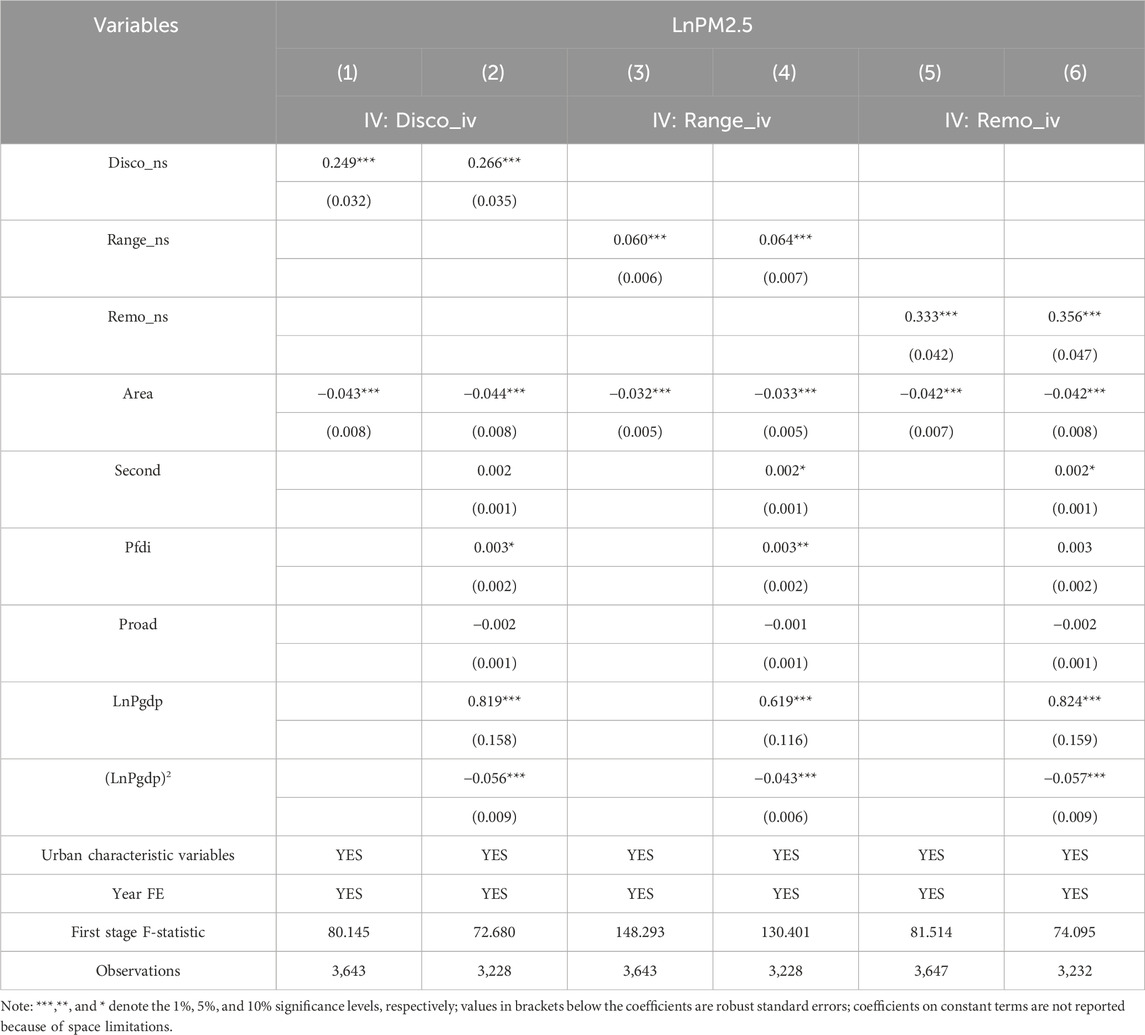
Table 5. Results of the endogeneity treatment.
Specifically, the first and second columns in Table 5 show the regression results using the instrumental variable Disco_ iv, and only the urban area (Area) is controlled in the first column. The second column has added a series of city-level control variables based on the first column. The results of the first and second columns show that the coefficient of urban geometric form index (Disco_ns) is 0.249 and 0.266 respectively, both of which are significant at the 1% level, indicating that the dispersion degree of urban geometric form is increased by one unit, and the PM2.5 concentration will be increased by 24.9%–26.6%, that is, the decentralized development of urban horizontal space will lead to the aggravation of air pollution. Compared with the results of benchmark regression, it can be found that the estimated coefficient obtained by instrumental variable method regression is larger, indicating that OLS regression underestimated the impact of urban geometric form on air pollution to some extent, that is, based on the above endogeneity treatment results, the urban spatial compactness plays a greater role in reducing air pollution.
The third to sixth columns in Table 5 verify the robustness of the regression results of the instrumental variable method by examining different urban geometric form indices. Among them, the regression results using the instrumental variables Range_ iv in the third and fourth columns showed that the coefficient values of the alternative urban geometric form index (Range_ns) were 0.060 and 0.064, respectively, and both were significant at the 1% level. In addition, the regression results using the instrumental variable Remo_iv in the fifth and sixth columns showed that the coefficient values of the alternative urban geometric form index (Remo_ns) were 0.333 and 0.356, respectively, and the significance level was still 1%. All the above results show that after replacing the urban geometric form index and the corresponding instrumental variables, the results are still robust, and the conclusion is still consistent with the first and second columns of Table 5, that is, the more compact urban geometric form is conducive to reducing the PM2.5 concentration. Overall, after considering the possible problem of endogeneity, the regression results of the instrumental variable method further support the benchmark conclusions obtained above.
4.4 Heterogeneity analysis results
The regression results without considering the heterogeneity of urban density show that the compact urban geometric form can alleviate PM2.5 concentration. Next, based on the relevant theoretical analysis above, our study empirically examines the heterogeneous impact of urban spatial compactness on air pollution in cities with different population densities. Figure 2 shows a schematic diagram of the heterogeneity analysis. In Figure 2, the red arrow pointing upwards indicates an increase in the moderating variable (Population density), while the red “-” indicates the negative moderating effect; the blue “+” indicates the positive relationship between urban geometric form index and PM2.5 concentration. In conjunction with Figure 2, the empirical strategy and results of the heterogeneity analysis are presented in Table 6.
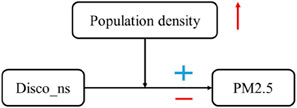
Figure 2. Schematic diagram of the heterogeneity analysis.
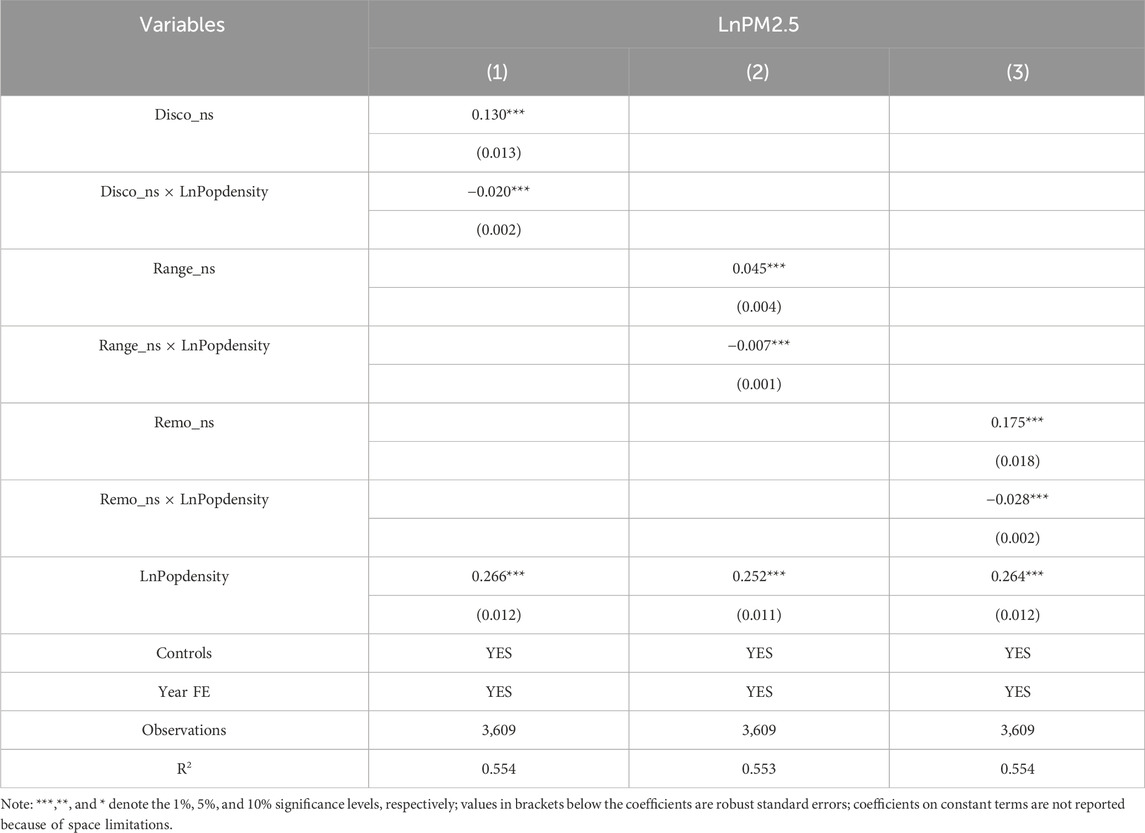
Table 6. Results of the heterogeneity analysis.
The first column in Table 6 added the natural logarithm of urban population density (LnPopdensity) and the interaction term between this variable and urban geometric form (Disco_ns × LnPopdensity) to the benchmark regression, and the results show that the coefficient value of the interaction term is −0.020 and significantly at the 1% level. In the second and third columns, the urban geometric form indices Range_ns and Remo_ns are used instead of Disco_ns, respectively. It can be observed that the coefficient values of the interaction term are −0.007 and −0.028, respectively, and both are significant at the 1% level. This shows that the horizontal space of the relatively high-density cities can be appropriately expanded to the surrounding areas, while the relatively low-density cities should adopt a more compact spatial development mode. This may be due to the excessive concentration of population and economic activities in relatively high-density cities, so the effect of the compact urban spatial development to alleviate air pollution is not obvious enough for relatively low-density cities. It is clear that the results of the heterogeneity analysis in this section strongly validate the conjecture in the research Hypothesis 2.
4.5 Mechanism test results
As pointed out in the above analysis, the compact urban geometric form not only reduces PM2.5 concentration by alleviating traffic congestion and saving energy consumption, but also increase PM2.5 concentration by exacerbating the urban heat island effect. In this part, the relationship between urban spatial compactness and traffic congestion, residential energy consumption and urban heat island effect is investigated using the mechanism variable as the dependent variable and the urban geometry index as the core explanatory variable.
First, this study used the Congestion Delay Index (CDI) and All Day Congestion Index (Alldaytj) provided by Amap to measure the degree of urban traffic congestion. In this part, we adopt the empirical strategy of lagging the core explanatory variables, which can not only increase the sample size, but also alleviate the potential endogeneity caused by reverse causality. Specifically, in the first and second columns of Table 7, the urban geometric form index (Disco_ns) is used as the core explanatory variable, and the dependent variables are the natural logarithm of Congestion Delay Index (LnCDI) and the natural logarithm of All Day Congestion Index (LnAlldaytj), respectively. Each column controls for year fixed effect and adds whether it is a provincial capital city (Capital), whether it is a travel city (Travelcity), the natural logarithm of the number of historical sites (LnHistoricalsite), the natural logarithm of summer average temperature (LnSummertemp), and the natural logarithm of geographical latitude (LnLatitude) as control variables.

Table 7. Mechanism test results of traffic congestion.
The results of the first and second columns in Table 7 show that the coefficient values of the urban geometric form index are 0.005 and 0.004 respectively, and both of them are significant at the 1% level, indicating that the more compact urban geometric form will shorten the commuting distance and time, and thus obviously alleviate the traffic congestion. As relevant studies have confirmed that traffic congestion will exacerbate air pollution. Therefore, the more compact horizontal spatial development of cities can reduce the PM2.5 concentration by alleviating traffic congestion. In addition, in the third and fourth columns of Table 7, the urban geometric form index Range_ns was used instead of Disco_ns, and the urban geometric form index Remo_ns was used as a substitute variable for Disco_ns in the fifth and sixth columns. Based on the above strategy, we conducted a series of robustness tests. The results in the third to sixth columns of Table 7 all show that the improvement of urban spatial compactness can alleviate traffic congestion, further supporting the research conclusions drawn in the first and second columns.
Second, this study uses the per capita carbon emission of cities (Pc) to measure the residential energy consumption, and the corresponding mechanism test results are shown in Table 8. In Table 8, the year fixed effect and a series of control variables have been added to each column. Among them, the first column of Table 8 uses the urban geometric form index (Disco_ns) as the core explanatory variable, and the results show that the coefficient value of the urban geometric form index is 0.029, which is significant at the 1% level, indicating that the urban spatial compactness is conducive to saving residents' energy consumption. In addition, the second and third columns respectively use the alternative urban geometric form indices Range_ns and Remo_ns as the core explanatory variables. The results show that the coefficients of the alternative urban geometric form indices are significantly positive at the 1% level. The above results indicate that the conclusion obtained in the first column of Table 8 remains robust. Overall, the benchmark results and the mechanism test results confirm the research hypothesis 1 proposed above.
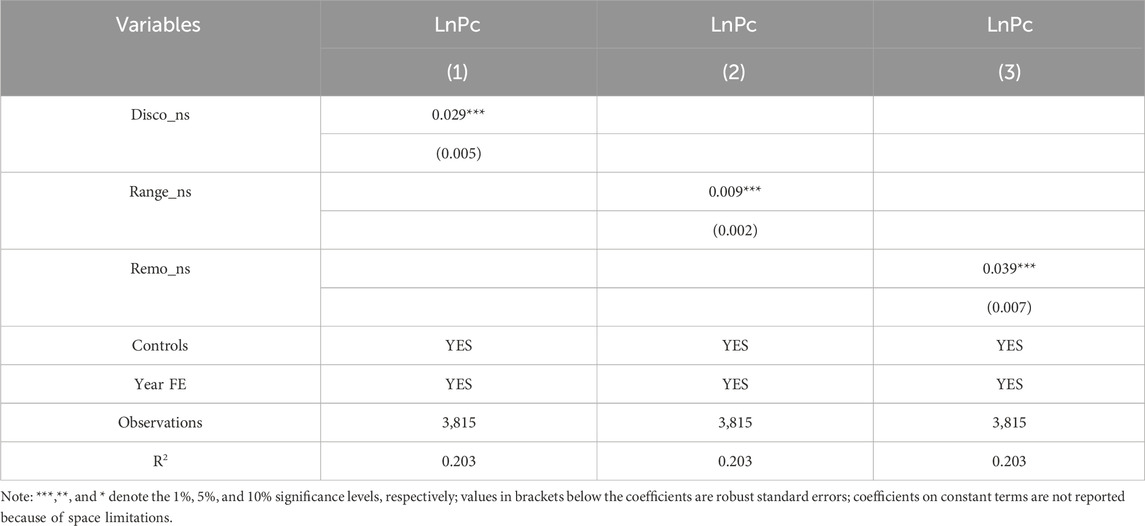
Table 8. Mechanism test results of residential energy consumption.
Third, this study uses the urban heat island intensity (UHII) dataset to measure the urban heat island effect, which was estimated using the dynamic equivalent area method (DEA) (Yang et al., 2024). The corresponding mechanism test results are shown in Table 9. In Table 9, year fixed effect and a series of control variables are added to each column. The first column of Table 9 uses the urban geometric form index (Disco_ns) as the core explanatory variable, and the dependent variable is the natural logarithm of the urban heat island intensity (LnUHII). The results show that the coefficient value of the urban geometric form index is −0.046, which is significant at the 1% level, indicating that urban spatial compactness exacerbates the urban heat island effect and thus air pollution. In addition, the second and third columns replace Disco_ns with the alternative urban geometric indices Range_ns and Remo_ns, respectively. The robustness test results show that the coefficients of the alternative urban geometric indices are still significantly negative at the 1% level. These results indicate that the conclusions drawn in the first column of Table 9 remain robust. Overall, the results of mechanism tests above validate the three potential mechanisms proposed in Hypothesis 1.

Table 9. Mechanism test results of urban heat island effect.
5 Conclusion and policy recommendations
This article explores the impact of the geometric form of Chinese cities on PM2.5 concentration from the perspective of urban horizontal spatial development. Firstly, we measure the urban geometric form index to reflect the urban spatial compactness, and use PM2.5 concentration to represent air pollution level. Secondly, our benchmark model uses OLS regression to analyze the relationship between urban geometric form and PM2.5 concentration. Then, we combine historical and geographical factors to construct instrumental variables of urban geometric form index, and use instrumental variable method to solve potential endogeneity problems. Next, we analyze the heterogeneous impact of urban population density. Finally, we investigate the main mechanisms by which compact urban geometric form affect PM2.5 concentrations.
The following main conclusions are drawn. Firstly, the results of benchmarking and robustness tests show that more compact urban geometries are conducive to the reduction of PM2.5 concentrations, that is, urban spatial compactness can mitigate air pollution level. Secondly, the results of the heterogeneity analysis show that compared to relatively high-density cities, relatively low-density cities have a more significant haze reduction effect by adopting a compact spatial development mode. Thirdly, the mechanism test results show that the compact urban geometric form reduces air pollution by alleviating traffic congestion and saving residential energy consumption. On the contrary, the compact geometric form increases air pollution by exacerbating the urban heat island effect. Overall, the positive environmental externalities of compact urban geometries are larger than the negative environmental externalities.
This article provides the following policy recommendations for haze control from the perspective of optimizing urban geometric form. Firstly, to prevent disorderly urban expansion, to plan and control urban development boundaries reasonably, and to strengthen the centralized and compact distribution of population within cities. This includes formulating clear land-use policies and prioritizing the development of central urban areas and established built-up areas. At the same time, it strengthens functional mixing within cities and encourages the compact layout of residential, commercial and service facilities to shorten commuting distances, reduce traffic pressure and promote community vitality. Secondly, vigorously optimize the geometric form of cities and guide the compact development of urban horizontal space. For cities with loose geometric form due to terrain conditions, it is necessary to further strengthen the construction of public transportation infrastructure to alleviate the adverse effects of loose urban geometric form on air pollution. This includes increasing high-capacity public transportation services such as metro, light rail, and bus rapid transit (BRT) systems, constructing a wide-coverage public transportation network, supporting the construction of walking and cycling paths, and promoting green modes of travel. Thirdly, relatively low-density cities should pay more attention to promoting the agglomeration of population and economic activities in horizontal space, while high-density cities, relying on public transportation networks, can appropriately liberalize urban development boundary control measures to avoid other aspects of “urban diseases” caused by over-concentration of population. For example, over-compacting the horizontal space of cities will increase the density of urbanized land, and exacerbate the urban heat island effect, thereby aggravating air pollution. Therefore, in concrete implementation, the “degree” of urban spatial compactness should be properly grasped.
Data availability statement
The datasets presented in this study can be found in online repositories. The names of the repository/repositories and accession number(s) can be found below: https://sedac.ciesin.columbia.edu/data/sets/browse.
Author contributions
CL: Conceptualization, Funding acquisition, Methodology, Project administration, Supervision, Writing–original draft, Writing–review and editing. JZ: Formal Analysis, Investigation, Software, Validation, Visualization, Writing – original draft. JL: Investigation, Resources, Supervision, Validation, Writing–review and editing. RZ: Data curation, Methodology, Resources, Software, Visualization, Writing–review and editing.
Funding
The author(s) declare that financial support was received for the research and/or publication of this article. National Natural Science Foundation of China (grant number: 72403004); Key Project of Humanities and Social Sciences Research in Anhui Province’s Universities (grant number: 2024AH052283).
Conflict of interest
The authors declare that the research was conducted in the absence of any commercial or financial relationships that could be construed as a potential conflict of interest.
Publisher’s note
All claims expressed in this article are solely those of the authors and do not necessarily represent those of their affiliated organizations, or those of the publisher, the editors and the reviewers. Any product that may be evaluated in this article, or claim that may be made by its manufacturer, is not guaranteed or endorsed by the publisher.
References
Angel, S., Parent, J., and Civco, D. L. (2010). Ten compactness properties of circles: measuring shape in geography. Can. Geogr. Géogr. Can. 54 (4), 441–461. doi:10.1111/j.1541-0064.2009.00304.x
Chay, K. Y., and Greenstone, M. (2005). Does air quality matter? Evidence from the housing market. J. Political Econ. 113 (2), 376–424. doi:10.1086/427462
Cheung, C. W., He, G., and Pan, Y. (2020). Mitigating the air pollution effect? The remarkable decline in the pollution-mortality relationship in Hong Kong. J. Environ. Econ. Manag. 101, 102316. doi:10.1016/j.jeem.2020.102316
Clark, L. P., Millet, D. B., and Marshall, J. D. (2011). Air quality and urban form in U.S.urban areas: evidence from regulatory monitors. Environ. Sci. and Technol. 45 (16), 7028–7035. doi:10.1021/es2006786
Duranton, G., and Puga, D. (2020). The economics of urban density. J. Econ. Perspect. 34 (3), 3–26. doi:10.1257/jep.34.3.3
Duranton, G., and Turner, M. A. (2018). Urban form and driving: evidence from US cities. J. Urban Econ. 108, 170–191. doi:10.1016/j.jue.2018.10.003
Ewing, R. (1997). Is los angeles-style sprawl desirable? J. Am. Plan. Assoc. 63 (1), 107–126. doi:10.1080/01944369708975728
Faberman, R. J., and Freedman, M. (2016). The urban density premium across establishments. J. Urban Econ. 93, 71–84. doi:10.1016/j.jue.2016.03.006
Gao, X., Ruan, Z., Liu, J., Chen, Q., and Yuan, Y. (2022). Analysis of atmospheric pollutants and meteorological factors on PM2.5 concentration and temporal variations in Harbin. Atmosphere 13, 1426. doi:10.3390/atmos13091426
Halkos, G. E., and Paizanos, E. Α. (2013). The effect of government expenditure on the environment: an empirical investigation. Ecol. Econ. 91, 48–56. doi:10.1016/j.ecolecon.2013.04.002
Harari, M. (2020). Cities in bad shape: urban geometry in India. Am. Econ. Rev. 110 (8), 2377–2421. doi:10.1257/aer.20171673
Holden, E., and Norland, I. T. (2005). Three challenges for the compact city as a sustainable urban form: household consumption of energy and transport in eight residential areas in the greater Oslo region. Urban Stud. 42 (12), 2145–2166. doi:10.1080/00420980500332064
Ishii, S., Tabushi, S., Aramaki, T., and Hanaki, K. (2010). Impact of future urban form on the potential to reduce greenhouse gas emissions from residential, commercial and public buildings in Utsunomiya, Japan. Energy Policy 38 (9), 4888–4896. doi:10.1016/j.enpol.2009.08.022
Ito, K., and Zhang, S. (2020). Willingness to pay for clean air: evidence from air purifier markets in China. J. Political Econ. 128 (5), 1627–1672. doi:10.1086/705554
Kahn, M. E. (2010). New evidence on trends in the cost of urban agglomeration. Agglomeration Economics. University of Chicago Press, 339–354.
Kang, J. E., Yoon, D. K., and Bae, H. (2019). Evaluating the effect of compact urban form on air quality in Korea. Environ. Plan. B Urban Anal. city Sci. 46 (1), 179–200. doi:10.1177/2399808317705880
Kim, C. W., Phipps, T. T., and Anselin, L. (2003). Measuring the benefits of air quality improvement: a spatial hedonic approach. J. Environ. Econ. Manag. 45 (1), 24–39. doi:10.1016/s0095-0696(02)00013-x
Lee, S., and Lee, B. (2014). The influence of urban form on GHG emissions in the US household sector. Energy Policy 68, 534–549. doi:10.1016/j.enpol.2014.01.024
Liang, C., Liu, X., and Tavera, C. (2023). Environmental externalities of urban agglomeration in China: new evidence from the perspective of economic density. Singap. Econ. Rev., 1–25. doi:10.1142/s0217590823500108
Liu, Y., Song, Y., and Arp, P. H. (2011). Examination of the relationship between urban form and urban eco-efficiency in China. Habitat Int. 36 (1), 171–177. doi:10.1016/j.habitatint.2011.08.001
Luechinger, S. (2009). Valuing air quality using the life satisfaction approach. Econ. J. 119 (536), 482–515. doi:10.1111/j.1468-0297.2008.02241.x
Ma, Y. R., Ji, Q., and Fan, Y. (2016). Spatial linkage analysis of the impact of regional economic activities on PM2.5 pollution in China. J. Clean. Prod. 139, 1157–1167. doi:10.1016/j.jclepro.2016.08.152
Mouratidis, K. (2019). Compact city, urban sprawl, and subjective well-being. Cities 92, 261–272. doi:10.1016/j.cities.2019.04.013
Neuman, M. (2005). The compact city fallacy. J. Plan. Educ. Res. 25 (1), 11–26. doi:10.1177/0739456x04270466
Newman, P. W. G., and Kenworthy, J. R. (1989). Gasoline consumption and cities: a comparison of US cities with a global survey. J. Am. Plan. Assoc. 55 (1), 24–37. doi:10.1080/01944368908975398
Qiao, Z., Tian, G., Zhang, L., and Xu, X. (2014). Influences of urban expansion on urban heat island in Beijing during 1989–2010. Adv. Meteorology 2014 (1), 1–11. doi:10.1155/2014/187169
Qin, Y., Wu, J., and Yan, J. (2019). Negotiating housing deal on a polluted day: consequences and possible explanations. J. Environ. Econ. Manag. 94, 161–187. doi:10.1016/j.jeem.2019.02.002
Schlenker, W., and Walker, W. R. (2016). Airports, air pollution, and contemporaneous health. Rev. Econ. Stud. 83 (2), 768–809. doi:10.1093/restud/rdv043
She, Q., Peng, X., Xu, Q., Long, L., Wei, N., Liu, M., et al. (2017). Air quality and its response to satellite-derived urban form in the Yangtze River Delta, China. Ecol. Indic. 75, 297–306. doi:10.1016/j.ecolind.2016.12.045
Tanaka, S. (2015). Environmental regulations on air pollution in China and their impact on infant mortality. J. Health Econ. 42, 90–103. doi:10.1016/j.jhealeco.2015.02.004
Tao, Y., Zhang, Z., Ou, W., Guo, J., and Pueppke, S. G. (2020). How does urban form influence PM2.5 concentrations: insights from 350 different-sized cities in the rapidly urbanizing Yangtze River Delta region of China, 1998–2015. Cities 98, 102581. doi:10.1016/j.cities.2019.102581
Vuong, Q. H., and Nguyen, M. H. (2024). Better economics for the Earth: a lesson from quantum and information theories. Hanoi: AISDL.
Yang, Q., Xu, Y., Chakraborty, T. C., Du, M., Hu, T., Zhang, L., et al. (2024). A global urban heat island intensity dataset: generation, comparison, and analysis. Remote Sens. Environ. 312, 114343. doi:10.1016/j.rse.2024.114343
Keywords: urban geometric form, compactness, spatial development mode, PM2.5 concentration, China
Citation: Liang C, Zhao J, Li J and Zhang R (2025) Impact of urban spatial compactness on air pollution in China. Front. Environ. Sci. 13:1491070. doi: 10.3389/fenvs.2025.1491070
Received: 04 September 2024; Accepted: 15 January 2025;
Published: 28 April 2025.
Edited by:
Reginald Quansah, University of Ghana, GhanaReviewed by:
Minh-Hoang Nguyen, Phenikaa University, VietnamXing Yan, Beijing Normal University, China
Copyright © 2025 Liang, Zhao, Li and Zhang. This is an open-access article distributed under the terms of the Creative Commons Attribution License (CC BY). The use, distribution or reproduction in other forums is permitted, provided the original author(s) and the copyright owner(s) are credited and that the original publication in this journal is cited, in accordance with accepted academic practice. No use, distribution or reproduction is permitted which does not comply with these terms.
*Correspondence: Rui Zhang, MjMwMjM4NzQwQHNldS5lZHUuY24=