 Ehab Hendawy1,2
 Abdel-Aziz Belal1
 Abd El Aziz S. Sheta3
 Elsayed Said Mohamed1,4
 Dmitry E. Kucher4
 Mohamed E. M. Jalhoum1
 Mohamed S. Shokr5*
 Abdelraouf M. Ali1,4Yahia A. Othman6Ayman F. Abou-Hadid7
- 1National Authority for Remote Sensing and Space Sciences, Cairo, Egypt
- 2Institute of Postgraduate Studies and Agricultural Research in Arid Regions, Ain shams University, Cairo, Egypt
- 3Soil Science Department, Faculty of Agriculture, Ain Shams University, Cairo, Egypt
- 4Department of Environmental Management, Institute of Environmental Engineering, People’s Friendship University of Russia (RUDN University), Moscow, Russia
- 5Soil and Water Department, Faculty of Agriculture, Tanta University, Tanta, Egypt
- 6Department of Horticulture and Crop Science, The University of Jordan, Amman, Jordan
- 7Horticulture Department, Faculty of Agriculture, Ain shams University, Cairo, Egypt
Introduction: Decision-makers around the world are very concerned about contaminated soil since it has a direct effect on soil and food security. This study seeks to evaluate soil contamination by a chosen heavy metal, Ni, Mn, Co, Cu, Cd, Pb, Fe, and Zn in the studied area located around the Kitchener drain in Egypt, its main source for irrigation water in the studied area and it extends 69 km and pass through Gharbia, Kafr El-Sheikh and Dakahlia Governorates, Egypt near).
Methodology: Principal component analysis (PCA), cluster analysis, contamination factor (CF) and degree of contamination (DC) indices, which Quantified the level of contamination hazard supported by GIS, were used to determine the level of soil contamination in the area under study.
Results: The spatial pattern of studied variables by kriging shows that The K-Bessel model is fitted for electrical conductivity (EC), Ni, and Cu, the exponential model is well-suited for pH, CaCO3%, and Fe in the soil, and the circular model fit for Mn. Stable model for silt, furthermore, a Gaussian model was fitted for Sand, Clay, and Cd and the hole Effect model for Co. As these models had low Mean Standardized Error (MSE) values (around zero) and Root-Mean-Square Standardized Error (RMSSE) values that were close to one. It indicates that the modals’ forecasts are roughly as precise as the baseline. The study area was divided into three zones based on the unconventional results of the integration of PCA and cluster analysis; each zone has a different heavy metal concentration and pattern. The results showed, that 0.82% of the studied area, the pollution was at a moderate level. Very high levels of heavy metal contamination were found throughout most of the area (79.24%); average concentrations of these metals were found to be 132.2+/-31.8,672.6 ± 125.4, 8.9 ± 5.1,103.8 ± 44.4, 25.5 ± 3.5,30.6 ± 10.3,223,021.4 ± 40484, and 246.5 ± 248.7 mg kg−1 for Ni, Mn, Co, Cu, Cd, Pb, Fe, and Zn, respectively. On the other hand, 19.92% of the studied area is contaminated considerably. There are various sources of contamination; such as household goods and industrial trash, including those from the textile, paint, sewage, and leather tanning industries; agricultural wastes, particularly those that contain pesticides and superphosphate fertilisers; and sewage sludge.
Conclusion: Overall mapping soil contamination could help decision-makers create suitable heavy metal mitigation strategies. To lessen human harmful behaviors that create environmental contamination, the study suggests enacting farm management legislation. Future research will also concentrate on strategies for controlling and lessening the consequences of soil pollution.
1 Introduction
Ecological ecosystems depend potentially on the soil for their existence and proper functioning (Hu et al., 2013; Dogra et al., 2020). But industrialization, widespread use of pesticides and fertilizers, and fast urbanization all contribute to soil health reduction (Kumar et al., 2019a; Kumar et al., 2019b; Dogra et al., 2020). Through surface precipitation, ion exchange, and surface complexation, soil serves as a storage tank for heavy metals (Yong et al., 1992). Since elements are persistently harmful when thresholds are crossed and become one of the main environmental issues, they have drawn particular attention among pollutants. These element ions persist in the environment and are not biodegradable (Wang and Chen, 2009). As a result, the ecological problem of sediments and elemental soil pollution has drawn more attention in recent decades from both developed and developing nations worldwide (Zhang et al., 2007). Worldwide, agricultural soil pollution by heavy metals is a serious concern. Heavy metals can enter crops through the roots and cause biomagnification in the various plant tissues, including the roots, stems, and leaves. These metals enter the systems of animals and humans from plants (Bhatti, et al., 2018).There are 5 million locations worldwide where heavy metals or metalloids have contaminated soil at concentrations higher than acceptable thresholds (Li et al., 2019). Increasing levels of soil contamination soils have reduced soil fertility and quality in the last 2 decades (Baroudy et al., 2020). The middle Nile Delta is limited by two main branches: the Damietta branch (240 km long) and the Rosetta branch (235 km long). The Nile Delta region is the most crowded area of the country, and it is home to around 40% of the country’s industrial output (Stanley and Warne, 1998; Negm et al., 2017). The main drainage water pump stations in the middle Nile Delta are Nashart drain, Gharbia drain, Drain No. l, Tala drain, Sabal drain, Drain No. l1, Drain no.7, and Bahr Tira drain. The main purpose of the Kitchener drain, also called the Gharbia drain, was to gather and move water from surface and underground drains in agricultural environments. Agriculture provides almost 75% of the water in the Kitchener drain, contaminating both the drain and its branches (Khalifa et al., 2017). Along with agricultural wastewater, the Kitchener drain also consumed municipal wastewater from nearby cities and villages (2%), as well as industrial wastewater (23%), which is released from industrial cities.
The health of the soil in the Nile Delta region of Egypt is declining due to the growing number of enterprises and their emissions, urbanization, increased congestion, and the utilization of sewage and waste sediments (Khatita, 2011). Although the Nile Delta covers only 20,000 km2, it accounts for 46% of Egypt’s total agricultural area, which is 55,040 km2 (Fanos, 2001; Zeydan, 2005). Because of the ideal soil quality and the presence of irrigation infrastructure, 63% of the Nile Delta is devoted to agriculture (Dawoud, 2004). Wastewater is necessary for irrigation operations in the Nile Delta. To irrigate the studied region, agricultural and industrial drainage effluent from the El Gharbia main drain (Kitchenr), Egypt, was combined with Nile water. Nonetheless, a variety of crops used for food, feed, and fodder—referred to as hyperaccumulators—are capable of absorbing excess heavy metals and translocation them in their aerial portions and have a high resilience to metal stress (Abuzaid et al., 2019; Chen et al., 2022). As a result, there are serious health dangers when metals that have accumulated in soils are concentrated in animal and human organs via the food chain (Song et al., 2022). Therefore, it is imperative to conduct a thorough evaluation of soil pollution to create an effective remediation plan and mitigate adverse effects (Yang et al., 2020) Analyzing the spatial distribution of potentially toxic metals concentration is the starting point for enhancing the assessment of soil pollution (Hammam et al., 2022). Geostatistical analysis is a method for analyzing spatial data and then forecasting the location of unsampled data (Hammam et al., 2022). One method for evaluating geographical data and then estimating the site from the uncollected data is geostatistical analysis. Numerous geostatistical analysis methods, like Inverse Distance Weighting (IDW) and Kriging. High precision can be achieved in calculating the unsampled values using the Kriging semivariogram models. Their computation relies on determining the distances between samples. The models compute the correlations between the elements and the data parameter’s range, nugget, and sill values (Webster and Oliver, 2007). In research about the evaluation of natural resources, the PCA has also been utilized as a multi-indicator weighting approach (Andrews et al., 2002; Sutadian et al., 2017; Abuzaid and Jahin, 2022). One of the primary restrictions, nevertheless, is the number of instances examined, as the PCA necessitates at least 150–300 cases (Jahin et al., 2020; Abuzaid and Jahin, 2022). The Analytical Hierarchal Process (AHP) is the right method for employing fewer cases (Sutadian et al., 2017). The AHP is a theory of measurement that assigns a priority number on a scale of 1–9 through pairwise comparisons (Saaty, 2008). As a result, as noted for the Tigris Basin (Budak et al., 2018), using PCA to reduce data complexity in conjunction with the AHP weighting procedure can result in a better evaluation. Soil ecological risk is estimated using the index approach, quotient technique, fuzzy comprehensive assessment, geo-accumulation index, prospective ecological risk index, and pollutant load index (Ma, 2021). Analysis of principal components, or PCA, has further been applied to identify several reasons behind soil pollution, such as agricultural and industrial operations, as well as the proportion of heavy metals leading to soil contamination (Yang et al., 2017; Yang et al., 2020; El Behairy et al., 2022b; Shokr et al., 2022). The spatial distribution maps of heavy metals were successfully predicted by using semivariogram models. Additionally, the combination of PCA, HCA, and contamination indices produced unconventional results in the classification of the various studied areas in Egypt (near the northwest Nile Delta, Kafr EL Zayat, and the El-Moheet drainage) into zones, each of which has a different heavy metal concentration and pattern (El Behairy et al., 2022b; Hammam et al., 2022; Shokr et al., 2022). Moreover, numerous other researches employed a variety of soil contamination indices, namely the degree of contamination and contamination factors. (Elgharably et al., 2014; Kumar et al., 2019c; Abo Shelbaya et al., 2021; Alzahrani et al., 2024).
The objective of the current work is to determine heavy metal (Ni, Mn, Co, Cu, Cd, Pb, Fe, and Zn) of soil through spatial mapping, defining the degrees of contamination using PCA, and estimating the degree of contamination around Kitchener drain which is the largest drainage systems in the Nile delta, Egypt.
2 Materials and methods
2.1 Description of the research area
The research area is occupied in the Governorate of Kafr El-Sheikh around Kitchener drain with an area of 562.45 km2 (56,245 ha). The Gharbia Main drain (Kitchener drain) is one of the largest drainage systems in the Nile Delta which is located in the central part of Middle Nile Delta. It extends about 69 km2 starting at El-Gharbia governorate and stretches northward through Kafr El-Sheikh Governorate to the Mediterranean Sea. Kitchener drain extends 60.4 km2 through the research area, The region is positioned between 31° 0′1.376″to 31° 13′44″.618 E Longitude and 31° 4′47.090″to 31° 35′30″.654 N Latitude (Figure 1), Wastewater from three main sources pollutes the Kitchener Drain: (i) untreated or insufficiently treated domestic wastewater from several villages in the two governorates; (ii) wastewater discharged by an industrial facility; and (iii) wastewater from an agricultural drainage system that includes pesticides and fertilizers (El-Amier et al., 2023). The terrain is mostly flat to nearly flat, with elevations ranging between 0 and 5 m higher than sea level in the northern region. The entire research area was covered with Quaternary sediments, which are often composed of alluvium deposits (Aridisol and Entisol) that were created by the Nile River’s sedimentation processes as a result of frequent floods over geologic time. The current alluvium deposits in the Nile Delta were formed from the hard rocks of the Ethiopian Highlands by a variety of weathering processes, including physical, chemical, and biological ones (Elbasiouny et al., 2019; Gad et al., 2019). Typically categorized as silty clay and clayey soil, the Nile Delta is characterized by moderately alkaline deposits that are rich in clay, and silt (Khalifa et al., 2018; Elbasiouny et al., 2019; Gad et al., 2019). The research area has hot, dry summers, warm winters, and little rainfall, all of which are characteristics of the typical Mediterranean climate (arid to semi-arid). The average temperature throughout the dry season is 22°C, with mean temperature ranging from 24°C to 31°C. The average temperature difference between summer and winter is 6°C (Climatologically Normal for Egypt, 2011). According to USDA (Soil Survey Staff, 2022), the investigated area’s soil temperature regime is classified as Thermic, and its soil moisture regime is Torric. The average annual rate of demographic growth in the Nile Delta is 21,600. Important features and prominent Land use and land cover include the coastal plain, urban and industrial commercial areas, and some sand dunes in the coastal parts.
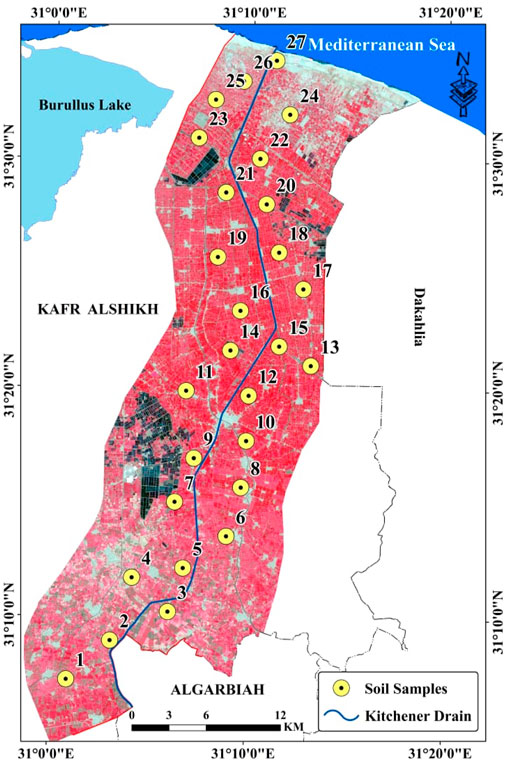
Figure 1. Location map and spatial distribution of soil samples within the study area.
2.2 Soil survey and human activities identifications
Conducting field studies and engaging with farmers through inquiries, we gathered information to discern prevalent crop patterns as well as the irrigation water supply in the research area. Predominant crops in the studied area include wheat, alfalfa, and sugar beets in the winter season; on the other hand, rice cotton and corn are the main strategic crops in the summer season. Agricultural activities primarily rely on irrigation from the Kitchener Drain and its branching waterways, as well as secondary freshwater canals. It is noteworthy that Egyptian farmers typically depend on personal experience to determine the amounts of chemical and organic fertilizers, often disregarding recommendations from relevant authorities. The agricultural system in the study area employs surface irrigation, utilizing both fresh water and wastewater. Owing to a shortage of fresh water, some farmers resort to using low-quality water for irrigation directly from the Kitchener Drain or through mixing. Twenty-seven soil samples from the surface were obtained near the Kitchener Drain for the evaluation of soil pollution levels. The geocoordinates of each location were accurately recorded using A hand-held GPS (Germin e-Trix, Nevada, KS, United States) (Figure 2).
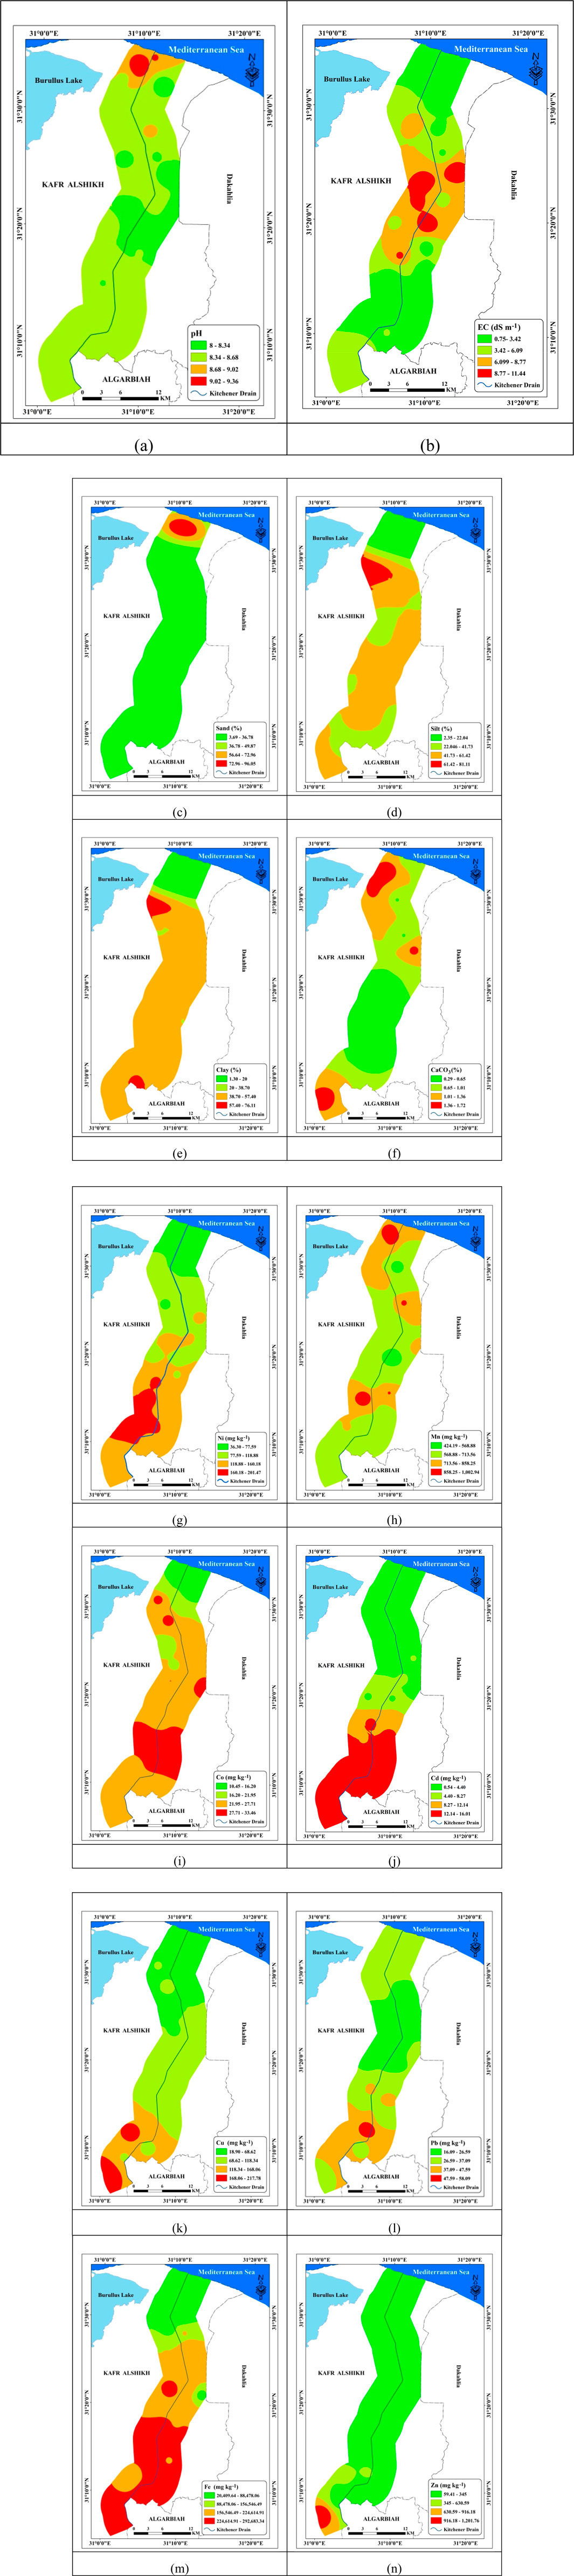
Figure 2. Studied variables interpolation maps. (A) pH, (B) EC (dS m−1), (C) sand (%), (D) silt (%), (E) clay (%), (F) CaCO3%, (G) Ni (mg kg−1), (H) Mn (mg kg−1), (I) Co (mg kg−1), (J) Cd (mg kg−1), (K) Cu (mg kg−1), (L) Pb (mg kg−1), (M) Fe (mg kg−1),and (N) Zn (mg kg−1).
2.3 Laboratory analysis
Twenty-seven random soil locations were taken with a plastic hand trowel adjacent Kitchener Drain (Figure 1). Three replicates weighing roughly 1 kg each were collected from each site, combined into a single composite sample, stored in plastic bags, and brought to the lab. The samples were air-dried, ground down to pass through a 2-mm sieve, and stored afterward in plastic bags around 4°C until further analyses. The Bouyoucos hydrometer method, as outlined by Gee et al. (1986), was employed to ascertain the particle size distribution. Soil pH was measured in a 1:2.5 soil-to-water suspension using a pH meter (Jenway, United States). For soil electrical conductivity (ECe), measurements were conducted on soil paste extracts utilizing an EC meter (Jenway, United States). The total forms of heavy metals (As, Cd, Cr, Fe, Pb, and Zn) were extracted using USEPA technique 3,052: microwave-assisted acid digestion utilizing concentrated HNO3, HF, and HCl, as recommended by the (Schumacher, 2002).In a 100-mL Teflon microwave digestion vessel, a 0.50 g soil sample was combined with 5.0 mL HNO3 (16 M), 2 mL HCl (12 M), and 1 mL HF (29 M). The vessels were then placed in a microwave digestion system (Mars-X, HP-500 plus, CEM Corporation) and heated to 180°C until digestion was complete. After allowing the digests to cool, they were put into 50 mL volumetric flasks, filled with deionized water, and stored until analysis. Inductively coupled plasma mass spectrometry (Thermo ICP-MS model.
iCAP-RQ, United States) was used to determine the elements. Limits of quantification (LOQs), limits of detection (LODs), and linearity were all evaluated for the ICP-MS instrument at NARSS. Each metal’s correlation coefficient (R2) between concentrations and the detector signal was determined through linear regression analysis. Supplementary Table S1 displays each element’s LOQs and LODs. NARSS Laboratory employed a standard analytical batch that included Certified Reference Material (CRM) to ensure data accuracy before release and a reagent blank to measure the background.
2.4 Evaluation of soil contaminant
The contamination factor (CF) of each of the heavy metals under study was determined by dividing the total concentration of each measured heavy metal by the background value, which is the chemical composition of the upper continental crust, by Taylor and McLennan (1995) (Equation 1).
Where:
Hakanson’s classification scheme (Hakanson, 1980), was employed to categorize CF into four levels Supplementary Table S2. Additionally, the Degree of Contamination (DC), as defined by Hakanson, was calculated as the sum of CF for each sample (Equation 2). The levels of contamination were then categorized based on the calculated DC values (Supplementary Table S3).
Where:
2.5 Mapping of land use and land cover (LULC)
Land use and Land cover (LULC) discrimination and recognition is a very important application of Remote Sensing. In the last few years, Machine learning classification techniques have been emerging for crop classification. Google Earth Engine (GEE) is a cloud-based platform to explore multiple satellite data with different advanced classification techniques (Xu et al., 2018; Neetu et al., 2019; Clemente et al., 2020; Xue et al., 2023) Clemente et al., 2020, Xue et al., 2023). Random Forest (RF) technique and High-Resolution optical data, Sentinel-2, (10 m) were used for crop classification (Akbari et al., 2020; Tariq et al., 2023) 2,200 ground truth data were collected to establish the model’s accuracy, 70% of these points were allocated for model calibration, allowing for the fine-tuning of parameters and features. The remaining 30% were reserved for model validation; the calibration-validation split enhances the model’s reliability, ensuring that it can accurately generalize its findings beyond the calibration dataset. This methodology contributes to a more accurate and dependable discrimination of crop patterns, valuable for agricultural monitoring, planning, and management.
2.6 Mapping soil properties and heavy metals
Utilizing the Kriging interpolation method on ArcGIS software 10.8, we conducted spatial distribution mapping of various soil parameters, including ECe, pH, and chosen heavy metals (Ni, Mn, Co, Cu, Cd, Pb, Fe, and Zn). The Kriging spatial interpolation technique, as outlined by Isaaks and Srivastava (1989) was employed as part of geostatistical analyses. To predict the unmeasured values of soil heavy metals, we selected an appropriate model from the semivariogram models, considering their accuracy. Model strength was assessed using three parameters: nugget, sill, and range, by the approach outlined by Cambardella et al. (1994). The precision of diverse models was assessed by considering mean standardized error (MSE), and root-mean-square standardized error (RMSSE), following the methodology outlined by Johnston et al. (2001). In this evaluation, the models were deemed more accurate when MSE values approached zero and RMSSE values were closer to one, and conversely, less accurate when MSE deviated from zero and RMSSE diverged from one (Gundogdu and Guney, 2007).
2.7 Statistical process and principal components analysis
Statistical analyses throughout this study were performed using the 2021 version of the XLSTAT add-in for Excel, ensuring accuracy and reliability. Principal Component Analysis (PCA) proves advantageous in simplifying the dataset into principal components, or factors, thereby simplifying the interpretation of variance differences among various variables. For PCA implementation, XLSTAT v2021 was utilized to reduce the chosen variables in the current research to a new dimension with the application of orthogonal transformation, effectively capturing the majority of the variance. PCA produces several Principal Components (PCs) equal to the number of variables, and the selection of PCs is determined by eigenvalues (Massart et al., 1998). The resulting PCs provide estimations of relationships, which are assessed through factor loading. To delve into the behavior, origins, and sources of heavy metals, Hierarchical Cluster Analysis (HCA) was employed. This analysis aids in comprehending the correlations existing between different heavy metals (Abdel-Fattah et al., 2021).
3 Results and discussion
3.1 Soil characteristics and heavy metal content in the study area
The soil texture in the study region consists of clay, silty clay, and sand (Table 1; Figure 2. Quantitative data on soil pH, and EC, are provided in Table 1; Figure 3. Soil pH ranged between 8.01 and 9.00 with an average of 8.12 ± 0.14. A pH of more than 7 indicates that the soil is strongly alkaline, and high quantities of alkali (Na+ and K+) and alkaline-earth cations (Ca2+ and Mg2+) dominate, (Brady et al., 2008). Since alkaline soils make up more than 25% of the world’s land, they are frequently found in semiarid and arid locations. According to López-Bucio et al. (2000), these soils typically feature significant amounts of calcium carbonate, good drainage, and porosity. High quantities of dissolved calcium in the soil solution of alkaline soils cause the development of insoluble calcium phosphate compounds, which decrease the solubility of phosphorus (Robinson and Syers, 1991; López-Bucio et al., 2000). Soil electrical conductivity (ECe) varied from 0.75 to 11.45dSm−1, with an average of 4.66 ± 3.50 dS/m. Although many crops show yield losses at lower ECe, most crops show a reduced production rate at 4 dS m−1 ECe (Shrivastava and Kumar, 2015). An estimated 33% of irrigated fields and 20% of all farmed land worldwide have been affected by high salinity (Negacz et al., 2022). Furthermore, several variables, such as inadequate precipitation, high surface evaporation along with irrigation using saltwater, and subpar cultivation methods, can be blamed for the 10% annual expansion of salinized fields (Nachshon, 2018). Forecasts indicate that by 2050, the percentage of arable land worldwide affected by salinization is expected to exceed 50% (Butcher et al., 2016),. This is consistent with the Nile Delta’s overall pattern, where the majority of the soil is distinguished by high soil salinity (Abdel-Fattah et al., 2020; Hammam et al., 2020; El Behairy et al., 2022a; Shokr et al., 2022). CaCO3% ranged from 0.1% to 2.20%.
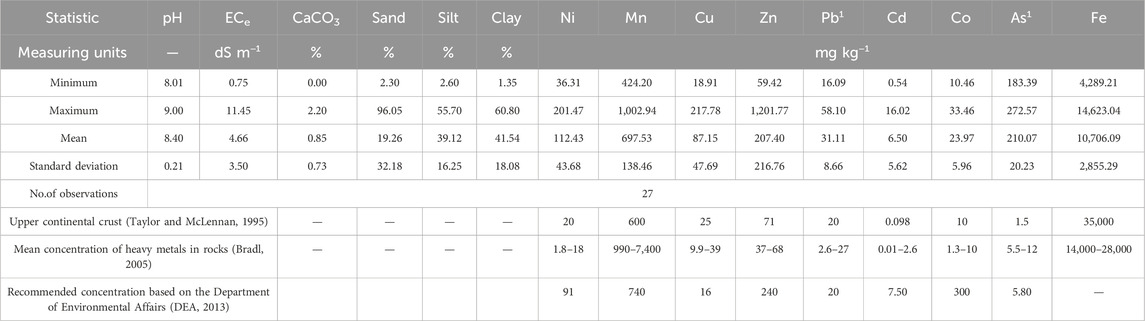
Table 1. Statistics of studied variables in the study area.
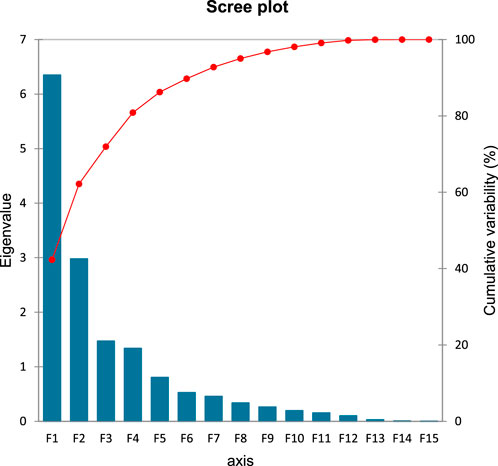
Figure 3. Scree plot of different PCs.
Descriptive statistics for the total concentrations of the studied Ni, Mn, Cu, Zn, Pb, Cd, Co, and Fe are detailed in Table 1. The Ni total concentration ranged between 36.31 and 201.47 with a mean of 112.43 ± 43.68 mg kg−1. Mn concentration varied from 424.20 to 1,002.94 with an average of 697.53 ± 138.46 mg kg−1. The range of total Cu concentration was between 18.91 and 217.78 with an average of 87.15 ± 47.69 mg kg−1. The total content of Zn has an average value of 207.40 ± 216.76 mg kg−1. Cur is essential for plant nutrition; however, high concentrations can decrease plant productivity. According to Forstiner and Wittman (1983), Alloway (2012), Zn is a heavy metal that is necessary for life. It functions biologically as a structural or catalytic component of several enzymes involved in energy metabolism, transcription, and translation. While some natural processes contribute to the influx of Zn into the air, water, and soil, human activity is the primary cause. Total concentrations of Pb were 16.09–58.10 (31.11 ± 8.66) mg kg−1. The Earth’s crust contains trace amounts of Pb, a bluish-gray metal that occurs naturally. Human activities such as mining, manufacturing, and the burning of fossil fuels are mostly responsible for environmental lead pollution (Nazzal et al., 2013). Total Cadmium concentration 0.54–16.02 (6.50 ± 5.62) mg kg−1. Cadmium pollution is connected to the heavy use of phosphate fertilizers, pesticides, and wastewater sludge (Wuana and Okieimen, 2011). As mentioned in Khan et al. (2021), the extensive use of phosphate fertilizers, herbicides, and sewage sludge has been connected to soil contamination with cadmium (Cd). The Co total concentration is 10.46–33.46 (23.97 ± 5.96) mg kg−1. Because cobalt plays an essential role in promoting the growth of leguminous crops, it is significant for plant nutrition when it is present in the soil in low quantities (Hammam et al., 2022). Total concentration of Iron as microelement was 4,289.21–14,623.04 (10,706.09 ± 2,855.29) mg kg−1, (Figure 2). The average concentrations of Ni, Cu, and Pb were higher than what the Department of Environmental Affairs (DEA, 2013) suggested, but the remaining elements were lower (Table 1). The means of all the heavy metals under study were greater than the chemical composition of the upper continental crust as determined by Taylor and McLennan (1995) and the natural concentration of heavy metals in rocks as determined by Bradl (2005) except for Mn. The average levels of all examined heavy metals surpassed those typically found in the upper continental crust, as indicated by Taylor and McLennan (1995) and the naturally occurring heavy metal concentrations in rocks, based on Bradl (2005) except for Mn. Anthropogenic sources like sewage sludge and other wastes used as soil conditioners, agricultural fertilizers, especially phosphates, atmospheric deposition, and inorganic fertilizers are the main sources of Ni, and Co, pollution in soils (Abowaly et al., 2021) Other sources include the metal plating, fossil fuel combustion, Ni mining, and electroplating industries (Senesil et al., 1999; Nicholson et al., 2003; Parth et al., 2011). The current study shows the highest mean concentration of Ni (122.43 mg kg−1) and the lowest concentration of Mn (697.53 mg kg−1) when compared to the prior studies' mean values in the Nile Delta, Egypt. The mean concentration of Cu (87.15 mg kg−1) is lower than the mean concentration recorded by Abuzaid et al. (2023) (311.22 mg kg−1), and higher than the mean concentration measured by Khatita (2011), El Behairy et al. (2022b), and El-Amier et al. (2023) (61.80, 37.80, and 58.77 mg kg−1, respectively) (Table 2). Our study’s mean concentrations of Pb and Cd (31.11 and 6.50 mg kg−1, respectively) are lower than those of all previous investigations, except Khatita (2011) and Abuzaid et al. (2023) (30.70, 2.27 mg kg−1) However, the current study’s mean concentration of Fe is lower than that of all earlier investigations. The mean concentration of Co is lower than the measured values of Co by Khatita (2011), and El-Amier et al. (2023), and higher than the measured values of Co by El Behairy et al. (2022a), Abuzaid et al. (2023) (Table 2).
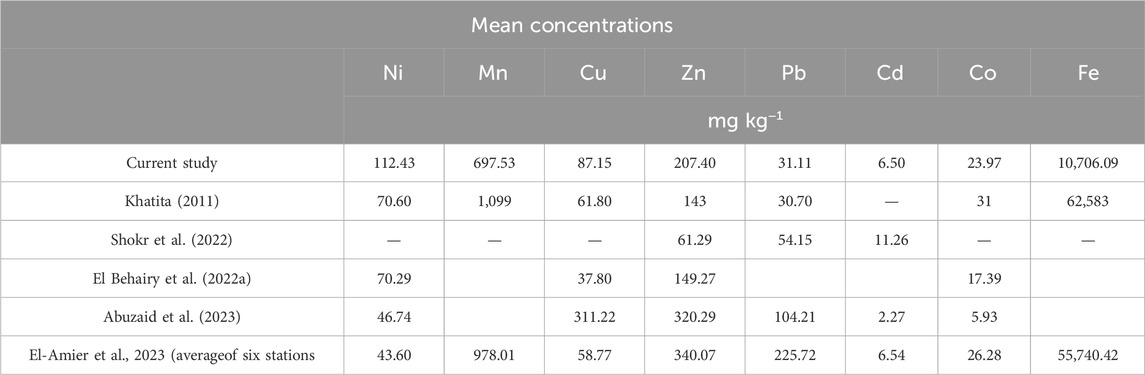
Table 2. Comparison between mean concentration of heavy metals in current study and other pervious studied in the Nile delta.
3.2 Geostatistical analysis and spatial mapping
The semi-variogram modeling parameters are listed in Table 3. The results showed the accuracy parameter of the optimal model fit in the semi-variogram analysis for the variable RMSSE. The results demonstrated that the Exponential model exhibited a high degree fit for soil pH, CaCO3%, and Fe, the k-Bessel model was well-suited for Ni and Cu, the J-Bessel model was fit for ECe, Circular model was fit for Mn. The Gaussian model was fit for sand and clay. The stable model was suitable for silt. Furthermore, the Hole Effect model was fit for Co and Gaussian model fit for Cd. The RMSSE values were close to one of all resulting models they had low MSE values (close to zero) (Abuzaid et al., 2023). The results from the semi-variogram analysis demonstrated that the nugget values of pH, EC, Ni, Mn, Co, Cu, Cd, Pb, Fe, and Zn ranged between 0.01 and 0.49 for all models. The nugget/sill ratio across all model parameters varied between 0.03 and 0.0.42. The ratio of nugget (C0) to sickle (C0 + C) determines the spatial dependency (SPD); values below 0.25, between 0.25 and 0.75, and above 0.75, respectively, denote strong, moderate, and weak SPDs (Dad et al., 2021). The results showed that spatial dependence (SDC) varied between moderate and strong predictions. These findings show that the measured and expected concentrations of the studied metals have strong relationships (Abuzaid et al., 2023).
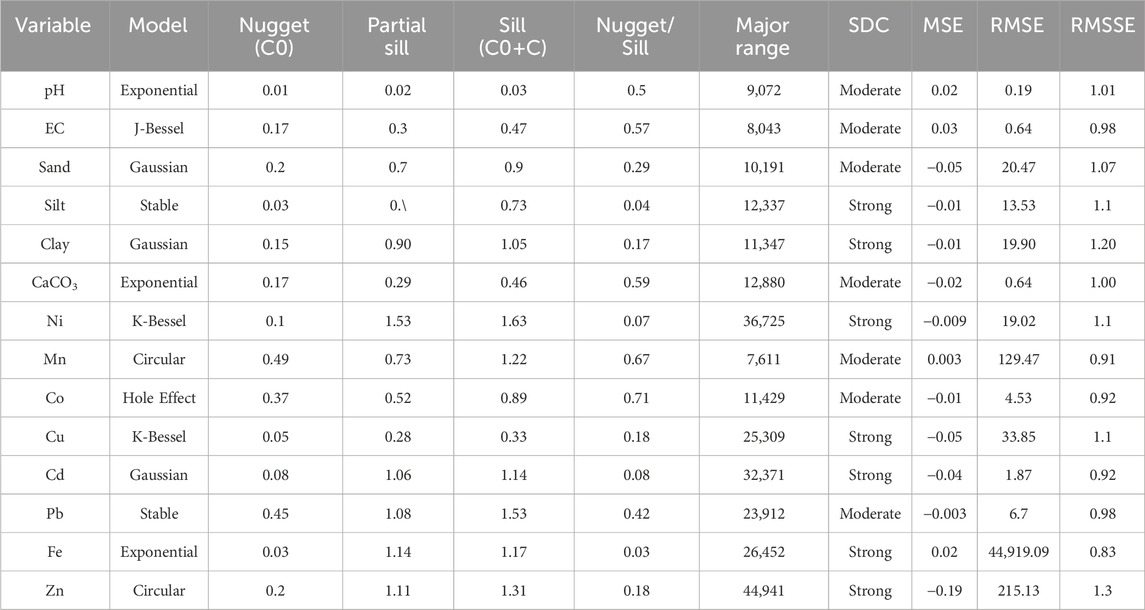
Table 3. Parameters for semi-variogram in spatial data modeling.
3.3 Multivariate analysis
Only the top four PCs with eigenvalues greater than 1.0 were taken into account for the analysis, according to the PCA results, which are displayed in Tables 4, 5. They provided an explanation for 80.87% of the variance in the entire data, with PC1, PC2, PC3, and PC4 accounting for 42.32, 19.85,9.80% and 8.91% of the overall variance, correspondingly. Four variables with intermediate positive loadings (0.74–0.50), such as silt, clay, Co, and Cu, and two with high positive loadings (>0.75), such as Sand and Ni, dominated the PC1 (Table 7). EC and Pb were the two variables with moderate loadings in the PC2. Mn and CaCO3 have a positive loading in the PC3. Zn was present in the PC4 with positive loadings (Table 5). Table 6 displays Pearson’s correlation matrix for the dataset containing all soil sample counts (n = 27). Heavy metals showed substantial (p < 0.05) and extremely significant (p < 0.01) associations. The examined metals had strong positive relationships with one another, except Mn (Table6). Indicating that they originate from common sources (Kumar et al., 2021). Particle size is a significant factor influencing the sediment’s ability to concentrate and hold onto heavy metals (Förstner and Wittmann, 1981). The main place for the accumulation of heavy metals is small particles rather than coarse particles because of their enormous specific surface area (Jenne et al., 1980). Therefore, there are significant negative correlations between heavy metals and sand, and positive correlations between clay and silt and heavy metals concentration (Jenne et al., 1980). There are positive correlation between pH and heavy metal concentrations because, raising the pH makes soil organic and inorganic colloids more negatively charged, which improves the soil’s ability to retain metal cations by electrostatic sorption (Rate, 2022). The metal-EC correlations imply that Co dissolved in soils to form complexes with both organic and inorganic ligands (Nieder et al., 2018) (Table 6).

Table 4. Eigenvalues, variability cumulative of different PCs.
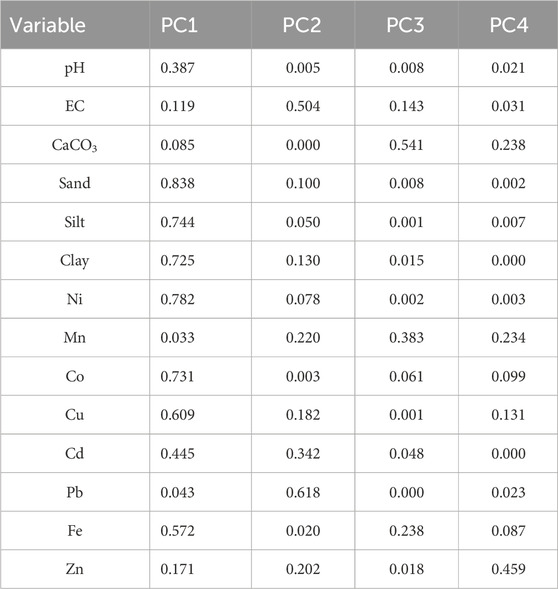
Table 5. PCA of studied variables.
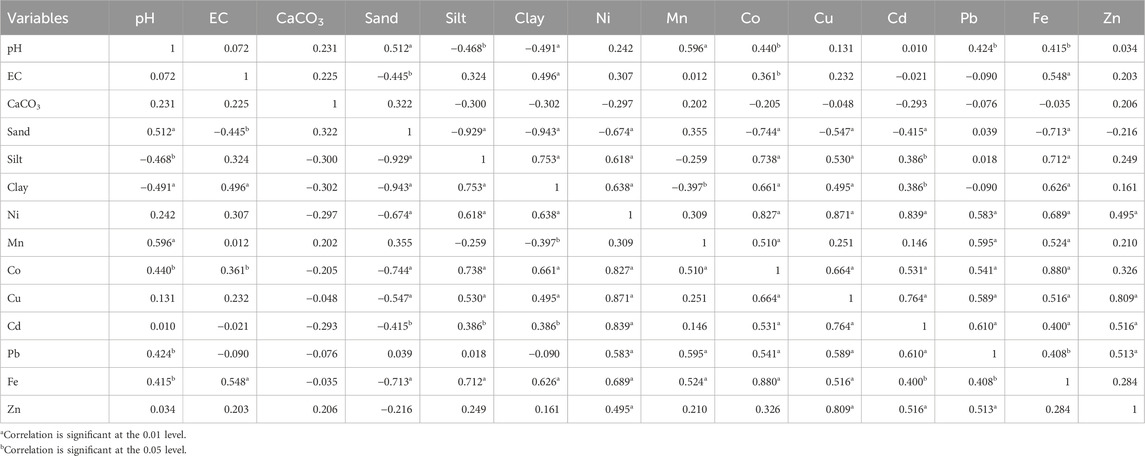
Table 6. Pearson correlation between studied soil variables and heavy metals.
In agricultural soils, PCA has been acknowledged as a potent technique for locating possible sources of metal toxicants (Abuzaid et al., 2020; Emam et al., 2022; Hammam et al., 2022). PCA was conducted after the Kaiser–Meyer–Olkin (KMO) test was employed to assess the suitability of sampling for all variables (Peres-Neto et al., 2005). Because soil samples were deemed appropriate, the KMO value of 0.53 was found to be more than 0.5 (Said et al., 2020) Supplementary Table S4. With 27 observations and 14 variables, PCA was produced. The Scree plot displays the major component or factor’s eigenvalue and cumulative variability (%) (Figure 3). Four PCs that represented potential sources and governing mechanisms were found in our investigation. PC1 may represent the impact of human activity, primarily related to agricultural practices. Ni, Co, Cu, Cd, and Fe have high relationships.Anthropogenic outputs from household products and industrial effluents, especially those from the leather tanning, paint, sewage, and textile industries in El-Mehalla El-Kobra, as well as agricultural wastes, especially those containing superphosphate fertilizers and pesticides, may be responsible for this (Boxall et al., 2000; Emam et al., 2022; El-Amier, et al., 2023). The PC2 showed a positive correlation with both Pb and EC. Urban activities such as fertilizers, pesticides, sewage sludge, industrial effluents, and automobile exhaust and batteries may be to blame for this (El-Amier, et al., 2023). Due to fertilizer release from agriculture and sewage discharge from multiple villages along the drains, the PC3 is associated with Mn concentration (Arslan Topal et al., 2022). Sewage effluents and the electroplating industry may be sources of zinc in PC4. These sources of contamination were concentrated in the middle Nile Delta, Egypt. The results of El-Amier et al. (2020), and El-Alfy et al. (2020) lend credence to this investigation.
The scoring plot and the loadings plot are rescaled to overlay on a single plot in the principal component analysis biplot of D1 (39.35%), and D2 (21.63%), as shown in (Figure 4). The cosine of the angle formed by the arrows connecting each pair of variables determines the correlation between them in the biplot, where the variables are represented as arrows. A greater correlation exists between variables when the angle between each pair of arrows is smaller (Smith et al., 2002). Yet, there was a positive correlation (Hernández Suárez et al., 2016) since all the variables were connected at an angle of less than 90°. The dendrogram in Figure 5 demonstrates how the three clusters differ from each other; each cluster possesses unique characteristics. The first cluster displayed 9 observations, the second had 14 observations, and the third had 4 observations, with varying ranges, means, and standard deviations (SD) of every variable, according to descriptive data presented in Table 7. These three groups were taken out of the PCA-obtained factors (PC1, PC2, PC3, and PC4). According to the results, there were notable variations between C1 and C2 in pH, EC, Co, Cu, and Cd. Additionally, there were notable variations between C2 and C3 on pH, EC, Ni, Cu, and Fe. Furthermore, there were notable variations between C1 and C3 on sand, pH, Ni, and Cu. The mean heavy metal concentrations in cluster 1 are higher than those in cluster 2 except for Co, and Cd (Table 4). Clustering analysis was applied to data derived from soils contaminated by heavy metals in Egypt’s northwest and middle Nile Delta (El Behairy et al., 2022b; Shokr et al., 2022). The cluster 1 samples are situated close to the textile factories at El-Mehalla El-Kobra, to the south of the research region. Therefore, contamination in this area may be caused by anthropogenic outputs from domestic goods and industrial effluents, particularly those from paint, sewage, leather tanning, and agricultural wastes, particularly those containing superphosphate fertilizers and pesticides. While, sewage discharge from several settlements along the drains and fertilizer release from agriculture were the primary sources of contamination for cluster 2 samples which located in the middle of the study area. The cluster 3 samples in the north of the research region had relatively low concentrations of heavy metals because of their coarse texture, which allows pollutants to swiftly penetrate deeper soil layers and perhaps reach groundwater due to high permeability.
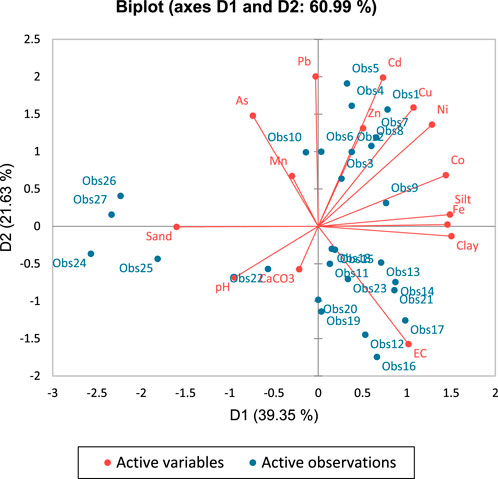
Figure 4. Biplot of PCs.
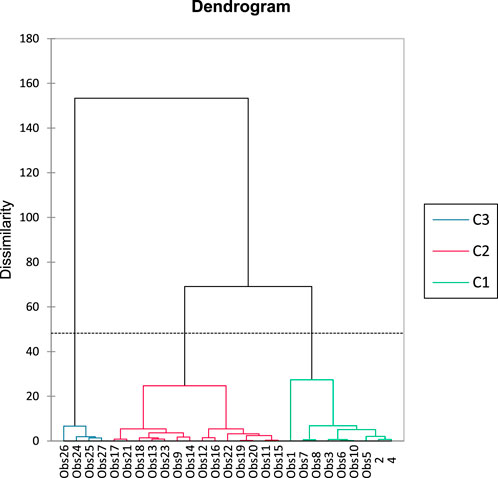
Figure 5. Dendrogram extracted from PCA in the investigated area.
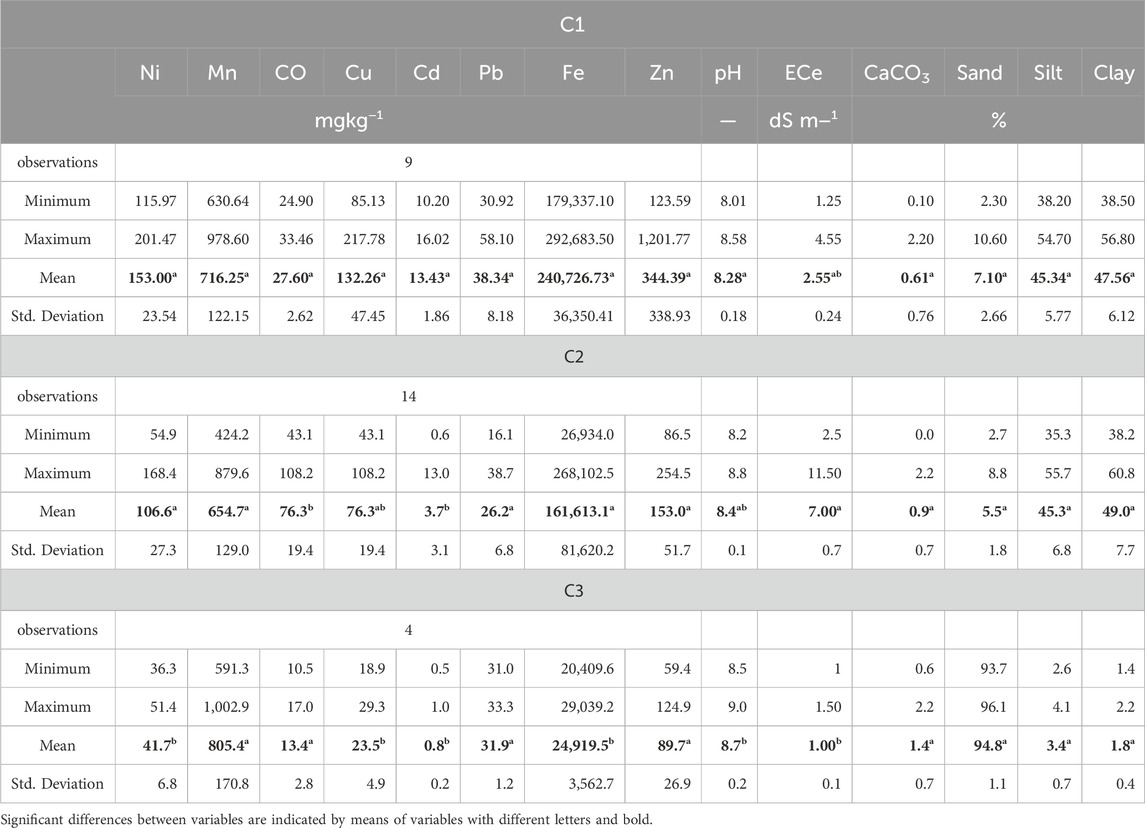
Table 7. Characteristic statistics of the variables under investigation for clusters.
3.4 Land use and land cover for the investigated area.
The research area’s land use surrounding the Kitchener drain in Kafr El-Sheikh Governorate is seen in Figure 6. Seven classes were observed: fish farms, sabkha, sand dunes, hills, irrigated crops, and irrigated horticultural crops. The dominating classifications are irrigated crops, making up approximately 83% of the entire area, including urban areas, which include industrial zones, and residential sectors, which make up approximately 7% of the examined area. Since there is a shortage of pure irrigation water, some farmers utilize kitchener drain water to irrigate their crops, which is why it is regarded as a source of pollution (Abowaly et al., 2021).
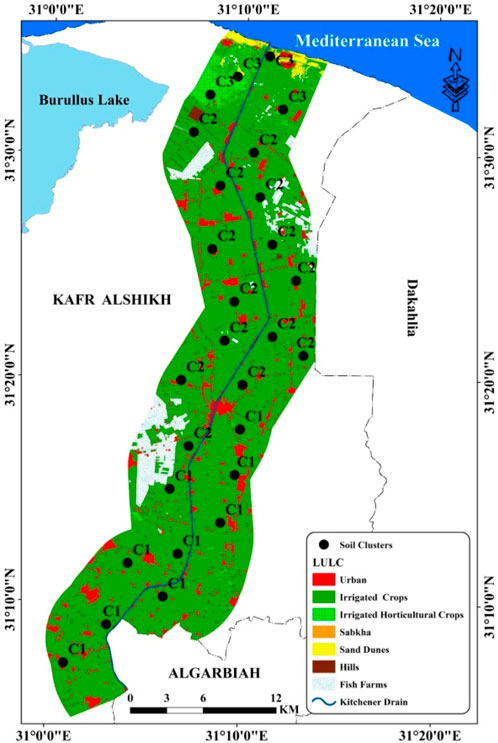
Figure 6. Land use and land cover in the investigated area.
3.5 Contamination factor (CF) for different clusters
The variation in CF between the three clusters may be explained by the disparity between farmers in the irrigation process from drain water, different LULC, in addition to mineral fertilization in different clusters. According to the findings of Ni, 88.89% of the soil samples had high contamination and 11.11% of the samples had considerable contamination in cluster 1(C1) (Hakanson, 1980) cluster 2(C2) was defined by 7.14% moderate contamination, 64.29% considerable contamination, and 28.57% high contamination, whereas cluster 3(C3) indicated moderate contamination. The Mn contamination factor showed that C1 is moderately contaminated; cluster 2 is characterized by low and moderate contamination, respectively, of 42.86% and 57.14%; cluster 3 is characterized by low and moderate contamination, respectively, of 25% and 75%. About Co, C1 displayed two distinct levels of contamination: moderate and considerable, with corresponding percentages of 88.89% and 11.11%, respectively; C2 displayed similar levels of contamination, with corresponding percentages of 85.71% and 14.29%, respectively; additionally, C3 displayed a moderate contamination class. Cu contamination was found at considerable and high levels in C1, whereas moderate and considerable classes were found in C2. Moreover, C3 showed low and moderate contamination classes. C3 recorded two classifications of contamination: considerable (25%) and high (75%), while C1 and C2 displayed high levels of Cd contamination. Human impact and the use of fertilizers within the research region may be the cause of the increase in Cd levels in both clusters (Rashed 2010). C1 and C3 showed a moderate Pb contamination level. About 14.29% of Cluster 2’s samples showed moderate Pb contamination, while 85.71% showed considerable Pb contamination. The findings demonstrated that, whereas cluster 3 had comparatively low contamination, C1 and C2 had considerable and high contamination as shown by the CF of Fe. C1 displayed three distinct Zn contamination levels: moderate, considerable, and high, corresponding to relative percentages of 55.56, 33.33, and 11.11%. Concerning the percentage of, C2 displayed two distinct contamination levels: moderate and considerable, at 57.71% and 14.29%, respectively. C3 displayed low to moderate levels of contamination (Figure 7).
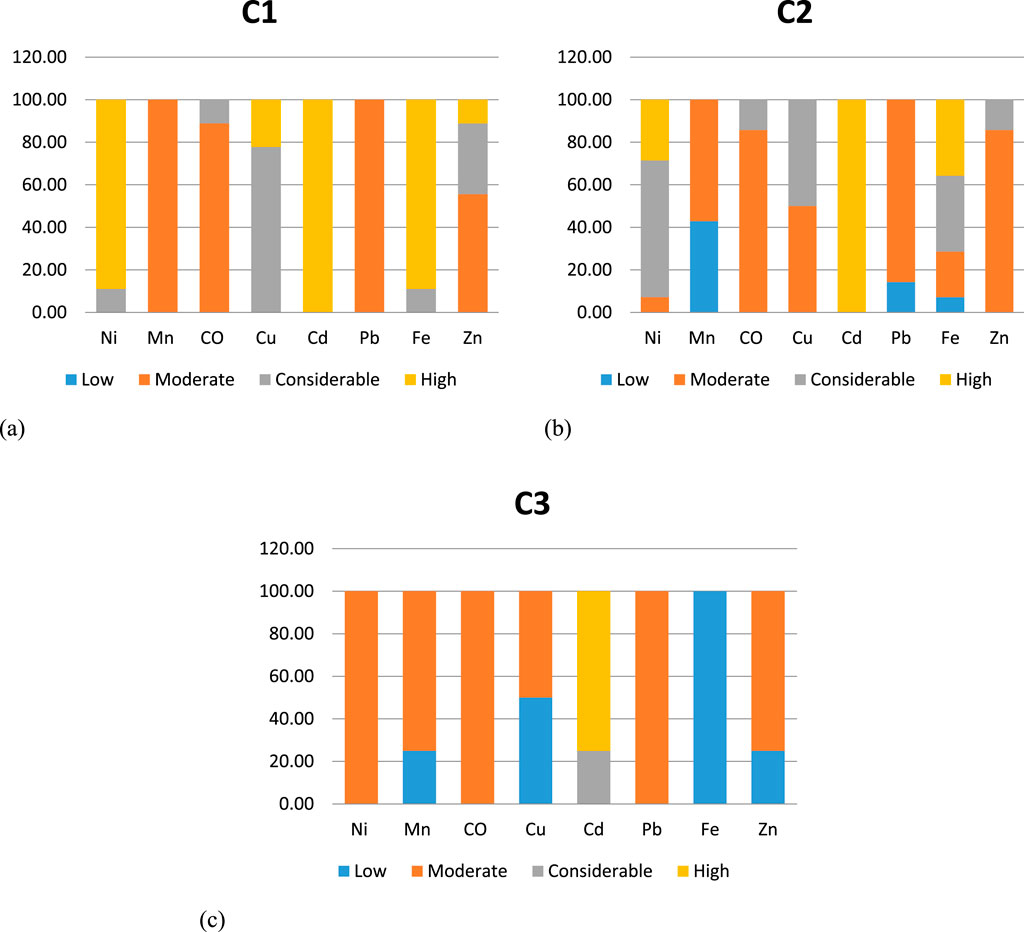
Figure 7. CF of different clusters (C1, C2 and C3). (A) CF of C1, (B) CF of C2, and (C) CF of C3.
3.6 Degree of contamination (DC) for the studied area
Many other researchers used various soil contamination indices, particularly contamination factor and degree of contamination (Shelbaya et al., 2021; Kumar et al., 2019c; Elgharably et al., 2014; Dhaliwal et al., 2021). Three pollution levels in the research area are presented in Table 8; Figure 8. A moderate degree of contamination was found in 0.82% of the study area. The majority of the area (79.24%) was found to have very high levels of heavy metal contamination, with average concentrations of these metals being 132.2 ± 31.8,672.6 ± 125.4,8.9 ± 5.1,103.8 ± 44.4, 25.5 ± 3.5,30.6 ± 10.3,223,021.4 ± 40484, and 246.5 ± 248.7 mg kg−1 for Ni, Mn, Co, Cu, Cd, Pb, Fe, and Zn, respectively. The sources of pollution differ, with some coming from sources of irrigation water and other human activities associated with agricultural management (Abd-Elmabod et al., 2019). However, a considerable amount of contamination makes up roughly 19.92% of the entire region. These results demonstrate that soil samples in the research area have been enriched with potentially hazardous metals due to anthropogenic sources, such as industrial and agricultural practices (Shokr et al., 2022).
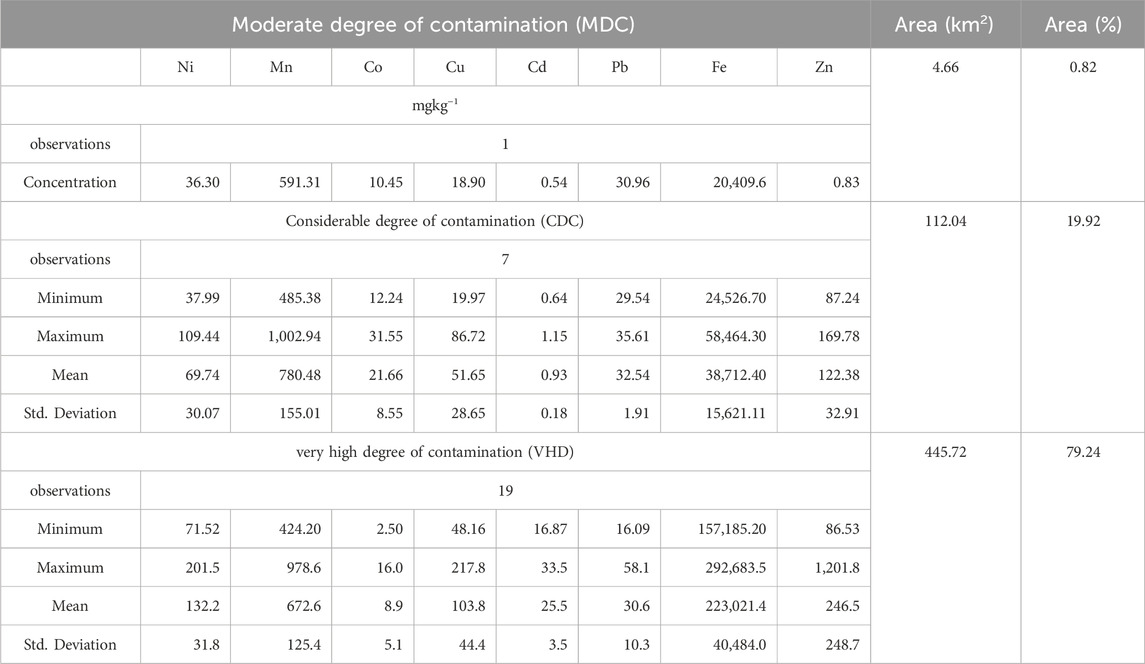
Table 8. Areas and concentrations of different contamination classes in the study area.

Figure 8. DC of investigated area.
Socio-economic impact of contamination on local populations Most exposure may be related to farming operations along Kitchener Drain; it was found that the cumulative hazard index is obtained through skin contact as opposed to ingesting or inhalation. Although Ni and Co may have the greatest effect through ingestion contact and inhalation exposure, Pb and Cr were significant contributors to exposures through ingestion and dermal contact. Exposure to elevated amounts of specific metals, including Ni, Cd, Cu, and Cr, has been linked in previous epidemiological studies to markers of cardiovascular disease (Meng et al., 2013). Furthermore, the occurrence of hyperglycemia, insulin resistance, glycaemic dysregulation, and hypertension in relation to exposure to Ni and Cd has been documented in toxicological studies (Das Gupta et al., 2009; Xu et al., 2018). In their previous study in the area under investigation (El-Amier et al., 2023),found that both ingesting and skin exposure may cause cancer in both adults and children. Additionally, children’s shorter exposure times or the type of adult activities may be the reason for their decreased carcinogenic risk compared to adults. Soil contamination can result in both direct and indirect losses. The overall drop in the cost of land as a tool and object of labour for consumers is characterised by direct losses. A decrease in agricultural crop output on contaminated soils, deteriorated product quality, and an increase in the unit cost of contaminated food due to a higher percentage of semi-fixed expenses as a result of lower crop productivity are all examples of indirect losses (Kucher et al., 2015).
4 Conclusion
This study sheds light on the analysis of soil contamination by heavy metals in the North Nile Delta, Egypt where it constitutes a major challenge for food security and sustainable development. The findings showed that GIS is a useful tool for mapping different heavy metal concentrations as, it makes it possible to identify areas that require immediate attention by allowing for a more comprehensive and in-depth analysis of the extent and severity of pollution. Better decision-making is made possible by the facilitation of data and information sharing among many stakeholders, including researchers, policymakers, and environmental authorities. Additionally, it facilitates better monitoring and management of soil pollution, enabling the early identification of probable problems and the use of appropriate corrective measures. Intriguing categorization results were also obtained from the combination of PCA and AHC, which separated the study region into three zones with different heavy metal concentrations and patterns. With average concentrations of these metals being 132.2 ± 31.8,672.6 ± 125.4, 8.9 ± 5.1,103.8 ± 44.4, 25.5 ± 3.5,30.6 ± 10.3,223,021.4 ± 40484, and 246.5 ± 248.7 mgkg−1 for Ni, Mn, Co, Cu, Cd, Pb, Fe, and Zn, respectively, it was determined that the majority of the area (79.24%) had very high levels of heavy metal contamination. The current study shows that the soils under investigation in the study area have negative effects from human activities, such as excessive use of polluted water for irrigation, pesticides, and mineral fertilizers. Crop rotation, land use diversification, and effective irrigation systems are advised to mitigate the soil contamination in the research region. Additionally, precision agriculture provides a variety of alternatives, such as lowering the amount of pesticides used or increasing the effectiveness of fertilizer and irrigation. To promote broader use of these methods, farmer-to-farmer education and educating advisors on their numerous advantages. it is advised to increase the sample size to enhance the spatial interpretation of soil contamination.
Data availability statement
The original contributions presented in the study are included in the article/Supplementary Material, further inquiries can be directed to the corresponding author.
Author contributions
EH: Conceptualization, Data curation, Formal Analysis, Methodology, Writing–original draft. Abdelaziz A-AB: Conceptualization, Supervision, Writing–original draft, Writing–review and editing. AS: Conceptualization, Supervision, Writing–original draft, Writing–review and editing. EM: Supervision, Writing–original draft. DK: Supervision, Writing–review and editing. MJ: Conceptualization, Data curation, Formal Analysis, Investigation, Methodology, Software, Writing–original draft. MS: Conceptualization, Data curation, Formal Analysis, Investigation, Methodology, Software, Writing–original draft, Writing–review and editing. AA: Conceptualization, Project administration, Supervision, Writing–original draft, Writing–review and editing. YO: Funding acquisition, Visualization, Writing–review and editing. AA-H: Conceptualization, Formal Analysis, Supervision, Writing–original draft, Writing–review and editing.
Funding
The author(s) declare that no financial support was received for the research, authorship, and/or publication of this article.
Acknowledgments
The authors would like to thank the National Authority for Remote Sensing and Space Science (NARSS) for supporting and supervising through funding the cost of the work, laboratory, GIS and remote sensing analysis. The authors would like to thank Institute of Postgraduate Studies and Agricultural Research in Arid Regions, Ain shams University, Cairo, Egypt, for supervising this work and this work was supported by the RUDN University Strategic Academic Leadership Program.
Conflict of interest
The authors declare that the research was conducted in the absence of any commercial or financial relationships that could be construed as a potential conflict of interest.
Publisher’s note
All claims expressed in this article are solely those of the authors and do not necessarily represent those of their affiliated organizations, or those of the publisher, the editors and the reviewers. Any product that may be evaluated in this article, or claim that may be made by its manufacturer, is not guaranteed or endorsed by the publisher.
Supplementary material
The Supplementary Material for this article can be found online at: https://www.frontiersin.org/articles/10.3389/fenvs.2025.1493197/full#supplementary-material
References
Abdel-Fattah, M. K., Abd-Elmabod, S. K., Aldosari, A. A., Elrys, A. S., and Mohamed, E. S. J. W. (2020). Multivariate analysis for assessing irrigation water quality: a case study of the Bahr mouise canal, eastern nile delta. East. Nile Delta 12 (9), 2537. doi:10.3390/w12092537
Abdel-Fattah, M. K., Mohamed, E. S., Wagdi, E. M., Shahin, S. A., Aldosari, A. A., Lasaponara, R., et al. (2021). Quantitative evaluation of soil quality using Principal Component Analysis: the case study of El-Fayoum depression Egypt, 13(4), 1824, doi:10.3390/su13041824
Abd-Elmabod, S. K., Mansour, H., Hussein, A., Mohamed, E., Zhang, Z., Anaya-Romero, M., et al. (2019). Influence of irrigation water quantity on the land capability classification, 2, 2253–2561.
Abo Shelbaya, M., El-Azeim, A., Menesi, A., El-Mageed, A. J. J. o.S. S., and Engineering, A. (2021). Heavy metals and microbial activity in alluvial soils affected by different land-uses. 12(3), 165–177.10.21608/jssae.2021.158670
Abowaly, M. E., Belal, A.-A. A., Abd Elkhalek, E. E., Elsayed, S., Abou Samra, R. M., Alshammari, A. S., et al. (2021). Assessment of soil pollution levels in North Nile Delta, by integrating contamination indices, GIS, and multivariate modeling, 13(14), 8027. doi:10.3390/su13148027
Abuzaid, A. S., Bassouny, M. A., Jahin, H. S., Abdelhafez, A. A. J. C. S., and Air, W. (2019). Stabilization of lead and copper in a contaminated Typic Torripsament soil using humic substances. Clean. Soil Air Water 47 (5), 1800309. doi:10.1002/clen.201800309
Abuzaid, A. S., and Bassouny, M. A. J. E. T.Innovation (2020). Total and DTPA-extractable forms of potentially toxic metals in soils of rice fields, north Nile Delta of Egypt, 18.100717
Abuzaid, A. S., Jahin, H. S., Shokr, M. S., El Baroudy, A. A., Mohamed, E. S., Rebouh, N. Y., et al. (2023). A novel regional-scale assessment of soil metal pollution in arid agroecosystems. Agron. (Basel). 13 (1), 161. doi:10.3390/agronomy13010161
Abuzaid, A. S., and Jahin, H. S. J. J. o.c.h. (2022). Combinations of multivariate statistical analysis and analytical hierarchical process for indexing surface water quality under arid conditions, J. Contam. Hydrol. 248, 104005, doi:10.1016/j.jconhyd.2022.104005
Akbari, E., Darvishi Boloorani, A., Neysani Samany, N., Hamzeh, S., Soufizadeh, S., and Pignatti, S. J. R. S. (2020). Crop mapping using random forest and particle swarm optimization based on multi-temporal Sentinel-2. Remote Sens. (Basel). 12 (9), 1449. doi:10.3390/rs12091449
Alloway, B. J. (2012). Heavy metals in soils: trace metals and metalloids in soils and their bioavailability. Springer Science and Business Media.
Alzahrani, H., El-Sorogy, A. S., Okok, A., and Shokr, M. S. J. T. (2024). GIS- and multivariate-based approaches for assessing potential environmental hazards in some areas of southwestern Saudi arabia. Saudi Arab. 12 (8), 569. doi:10.3390/toxics12080569
Andrews, S. S., Karlen, D., and Mitchell, J. J. A., ecosystems, and environment (2002). A comparison of soil quality indexing methods for vegetable production systems in Northern California. , 90(1), 25–45. doi:10.1016/s0167-8809(01)00174-8
Arslan Topal, E. I., Topal, M., and Öbek, E. (2022). Assessment of heavy metal accumulations and health risk potentials in tomatoes grown in the discharge area of a municipal wastewater treatment plant. Int. J. Environ. Health Res. 32, 393–405. doi:10.1080/09603123.2020.1762071
Baroudy, A. A. E., Ali, A. M., Mohamed, E. S., Moghanm, F. S., Shokr, M. S., Savin, I., et al. (2020). Modeling land suitability for rice crop using remote sensing and soil quality indicators: the case study of the nile delta. case study nile delta 12 (22), 9653. doi:10.3390/su12229653
Bhatti, S. S., Kumar, V., Sambyal, V., Singh, J., and Nagpal, A. K. (2018). Comparative analysis of tissue compartmentalized heavy metal uptake by common forage crop: a field experiment. Catena 160, 185–193. doi:10.1016/j.catena.2017.09.015
Boxall, A., Comber, S., Conrad, A., Howcroft, J., and Zaman, N. (2000). Inputs, monitoring and fate modelling of antifouling biocides in UK estuaries. Mar. Pollut. Bull. 40, 898–905. doi:10.1016/s0025-326x(00)00021-7
Brady, N. C., Weil, R. R., and Weil, R. R. (2008). The nature and properties of soils. Upper Saddle River, NJ: Prentice Hall.
Budak, M., Gunal, H., Celik, I., Yildiz, H., Acir, N., and Acar, M. (2018). Soil quality assesment of upper Tigris basin. Carpath. J. Earth Environ. Sci. 13, 301–316. doi:10.26471/cjees/2018/013/026
Butcher, K., Wick, A. F., DeSutter, T., Chatterjee, A., and Harmon, J. J. A. J. (2016). Soil salinity: a threat to global food security. Agron. J. 108 (6), 2189–2200. doi:10.2134/agronj2016.06.0368
Cambardella, C. A., Moorman, T. B., Novak, J., Parkin, T., Karlen, D., Turco, R., et al. (1994). Field-scale variability of soil properties in central Iowa soils. Soil Sci. Soc. Am. J. 58 (5), 1501–1511. doi:10.2136/sssaj1994.03615995005800050033x
Chen, L., Beiyuan, J., Hu, W., Zhang, Z., Duan, C., Cui, Q., et al. (2022). Phytoremediation of potentially toxic elements (PTEs) contaminated soils using alfalfa (Medicago sativa L.): a comprehensive review. A Compr. Rev. 293, 133577. doi:10.1016/j.chemosphere.2022.133577
Clemente, J., Fontanelli, G., Ovando, G., Roa, Y., Lapini, A., and Santi, E. (2020). “Google earth engine: application of algorithms for remote sensing of crops in tuscany (Italy),” in 2020 IEEE Latin American GRSS and ISPRS remote sensing conference (LAGIRS): ieee, 195–200.
Dad, J. M., and Shafiq, M. U. J. E. M.Assessment (2021). Spatial variability and delineation of management zones based on soil micronutrient status in apple orchard soils of Kashmir valley. India 193, 1–17. doi:10.1007/s10661-021-09588-9
Dawoud, M. A. J. E. m. (2004). Design of national groundwater quality monitoring network in Egypt, Environ. Monit. Assess. 96, 99–118. doi:10.1023/b:emas.0000031718.98107.eb
Das Gupta, A., Dhara, P. C., Dhundasi, S. A., and Das, K. (2009). Effect of garlic (Allium sativum) on nickel II or chromium VI induced alterations of glucose homeostasis and hepatic antioxidant status under sub-chronic exposure conditions. J. Basic Clin. Physiol. Pharmacol. 20 (1), 1–14.
DEA (2013). National environmental management, waste act, 2008; national norms andStandards for the remediation of contaminated land and soil quality in the republic of South Africa. DEA: Pretoria, South Africa: Government Gazette.36447
Dhaliwal, S. S., Setia, R. K., Bhatti, S. S., and Singh, J. (2021). Potential ecological impacts of heavy metals in sediments of industrially contaminated perennial drain of India. Bull. Environ. Contam. Toxicol. 106 (6), 949–958. doi:10.1007/s00128-021-03260-1
Dogra, N., Sharma, M., Sharma, A., Keshavarzi, A., Minakshi, , Bhardwaj, R., et al. (2020). Pollution assessment and spatial distribution of roadside agricultural soils: a case study from India. Int. J. Environ. Health Res. 30 (2), 146–159. doi:10.1080/09603123.2019.1578865
Climatologically Normal for Egypt (2011). The normal for Ghrbia Governorate station, (1960–2011). Cairo, Egypt: Ministry of civil Aviation: Meteorological Authority.
El-Alfy, M. A., El-Amier, Y. A., and El-Eraky, T. E. (2020). Land use/cover and eco-toxicity indices for identifying metal contamination in sediments of drains, Manzala Lake, Egypt. Heliyon 6, e03177. doi:10.1016/j.heliyon.2020.e03177
El-Amier, Y. A., Bonanomi, G., and Abd-ElGawad, A. M. J. S. S. (2023). Pollution risk assessment of heavy metals along kitchener drain sediment, nile delta. Nile Delta 7 (4), 85. doi:10.3390/soilsystems7040085
El-Amier, Y. A., Bonanomi, G., Al-Rowaily, S. L., and Abd-ElGawad, A. M. (2020). Ecological risk assessment of heavy metals along three main drains in nile delta and potential phytoremediation by macrophyte plants. Plants 9, 910. doi:10.3390/plants9070910
H. E. F. Elbasiouny, H. El-Ramady, T. Alshaal, N. Bakr, T. Elbana, E. Mohamedet al. (2019). “Geology,” The soils of Egypt; world soils book series (Cham, Switzerland: Springer), 93–109.
El Behairy, R. A., El Baroudy, A. A., Ibrahim, M. M., Mohamed, E. S., Kucher, D. E., and Shokr, M. S. J. L. (2022a). Assessment of soil capability and crop suitability using integrated multivariate and GIS approaches toward agricultural sustainability. Land (Basel). 11 (7), 1027. doi:10.3390/land11071027
El Behairy, R. A., El Baroudy, A. A., Ibrahim, M. M., Mohamed, E. S., Rebouh, N. Y., and Shokr, M. S. J. A. (2022b). Combination of GIS and multivariate analysis to assess the soil heavy metal contamination in some arid zones. Agron. (Basel). 12 (11), 2871. doi:10.3390/agronomy12112871
Elgharably, A., Abdel Mageed, A., and Elgharably, G. (2014). Status of heavy metals in soils of Assiut as affected by the long-term use of sewage water in crop irrigation: case study. Egypt. J. Soil Sci. 54, 289–304.
Emam, W. W., Soliman, K. M. J. S. E. R., and Assessment, R. (2022). Geospatial analysis, source identification, contamination status, ecological and health risk assessment of heavy metals in agricultural soils from Qallin city. 36(9), 2437–2459.
Fanos, A. (2001). “Background paper on the nile delta coastal zone,” in Prepared for the workshop on modified mega-deltas. Alexandria, Egypt.
Forstiner, A., and Wittman, A. J. B. H. (1983). Metal pollution in aquatic environment. Germany. (Revised).
Förstner, U., and Wittmann, G. T. W. (1981). Metal pollution in the aquatic environment. Berlin: Springer Verlag, 486.
Gad, A., Saleh, A., and Khalifa, M. J. A. J. o.G. (2019). Assessment of natural radionuclides and related occupational risk in agricultural soil, southeastern Nile Delta, Egypt. Arab. J. Geosci. 12, 188–215. doi:10.1007/s12517-019-4356-6
Gee, G. W., Bauder, J. W. J. M. o.s.a.P. P., and methods, m. (1986). Particle-size analysis, 5, 383–411.
Gundogdu, K. S., and Guney, I. J. J. o.e.s.s. (2007). Spatial analyses of groundwater levels using universal kriging, 116, 49–55.
Hakanson, L. J. W. r. (1980). An ecological risk index for aquatic pollution control.a sedimentological approach. A sedimentol. approach 14 (8), 975–1001. doi:10.1016/0043-1354(80)90143-8
Hammam, A., Mohamed, E. J. T. E. J. o.R. S., and Science, S. (2020). Mapping soil salinity in the East Nile Delta using several methodological approaches of salinity assessment. 23(2), 125–131.
Hammam, A. A., Mohamed, W. S., Sayed, S.E.-E., Kucher, D. E., and Mohamed, E. S. J. A. (2022). Assessment of soil contamination using gis and multi-variate analysis: a case study in El-Minia Governorate, Egypt. Agron. (Basel). 12 (5), 1197. doi:10.3390/agronomy12051197
Hernández Suárez, M., Molina Pérez, D., Rodríguez-Rodríguez, E. M., Díaz Romero, C., Espinosa Borreguero, F., and Galindo-Villardón, P. J. I. J. o.M. S. (2016). The compositional HJ-biplot—a new approach to identifying the links among bioactive compounds of tomatoes. Int. J. Mol. Sci. 17 (11), 1828. doi:10.3390/ijms17111828
Hu, J., Wu, F., Wu, S., Sun, X., Lin, X., Wong, M. H. J. E., et al. (2013). Phytoavailability and phytovariety codetermine the bioaccumulation risk of heavy metal from soils, focusing on Cd-contaminated vegetable farms around the Pearl River Delta, China. China 91, 18–24. doi:10.1016/j.ecoenv.2013.01.001
Jahin, H. S., Abuzaid, A. S., and Abdellatif, A. D. J. E. T.Innovation (2020). Using multivariate analysis to develop irrigation water quality index for surface water in Kafr El-Sheikh Governorate, Egypt, 17.100532
Johnston, K., Ver Hoef, J. M., Krivoruchko, K., and Lucas, N. (2001). Using ArcGIS geostatistical analyst. Esri Redl.
Jenne, E. A., Kennedy, V. C., Burchard, J. M., and Ball, J. W. (1980). Sediment collection and processing for selective extraction and for total trace element analysis. Contaminants and sediment 2, 169–191.
Khalifa, H., and Moussa, H. J. I. a.i.E. P.present, and future (2017). Soil and agriculture after the aswan high dam, 81–124.
Khalifa, M., Gad, A. J. S., and Journal, S. C. A. I. (2018). Assessment of heavy metals contamination in agricultural soil of southwestern Nile Delta. 27(7), 619–642.
Khan, S., Naushad, M., Lima, E. C., Zhang, S., Shaheen, S. M., and Rinklebe, J. J. J. o.H. M. (2021). Global soil pollution by toxic elements: current status and future perspectives on the risk assessment and remediation strategies – a review. A Rev. 417, 126039. doi:10.1016/j.jhazmat.2021.126039
Khatita, A. M. A. (2011). Assessment of soil and sediment contamination in the Middle Nile Delta area (Egypt)-Geo-Environmental study using combined sedimentological, geophysical and geochemical methods. PhD Thesis. Friedrich-Alexander-Universitaet Erlangen-Nuernberg. (Germany).
Kumar, V., Bhatti, S. S., and Nagpal, A. K. (2021). Assessment of metal (loid) contamination and genotoxic potential of agricultural soils. Archives Environ. Contam. Toxicol. 81, 272–284. doi:10.1007/s00244-021-00874-8
Kumar, V., Sharma, A., Kaur, P., Kumar, R., Keshavarzi, A., Bhardwaj, R., et al. (2019a). Assessment of soil properties from catchment areas of Ravi and Beas rivers: a review. , 3(2), 149–157. doi:10.1080/24749508.2018.1525669
Kumar, V., Sharma, A., Kaur, P., Sidhu, G. P. S., Bali, A. S., Bhardwaj, R., et al. (2019b). Pollution assessment of heavy metals in soils of India and ecological risk assessment: a state-of-the-art, Chemosphere. 216, 449–462. doi:10.1016/j.chemosphere.2018.10.066
Kumar, V., Sharma, A., Kaur, P., Sidhu, G. P. S., Bali, A. S., Bhardwaj, R., et al. (2019c). Pollution assessment of heavy metals in soils of India and ecological risk assessment: a state-of-the-art. Chemosphere 216, 449–462. doi:10.1016/j.chemosphere.2018.10.066
Li, C., Zhou, K., Qin, W., Tian, C., Qi, M., Yan, X., et al. (2019). A review on heavy metals contamination in soil: effects, sources, and remediation techniques. , 28(4), 380–394. doi:10.1080/15320383.2019.1592108
López-Bucio, J., Guevara-García, A., Ramírez-Rodríguez, V., Nieto, M., de la Fuente, J., Herrera-Estrella, L. J. D. i.p.g., et al. (2000). Agriculture for marginal lands: transgenic plants towards the third millennium, 5, 159–165.
Ma, Z. (2021). Hazard of heavy metal pollution in farmland soil and its ecological risk assessment method. IOP conference series: earth and environmental science 781, 032052. doi:10.1088/17551315/781/3/032052
Massart, D. L., Vandeginste, B. G., Buydens, L., Lewi, P., Smeyers-Verbeke, J., and Jong, S. D. (1998). Handbook of chemometrics and qualimetrics. Elsevier Science Inc.
Meng, Q., Richmond-Bryant, J., Lu, S. E., Buckley, B., Welsh, W. J., Whitsel, E., et al. (2013). Cardiovascular outcomes and the physical and chemical properties of metal ions found in particulate matter air pollution: a QICAR study. Environmental health perspectives 121 (5), 558–564.
Nachshon, U. J. W. (2018). Cropland soil salinization and associated hydrology: trends, processes and examples. , 10(8), 1030, doi:10.3390/w10081030
Nazzal, Y., Rosen, M. A., and Al-Rawabdeh, A. M. J. E. M.Assessment (2013). Assessment of metal pollution in urban road dusts from selected highways of the Greater Toronto Area in Canada, Environ. Monit. Assess. 185, 1847–1858. doi:10.1007/s10661-012-2672-3
Neetu, , Ray, S. J. T. I. A. o.t.P., Remote Sensing, , and Sciences, S. I. (2019). Exploring machine learning classification algorithms for crop classification using Sentinel 2 data, 42, 573–578.
Negacz, K., Malek, Ž., de Vos, A., and Vellinga, P. J. J. o.a.e. (2022). Saline soils worldwide: identifying the most promising areas for saline agriculture, 203.104775
Negm, A. M., Saavedra, O., and El-Adawy, A. J. T. N. D. (2017). Nile Delta biography: challenges and opportunities, 3–18.
Nicholson, F. A., Smith, S. R., Alloway, B., Carlton-Smith, C., and Chambers, B. J. S. o.t.t.e. (2003). An inventory of heavy metals inputs to agricultural soils in England and Wales. Sci. Total Environ. 311 (1-3), 205–219. doi:10.1016/s0048-9697(03)00139-6
Nieder, R., Benbi, D., and Reichl, F. (2018). “Role of potentially toxic elements in soils,” in Soil components and human health (Dordrecht, Netherlands: Springer), 375–450.
Parth, V., Murthy, N., and Saxena, P. R. J. J. o.E. r., and management (2011). Assessment of heavy metal contamination in soil around hazardous waste disposal sites in Hyderabad city (India): natural and anthropogenic implications. 2(2), 027–034.
Peres-Neto, P. R., Jackson, D. A., Somers, K. M. J. C. s., and analysis, d. (2005). How many principal components? Stopping rules for determining the number of non-trivial axes revisited. , 49(4), 974–997. doi:10.1016/j.csda.2004.06.015
Rashed, M. N. (2010). Monitoring of contaminated toxic and heavy metals, from mine tailings through age accumulation, in soil and some wild plants at Southeast Egypt. Journal of hazardous materials 178 (1-3), 739–746.
A. W. Rate (2022). “Inorganic contaminants in urban soils,” Urban soils: principles and practice (Cham, Switzerland: Springer International Publishing), 153–199.
Robinson, J., and Syers, J. J. J. o.s.s. (1991). Effects of solution calcium concentration and calcium sink size on the dissolution of Gafsa phosphate rock in soils. , 42(3), 389–397. doi:10.1111/j.1365-2389.1991.tb00417.x
Saaty, T. L. J. I. j.o.s.s. (2008). Decision making with the analytic hierarchy process. 1(1), 83–98. doi:10.1504/ijssci.2008.017590
Said, M. E. S., Ali, A. M., Borin, M., Abd-Elmabod, S. K., Aldosari, A. A., Khalil, M. M., et al. (2020). On the use of multivariate analysis and land evaluation for potential agricultural development of the northwestern coast of Egypt. Agron. (Basel). 10 (9), 1318. doi:10.3390/agronomy10091318
Senesil, G. S., Baldassarre, G., Senesi, N., and Radina, B. J. C. (1999). Trace element inputs into soils by anthropogenic activities and implications for human health. Chemosphere 39 (2), 343–377. doi:10.1016/s0045-6535(99)00115-0
Shelbaya, M. M. A., ElAzeim, M. M. A., Menesi, A. M., and ElMageed, M. M. A. (2021). Heavy metals and microbial activity in alluvial soils affected by different land uses. J. Soil Sci. Agric. Eng. 12, 165–177. doi:10.21608/jssae.2021.158670
Shokr, M. S., Abdellatif, M. A., El Behairy, R. A., Abdelhameed, H. H., El Baroudy, A. A., Mohamed, E. S., et al. (2022). Assessment of potential heavy metal contamination hazards based on GIS and multivariate analysis in some mediterranean zones. Agron. (Basel). 12 (12), 3220. doi:10.3390/agronomy12123220
Shrivastava, P., and Kumar, R. J. S. j.o.b.s. (2015). Soil salinity: a serious environmental issue and plant growth promoting bacteria as one of the tools for its alleviation. Saudi J. Biol. Sci. 22 (2), 123–131. doi:10.1016/j.sjbs.2014.12.001
Smith, A., Cullis, B., and Thompson, R. (2002). “Exploring variety-environment data using random effects AMMI models with adjustments for spatial field trend: Part 1: theory,” in Quantitative genetics, genomics and plant breeding (Wallingford UK: CABI Publishing), 323–335.
Soil Survey Staff (2022). Soil Survey Staff Keys to Soil Taxonomy. 13th edn. Washington, DC: U.S. Department of Agriculture, Natural Resources Conservation Service.
Song, P., Xu, D., Yue, J., Ma, Y., Dong, S., and Feng, J. J. S. o.t.T. E. (2022). Recent advances in soil remediation technology for heavy metal contaminated sites: a critical review. A Crit. Rev. 838, 156417. doi:10.1016/j.scitotenv.2022.156417
Stanley, D. J., and Warne, A. G. J. J. o.C. R. (1998). Nile Delta in its destruction phase, 795–825.
Sutadian, A. D., Muttil, N., Yilmaz, A. G., and Perera, B. J. E. i. (2017). Using the Analytic Hierarchy Process to identify parameter weights for developing a water quality index, 75, 220–233.
Tariq, A., Yan, J., Gagnon, A. S., Riaz Khan, M., and Mumtaz, F. J. G.-S. I. S. (2023). Mapping of cropland, cropping patterns and crop types by combining optical remote sensing images with decision tree classifier and random forest. , 26(3), 302–320. doi:10.1080/10095020.2022.2100287
Taylor, S. R., and McLennan, S. M. J. R. o.g. (1995). The geochemical evolution of the continental crust. Rev. Geophys. 33 (2), 241–265. doi:10.1029/95rg00262
Wang, J., and Chen, C. J. B. a. (2009). Biosorbents for heavy metals removal and their future. Biotechnol. Adv. 27 (2), 195–226. doi:10.1016/j.biotechadv.2008.11.002
Webster, R., and Oliver, M. A. (2007). Geostatistics for environmental scientists. John Wiley and Sons.
Wuana, R. A., and Okieimen, F. E. J. I. S. R. N. (2011). Heavy metals in contaminated soils: a review of sources. Chem. risks best available strategies Remediat. 2011 (1), 402647. doi:10.5402/2011/402647
Xu, S., Zhao, Y., Wang, M., and Shi, X. J. G. (2018). Comparison of multivariate methods for estimating selected soil properties from intact soil cores of paddy fields by Vis–NIR spectroscopy, 310, 29–43.
Xue, H., Xu, X., Zhu, Q., Yang, G., Long, H., Li, H., et al. (2023). Object-oriented crop classification using time series sentinel images from google earth engine. Remote Sens. (Basel). 15 (5), 1353. doi:10.3390/rs15051353
Yang, Y., Christakos, G., Guo, M., Xiao, L., and Huang, W. J. E. P. (2017). Space-time quantitative source apportionment of soil heavy metal concentration increments. Environ. Pollut. 223, 560–566. doi:10.1016/j.envpol.2017.01.058
Yang, Y., Yang, X., He, M., and Christakos, G. J. C. (2020). Beyond mere pollution source identification: determination of land covers emitting soil heavy metals by combining PCA/APCS, GeoDetector and GIS analysis. GeoDetector GIS analysis 185, 104297. doi:10.1016/j.catena.2019.104297
Yong, R. N., Mohamed, A.-M. O., and Warkentin, B. P. (1992). Principles of contaminant transport in soils.
Zeydan, B. A. (2005). “The Nile Delta in a global vision,” in Ninth international water technology conference, IWTC9, 31–40.
Keywords: anthropogenic activates, soil pollution, middle Nile delta, PCA, cluster, contamination indices
Citation: Hendawy E, Belal A-A, Sheta AEAS, Mohamed ES, Kucher DE, Jalhoum MEM, Shokr MS, Ali AM, Othman YA and Abou-Hadid AF (2025) Assessment of human activities on soil contamination in Egypt: implications for the MENA region. Front. Environ. Sci. 13:1493197. doi: 10.3389/fenvs.2025.1493197
Received: 08 September 2024; Accepted: 27 January 2025;
Published: 25 February 2025.
Edited by:
Zahra Kalantari, Stockholm University, SwedenReviewed by:
Yves Lucas, Université de Toulon, FranceEl-Sayed Ewis Omran, Suez Canal University, Egypt
Copyright © 2025 Hendawy, Belal, Sheta, Mohamed, Kucher, Jalhoum, Shokr, Ali, Othman and Abou-Hadid. This is an open-access article distributed under the terms of the Creative Commons Attribution License (CC BY). The use, distribution or reproduction in other forums is permitted, provided the original author(s) and the copyright owner(s) are credited and that the original publication in this journal is cited, in accordance with accepted academic practice. No use, distribution or reproduction is permitted which does not comply with these terms.
*Correspondence: Mohamed S. Shokr, bW9oYW1lZF9zaG9rckBhZ3IudGFudGEuZWR1LmVn