 Yanbing Chi1
 Chenchen Wei
 Peiling Yang
- 1Nanxun Innovation Institute, Zhejiang University of Water Resources and Electric Power, Hangzhou, China
- 2Agricultural Water Conservancy Department, Changjiang River Scientific Research Institute, Wuhan, China
- 3College of Water Resources and Civil Engineering, China Agricultural University, Beijing, China
Nitrous oxide (N2O) is a potent greenhouse gas primarily emitted from agricultural soils through microbial nitrogen transformation processes. Different nitrogen application rates and fertilizer types influence soil nitrogen transformation pathways, thereby affecting N2O production and emissions. Reclaimed water (RW), due to its chemical composition, may further modulate these processes. In this study, a disturbed soil incubation experiment was conducted using two irrigation water types [RW and deionized water (CW)], three nitrogen fertilizer forms [ammonium sulfate (NH4+), potassium nitrate (NO3−), and sodium nitrite (NO2−)], and two nitrogen application rates (200 and 400 mg N kg−1) to examine the dynamics of soil N2O emissions. The study found that, compared to CW, high fertilization levels (400 mg N kg−1) of NH4+ under RW treatment significantly increased cumulative soil N2O emissions by 25.04%, primarily by enhancing the abundance of the ammonia monooxygenase gene in ammonia-oxidizing archaea (AOA-amoA), the ammonia monooxygenase gene in ammonia-oxidizing bacteria (AOB-amoA), and the nitrite reductase gene (nirS). However, at low fertilization levels (200 mg N kg−1) of NH4+, there is no significant differences in cumulative N2O emissions. Under NO3− treatment, although RW increased the abundance of AOA-amoA and AOB-amoA, it did not lead to higher soil NO or N2O emissions at either high or low NO3− concentrations. In contrast, under NO2− treatment, RW increased the abundance of AOA-amoA and AOB-amoA compared to CW, significantly enhancing cumulative soil N2O emissions by 27.56% and 39.25%, respectively. In conclusion, RW irrigation does not elevate soil N2O emissions with nitrate-based fertilizers. However, careful management of nitrification rates is required with ammonium-based fertilizers, including the use of nitrification inhibitors and improved soil aeration, to minimize NO2− accumulation and related environmental risks.
1 Introduction
With the increasing occurrence of extreme weather events, RW has emerged as a stable and reliable water source that can effectively alleviate agricultural water shortages (Maestre-Valero et al., 2019; Santos et al., 2023). However, RW contains dissolved organic nitrogen, dissolved organic carbon, inorganic nitrogen, and a diverse array of microorganisms, which can significantly alter the physical, chemical, and biological properties of the soil (Lyu and Chen, 2016), thereby influencing soil nitrogen transformation processes. N2O is a potent greenhouse gas with a strong global warming potential and plays a critical role in stratospheric ozone depletion, with soil being a major source of its emissions (Allen et al., 2014; Tian H. et al., 2020). Understanding the mechanisms of soil N2O emissions under RW irrigation is therefore of great environmental significance.
Soil N2O emissions are a byproduct of nitrogen transformation processes and are highly influenced by changes in soil pH, electrical conductivity (EC), nutrient availability, and microbial community composition. As a key substrate for soil nitrogen transformation, including nitrification and denitrification, nitrogen fertilizers have long been a focal point of research (Janke et al., 2021; Chen et al., 2024; Lyu et al., 2024). Different types and application rates of nitrogen fertilizers can significantly alter soil physicochemical properties, affecting soil pH (Pareja-Sánchez et al., 2020) and nitrogen cycling genes (Ouyang et al., 2018). In dryland soils, nitrification is the predominant nitrogen transformation process, and increasing soil NH4+ levels has been shown to significantly enhance N2O emissions (Li et al., 2017). Additionally, N2O emissions tend to be lower with NO3− based fertilizers compared to NH4+-based fertilizers (Tian D. et al., 2020), likely due to the fact that NH4+-based fertilizers contribute to greater NH3 volatilization (Bi et al., 2025). Moreover, AOA and AOB, the key microbial groups driving the nitrification process, are highly sensitive to nitrogen availability (Segal et al., 2017). Variations in nitrogen fertilizer application can lead to shifts in soil microbial communities and alter nitrification and denitrification pathways (RÜTting et al., 2010; Duan et al., 2019), further complicating efforts to mitigate N2O emissions (Wang et al., 2018).
In agricultural production, numerous studies have confirmed that RW irrigation can effectively increase soil N2O emissions (Chi et al., 2020b; Pareja-Sánchez et al., 2020). Given the complexity of fertilization environments and RW quality, RW may interact with nitrogen fertilizers, regulating nitrification and denitrification processes and further affecting N2O emissions. Chi et al., 2020a found that slow-release fertilizers could effectively regulate soil N2O emissions. Shang et al. (2016) demonstrated that applying nitrate-based fertilizers under RW irrigation could significantly reduce soil N2O emissions Additionally, Chi et al. (2020b) used the DNDC model to analyze the optimal fertilization rate of 225 kg N ha−1 under RW irrigation in North China, achieving a balance between crop yield and greenhouse gas emissions. These findings suggest that the behavior of different nitrogen ions may change under RW irrigation conditions. For example, a high NH4+ supply may enhance nitrification, while a high NO3− supply may not necessarily promote denitrification. Therefore, systematically studying the transformation processes of different nitrogen ions under RW irrigation and their impact on N2O emissions can help optimize fertilization management and water resource utilization to mitigate agricultural greenhouse gas emissions. However, systematic research on these transformation processes remains limited.
Therefore, this study investigates the effects of different nitrogen levels (NH4+, NO3−, NO2−) on soil nitrogen transformation and soil N2O and NO emission patterns under RW irrigation through indoor incubation experiments. The study analyzes the relationship between water quality changes and the abundance of soil nitrogen transformation-related genes under different nitrogen conditions. This aims to elucidate the impact of nitrogen types and fertilizer nitrogen levels on the pathways of soil N2O production under RW irrigation.
2 Materials and methods
2.1 Experiment design
This study employed an indoor disturbed soil incubation experiment, considering three types of nitrogen fertilizers: ammonium sulfate-(NH4)2SO4, potassium nitrate-KNO3, and sodium nitrite-NaNO2; two nitrogen application gradients (200, 400 mg N kg−1); and two water quality treatments (CW and RW), as detailed in Table 1. The soil samples for the RW treatment were taken from the 0–30 cm topsoil layer at China Agricultural University Tongzhou Experimental Station in 2020. The sampling area underwent RW and groundwater irrigation trials from 2013 to 2020, as documented in the literature (Chi et al., 2020b; 2020a; 2023). In short-term indoor incubation experiments, the high ion content in groundwater may interfere with the assessment of RW treatments and obscure the differences between treatments, thus affecting the accuracy and interpretability of the experimental results. Therefore, considering the differences in water quality during experimental design, CW should be used as a control treatment to avoid interference caused by complex water quality. Five sampling points were randomly selected and mixed in RW and groundwater irrigated area. Surface soil samples (0–30 cm) for the RW and CW treatments were collected after the final irrigation events with RW and groundwater, respectively, in 2020. The irrigation water quality and soil characteristics for the experiment are detailed in Table 2. According to Table 2, RW contains measurable levels of inorganic nitrogen. Furthermore, soil analysis reveals that long-term RW irrigation markedly elevates soil NO3− content and electrical conductivity (EC). The experiment is divided into two stages: pretreatment phase and experimental phase.
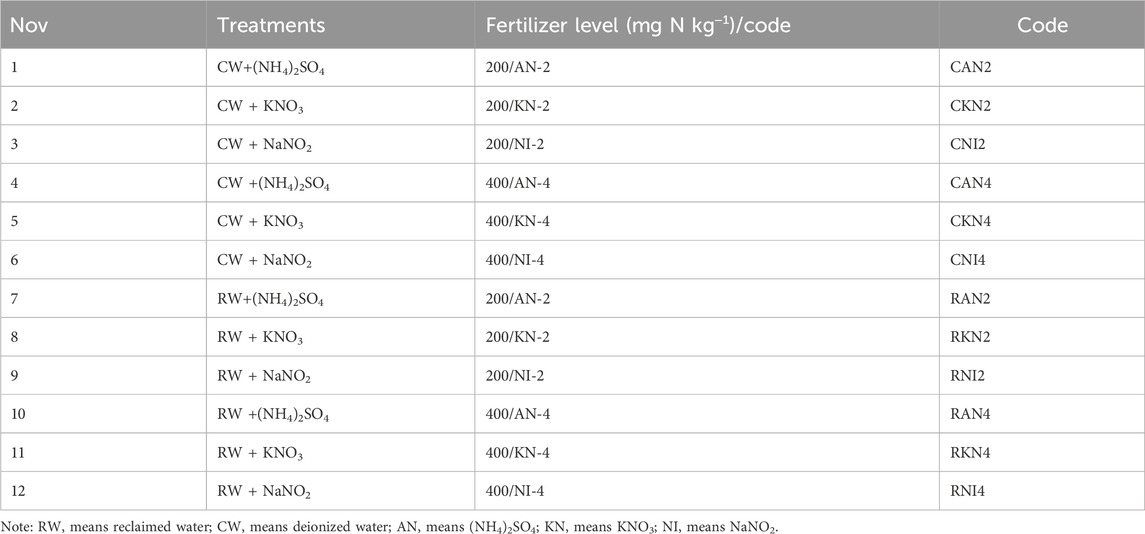
Table 1. The treatment details and corresponding code.
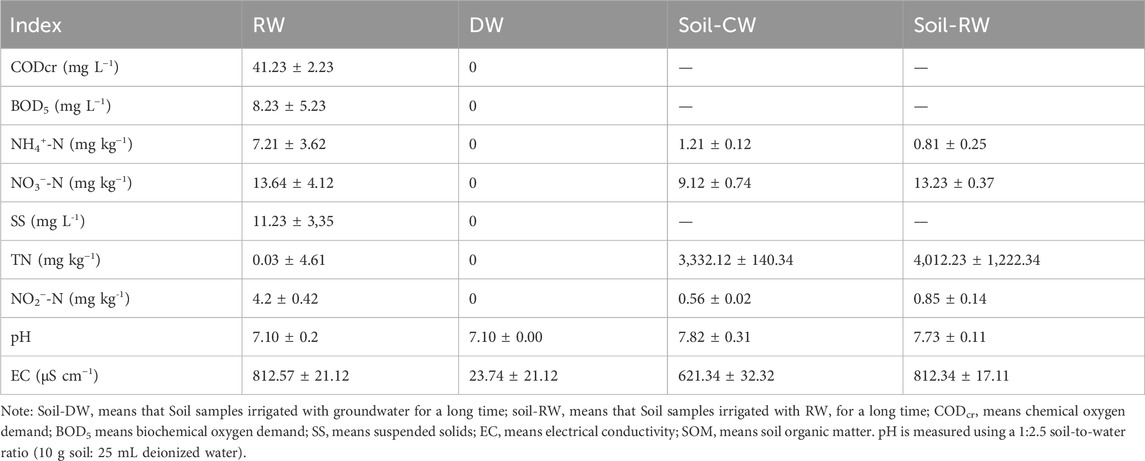
Table 2. The properties of water quality and soil.
2.1.1 Pretreatment phase
30 g of dry soil was placed into a 250 mL glass bottle. A syringe was used to slowly and evenly apply CW and RW into the soil in a clockwise manner to ensure uniform water distribution, maintaining a soil water-filled pore space (WFPS) of 40%. The bottles were weighed daily, and water was added as needed to maintain the WFPS. They were then placed into a completely dark incubator with ventilation for 7 days to deplete soil nitrogen and activate soil microbial activity.
2.1.2 Experimental phase
For each treatment, nitrogen fertilizer was dissolved in 3.03 g of water (either CW or RW) to achieve a nitrogen application rate of 200 mg N kg−1. The solution was evenly applied to the soil samples using a syringe, adjusting the WFPS to 70%. The bottles were then placed in an incubator at 28°C. Every 12 h, the bottles were removed, weighed, and their water content adjusted as needed before returning them to the incubator.
2.2 The related index
2.2.1 Soil N2O and NO
Headspace gas samples of N2O and NO were collected on days 1, 2, 3, 4, 5, 7, 13, 18, 23, and 28 during the incubation period. Prior to sampling, each sample bottle was ventilated for 2 h. An initial 20 mL of headspace gas was drawn before sealing the bottles, and a subsequent sample is taken after the bottles remained sealed for 24 h. For NO concentration assays, a 20 mL sample of the detection gas was mixed with 980 mL of helium in a 1 L sampling bag to ensure the passage of a full liter of gas through the analysis system. N2O concentrations were measured using gas chromatography with an Agilent GC-6820 system (Agilent Technologies Inc., Santa Clara, CA, United States), while NO levels were assessed using a 42i chemiluminescence NO-NOx analyzer (Thermo Environmental Instruments Inc., Franklin, MA, United States). Each treatment was replicated three times.
Soil N2O and NO emission fluxes were calculated based on Formula 1. The cumulative gas was determined as the sum of the daily concentrations, and the unmonitored values were estimated from the adjacent differences, referred to Wei et al., 2019.
M0 is the mass fraction of N in N2O or NO (g mol−1), P0 is the standard atmospheric pressure (kPa), P represents actual pressure inside the sampling vial (kPa), V is the volume increment of N2O or NO in the sampling vial (mL), M is the quantity of the soil (kg), and T is the temperature of the bottle (°C).
2.2.2 Soil inorganic nitrogen
Soil samples were collected on days 1, 3, 5, 7, 13, 18, 23, and 28 during the incubation period to determine concentrations of NH4+, NO3−, NO2− concentrations. Soil inorganic nitrogen was extracted using 1 mol L−1 potassium chloride (KCl) solution at a 1:10 soil-to-solution ratio The mixtures were shaken at room temperature (25°C) for 30–60 min, either manually or on a mechanical shaker, to ensure sufficient extraction. After shaking, the suspensions were filtered through Whatman No. 42 filter paper or centrifuged at 4,000 rpm for 10 min to obtain the supernatant. The concentrations of NH4+, NO3−, NO2− in the extracts were then determined using a continuous flow analyzer (AA3, SEAL Analytical, Germany). NO2− accumulative intensity was the sum of the changes in NO2− concentration in the soil in the soil during the incubation phase.
2.2.3 Soil nitrogen transformation-related genes
Soil samples were collected on the final day of the experiment to determine the abundance of genes related to nitrogen transformation. The absolute abundances of functional genes involved in soil nitrogen transformation—including AOA-amoA, AOB-amoA, nirK, nirS, and nosZ—were quantified using quantitative real-time PCR (qPCR) with fluorescence detection. DNA was extracted from 0.5 g of fresh soil using the FastDNA™ SPIN Kit for Soil (MP Biomedicals, United States) following the manufacturer’s instructions. The quality and concentration of extracted DNA were assessed using a NanoDrop spectrophotometer. The primers and amplification protocols for each gene were consistent with those described by Zhu et al., 2023. Each sample was run in triplicate, and standard curves were generated using serial dilutions of plasmids containing the target gene fragments.
2.3 Statistical analysis
In the data processing stage, quality control was ensured primarily by verifying that repeated tested data did not show significant differences (p > 0.05) based on one-way ANOVA and exhibited a normal distribution trend. Normality tests (e.g., Shapiro-Wilk test) were conducted to confirm the data distribution, and standard deviation (SD) or coefficient of variation (CV%) was calculated to assess data consistency. The CV% values ranged from 2% to 10%, indicating an acceptable level of variability within the dataset.
The main effects analysis was performed using SPSS V25 for Windows (SPSS Inc., Chicago, IL, United States) to assess the effects of treatments. Further analysis of simple effects was conducted upon detecting significant interactions. To identify significant differences between treatment means, the least significant difference procedure (LSD) was applied, with a significance threshold of 0.05. In this context, ‘average’ was defined as the arithmetic mean, and “correlation” was referred to as linear correlation (R2).
3 Results
3.1 Soil N2O and NO emissions
After nitrogen application, N2O emissions peak within 5 days (Figure 1a), while NO emissions reach their peak within 1–2 days after fertilization (Figure 1b), followed by a gradual decline and stabilization. Under high fertilization levels, the N2O peak appears earlier than under low fertilization levels (Figure 1a), whereas for NO emissions, the peak timing is similar between high and low fertilization treatments (Figure 1b). As illustrated in Figure 1a, peak magnitude analysis showed that under AN and NI treatments, soil N2O emission peaks increased with rising nitrogen application levels, with emissions consistently higher under RW irrigation compared to CW. Specifically, the peak values were 2,842.48 ng N kg−1 for RAN4, 3,129.30 ng N kg−1 for RNI4, 2,827.87 ng N kg−1 for CAN4, and 2027.72 ng N kg−1 for CNI4. For the KN treatment, peak values were similar between high and low fertilization levels, yet emissions remained higher under RW irrigation than under CW treatment. The specific peak values were 344.75 ng N kg−1 for CKN2, 343.73 ng N kg−1 for CKN4, 423.73 ng N kg−1 for RKN2, and 443.94 ng N kg−1 for RKN4.
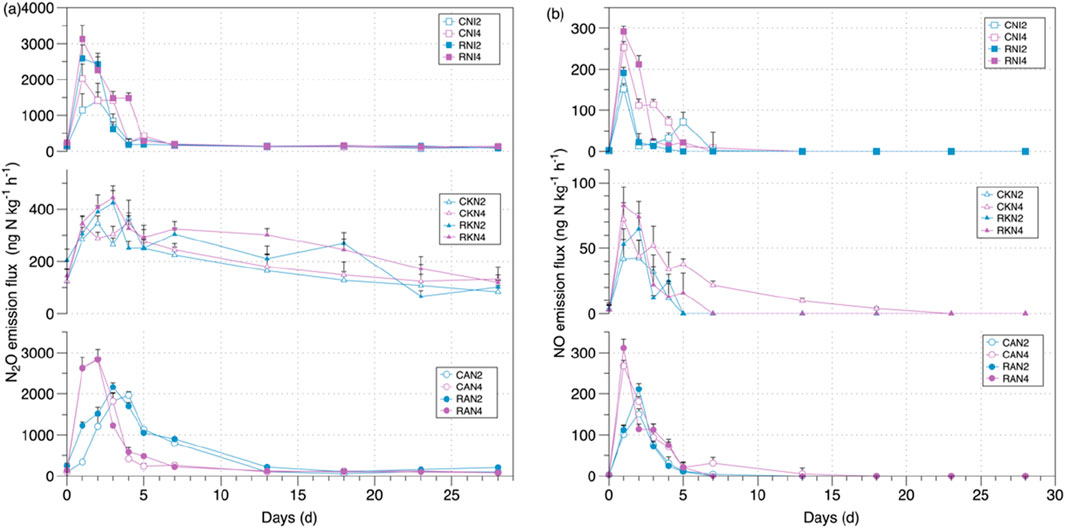
Figure 1. (a) The patterns of soil N2O emissions during the period of incubation; (b) The patterns of soil NO emissions during the period of incubation.
Water quality significantly cumulative influenced soil N2O emissions (p < 0.05), though it had no notable effect on NO cumulative emissions (p > 0.05), as shown in Table 3. The interaction between water quality and fertilizer type, water quality and fertilizer rate, as well as the three-way interaction among water quality, fertilizer type, and fertilizer rate, all had significant effects on soil N2O emissions. In contrast, for soil NO emissions, only the interaction between water quality and fertilizer rate was significant. Simple effect revealed that under AN treatments, RW irrigation significantly increased soil N2O and NO emissions (p < 0.05). In contrast, under KN treatments, RW had no significant effect on cumulative N2O and NO emissions (p > 0.05). Under NI treatments, RW significantly affected only cumulative NO emissions (p < 0.05), with no significant impact on N2O emissions. As illustrated in Figure 2, at a low nitrogen application rate of 200 mg N kg−1, RW irrigation significantly (p < 0.05) increased cumulative soil NO emissions, with RAN2 showing a 25.04% increase compared to CAN2. Additionally, RNI2 significantly (p < 0.05) increased cumulative N2O emissions by 27.58% compared to CNI2. At the higher nitrogen application rate of 400 mg N kg−1, RAN4 also significantly (p < 0.05) increased cumulative N2O emissions by 25.04% compared to CAN4.
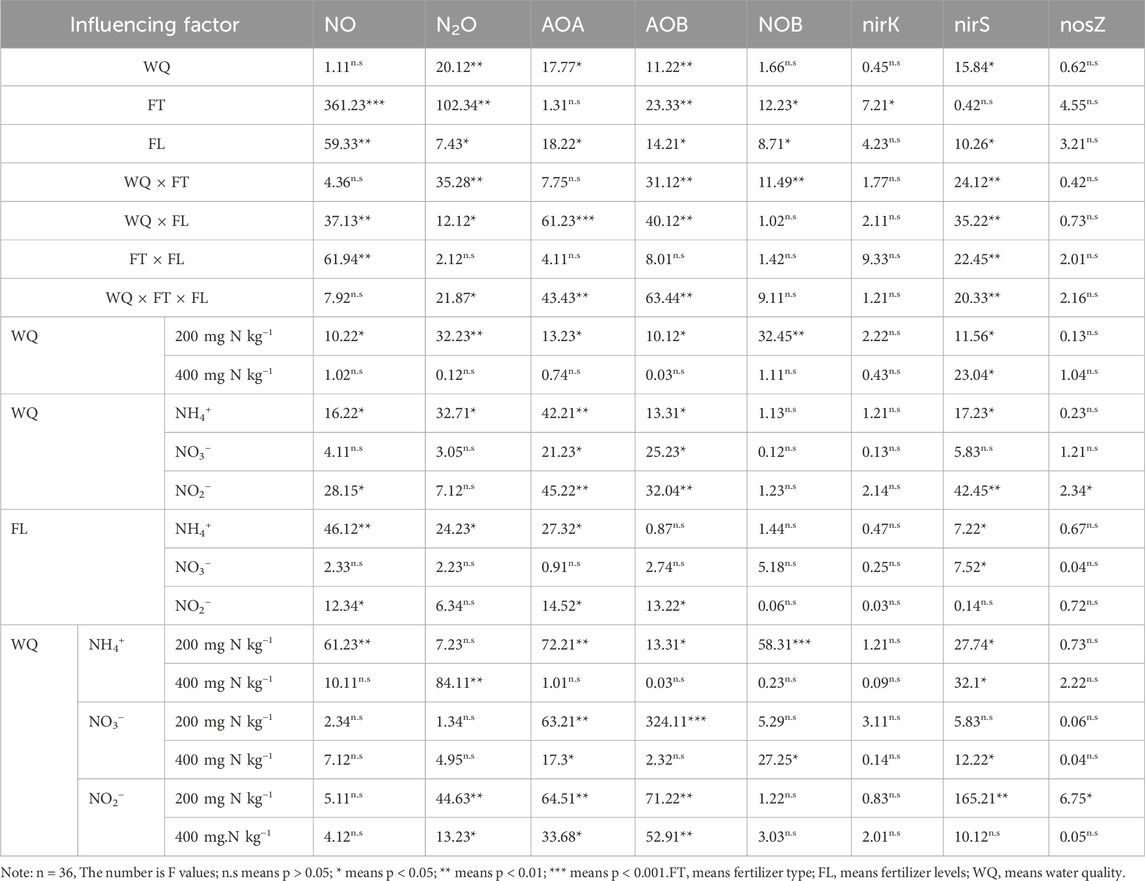
Table 3. Significance analysis of soil cumulative N2O/NO and soil nitrogen related transformation microbial gene copy numbers.
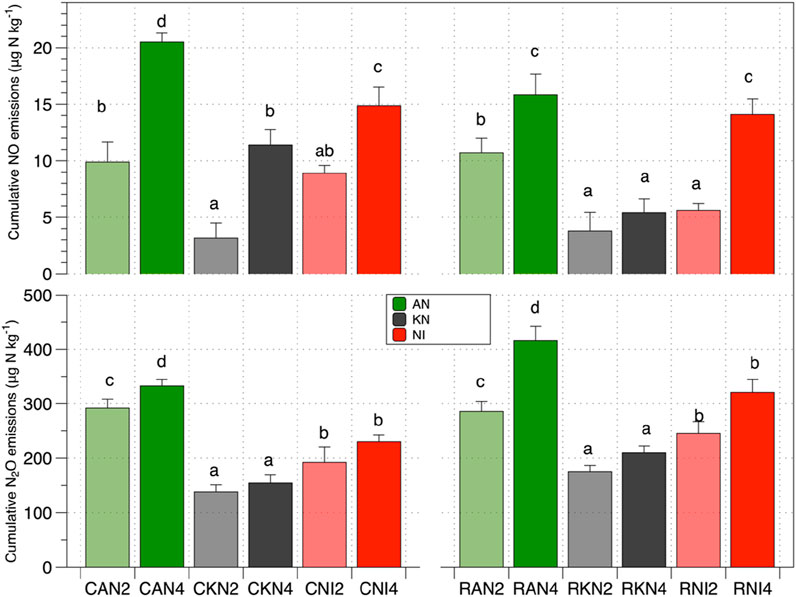
Figure 2. Cumulative emissions of N2O and NO during the period of incubation. The different letter indicates that the difference is significant (p < 0.05) between different treatments.
As shown in Table 3, both the type and amount of nitrogen applied significantly affected cumulative emissions of soil NO (p < 0.05). As illustrated in Figure 2, cumulative N2O emissions in the AN and NI treatments were significantly (p < 0.05) higher than those in the KN treatments, with N2O cumulative emissions increasing by 62.83%–115.49% and 39.08%–52.98%, respectively, and NO cumulative emissions increasing by 97.95%–213%–93% and 30.49%–182.47%, respectively. The nitrogen application rate also significantly (p < 0.05) influenced soil N2O and NO cumulative emissions. Under the AN treatment, as the nitrogen application rate increased, soil N2O and NO cumulative emissions significantly rose (p < 0.05) (Figure 2). Specifically, with RW irrigation, N2O and NO cumulative emissions increased by 45.56% and 48.08%, respectively, while with CW irrigation, they increased by 13.96% and 107.54%, respectively. For the KN treatment, increasing nitrogen application did not significantly affect soil N2O and NO cumulative emissions (Table 2). In contrast, under the NI treatment, increasing nitrogen application significantly increased soil NO cumulative emissions (p < 0.05) but had no significant effect on N2O cumulative emissions (p > 0.05) (Figure 2).
3.2 Soil nitrogen
During the incubation period, the changes in soil inorganic nitrogen were similar across all treatments, as shown in Figure 3. In the AN treatment, the NH4+ content gradually decreased over time. In the NI and AN treatments, the NO3− content gradually accumulated as the incubation time increased. In the AN, KN, and NI treatments, a peak in NO2− content was observed at the beginning of the incubation period, with the peak magnitude increasing with the amount of fertilizer applied.
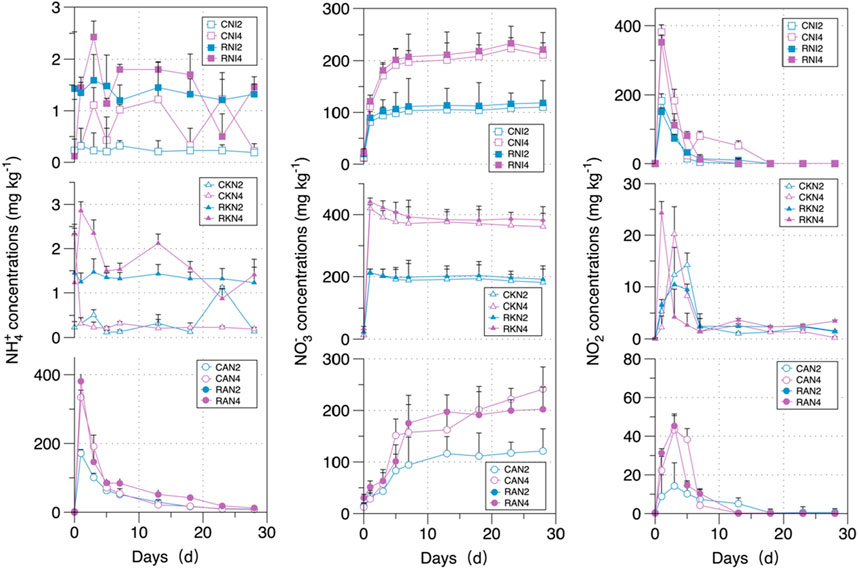
Figure 3. The patterns of soil nitrogen concentrations during the period of incubation.
As shown in Figure 4a, the soil NH4+ and NO3− contents directly affected the soil NO2− content. In KN treatments, the R2 values for RW and CW treatments were both less than 0.3, and k is less than 0.05. In AN treatments, the R2 values for RW and CW treatments were 0.50 and 0.48, respectively, with k greater than 0.1. This indicated that the effect of NO3− application on increasing NO2− content was smaller than that of AN treatment. As shown in Figure 4b, there was a significant linear relationship between NH4+ and NO3− application rates and NO2− accumulation intensity. The R2 values for RW and CW treatments were 0.99 and 0.99 for NH4+, and 0.81 and 0.93 for NO3−, respectively. Analysis of the differences between different nitrogen treatments showed that in AN treatments, the linear slopes for RW and CW treatments were 0.89 and 0.86, respectively, while in KN treatments, they were 0.05 and 0.06. Analyzing the impact of water quality on NO2− accumulation intensity, the R2 and k values showed very small differences between treatments. This could be due to the experimental setup, where the nitrogen application gradient was relatively large, lacking low nitrogen application treatments. Consequently, the impact of water quality on NO2− accumulation intensity was minimal.
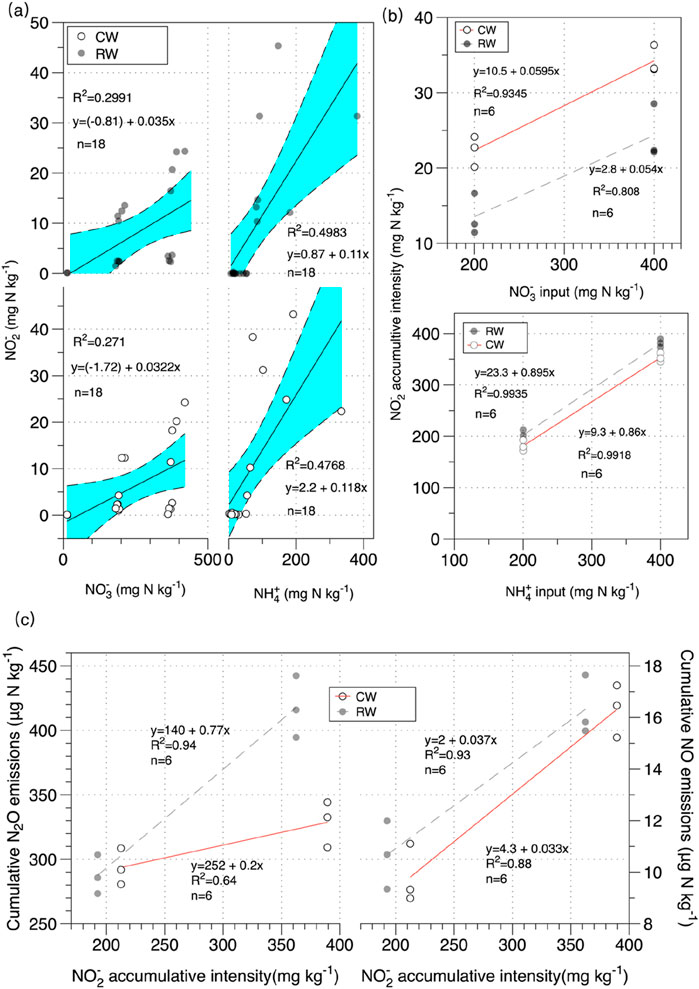
Figure 4. (a) The effect of NH4+/NO3− concentrations on NO2− concentrations in soil under AN and KN treatments; (b) The effect of NH4+ and NO3− input concentrations on NO2− accumulation intensity under different water quality conditions; (c) The effect of NO2− accumulation intensity on cumulative N2O and NO emissions under NH4+ treatments.
As shown in Figure 4c, there was a strong correlation between soil NO2− accumulation intensity and cumulative emissions of soil NO and N2O during NH4+ treatments. Analyzing the differences in the impact of soil NO2− accumulation intensity on NO and N2O emissions between different water qualities, the experiment suggested that the effect of NO2− accumulation intensity on soil NO and N2O emissions was greater under RW treatment compared to CW treatment (kRW > kCW). The experiment found that the impact of NO2− accumulation intensity on cumulative NO emissions was greater than on cumulative N2O emissions (kNO > kN2O). In summary, the influence of soil NH4+ and NO3− on soil NO and N2O emissions was likely primarily mediated through changes in NO2− ion content. This highlighted the importance of NO2− ions in the pathways of nitrogen transformations leading to the production of NO and N2O in the soil.
3.3 Soil nitrogen transformation genes
As shown in Table 3, the main effect analysis indicated that RW significantly affected the gene copy numbers of AOA-amoA and AOB-amoA (p < 0.05), but had no significant impact on the abundance of NOB genes. Similar effects were observed in the interactions between water quality and fertilizer rate, as well as among water quality, fertilizer type, and fertilizer rate. Further simple effect analysis and Figure 5 revealed that under all three nitrogen types, increasing nitrogen application significantly increased the gene copy numbers of AOA-amoA, AOB-amoA and NOB (p < 0.01). Under RW irrigation in AN and NI treatments, the gene copy numbers of AOA-amoA, AOB-amoA, and NOB significantly increased (p < 0.05). In KN treatments, RKN significantly increased the gene copy numbers of AOA-amoA and NOB compared to CKN (p < 0.05), but had no significant effect on AOB-amoA gene copy numbers (p > 0.05). For AN treatments, at a low nitrogen application rate (200 mg N kg−1), RW significantly increased the gene copy numbers of AOA-amoA, AOB-amoA, and NOB compared to CW (p < 0.05). At a high nitrogen application rate (400 mg N kg−1), water quality had no significant effect on AOA-amoA and AOB-amoA gene copy numbers (p > 0.05). For KN treatments, water quality significantly affected AOA-amoA and NOB gene copy numbers at both nitrogen application rates (p < 0.05), but had no significant effect on AOB-amoA (p > 0.05). For NI treatments, water quality significantly affected AOA-amoA and AOB-amoA gene copy numbers at both nitrogen application rates (p < 0.05), but had no significant effect on NOB (p > 0.05).
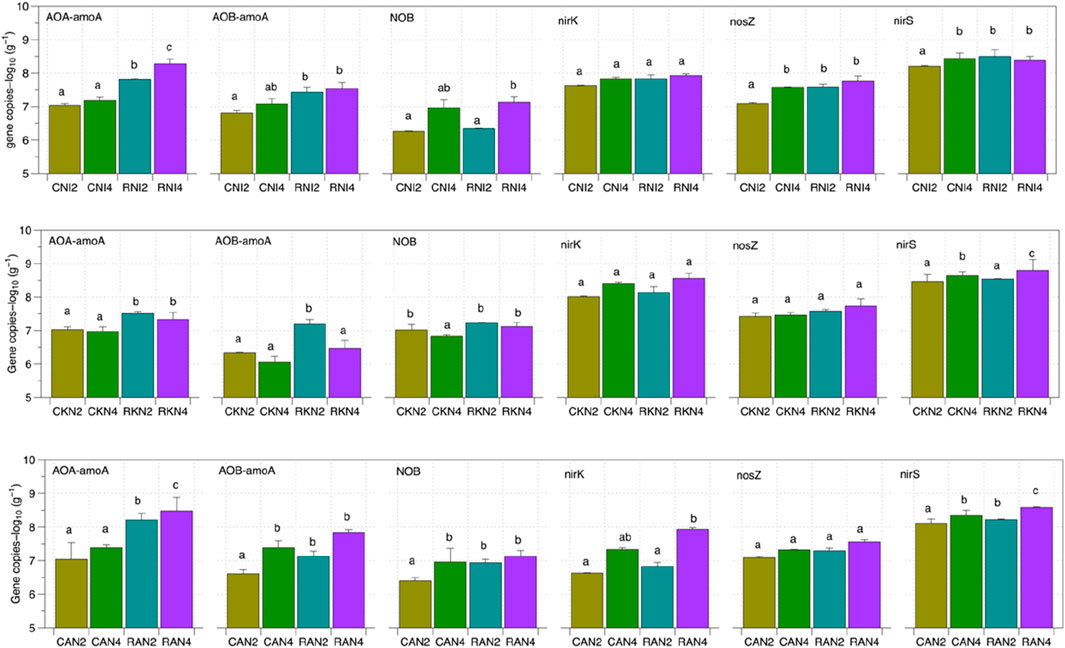
Figure 5. Log 10 values of the absolute abundance of soil nitrogen transformation genes under different nitrogen application gradients. The log10-transformed gene copy numbers per g of dry soil of the targeted functional genes (AOA-aomA, AOB-aomA, NOB, nirS, nirK, and nosZ) under different treatments are shown; every treatment had six repetitions. The different letter indicates that the difference is significant (p < 0.05) between different treatments.
As shown in Figure 5, the differences in gene copy numbers of denitrification microorganisms nirK and nosZ between different water qualities are minimal. However, under the KN and AN treatments, RW significantly increased the nirS gene copy numbers (p < 0.05). As shown in Table 3, water quality significantly affected the gene copy numbers of nirS (p < 0.05), but had no significant impact on the abundance of nirK and nosZ genes (p > 0.05). Neither fertilizer type nor fertilizer rate significantly influenced the abundance of nirK, nirS, and nosZ genes (p > 0.05). The interaction between water quality and other factors was found to significantly affect the gene copy numbers of nirS (p < 0.05). However, simple effect analysis showed that under the KN-2 treatment, water quality changes had no significant effect on nirS gene copy numbers, and changes in fertilizer rate under the NI treatment also had no significant effect. For nosZ, simple effect analysis revealed that in NI treatments, water quality had no significant effect on nosZ gene copy numbers (p > 0.05). However, at a low nitrogen application rate (200 mg N kg−1), RW significantly increased nosZ gene copy numbers (p < 0.05).
3.4 The relationship between nitrogen transformation genes and N2O and NO
As shown in Figure 6, there was a significant strong correlation between soil N2O and NO emissions, with an R2 value greater than 0.6 (p < 0.05). Soil N2O emissions were significantly correlated with the abundance of nitrifying microorganisms AOA-amoA and AOB-amoA (p < 0.05), with R2 values of 0.48 and 0.71, respectively. Soil NO emissions were significantly correlated with AOB, with an R2 value greater than 0.5 (p < 0.05). There was no significant correlation between soil N2O and NO emissions and the abundance of denitrifying microorganisms nirK, nirS, and nosZ. Additionally, analysis shown in Figure 6 indicated no significant linear relationship between nitrifying and denitrifying genes, suggesting no significant interaction between these two types of microorganisms.
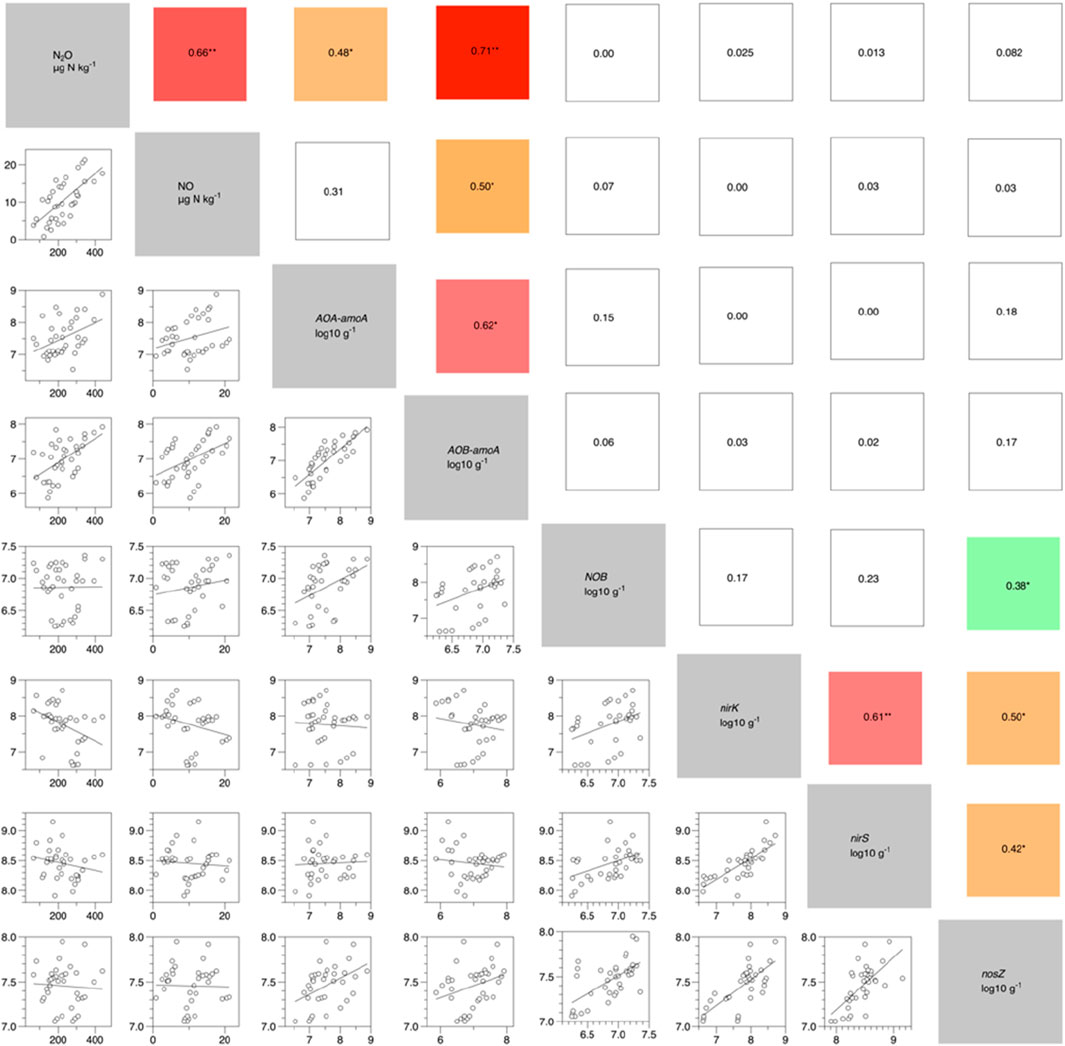
Figure 6. Linear correlation between nitrogen transformation genes and soil cumulative N2O and NO emissions under RW. The log10-transformed gene copy numbers per g of dry soil of the targeted functional genes (AOA-aomA, AOB-aomA, NOB, nirS, nirK, and nosZ) under different treatments are shown The values represent linear correlation coefficients (R2). n = 36, * means p < 0.05; ** means p < 0.01; *** means p < 0.001.
4 Discussion
4.1 The effect of nitrogen ions on N2O and NO emissions
Under conventional agricultural management, the amount of nitrogen fertilizer applied typically far exceeds the nitrogen content found in RW. In this experiment, it was observed that under the AN treatment, RW irrigation significantly increased soil N2O emissions—a finding consistent with previous studies (Chi et al., 2023; 2024). As NH4+ application rates increased, N2O emissions also rose (Figure 2; Hickman et al., 2014), primarily due to enhanced nitrification. Elevated NH4+ levels stimulated the activity of ammonia-oxidizing archaea and ammonia-oxidizing bacteria (Figure 5; Guo et al., 2017; Pei et al., 2022), thereby promoting N2O production.
In contrast, under the KN treatment, increasing nitrogen application did not lead to a similar rise in N2O emissions. This may be attributed to the disturbed soil incubation setup, where the availability of oxygen likely inhibited denitrification, even under high NO3− conditions. Among the key intermediates, NO2− plays a crucial role in regulating N2O emissions. Some studies report an exponential relationship between NO2− concentration and N2O emissions (Fan et al., 2020), while others indicate a strong linear relationship with NO3− (Chi et al., 2020b). In this study, a strong linear correlation was found between NO2− accumulation intensity and cumulative N2O and NO emissions, aligning with the majority of previous findings.
Soil NO2− primarily originates from both nitrification and denitrification processes. The addition of NH4+ and NO3− significantly increased soil NO2− content (Heil et al., 2016). Our analysis showed that both AN and KN treatments enhanced soil NO2− levels, suggesting that the oxidation of NH4+ exceeded the reduction of NO3−. The production of N2O and NO in soil mainly involves the formation of NH2OH, its oxidation to NO2−, and subsequent reduction of NO2− to N2 (Duan et al., 2019). In the NI treatment, where oxygen was abundant due to the disturbed bottle setup, N2O production under normal conditions would be minimal, as oxygen tends to oxidize NO2− to NO3−. However, the observed N2O emissions may have originated from nitrifier denitrification, a process in which AOB partially oxidize NH4+ to NO2− and then reduce NO2− to N2O or N2 under high NO2− concentrations (Wrage et al., 2001), rather than fully oxidizing it to NO3−. Another possible mechanism is abiotic, non-biological N2O formation, RW irrigation can enhance such chemical N2O production in soils (Zhu et al., 2023). These findings underscore the importance of controlling soil NO2− concentrations in agricultural systems utilizing RW irrigation, as a strategy for mitigating N2O emissions. The application of nitrification inhibitors or biochar is recommended, as both have been shown to suppress NO2− production and reduce N2O emissions (Weiske et al., 2001; Di and Cameron, 2011; Fan et al., 2020).
4.2 Changes in soil nitrifying and denitrifying microorganisms under RW
Numerous studies have demonstrated that RW irrigation increases the abundance of soil nitrifying and denitrifying microorganisms (Saha et al., 2010; Ibekwe et al., 2018; Sun et al., 2018; Zhu et al., 2023). In this study, under low nitrogen application rates, RW treatments (RAN and RNI) significantly increased the abundance of microorganisms associated with AOA-amoA and nosZ genes. However, the influence of RW on soil microbial communities is strongly modulated by both the type and amount of nitrogen applied. At higher nitrogen application rates, the quantity of nitrogen becomes the dominant factor shaping the abundance of nitrogen transformation genes, rather than RW. Previous research supports this observation: Tian et al. (2014) found that nitrogen input significantly increased nitrifying microbial populations, while Zhu et al. (2016) reported that higher fertilizer rates enhanced both nitrifying and denitrifying bacteria. In our study, under the KN treatment with nitrogen application rates of 200 and 400 mg N kg−1, RW irrigation did not significantly increase the abundance of denitrifying microbes compared to CW treatment. This may be due to the already high NO3− concentrations, suggesting that shifts in NO3− availability have a more pronounced effect on the growth, reproduction, and community structure of denitrifying bacteria. Therefore, at 200 mg N kg−1, nitrogen input itself becomes the primary driver of microbial proliferation, surpassing the influence of RW irrigation.
5 Conclusion
RW irrigation significantly increases soil N2O and NO emissions; however, its impact is strongly influenced by the type and amount of nitrogen fertilizer applied. When NH4+ fertilizers are used, RW irrigation enhances the abundance of AOA-amoA, AOB-amoA, and NOB genes in the soil, thereby accelerating the nitrification process. Notably, a significant increase in soil cumulative N2O emissions under RW irrigation is observed only at high concentrations of NH4+. In contrast, under NO3− fertilizers, although RW also increases the abundance of nitrification-related genes, it does not result in elevated N2O or NO emissions. These differences between fertilizer types are closely related to the accumulation of NO2−. As the application rate of ammonium-based fertilizers increases, the accumulation of NO2− becomes more pronounced compared to nitrate-based fertilizers. Compared to CW irrigation, RW irrigation requires more careful management of ammonium fertilizer application. The use of nitrification inhibitors may be necessary under RW conditions to effectively suppress NO2− accumulation and its associated gaseous nitrogen emissions.
Given the temporal and environmental limitations of laboratory experiments, future studies should further explore the long-term effects of combined RW irrigation and different nitrogen sources on soil microbial community structure, functional gene expression, and nitrogen emission dynamics across various crop growth stages and soil types.
Data availability statement
The raw data supporting the conclusions of this article will be made available by the authors, without undue reservation.
Author contributions
YC: Data curation, Visualization, Writing – original draft, Writing – review and editing. CW: Data curation, Writing – review and editing. PY: Conceptualization, Funding acquisition, Writing – original draft.
Funding
The author(s) declare that financial support was received for the research and/or publication of this article. This research was funded by Nanxu Scholars Program for Young Scholars of ZJWEU(RC2022021152), Huzhou Public Welfare Application Research Project (2023GZ70), the Natural Science Foundation of Wuhan (2023020201020362).
Conflict of interest
The authors declare that the research was conducted in the absence of any commercial or financial relationships that could be construed as a potential conflict of interest.
Generative AI statement
The author(s) declare that no Generative AI was used in the creation of this manuscript.
Publisher’s note
All claims expressed in this article are solely those of the authors and do not necessarily represent those of their affiliated organizations, or those of the publisher, the editors and the reviewers. Any product that may be evaluated in this article, or claim that may be made by its manufacturer, is not guaranteed or endorsed by the publisher.
References
Allen, M. R., Barros, V. R., Broome, J., and Cramer, W. (2014). IPCC fifth assessment synthesis report. Geneva, Switzerland: Intergovernmental Panel on Climate Change (IPCC).
Bi, S., Li, P., Lv, J., Dong, Q., Luo, X., Che, Y., et al. (2025). The optimized nitrogen rate reduced ammonia emissions from rice paddies in the cold region of Northeast China. Eur. J. Agron. 164, 127444. doi:10.1016/j.eja.2024.127444
Chen, Z., Liu, Y., Wu, L., Wang, J., Elrys, A. S., Uwiragiye, Y., et al. (2024). Unveiling ammonium concentration ranges that determine competition for mineral nitrogen among soil nitrogen transformations under increased carbon availability. Soil Biol. Biochem. 196, 109495. doi:10.1016/j.soilbio.2024.109495
Chi, Y., Wei, C., Yang, P., and Ma, N. (2024). Determinants and pathways of nitrous oxide emissions from soil irrigated with reclaimed water. Agronomy 14, 2089. doi:10.3390/agronomy14092089
Chi, Y., Wei, C., Zheng, Q., Yang, P., and Ren, S. (2023). Potential risk of soil reactive gaseous nitrogen emissions under reclaimed water irrigation in a wheat-maize rotation system. Agric. Water Manag. 288, 108486. doi:10.1016/j.agwat.2023.108486
Chi, Y., Yang, P., Ren, S., Ma, N., Yang, J., and Xu, Y. (2020a). Effects of fertilizer types and water quality on carbon dioxide emissions from soil in wheat-maize rotations. Sci. Total Environ. 698, 134010. doi:10.1016/j.scitotenv.2019.134010
Chi, Y., Yang, P., Ren, S., and Yang, J. (2020b). Finding the optimal fertilizer type and rate to balance yield and soil GHG emissions under reclaimed water irrigation. Sci. Total Environ. 729, 138954. doi:10.1016/j.scitotenv.2020.138954
Di, H. J., and Cameron, K. C. (2011). Inhibition of ammonium oxidation by a liquid formulation of 3,4-Dimethylpyrazole phosphate (DMPP) compared with a dicyandiamide (DCD) solution in six New Zealand grazed grassland soils. J. Soils Sediments 11, 1032–1039. doi:10.1007/s11368-011-0372-1
Duan, P., Zhou, J., Feng, L., Jansen-Willems, A. B., and Xiong, Z. (2019). Pathways and controls of N2O production in greenhouse vegetable production soils. Biol. Fertil. Soils 55, 285–297. doi:10.1007/s00374-019-01348-9
Fan, C., Duan, P., Zhang, X., Shen, H., Chen, M., and Xiong, Z. (2020). Mechanisms underlying the mitigation of both N2O and NO emissions with field-aged biochar in an Anthrosol. Geoderma 364, 114178. doi:10.1016/j.geoderma.2020.114178
Guo, W., Andersen, M. N., Qi, X., Li, P., Li, Z., Fan, X., et al. (2017). Effects of reclaimed water irrigation and nitrogen fertilization on the chemical properties and microbial community of soil. J. Integr. Agric. 16, 679–690. doi:10.1016/S2095-3119(16)61391-6
Heil, J., Vereecken, H., and Brüggemann, N. (2016). A review of chemical reactions of nitrification intermediates and their role in nitrogen cycling and nitrogen trace gas formation in soil: chemical reactions of nitrification intermediates in soil. Eur. J. Soil Sci. 67, 23–39. doi:10.1111/ejss.12306
Hickman, J. E., Palm, C. A., Mutuo, P., Melillo, J. M., and Tang, J. (2014). Nitrous oxide (N2O) emissions in response to increasing fertilizer addition in maize (Zea mays L.) agriculture in western Kenya. Nutrient Cycl. Agroecosyst. 100, 177–187. doi:10.1007/s10705-014-9636-7
Ibekwe, A. M., Gonzalez-Rubio, A., and Suarez, D. L. (2018). Impact of treated wastewater for irrigation on soil microbial communities. Sci. Total Environ. 622, 1603–1610. doi:10.1016/j.scitotenv.2017.10.039
Janke, C., Fujinuma, R., Moody, P., and Bell, M. (2021). Biochemical changes and distribution of nitrogen from bands of stabilised N-fertilizers in contrasting soils. Geoderma 382, 114770. doi:10.1016/j.geoderma.2020.114770
Li, R., Tsunekawa, A., and Tsubo, M. (2017). Assessment of agricultural drought in rainfed cereal production areas of northern China. Theor. Appl. Climatol. 127, 597–609. doi:10.1007/s00704-015-1657-x
Lyu, H., Li, Y., Wang, Y., Wang, P., Shang, Y., Yang, X., et al. (2024). Drive soil nitrogen transformation and improve crop nitrogen absorption and utilization - a review of green manure applications. Front. Plant Sci. 14, 1305600. doi:10.3389/fpls.2023.1305600
Lyu, S., and Chen, W. (2016). Soil quality assessment of urban green space under long-term reclaimed water irrigation. Environ. Sci. Pollut. Res. 23, 4639–4649. doi:10.1007/s11356-015-5693-y
Maestre-Valero, J. F., Gonzalez-Ortega, M. J., Martinez-Alvarez, V., Gallego-Elvira, B., Conesa-Jodar, F. J., and Martin-Gorriz, B. (2019). Revaluing the nutrition potential of reclaimed water for irrigation in southeastern Spain. Agric. Water Manag. 218, 174–181. doi:10.1016/j.agwat.2019.03.050
Ouyang, Y., Evans, S. E., Friesen, M. L., and Tiemann, L. K. (2018). Effect of nitrogen fertilization on the abundance of nitrogen cycling genes in agricultural soils: a meta-analysis of field studies. Soil Biol. Biochem. 127, 71–78. doi:10.1016/j.soilbio.2018.08.024
Pareja-Sánchez, E., Cantero-Martínez, C., Álvaro-Fuentes, J., and Plaza-Bonilla, D. (2020). Impact of tillage and N fertilization rate on soil N2O emissions in irrigated maize in a Mediterranean agroecosystem. Agric. Ecosyst. and Environ. 287, 106687. doi:10.1016/j.agee.2019.106687
Pei, L., Xiao, J., and Sun, L. (2022). The effects of reclaimed water irrigation on the soil characteristics and microbial populations of plant rhizosphere. Environ. Sci. Pollut. Res. 29, 17570–17579. doi:10.1007/s11356-021-16983-9
Rütting, T., Clough, T. J., Müller, C., Lieffering, M., and Newton, P. C. D. (2010). Ten years of elevated atmospheric carbon dioxide alters soil nitrogen transformations in a sheep-grazed pasture. Glob. Change Biol. 16, 2530–2542. doi:10.1111/j.1365-2486.2009.02089.x
Saha, J. K., Panwar, N., Srivastava, A., Biswas, A. K., Kundu, S., and Rao, A. S. (2010). Chemical, biochemical, and biological impact of untreated domestic sewage water use on Vertisol and its consequences on wheat (Triticum aestivum) productivity. Environ. Monit. Assess. 161, 403–412. doi:10.1007/s10661-009-0756-5
Santos, A. F., Alvarenga, P., Gando-Ferreira, L. M., and Quina, M. J. (2023). Urban wastewater as a source of reclaimed water for irrigation: barriers and future possibilities. Environments 10, 17. doi:10.3390/environments10020017
Segal, L. M., Miller, D. N., McGhee, R. P., Loecke, T. D., Cook, K. L., Shapiro, C. A., et al. (2017). Bacterial and archaeal ammonia oxidizers respond differently to long-term tillage and fertilizer management at a continuous maize site. Soil Tillage Res. 168, 110–117. doi:10.1016/j.still.2016.12.014
Shang, F., Ren, S., Yang, P., Chi, Y., and Xue, Y. (2016). Effects of different irrigation water types, N fertilizer types, and soil moisture contents on N2O emissions and N fertilizer transformations in soils. Water Air Soil Pollut. 227, 225–243. doi:10.1007/s11270-016-2920-1
Sun, J., Chen, L., Rene, E. R., Hu, Q., Ma, W., and Shen, Z. (2018). Biological nitrogen removal using soil columns for the reuse of reclaimed water: performance and microbial community analysis. J. Environ. Manag. 217, 100–109. doi:10.1016/j.jenvman.2018.03.088
Tian, D., Zhang, Y., Mu, Y., Liu, J., and He, K. (2020a). Effect of N fertilizer types on N2O and NO emissions under drip fertigation from an agricultural field in the North China Plain. Sci. Total Environ. 715, 136903. doi:10.1016/j.scitotenv.2020.136903
Tian, H., Xu, R., Canadell, J. G., Thompson, R. L., Winiwarter, W., Suntharalingam, P., et al. (2020b). A comprehensive quantification of global nitrous oxide sources and sinks. Nature 586, 248–256. doi:10.1038/s41586-020-2780-0
Tian, X.-F., Hu, H.-W., Ding, Q., Song, M.-H., Xu, X.-L., Zheng, Y., et al. (2014). Influence of nitrogen fertilization on soil ammonia oxidizer and denitrifier abundance, microbial biomass, and enzyme activities in an alpine meadow. Biol. Fertil. Soils 50, 703–713. doi:10.1007/s00374-013-0889-0
Wang, J., Chadwick, D. R., Cheng, Y., and Yan, X. (2018). Global analysis of agricultural soil denitrification in response to fertilizer nitrogen. Sci. Total Environ. 616 (617), 908–917. doi:10.1016/j.scitotenv.2017.10.229
Wei, C., Li, F., Yang, P., Ren, S., Wang, S., Wang, Y., et al. (2019). Effects of irrigation water salinity on soil properties, N2O emission and yield of spring maize under mulched drip irrigation. Water 11, 1548. doi:10.3390/w11081548
Weiske, A., Benckiser, G., and Ottow, J. C. G. (2001). Effect of the new nitrification inhibitor DMPP in comparison to DCD on nitrous oxide (N2O) emissions and methane (CH4) oxidation during 3 years of repeated applications in field experiments. Nutrient Cycl. Agroecosyst. 60, 57–64. doi:10.1023/A:1012669500547
Wrage, N., Velthof, G. L., van Beusichem, M. L., and Oenema, O. (2001). Role of nitrifier denitrification in the production of nitrous oxide. Soil Biol. Biochem. 33, 1723–1732. doi:10.1016/s0038-0717(01)00096-7
Zhu, S., Vivanco, J. M., and Manter, D. K. (2016). Nitrogen fertilizer rate affects root exudation, the rhizosphere microbiome and nitrogen-use-efficiency of maize. Appl. Soil Ecol. 107, 324–333. doi:10.1016/j.apsoil.2016.07.009
Keywords: water quality, fertilizer type, fertilizer level, soil nitrous oxide, soil nitrogen transformation-related genes
Citation: Chi Y, Wei C and Yang P (2025) Variation in soil nitrous oxide emission with nitrogen application rates under reclaimed water irrigation. Front. Environ. Sci. 13:1510520. doi: 10.3389/fenvs.2025.1510520
Received: 14 October 2024; Accepted: 14 April 2025;
Published: 30 April 2025.
Edited by:
Sangeeta Lenka, Indian Institute of Soil Science (ICAR), IndiaReviewed by:
Abhijit Sarkar, Indian Institute of Soil Science (ICAR), IndiaSonalika Sahoo, Indian Council of Agricultural Research (ICAR), India
Copyright © 2025 Chi, Wei and Yang. This is an open-access article distributed under the terms of the Creative Commons Attribution License (CC BY). The use, distribution or reproduction in other forums is permitted, provided the original author(s) and the copyright owner(s) are credited and that the original publication in this journal is cited, in accordance with accepted academic practice. No use, distribution or reproduction is permitted which does not comply with these terms.
*Correspondence: Chenchen Wei, d2VpY3JzQGhvdG1haWwuY29t