 Qiang Li
 Shuliang Zhang
- 1School of Humanities and Social Sciences, North China Electric Power University, Beijing, China
- 2School of Business, Linyi University, Linyi, China
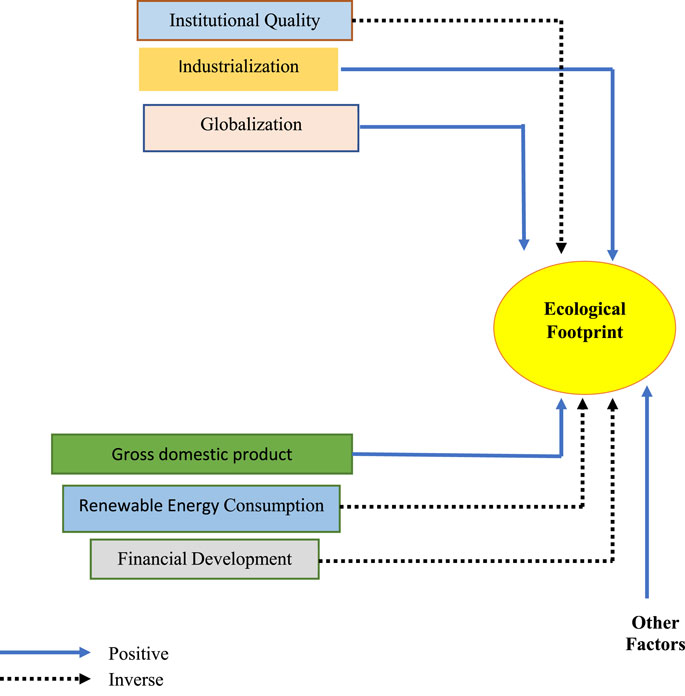
Institutional quality (IQ) and renewable energy (RE) play crucial roles in reducing the ecological footprint (EFP), directly aligning with several United Nations Sustainable Development Goals (SDGs). IQ supports SDG-16 (Peace, Justice, and Strong Institutions) by designating effective governance, transparent policies, and legal frameworks that promote environmental sustainability. Renewable energy (RE) contributes enormously to SDG-7 (Affordable and Clean Energy) by providing sustainable, clean, and reliable energy sources that reduce dependence on fossil fuels. Adopting RE technologies also supports SDG-9 (Industry, Innovation, and Infrastructure) through investments in modern infrastructure and sustainable industrialization, fostering environmentally responsible economic growth. If institutions are strong, they ensure accountability and the implementation of regulations that facilitate the transition to RE, managing the SDG-13 (Climate Action) by actively combating climate change through policy and innovation. Therefore, the current study examines the impact of globalization and industrialization on ecological footprints (EFP) in six SAARC economies between 1996 and 2022, emphasizing the role of IQ and RE. We used the Fully Modified Ordinary Least Squares, Dynamic Ordinary Least Squares, Cross-sectional Autoregressive Distributed Lag (CS-ARDL), and panel causality approaches for the empirical study. The empirical findings demonstrate that globalization, industrialization, and GDP positively influence EFP, with coefficients of 0.82, 0.03, and 0.27. On the other hand, institutional quality, financial development, and renewable energy negatively affect EFP, with coefficients of −0.02, −0.70, and −0.30. Policymakers should establish and enforce stringent regulatory frameworks to ensure environmental accountability in industrial sectors, including mandatory compliance audits, transparent reporting mechanisms, and strict penalties for violations. Also, governments in SAARC countries should introduce targeted financial incentives, such as subsidies, tax exemptions, and concessional loans, to accelerate the adoption of RE solutions and promote sustainable economic growth and environmental sustainability. Moreover, SAARC countries should strengthen institutional transparency and anti-corruption frameworks to ensure fair and effective enforcement of environmental regulations.
1 Introduction
Sustainable environmental quality has emerged as the most busing issue in developed and developing countries over the last three decades. Also, it is on the agenda of UN sustainable development goals. Environmental sustainability is crucial for human wellbeing, primarily achieved through reducing greenhouse gas (GHG) and carbon dioxide emissions (CO2e) (Usman et al., 2021). However, it is believed that both CO2e and GHG emissions are a key factor in raising the overall ecological footprint (EFP), which in turn hastens the occurrence of environmental damage on a global basis (Wang et al., 2020). The EFP is widely recognized as a reliable indicator of environmental sustainability (Uddin et al., 2023c). It measures the total amount of productive land and aquatic area required to produce the resources humans consume and to manage the waste they generate (Rees et al., 1996). EFP reflects the demand placed on nature, while bio-capacity (BC) represents nature’s supply. When EFP exceeds BC, it indicates an ecological deficit; when BC exceeds EFP, it signifies an ecological surplus. According to the Global Footprint Network (GFN, 2023), the world would need 1.75 Earths to meet human demands and manage waste. In 2019, the global EFP and BC per person were 2.6 gha and 1.6 gha, respectively, and by 2022, these figures were estimated at 2.6 gha and 1.5 gha, respectively (Nepal and Shrestha, 2024). More economic growth necessitate more resources, infrastructure, and energy usage, which worsens the environment and increases the release of GHG. The increase in GHG has harmed productivity and human health. The top 25 industrialized nations were responsible for 80% of the world’s emissions in 2012 (International Energy Agency (IEA), 2017). Furthermore, low-income nations are expected to contribute 80% of emissions in the future. It shows that industrialized nations have succeeded in preserving the environment and attaining long-term economic prosperity. However, emerging nations are moving differently because they devastate the environment while experiencing slow economic growth.
The primary external forces, including trade, FDI, and the elements of globalization (GLO), such as social, economic, and political, significantly influence environmental degradation (ED). Theoretically, GLO controls the direction of global investment and commerce that harms the environment. Deforestation and the demise of fisheries are two examples of how globalization depletes renewable energy (RE) sources linked to commerce. However, globalization pressures provide extensive tree plantings, green items, and technology (such as RE and hybrid autos) at lower costs and lower rent, prompting customers to embrace these products more swiftly (Copeland and Taylor, 2013). Social, economic, and political GLO are the three primary subdivisions of the phenomenon, and they are combined to create a KOF index by the Swiss Economic Institute (see Dreher, 2006). Several recent research, including (You and Lv, 2018; Khan et al., 2019; Chen et al., 2019; Saint-Akadiri et al., 2019; Azam et al., 2022b; Zaidi et al., 2019) have also used the KOF index to investigate the contribution of GLO to CO2e. GLO surge in commerce and consumption, resource extraction, manufacturing, and transportation impact EFP more. GLO also encourages industrial development in underdeveloped nations, where stricter environmental laws may exacerbate ecological effects. Globalization increases the demand for natural resources and hastens the worldwide deterioration of the environment. The KOF GLO index was used for 166 economies by Bu et al. (2017), who used data from 1990 to 2009 and discovered that high-level misuse of economic, political, and social globalization causes an increase in overall CO2e. However, the impact varies between OECD and non-OECD countries. Khan and Ullah (2019) found that GLO affects the CO2e. Saint-Akadiri et al. (2019) found a substantial positive link between globalization and CO2e. Farooq et al. (2022) findings reveal that globalization helps reduce environmental deterioration. Villanthenkodath and Pal (2023) found that economic GLO reduces the ecological footprint in India in the long run. They suggests that globalization can positively affect environmental sustainability in specific contexts. According to Pata et al. (2024), GLO reduces five out of seven EFP indicators in the BRICS countries, indicating a positive impact on environmental sustainability, particularly in areas like carbon and built-up land footprints. In summary, the effects of GLO on the EFP are mixed, with some countries experiencing a positive impact and others facing negative consequences, depending on local conditions and development stages.
Because of the Industrial Revolution, urbanization and industrialization (IND) have emerged as the primary avenues for social and economic development. Nevertheless, both strategies promote the rapid growth of fossil fuel use and produce significant amounts of CO2e and other GHG. Rapid economic expansion has caused emerging nations to urbanize and industrialize quickly since the 1970s. Sharp surges in the demand for fossil fuels and CO2 emissions also convoy these routes. IPCC (2007) reported that emissions increased from 21 to 38 Giga tons, representing a surge of roughly 80%, and made up 77% of all anthropogenic GHG emissions in 2004. Mentel et al. (2022) found that CO2e positively impacts the GDP share of industry, whereas the production of renewable power reduces CO2e. Governance quality factors can be very important in accomplishing sustainable environmental goals. A system of rules and principles that defend individual privileges, first-class services, and governmental regulations can be used to characterize institutions as having high institutional quality (Wu and Madni, 2021). The rule of law and corruption control are two institutional indicators that show how good an institution is. In addition to representing the competency of bureaucrats, the standard of public provision delivery, the legitimacy of government promises to programs, and the liberation of public servants from political influences, voice, and accountability also reflect the efficacy of government. Institutional strength and economic growth are mutually reinforcing, and environmental quality is tied to effective institutions that put the environment first (Singh et al., 2020). Khan A. A. et al. (2022) demonstrate that many countries’ quality institutions cannot sufficiently alleviate the negative influence of every environmental aspect and environmental protection. Sheraz et al. (2022) reported that institutional quality (IQ) decreases the negative environmental externality that FD has on the environment while globalization increases it. The beneficial environmental externalities produced by human capital and RE are increased by both globalization and institutional quality. Quito et al. (2023) reported that IND had a negative impact on the ecological footprint at the lower quantiles, meaning that it contributes more to environmental degradation in less developed or lower-income regions. However, IND had a positive impact at the upper quantiles, indicating that more advanced or developed industrialization might have a relatively lower environmental cost or potentially even some positive effects in highly developed contexts. Ullah and Lin (2024) revealed that IND was found to increase the ecological footprint, suggesting that as a country industrializes, its environmental degradation tends to rise due to higher energy consumption, emissions, and resource exploitation.
The significant role of energy in a nation’s economic development cannot be ignored (Azam, 2020; Khan S. et al., 2024). Still, excessive energy use has drawbacks contributing to global warming (Murshed and Tanha, 2021). The adverse influences of global warming have become far more obvious because of a 50% surge in energy usage throughout the last two decades (Akram et al., 2020). Ulucak and Khan (2020) claim that excessive energy use has put the quality of the environment on Earth in danger. Over the past 20 years, population increase, fast economic expansion, widespread industry, and transportation have been the leading causes of rising energy demand (Espa and Holzer, 2018; Ozturk and Bilgili, 2015; Ozturk and Acaravci, 2013). Nathaniel et al. (2020) study shows that urbanization, and financial development (FD) contribute to environmental damage. Moreover, the authors added that non-renewable energy (NEC) also harms environmental deterioration, and REC does not significantly contribute to environmental quality. Lu (2020) reported that real energy consumption surges the ecological footprint. Sharma and Das (2020) claim that NEC, per capita income, urbanization, fertility rates, and population density are the main contributors to ED. Lei et al. (2022) discovered that a negative shock to energy efficiency has a long-term useful effect on CO2e. Additionally, a positive shock in the use of REC has a negative significant effect on CO2. The significant role of energy in a nation’s economic development cannot be ignored (Azam, 2020). Still, excessive energy use has a drawback, contributing to global warming (Murshed and Tanha, 2021). The adverse influences of global warming have become far more obvious because of a 50% surge in energy usage throughout the last two decades (Akram et al., 2020).
In 1990, energy consumption in South Asia was relatively low, but with rising per capita incomes, energy demand has surged in recent years. Despite being a smaller and moderately developed country, Nepal consumes more energy than expected, with levels comparable to larger, more populous nations like India and Pakistan. Population growth in the region has further fueled economic expansion, increasing energy demands across consumer, commercial, and industrial sectors. India, contributing nearly 75% of South Asia’s CO2e. In 2012, India’s annual CO2 emissions per capita were 1.91 metric tons, compared to Pakistan’s 0.94, Bangladesh’s 0.39, Nepal’s 0.14, and Sri Lanka’s 0.63 metric tons (Imran et al., 2024). South Asia is among the most vulnerable regions to climate shocks, experiencing a “new climate normal” characterized by intensifying heat waves, cyclones, droughts, and floods. These climate extremes are challenging the adaptive capacity of governments, businesses, and citizens. Over the past two decades, more than half of the region’s population, 750 million people across Afghanistan, Bangladesh, Bhutan, India, Maldives, Nepal, Pakistan, and Sri Lanka, have been affected by one or more climate-related disasters. The worsening climate conditions could severely impact the living standards of up to 800 million people in a region already home to some of the world’s poorest and most at-risk populations (World Bank Group, 2024). Despite these challenges, South Asia is at the forefront of climate-smart innovations, including community-driven approaches to coastal resilience, large-scale adoption of renewable energy, and regenerative forestry practices. Accelerating and expanding these initiatives is essential to strengthening resilience against the rapidly warming climate while contributing to regional emission reductions (World Bank Group, 2024). Since the global financial crisis in 2008, South Asia has witnessed remarkable economic growth. Over the past decade, India achieved a growth rate exceeding 9%, Pakistan grew by 7%, Bangladesh and Sri Lanka by 6%, and Nepal by 4%. Strong economic growth and poverty reduction have significantly improved GDP per capita across South Asian countries since 2000. Energy consumption, closely linked to economic growth, reflects lifestyle trends and rising energy demand, particularly for renewable energy, which has further stimulated economic development (Imran et al., 2024). RE has significant potential in the South Asian region, with economies possessing diverse cleaner energy sources, such as wind, solar, and hydropower, which are essential for sustainable growth. However, rapid industrialization and GDP growth have contributed to the depletion of energy resources, leading to a rise in ecological footprints. To address this challenge, South Asian economies have been investing in renewable energy solutions, including wind, solar, and hydropower, to reduce their dependence on fossil fuels like oil, gas, and coal (Ma et al., 2023).
This paper investigates the impact of globalization, industrialization, IQ, and RE on EFP. Based on the above discussions, this study will test the following hypothesis:
H1:. Globalization has a positive effect on the ecological footprint.
H2:. Industrialization has a positive effect on the ecological footprint.
H3:. There is a negative effect on institutional quality on ecological footprint.
H4:. Renewable energy has a negative effect on the ecological footprint.
It examines the challenges of promoting RE, and the strategies and policies governments implement to foster its adoption and support sustainable environmental management. By analyzing the experiences of various South Asian countries, the study seeks to identify lessons and best practices that can be applied to other regions facing similar ecological challenges. For example, Pakistan has significant RE potential, such as solar and wind, while India holds the most significant RE resources in South Asia, followed by Sri Lanka and Pakistan. However, as living standards improve during later stages of GDP growth, countries focus more on RE demand, EFP reduction, and energy efficiency (Sun et al., 2023; Qing et al., 2024).
Based on the aforementioned arguments and findings, this study significantly contributes to the existing literature in five ways. Firstly, the primary objective of this research is to investigate the collective influence of globalization, industrialization, institutional quality, and renewable energy on the ecological footprint in SAARC nations, while previous studies ignored it. By exploring these interconnected variables, the study provides a comprehensive understanding of their joint effects on environmental sustainability in the region. Secondly, this study specifically examines the relationship between globalization, financial development, and the ecological footprint within the context of SAARC nations. By focusing on this particular nexus, the research highlights the unique dynamics and challenges faced by countries in this region, contributing to a more nuanced understanding of the environmental impacts of economic globalization and financial development. Thirdly, another key contribution of this study is examining how institutional quality and renewable energy influence the ecological footprint. While prior studies have often overlooked the role of institutional quality or renewable energy, this research sheds light on how these factors can mitigate or exacerbate environmental degradation, offering valuable policy insights for the SAARC region. Fifthly, this study employs more advanced econometric techniques, such as second-generation econometrics, to address heterogeneity and cross-sectional dependency issues, which are common in panel data analyses. In contrast to earlier research that relied on traditional econometric methods, these cutting-edge techniques allow for a more robust and accurate analysis of the relationships between globalization, industrialization, institutional quality, renewable energy, and ecological footprints in the region.
The study’s remaining sections are arranged as follows: Section 2 displays a literature review. Section 3 provides the data and empirical technique. Section 4 presents the findings and discussion, while Section 5 discusses the study’s conclusion.
2 Literature review
2.1 Nexus between globalization and environment
Van Tran et al. (2024) examined the nexus between GLO and EFP in Indonesia from 1971 to 2019 using the Asymmetric ARDL. They found that GLO positively affects EFP. Eweade et al. (2024) used the ARDL methods from 1970 to 2015 in the United Kingdom. The results of the co-integrating regression tests and the ARDL model show that economic expansion, energy consumption, and GLO all benefit the EFP. Sabir and Gorus (2019) found that these economies’ decisions to embrace globalization have worsened their environmental conditions because their EFP numbers have increased along with increased globalization activities. On the other hand, Ibrahiem and Hanafy (2020) showed that GLO effectively lowered Egypt’s ecological footprint levels using yearly data from 1971 to 2014. Sabir and Gorus (2019) found that GLO positively affected EFP in SAARC countries from 1975 to 2017. Ansari et al. (2021) found that GLO affects the EFP positively for the data period 1991–2016. Yilanci and Gorus (2020) observed that EFP Granger causes economic, GLO and trade MENA counties using data period 1981–2016. Farooq et al. (2022) reported that GLO aids in reducing environmental deterioration. The positive impact of GLO is also supported by the panel quintile regression results, particularly for economies with low levels of CO2e today. The breakdown of GLO into several categories demonstrates that this conclusion cannot be applied to all features of globalization. This study provides compelling evidence that economic GLO harms the environment’s ability to maintain itself. It has been shown, however, that political globalization may be utilized to raise environmental standards. Sun et al. (2023) examined the nonlinear impacts of energy consumption and GLO on the ecological footprint in BRICS countries. Using the quantile-on-quantile approach, the study found that energy consumption had a positive effect on the EFP at most quantiles in China and India, whereas in South Africa, the effect was negative at most quantiles. GLO positively influenced the ecological footprint at most quantiles in China and South Africa, while Brazil, India, and Russia experienced a negative impact at most quantiles. Villanthenkodath and Pal (2023) investigated the impact of economic GLO on the ecological footprint in India from 1990 to 2018, while also considering economic growth and energy consumption. Employing the autoregressive distributed lag (ARDL) approach and dynamic ARDL simulation, the study confirmed a long-run relationship among the variables. The findings revealed that economic globalization and energy consumption reduce the ecological footprint in the long run, whereas economic growth increases it. Pata et al. (2024) analyzed the effects of income, GLO, and technological innovation on the ecological footprint and its subcomponents in BRICS countries for the period 1992–2020. Using the panel LM cointegration test and the common correlated effects estimator, the study found that economic growth increases the EFP, while globalization reduces five out of the seven ecological footprint indicators. Technological innovation, however, was found to have no significant impact on the EFP indicators.
2.2 Nexus between industrialization and environment
According to Li and Lin (2015), industrialization was linked to higher energy demand and modified energy consumption patterns in the infancy of economic growth, which caused higher CO2e. Mentel et al. (2022) discovered that the industry’s GDP share significantly impacts CO2e, whereas CO2e are reduced by the production of REC in Sub-Saharan Africa. Azam et al. (2022a) studied the nexus between IND and CO2e from OPEC economies. They observed that environmental pollution is increased by urbanization, industrialization, and energy usage in six OPEC countries for the data period 1971– 2018. Quito et al. (2023) analyzed the global impacts of industrialization, RE, urbanization, and foreign direct investment (FDI) on the ecological footprint over the period 1995–2017. Using Westerlund cointegration and quantile regression techniques. The findings revealed that economic development increased environmental degradation across all quantiles globally, whereas urbanization and renewable energy reduced degradation, with the most significant effects observed in the upper quantiles. Industrialization negatively impacted the lower quantiles but had a positive impact on the upper quantiles. Additionally, FDI inflows were found to have a detrimental effect at the 40th, 50th, 60th, and 80th quantiles, supporting the pollution haven or halo hypothesis (PHH). The study emphasized the need for sustainable economic growth processes, stricter environmental laws for FDI inflows, and sustainable urbanization and industrialization policies. Ullah and Lin (2024) investigated the relationships between financial structure, industrialization, urbanization, export diversification, and the ecological footprint in Pakistan from 1985 to 2022. By employing the dynamic autoregressive distributed lag (DARDL) approach, the study revealed that financial structure followed an inverted U-shaped pattern in relation to the ecological footprint, indicating that an effective financial structure reduces environmental degradation. The results also showed that industrialization and urbanization increased the ecological footprint, while export diversification decreased it. The study concluded that the government should promote sustainable development by encouraging eco-friendly technologies, optimizing financial resource allocation, and enhancing the financial system’s role in supporting environmentally sustainable growth.
2.3 Nexus between financial development and environment
Ashraf et al. (2022) analyzed the nexus between financial development (FD) and EFP in a worldwide sample of 124 economies using the two-step GMM. They found that FD has an inverted-U-shaped relationship with the EFP, permitting the initially detrimental effect on the environment to revert to beneficial effects. In their study, Tamazian et al. (2009) found that the Kuznets environmental assumption is still in place in the BRICS nations. Their results imply that financial openness and liberalization are the key drivers of CO2 reduction. According to their study, measures promoting economic openness and liberalization to draw more FDI for research and development might lessen ED in the nations under consideration. Another study by Tamazian and Rao (2010) found that economic liberalization plays a key role in ED, while there is a lack of excellent institutional efficiency. Khalid et al. (2021) examined the determinants of environmental quality for the SAARC region for data period 1990 –2017. Compared to a group of SAARC nations, Bangladesh and Sri Lanka show a much higher pollution level as a result of financial growth, according to country-specific statistics. However, it enhances Nepal’s environmental quality. Baloch et al. (2019) indicate that financial growth favors EFP, which suggests that financial development causes a rise in EFP in BRI nations. Aslam et al. (2023) examined the impact of FD on the ecological footprint in 43 middle-income and 45 high-income countries over the period 1990–2020. Using panel quantile regression to address data outliers and non-normality, the study found an inverted U-shaped relationship between financial development and ecological footprint in the 25th and 50th quantiles, indicating that advanced financial development reduces ecological footprint. Furthermore, countries such as China, Australia, Denmark, Italy, Germany, Japan, France, South Korea, Netherlands, Luxembourg, Singapore, Switzerland, Spain, the United Kingdom, and the United States have achieved higher financial development, which has begun to lower their ecological footprint. Industrialization was found to increase the ecological footprint, while urbanization and export diversification exhibited mixed effects across countries and quantiles. The study recommends that other countries improve their financial sectors to reduce their ecological footprint. Saqib et al. (2024) analyzed the effects of environmental innovations, financial development, green growth, and energy use on the ecological footprint in the ten countries with the highest ecological footprints from 1990 to 2019. Using a panel causality approach, the study found that environmental innovations, green growth, and renewable energy positively impact the ecological footprint, while financial development and non-renewable energy use exacerbate environmental degradation. The results demonstrated bidirectional causality between environmental innovations, green growth, renewable and non-renewable energy, and the ecological footprint, while a unidirectional causal relationship was observed from financial development to ecological footprint and green growth.
2.4 Nexus between institutional quality and environment
Azimi and Rahman (2023) examined the nexus between institutional quality (IQ) and EFP in G20 economies. They found that IQ reduced the EFP. The empirical results of Obobisa et al. (2022) show that the use of REC and green technology has a considerable negative influence on CO2e. On the other hand, CO2e is positively impacted by the IQ, the use of fossil energy and economic expansion in African nations. Khan H. et al. (2022) observed that many nations’ quality institutions are now unable to sufficiently reduce each environmental factor’s harmful effects and preserve the environment 2002–2019. Sheraz et al. (2022) study results show that institutional quality decreases the negative environmental externality that FD has on the environment while globalization increases it in BRI economies. The useful environmental externalities produced by human capital and REC are increased by both globalization and institutional quality. Azimi and Rahman (2023) investigated the impact of IQ on the EFP in G20 countries during the period 2000–2022. The results revealed that IQI significantly reduces EFP, with the transparency index showing the highest impact. Additionally, IQI was found to effectively moderate the relationships between EFP, financial development, human development, economic growth, and energy consumption, while being insignificant in reducing the negative effects of globalization. Dam et al. (2024) analyzed the role of green growth and IQ on environmental sustainability by examining CO2 emissions, ecological footprint, and the inverted load capacity factor in OECD countries. Employing three separate models, the study found that green growth significantly reduces CO2e, EFP, and inverted load capacity factor in the long run, with reductions of 0.563%, 0.373%, and 0.198%, respectively, for a 1% increase in green growth. Institutional quality was shown to have a significant positive impact on environmental degradation in the long run, while population effects on sustainability were found to be significant but mixed. Addai et al. (2024) examined the dynamic relationship between RE, IQ, and ecological footprint in the Next 11 countries from 1990 to 2022. Using the cross-sectionally augmented autoregressive distributed lag (CS-ARDL) method, the study demonstrated that renewable energy reduces the ecological footprint, provided institutional quality positively influences pro-environmental outcomes. The results highlighted that while economic growth often exacerbates environmental degradation, improved institutional quality and increased investment in renewable energy can help achieve environmental sustainability goals.
2.5 Nexus between renewable energy and environment
Using the multiple threshold model, Li et al. (2022) analyzed the connection between RE and EFP in 120 global countries from 1995 to 2014. They found that NRE has a negative effect on EFP while RE has a positive effect on EFP. Sahoo and Sethi (2021) found feedback links between the EFP and economic development, GLO, and natural resource availability in developing nations from 1990 to 2016. The findings of Nathaniel and Khan (2020) imply that urbanization, economic expansion, and FD all contributed to environmental deterioration in the MENA region during 1990–2016. Further, non-renewable energy (NEC) significantly worsens the environment, while RE does not considerably influence environmental quality. Lu (2020) reported that real income, energy consumption and trade openness are have positive effect on EFP in 13 Asian economies between 1973 – 2014. Sharma et al. (2020) indicated that NEC, per capita income, and population density were the main causes of ED in South Asia from 1990 to 2015. The empirical findings of Dogan et al. (2020) show the significance of energy intensity and energy structure as key factors in ED for BRICS economies during 1980 – 2014. Lei et al. (2022) found that a negative shock to energy efficiency has a long-term beneficial effect on CO2e. Moreover, positive shock in the use of REC has a negative significant effect on CO2e, but negative shock in the use of REC results in an increase in pollutant emissions over time. A positive shock to using REC and energy efficiency has a short-term, beneficial negative impact on CO2e. Appiah et al. (2023) examined the effectiveness of environmental policy, RE, and innovation on reducing the EFP in 29 OECD countries from 1990 to 2020. Using the CS ARDL methods. The study found that environmental policy, innovations and RE significantly reduces EFP. However, population density and industrialization were found to increase EFP. Roy (2023) investigated the effects of FDI, RE and NRE on the EFP in India from 1990 to 2016. Using the ARDL and the study found that FDI, RE, and GDP reduce EFP in the long term, while non-renewable energy consumption and trade openness increase it. Azimi and Rahman (2024) explored the nexus between RE and ecological footprint in 74 developing countries from 2000 to 2022 using a dynamic panel threshold regression method. The results revealed a non-linear relationship between RE and EFP, with significant thresholds for fiscal capacity (1.870), human development index (0.736), and institutional quality index (0.311), above which renewable energy effectively reduces EFP. Below these thresholds, the impact becomes insignificant.
2.6 Theoretical review and conceptual framework
There are three theories of environmental quality (EQ): such as urban environmental transition theory (UET), compact city theory (CCT), and ecological modernization theory (EMT) (Azam et al., 2022b). The UET clarifies the fact that significant industrialization leading to high emissions is a common feature of metropolitan centers. However, the idea also suggested that because urban residents are often wealthier than those who live in rural regions, they are more likely to be concerned about promoting environmental quality and may take many steps to reduce pollution. The CCT claims that public infrastructure, including the water supply, healthcare, education, and transportation systems, is harmed by urbanization. According to CCT, when the economy grows, there is a greater chance of environmental harm occurring. Strategies for planned urbanization may be helpful in reducing these negative consequences. The idea also proposed that governments should shift from being increasingly dependent on the industrial sector to service-based economies in order to reduce the increased risks of environmental damage (Azam et al., 2022b). Figure 1 shows the conceptual framework that explains how combining institutional quality and renewable energy reduces the ecological footprint. The combination of IQ and renewable energy significantly lessens the EFP through a multi-channel approach. Strong policies, effective governance, investment in research and development, and public awareness form the backbone of IQ, facilitating the adoption of RE. Policy and regulation channels provide financial incentives, legal frameworks, and international collaboration to support clean energy initiatives. Innovation and research focus on developing advanced technologies and modernizing grid infrastructure to enhance energy efficiency. Education and advocacy promote public awareness, community involvement, and the implementation of energy-efficient building standards. These actions lead to increased renewable energy usage, lower carbon emissions, and ultimately, the reduction of the ecological footprint and climate change mitigation.
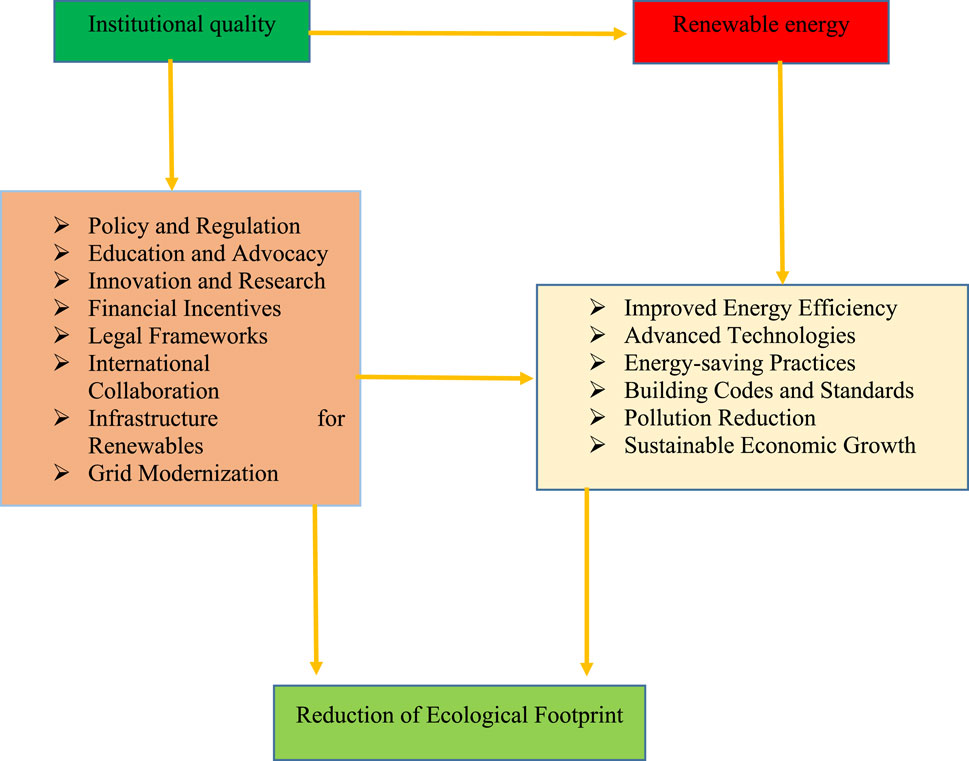
Figure 1. Conceptual Framework.
2.7 Literature summary and literature gap
The nexus between GLO and EFP. Van Tran et al. (2024) and Eweade et al. (2024) found that GLO positively affects the EFP, while Sabir and Gorus (2019) reported that globalization worsens environmental conditions. Ibrahiem and Hanafy (2020) and Farooq et al. (2022) found that GLO helps reduce environmental degradation, but its effects vary by country and type of GLO. Sun et al. (2023) and Pata et al. (2024) highlighted the complex, nonlinear relationship between GLO, energy consumption, and EFP, with GLO reducing specific environmental impacts. Villanthenkodath and Pal (2023) found that economic GLO lowers EFP in India while economic growth increases it, emphasizing the need for balanced policies. The nexus between IND and EFP. Xu and Lin (2015) and Li and Lin (2015) found that IND drives environmental deterioration by increasing energy demand and CO2 emissions. Liu and Bae (2018) showed that rapid IND in China led to severe environmental damage. Quito et al. (2023) and Azam et al. (2022b) reported that IND worsens environmental degradation, with effects varying across income levels and regions, while renewable energy and urbanization can mitigate damage. Ullah and Lin (2024) confirmed that IND increases the EFP in Pakistan, suggesting sustainable policies and eco-friendly technologies to reduce environmental harm. The nexus between FD and EFP. Ashraf et al. (2022) and Aslam et al. (2023) found an inverted U-shaped relationship between FD and the EFP, where advanced FD helps reduce environmental degradation. Tamazian et al. (2009) and Tamazian and Rao (2010) highlighted the role of economic liberalization and financial openness in lowering CO2 emissions, while Khalid et al. (2021) reported mixed effects of FD on environmental quality in SAARC countries. Baloch et al. (2019) found that FD increases EFP in BRI nations. In contrast, Saqib et al. (2024) showed that FD and non-renewable energy worsen environmental conditions, but environmental innovations and green growth can mitigate the impact.
The nexus between IQ and EFP. Azimi and Rahman (2023) and Addai et al. (2024) found that IQ reduces the EFP and enhances the positive impact of renewable energy on environmental sustainability. Obobisa et al. (2022) and Khan H. et al. (2022) reported mixed findings, with IQ reducing CO2 emissions in some cases but failing to mitigate environmental degradation in others, particularly in Africa. Sheraz et al. (2022) showed that IQ offsets the adverse environmental effects of FD but amplifies GLO’s impact in BRI economies. Dam et al. (2024) highlighted that while green growth improves environmental outcomes, IQ may not always reduce long-term environmental degradation, suggesting a need for stronger institutional frameworks and policies. The nexus between RE and EFP. Li et al. (2022) and Azimi and Rahman (2024) found that RE reduces the EFP, but its effectiveness depends on factors like fiscal capacity, human development, and IQ. Nathaniel et al. (2020) and Sharma et al. (2021) reported that non-renewable energy (NRE) worsens environmental degradation, while RE has limited or varying impacts. Appiah et al. (2023) and Roy (2023) highlighted that RE, along with environmental policies and innovation, improves environmental quality, though IND and trade openness may offset these gains. Lei et al. (2022) showed that positive RE and energy efficiency shocks reduce CO2 emissions, emphasizing the importance of consistent RE adoption for sustainability (Table 1).
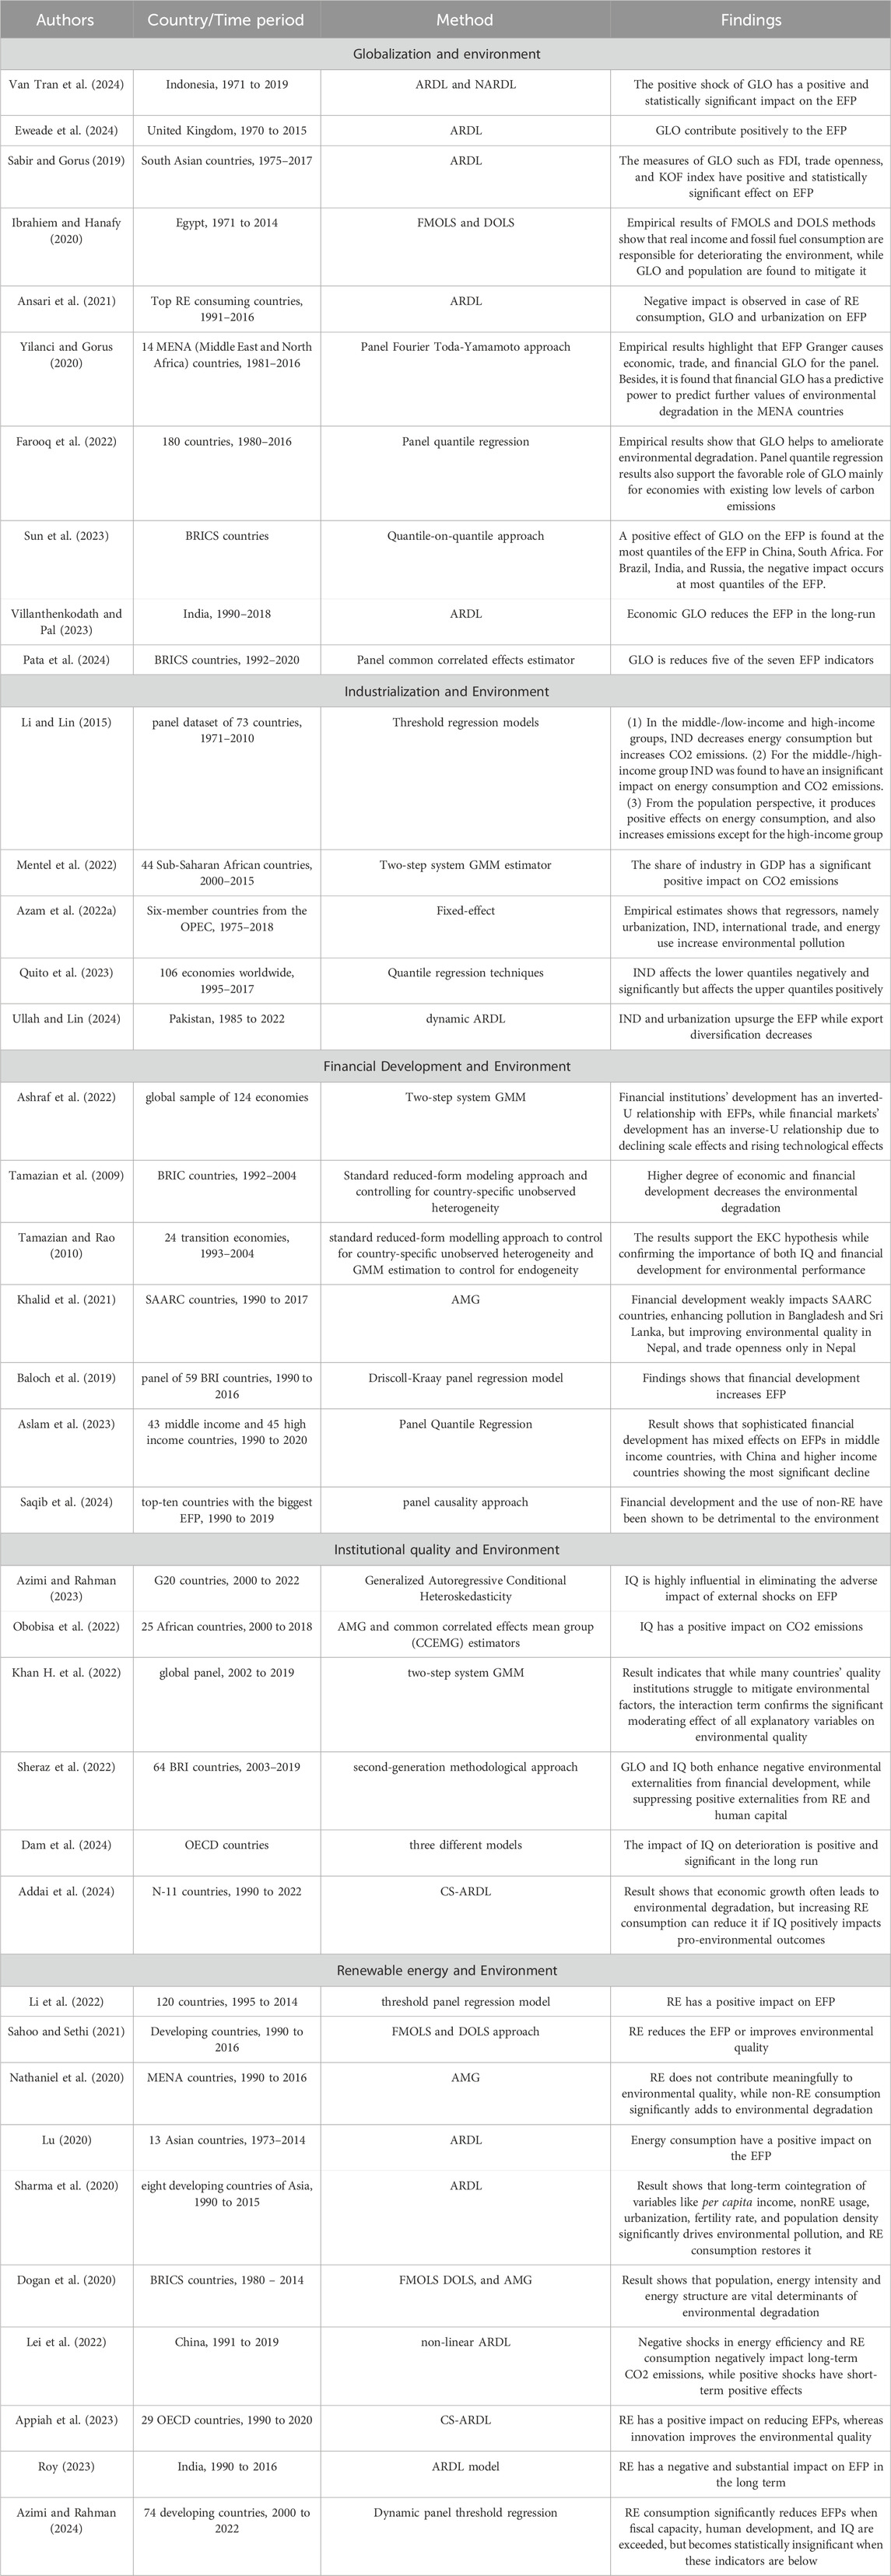
Table 1. Literature summary.
Therefore, the following gaps in the empirical literature may be found after reviewing the pertinent studies in the available literature: (1) it is evident that not many publications have used the ecological footprint for measuring environmental quality in significant samples of SAARC countries (2) There is little research on panel studies of the connection between environmental impact, industrialization, FD, institutional quality and renewable energy in SAARC countries (3) this study make an index for institutional quality from governance indicators for SAARC countries (4) The ecological footprint of industrialization, FD, and institutional quality has generally been the subject of individual (isolated) research in the past, with little attention paid to the combined (interaction) effects of these factors. In response to this context, this study utilizes panel data from 1996 to 2022 to mitigate the research gaps in the forgoing studies.
3 Materials and methods
3.1 Model specification
To examine the impact of GLO, IND on EFP for six SAARC countries and the role of IQ and RE. The empirical model of this study derived from prior studies:
where Equation 1, EFP, IQ, FD, GLO, IND, GDP, and RE, represents ecological footprint, institutional quality index, financial devolvement, globalization, industrialization, Gross domestic product and renewable energy respectively. Where the subscript i, t and
3.2 Estimation Strategy
Figure 2 depicts the estimating approach used in this study:
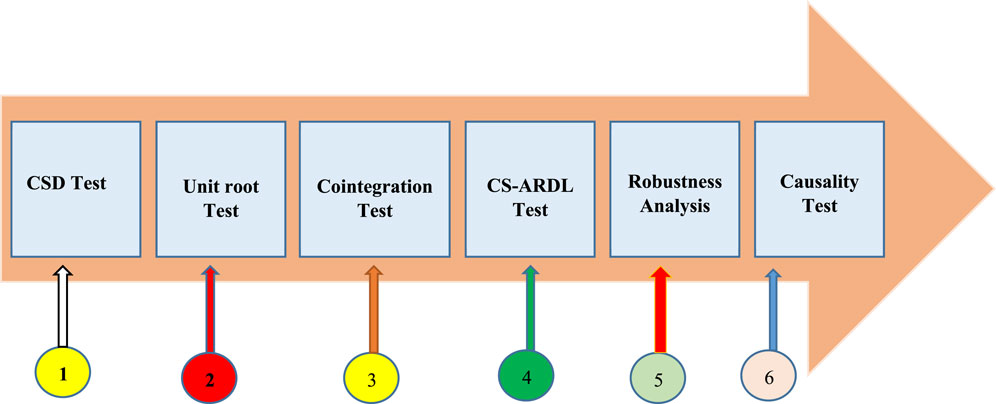
Figure 2. Estimation strategy.
3.2.1 Cross-sectional dependence tests
Cross-sectional dependency (CSD) refers to the phenomenon where observations, e.g., countries, regions, or entities in a dataset, correlate. This dependency arises due to shared shocks, spatial proximity, or economic interdependencies. Ignoring the CSD can lead to biased and inefficient estimates in panel data analysis. We used CD tests and the Lagrange multiplier (LM) to examine the CSD test. The formulae are given in Equations 2, 3, respectively.
where K is sample size, T is time period and
3.2.2 Panel unit root tests
After the CSD, a panel unit root test is used to determine stationarity, essential for identifying its statistical properties. Stationarity ensures that the series’ mean, variance and autocovariance remain constant over time, critical for reliable regression analysis and forecasting. The test also helps prevent spurious results in models involving non-stationary data. The traditional OLS estimators will produce erroneous estimates if the order of integration is ignored. Cross-sectional dependence (CD) causes the unit root of Levin et al. (2002) to provide estimates that are inaccurate. In this regard, the panel unit root tests created by CIPS by Pesaran (2007) are used in this work. See Equations 4, 5.
In Equation 6,
3.2.3 Cross sectional autoregressive distributed lag (CS-ARDL) model
The Cross-Sectional Autoregressive Distributed Lag (CS-ARDL) model is applied when variables in a panel dataset exhibit mixed orders of integration, i.e., some are stationary at the level I (0), and others at the first difference I (1). This flexibility allows CS-ARDL to estimate both short- and long-run relationships without requiring all variables to be integrated in the same order. Examine the Equation 6 given the conventional panel ARDL. Where in this case
Results are biased when CD is present in the standard Panel ARDL described in Equation 6 (Phillips and Sul, 2003). Consequently, the issue of the presence of CD is addressed by employing an alternative estimating method called the CS-ARDL method. The CS-ARDL is superior to other panel ARDL models because it effectively addresses CSD by incorporating cross-section averages of variables. Unlike standard panel ARDL models, it provides robust and efficient long-run estimates even when residuals are correlated across units. Moreover, CS-ARDL mitigates bias from unobserved common factors, ensuring more reliable inference in heterogeneous panel settings. The CS-ARDL assumes CSD among panel units, which is addressed using cross-section averages of variables. Long-run slope homogeneity is required to ensure consistent estimation across units. Additionally, the model assumes stationarity or weak dependence in error terms to derive valid inferences. The CS-ARDL’s limitation is that it requires a large time dimension (T) for reliable estimation, making it less effective in short panels. It may also overcorrect for cross-sectional dependence, reducing efficiency when dependence weakens. In addition, the model is computationally complex and sensitive to the correct specification of common factors. Chudik and Pesaran (2013) stated that additional lags for the cross-sectional averages of the regressors should be included to the ARDL specification in Equation 6.
The revised formula, which now includes the cross-sectional lag factor, is as follows:
where in Equation 7,
Equation 8 can also be expressed in error-correcting form as shown below:
where
3.2.4 Panel granger causality
The CS-ARDL model does not gives the causality estimates amongst the variables. Therefore, in this study, the) panel causality test Dumitrescu and Hurlin (2012) is also applied. The following Equations 9–20, shows the basic specification of DH test.
So, therefore,
For the robustness analysis, we used the Fully Modified Ordinary Least Squares (FMOLS) and Dynamic Ordinary Least Squares (DOLS) estimators to estimate long-run relationships. FMOLS corrects for endogeneity and serial correlation in the residuals by using non-parametric adjustments, providing robust and efficient estimators for long-run parameters (Phillips and Hansen, 1990). DOLS extends the ordinary least squares by including leads, lags, and contemporaneous differences of the explanatory variables to address endogeneity and autocorrelation, ensuring unbiased estimators (Stock and Watson, 1993).
3.3 Variables description and data source
Data for the panel of six SAARC economies (Sri Lanka, Pakistan, Nepal, India, Bhutan, and Bangladesh) from 1996 to 2022 are used for analysis. Table 2 lists the variables, along with their symbols, units of measurement, and data sources. The IQ index emerged from six governance indicators, such as Control of Corruption (CC), Government Effectiveness (GE), Political Stability and Absence of Violence/Terrorism (PSAV), Regulatory Quality (RQ), Rule of Law (RL) and Voice and Accountability (VA) by using the principal component analysis (PCA). The same index was used by Obobisa et al. (2022), Sheraz et al. (2022), Uddin et al. (2023a), Uddin et al. (2024), and Cui et al. (2024). The results of the PCA are provided in Table 3. The first principal component (Comp1) accounts for 61.2% of the variation in the dataset, making it the most suitable component for developing the IQ index for this study.
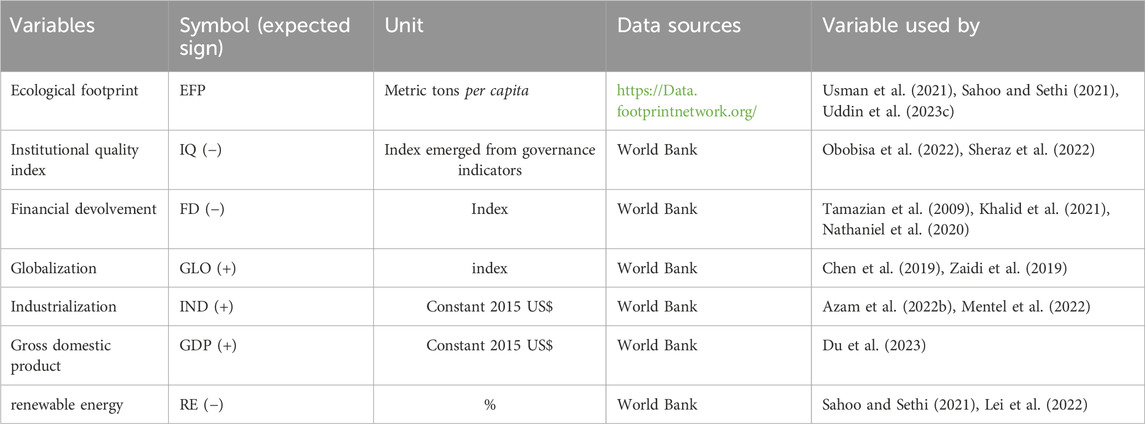
Table 2. Data sources and variables description.
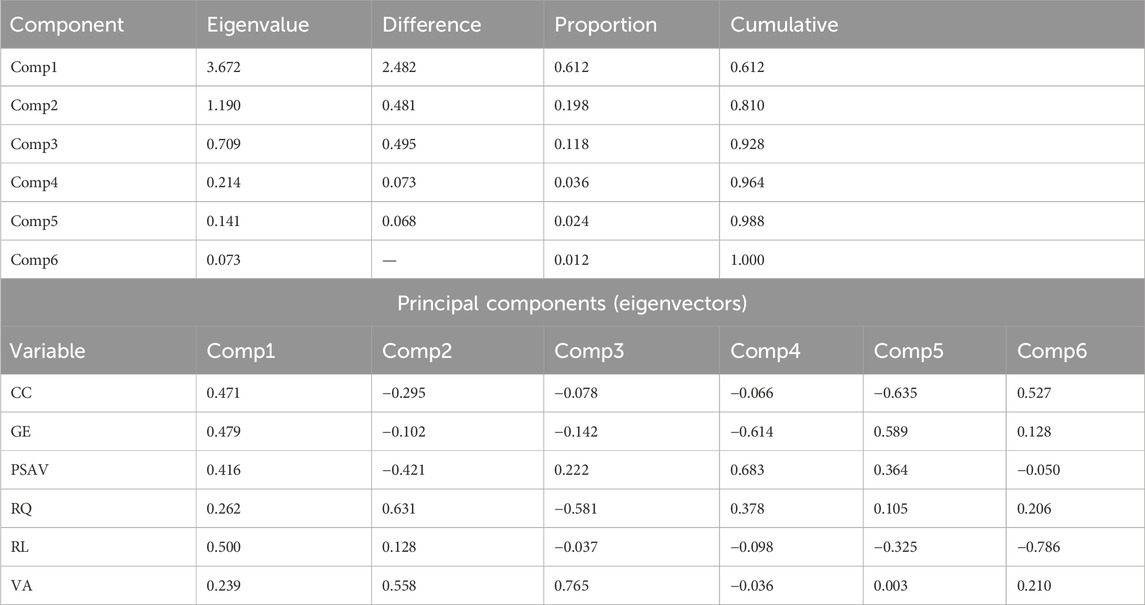
Table 3. PCA output of Institutional quality index.
4 Results and discussion
4.1 Basic statistics
Table 4, shows the descriptive statistics, the mean value of EFP, IQ, FD, GLO, IND, GDP, and RE are 0.841, −0.460, 0.244, 46.248, 23.376, 7.162 and 4.053 respectively. Whereas the standard deviation of EFP, IQ, FD, GLO, IND, GDP, and RE are 0.815, 0.456, 0.108, 10.431, 2.180, 0.554 and 0.354 respectively. The Jarque-bera statistics reveal that only IND is normally distributed.
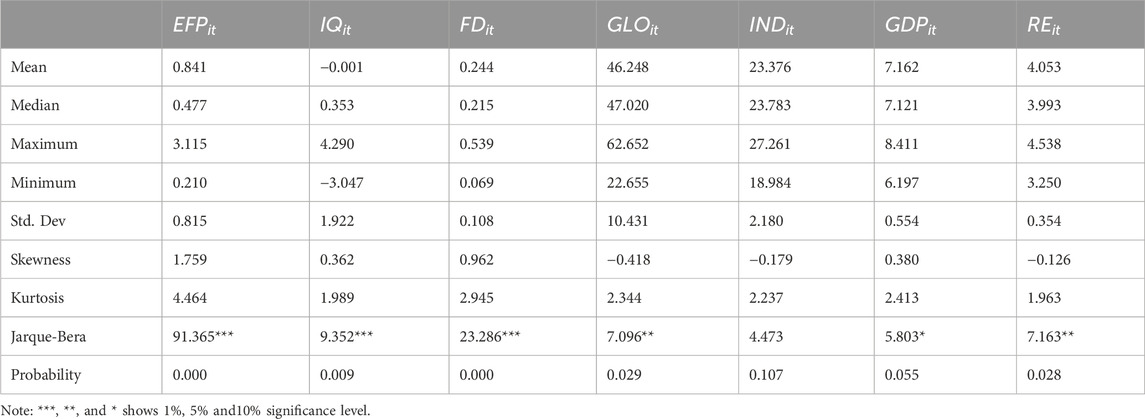
Table 4. Descriptive statistics.
4.2 Cross-sectional dependency and panel unit root tests estimates
Table 5 presents the estimates of the CSD test, indicating that all statistics reject the null hypothesis of no CSD at the 1% significance level. Table 6 displays the estimates of the LLC and CIPS tests at both level and first difference. The results from the LLC test suggest that only GLO is stationary at level. Meanwhile, the CIPS test indicates that EFP and GLO are stationary at level, while all other variables become stationary at first difference.

Table 5. Cross-sectional dependence tests results.
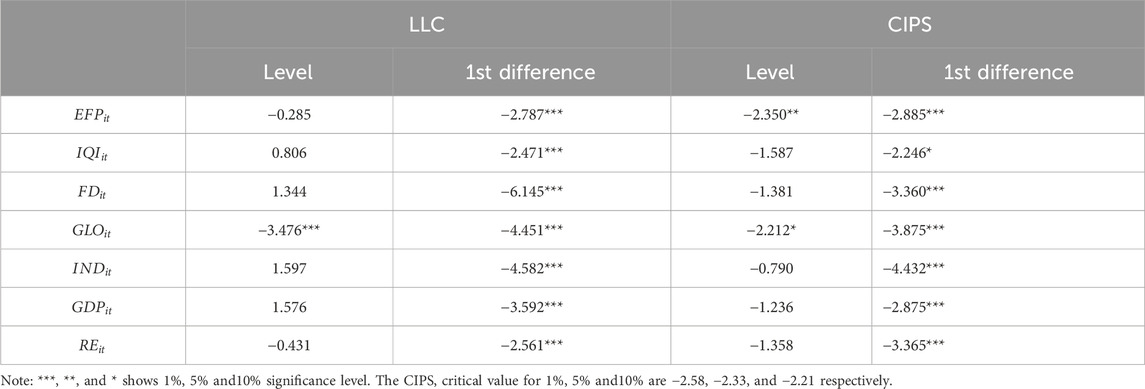
Table 6. Unit root test.
4.3 CS-ARDL estimates
Table 7 shows the panel CS-ARDL findings. In the long run, IQ, FD, and RE have a negative effect on ecological footprint, while GLO, IND, and GDP positively affect EFP. The coefficient of IQ is −0.02192, a 1-unit increase in institutional quality that leads to a 0.02% reduction in the ecological footprint, highlighting the role of governance in environmental sustainability. IQ reduces environmental degradation by enforcing strong regulations and ensuring industries comply with pollution controls and sustainability standards. It curbs corruption and enhances transparency, preventing the misuse of environmental funds and ensuring efficient policy implementation. Additionally, effective governance promotes green innovation and RE adoption, driving sustainable economic growth while reducing ecological harm. Sheraz et al. (2022) stated that institutional quality decreases the negative environmental externality in BRI countries. Effective institutions play an important role in avoiding environmental costs. Government stability is critical for the quality of institutional performance and, as a result, for productive environmental management. Obobisa et al. (2022) reported that IQ negatively impacts CO2e in African countries. On the contrary, Khan A. A. et al. (2022) stated that many nations’ institutions’ quality can now not sufficiently reduce each environmental factor’s harmful effects and preserve the environment.
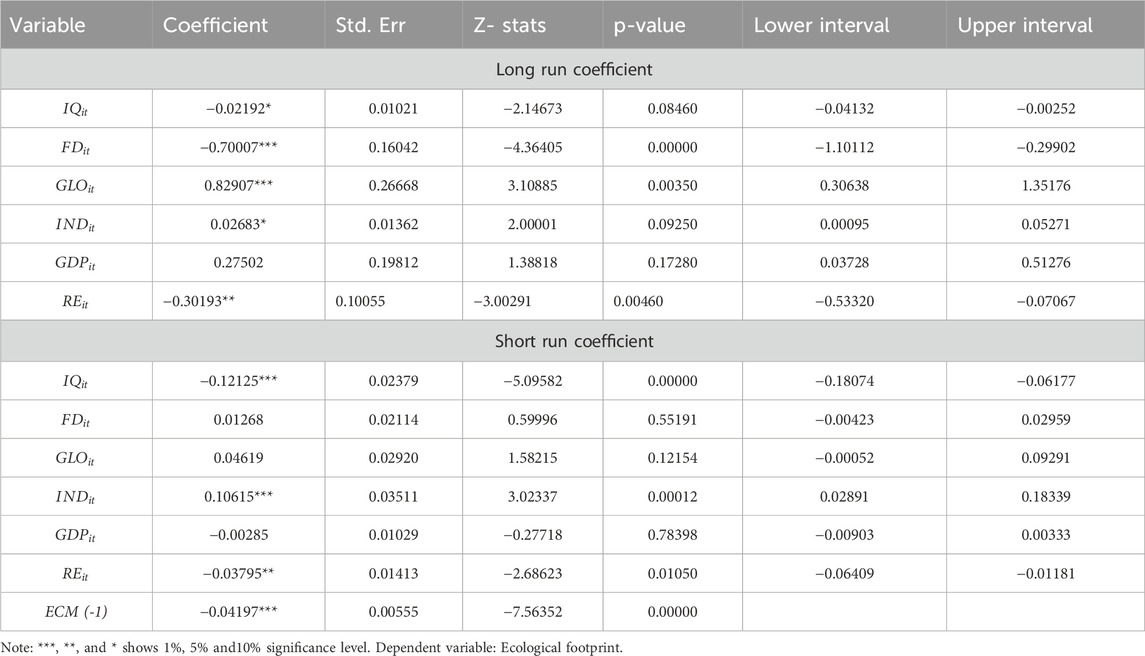
Table 7. CS-ARDL parameter estimates.
The coefficient of FD is negative, indicating that a 1% rise in FD leads to reduced EFP by 0.70007%. Tamazian and Rao (2010) showed that economic liberalization results in environmental degradation and a lack of excellent institutional efficiency. Khalid et al. (2021) found that in the case of Bangladesh and Sri Lanka, financial growth greatly raises the degree of pollution. However, it enhances Nepal’s environmental quality. Contrarily, financial growth favors the ecological footprint in BRI nations (Baloch et al., 2019). On contrary, Baloch et al. (2019) indicated that financial growth has a favorable effect on EFP, which suggests that financial development causes a rise in EFP in BRI nations. EFP and economic growth are positively correlated in BRI countries. In contrast, financial development contributes to environmental deterioration by encouraging and enabling financing for purchasing mechanical machinery, electrical gadgets, vehicles, and residences. These facilities let company owners expand their operations and set up new equipment and plants, which worsen environmental quality by increasing the concentration of CO2e in the atmosphere (Majeed and Mazhar, 2019).
The coefficient shows that Globalization positively affects EFP, indicating that a 1% rise in Globalization leads to rise the EFP by 0.82907%. Globalization revolutionized the world over the past decade, and nations are now linked socially, economically, and politically. These aspects impact the environment (Dreher et al., 2008). On the contrary, Figge et al. (2017) reported that economic GLO leads to greater consumption and imports with a negative environmental impact. According to Kirikkaleli et al. (2021) reported that GLO donates to environmental deterioration by raising Turkey’s EFP. Similar conclusions were reached for the developing countries of South Asia by Sabir and Gorus (2019), who found that these economies’ decisions to embrace Globalization have worsened their environmental conditions because their EFP numbers have increased along with increased globalization activities. In contrast, Farooq et al. (2022) highlight that GLO aids in reducing environmental deterioration.
The coefficient of industrialization is positive, which indicates that a 1% rise in the IND led to a rise in EFP of 0.02683%. As a consequence of the industrial revolution, industrialization has emerged as the primary path towards economic and social modernization. Nevertheless, both strategies promote the rapid growth of fossil fuel use and lead to significant CO2e and other GHG emissions. Sharp surges in the demand for fossil fuels and CO2E also convoy these routes. According to Li and Lin (2015), industrialization was linked to higher energy demand and modified energy consumption patterns at the early economic growth stages, leading to higher CO2E. Mentel et al. (2022) discovered that the IND positively impacts CO2e. The coefficient of GDP has a positive effect on EFP but statistically insignificance; more specifically, a 1% surge in the GDP led to a rise in EFP of 0.27502%. However, the statistical insignificance of this coefficient indicates that the relationship is not strong enough to be considered meaningful or reliable. An insignificant GDP coefficient for EFP may indicate non-linear effects, where GDP impacts the footprint differently at various income levels (e.g., the Environmental Kuznets Curve). It could also result from omitted variable bias, missing factors, and threshold effects. The finding is consistent with the line of (Du et al., 2023).
The coefficient of renewable energy is negative, indicating that a 1% surge in RE reduces CO2e by 0.431%. Renewable energy reduces the ecological footprint by decreasing reliance on fossil fuels, lowering carbon emissions and environmental degradation. It promotes sustainable resource use, reducing deforestation, air pollution, and water consumption. By replacing conventional energy sources, renewables help preserve ecosystems and mitigate climate change. The usage of renewables lowers habitat devastation caused by mining and drilling. Furthermore, RE technologies often demand less land and water than traditional energy sources. The finding is consistent with the finding of Appiah et al. (2023) that renewable energy contributes to reducing the ecological footprint in 29 OECD countries. Roy (2023) examined the impact of RE on EFP in India from 1990 to 2016. The results showed that renewable energy consumption and FDI and GDP reduce EF in the long run. Azimi and Rahman (2024) Identified a non-linear relationship between RE and EFP in 74 developing countries. Renewable energy reduces EF only when fiscal capacity, human development, and institutional quality exceed specific thresholds. Below these thresholds, its impact on EFP becomes insignificant. Du et al. (2023) found that energy productivity reduced the environmental damage in OECD economies. Meanwhile, Khan F. et al. (2024) found that RE enhances Pakistan’s environmental sustainability.
In short run, CS ARDL estimates confirm that IQ, GDP, and RE have a negative effect on EFP, while FD, GLO, and IND have a negative effect on EFP. The ECM (−1) coefficient is −0.04197, representing the speed of adjustment toward long-run equilibrium after a short-run shock. It means that about 4.2% of any disequilibrium from the previous period is corrected in the current period. The negative sign confirms convergence to equilibrium over time.
4.4 Robustness checks
Table 8 shows the results of Robustness analysis, this study employs both FMOLS and DOLS estimators to ensure the robustness and validity of the CS-ARDL findings. The results indicate that FD, RE, and IQ have adversely impacted EFP, suggesting enhanced environmental sustainability. In contrast, IND, GLO, and GDP have contributed positively to EFP, indicating an encouraging influence.
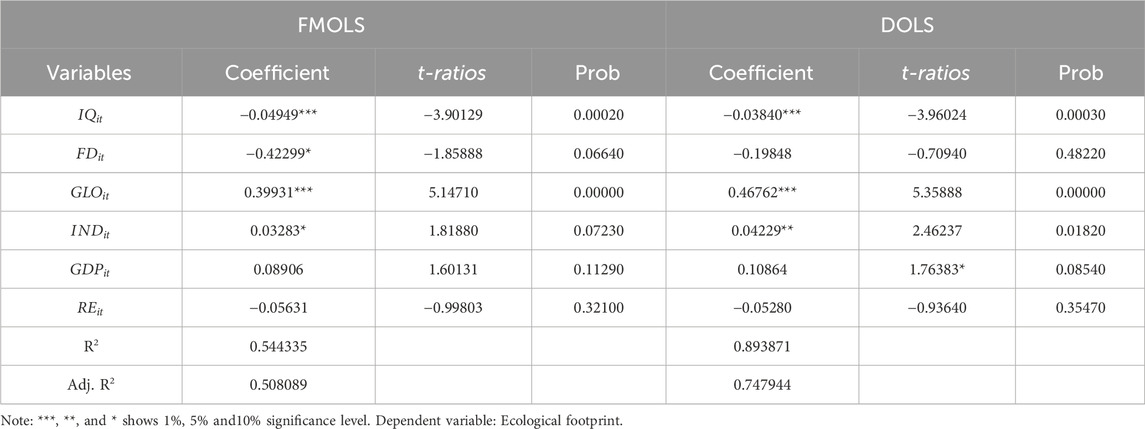
Table 8. Robustness checks.
4.5 Panel causality analysis
In Table 9 shows the D-H causality test, it displays that a one-way causal linkage was exposed from ecological footprint to IQ index, Thus, EFP to IQ Index: The ecological footprint influences institutional quality, suggesting that environmental degradation or poor ecological outcomes can spur the need for stronger institutions to address sustainability and environmental issues. While one one-way causal linkage was exposed from ecological footprint to FD, implies that environmental degradation may impact financial systems, possibly leading to reduced investment or changes in financial priorities due to environmental concerns. One way causality expose from globalization to IQ index, globalization to FD, FD to industrialization, globalization to GDP. While bio-directional causality exists between FD and institutional quality index, GDP and institutional quality, renewable energy usage and institutional quality index, FD and GDP. RE and IQI, There is a mutual influence between renewable energy usage and institutional quality. A well-developed institutional framework can encourage the adoption of RE through supportive policies, and increased RE usage can promote institutional reforms focused on sustainability and environmental protection.

Table 9. Results of Panel causality test.
5 Conclusion and policy recommendation
This study examined the impact of globalization and industrialization on ecological footprint, focusing mainly on institutional quality and renewable energy between 1996 and 2022 using the CS-ARDL, FMOLS, and DOLS estimators. The finding showed that IQ, FD, and RE negatively affect EFP, while GLO, IND, and GDP positively affect EFP. To prevent future degradation of the environment, these nations must first take appropriate action in relation to globalization and industrialization in their economy. From a policy perspective, this study contributes to the existing literature by proposing redesigned sustainable development strategies to address key issues in the South Asian region. Current policies often fail to encourage adopting and developing sustainable technologies that can reduce waste, minimize energy consumption, and improve efficiency in South Asian economies. Governments should prioritize policies that promote the development and implementation of RE sources, such as wind, solar, and hydropower, to reduce dependence on fossil fuels and lower CO2e. Policies must be restructured to ensure that economic growth does not come at the expense of environmental degradation. Strategies should also include promoting sustainable forest management practices, such as reforestation, reducing deforestation rates, and encouraging sustainable methods to balance economic growth with conservation.
Moreover, Policies should promote sustainable consumption and production patterns to further reduce the EFP of South Asian economies. This includes reducing waste and pollution, encouraging the use of RE, and fostering practices that support environmental sustainability while maintaining economic progress. SAARC economies should adopt Germany’s Renewable Energy Act. This policy incentivized renewable energy adoption through feed-in tariffs, significantly increasing green energy production. SAARC countries could implement similar tariff structures to accelerate solar and wind power investments. China’s anti-pollution measures, strict emissions regulations, and carbon trading schemes have also helped reduce industrial pollution. Adapting such market-based mechanisms could help SAARC nations curb emissions while promoting cleaner industries. South Asian economies should reduce geopolitical risks and enhance regional stability by fostering economic interdependence, diplomatic dialogue, and collaborative development initiatives among SAARC nations. Strengthen intra-SAARC trade and develop shared energy projects (e.g., cross-border RE grids) to create economic interdependence, reducing incentives for conflicts. Invest in joint infrastructure projects (e.g., roads, railways, and digital networks) to promote seamless economic integration and mutual economic benefits. Develop a cross-border renewable energy grid to facilitate electricity trade among SAARC nations, optimizing solar, wind, and hydro resources. Establish a regional financial mechanism to support renewable energy projects, sustainable infrastructure, and green technology innovation.
Furthermore, SAARC countries should strengthen institutional frameworks to align with global environmental policies like the Paris Agreement by enforcing stricter regulations on emissions and renewable energy adoption. Strengthening governance will enhance compliance and attract international climate financing. Policymakers should reform trade and investment regulations to ensure that globalization supports green technologies and sustainable practices. Strong institutions will help balance economic growth with environmental responsibility by promoting eco-friendly FDI. Strengthen the rule of law by ensuring strict enforcement of environmental regulations and penalizing violations such as illegal deforestation, pollution, and land encroachment. Establish fast-track environmental courts in SAARC nations to expedite cases against environmental offenders. Establish independent anti-corruption bodies within SAARC countries to investigate environmental crimes. Implement a regional digital tracking system for environmental funds to prevent misallocation. Governments should establish policy-academic partnerships to translate institutional quality and environmental sustainability research into actionable frameworks. Creating data-sharing platforms and think tanks will help policymakers implement evidence-based sustainability strategies. SAARC nations should establish a regional green fund to finance cross-border renewable energy projects and institutional reforms. Strengthening cooperation will enhance policy synchronization, ensuring a unified approach to climate resilience and sustainable development.
Lastly, this study acknowledges several limitations that can guide future research. One key limitation is the geographical scope, as the analysis focuses solely on selected economies of the SAARC member states, excluding developed, emerging, and other developing nations. Future research can extend the assessment to broader countries for a more comprehensive understanding. Additionally, this study incorporates only a limited set of variables while overlooking various macroeconomic, demographic, social, and health-related factors that could significantly influence EFP. Future investigations can integrate these variables to capture a more holistic perspective. Moreover, this study relies on CS-ARDL, FMOLS, and DOLS estimators without considering asymmetric analysis or Quantile regression. Future research could employ these advanced econometric techniques to explore nonlinear relationships and distributional effects, thereby enriching the findings on EFP determinants.
Data availability statement
The raw data supporting the conclusions of this article will be made available by the authors, without undue reservation.
Author contributions
QL: Conceptualization, Writing–original draft, Writing–review and editing. SZ: Data curation, Formal Analysis, Methodology, Writing–original draft, Writing–review and editing.
Funding
The author(s) declare that financial support was received for the research, authorship, and/or publication of this article. This study supported by “the Fundamental Research Funds for the Central Universities (2023MS081).”
Conflict of interest
The authors declare that the research was conducted in the absence of any commercial or financial relationships that could be construed as a potential conflict of interest.
Generative AI statement
The author(s) declare that no Generative AI was used in the creation of this manuscript.
Publisher’s note
All claims expressed in this article are solely those of the authors and do not necessarily represent those of their affiliated organizations, or those of the publisher, the editors and the reviewers. Any product that may be evaluated in this article, or claim that may be made by its manufacturer, is not guaranteed or endorsed by the publisher.
References
Addai, G., Amegavi, G. B., and Robinson, G. (2024). Advancing environmental sustainability: the dynamic relationship between renewable energy, institutional quality, and ecological footprint in the N-11 countries. Sustain. Dev. 32 (6), 7397–7408. doi:10.1002/sd.3096
Akram, R., Chen, F., Khalid, F., Ye, Z., and Majeed, M. T. (2020). Heterogeneous effects of energy efficiency and renewable energy on carbon emissions: evidence from developing countries. J. Clean. Prod. 247, 119122. doi:10.1016/j.jclepro.2019.119122
Ansari, M. A., Haider, S., and Masood, T. (2021). Do renewable energy and globalization enhance ecological footprint: an analysis of top renewable energy countries? Environ. Sci. Pollut. Res. 28 (6), 6719–6732. doi:10.1007/s11356-020-10786-0
Appiah, M., Li, M., Naeem, M. A., and Karim, S. (2023). Greening the globe: uncovering the impact of environmental policy, renewable energy, and innovation on ecological footprint. Technol. Forecast. Soc. Change 192, 122561. doi:10.1016/j.techfore.2023.122561
Ashraf, A., Nguyen, C. P., and Doytch, N. (2022). The impact of financial development on ecological footprints of nations. J. Environ. Manag. 322, 116062. doi:10.1016/j.jenvman.2022.116062
Aslam, B., Zhang, G., Amjad, M. A., Guo, S., and Ji, M. (2023). Does the impact of financial development reinforce sustainability ecological footprint? Fresh evidence from middle and high-income economies. J. Clean. Prod. 429, 139573. doi:10.1016/j.jclepro.2023.139573
Azam, M. (2020). Energy and economic growth in developing Asian economies. J. Asia Pac. Econ. 25 (3), 447–471. doi:10.1080/13547860.2019.1665328
Azam, M., Rehman, Z. U., and Ibrahim, Y. (2022a). Causal nexus in industrialization, urbanization, trade openness, and carbon emissions: empirical evidence from OPEC economies. Environ. Dev. Sustain. 24, 13990–14010. doi:10.1007/s10668-021-02019-2
Azam, M., Uddin, I., Khan, S., and Tariq, M. (2022b). Are globalization, urbanization, and energy consumption cause carbon emissions in SAARC region? New evidence from CS-ARDL approach. Environ. Sci. Pollut. Res. 29 (58), 87746–87763. doi:10.1007/s11356-022-21835-1
Azam, M., Uddin, I., and Saqib, N. (2023). The determinants of life expectancy and environmental degradation in Pakistan: evidence from ARDL bounds test approach. Environ. Sci. Pollut. Res. 30 (1), 2233–2246. doi:10.1007/s11356-022-22338-9
Azimi, M. N., and Rahman, M. M. (2023). Impact of institutional quality on ecological footprint: new insights from G20 countries. J. Clean. Prod. 423, 138670. doi:10.1016/j.jclepro.2023.138670
Azimi, M. N., and Rahman, M. M. (2024). Renewable energy and ecological footprint nexus: evidence from dynamic panel threshold technique. Heliyon 10 (13), e33442. doi:10.1016/j.heliyon.2024.e33442
Baloch, M. A., Zhang, J., Iqbal, K., and Iqbal, Z. (2019). The effect of financial development on ecological footprint in BRI countries: evidence from panel data estimation. Environ. Sci. Pollut. Res. 26, 6199–6208. doi:10.1007/s11356-018-3992-9
Bu, M., Lin, C. T., and Zhang, B. (2017). Globalization and climate change: new empirical panel data evidence. Environmental Economics and Sustainability, 201–220. doi:10.1002/9781119328223.ch9
Chen, S., Saud, S., Bano, S., and Haseeb, A. (2019). The nexus between financial development, globalization, and environmental degradation: fresh evidence from Central and Eastern European Countries. Environ. Sci. Pollut. Res. 26 (24), 24733–24747. doi:10.1007/s11356-019-05714-w
Chudik, A., and Pesaran, M. H. (2013). Large panel data models with cross-sectional dependence: a survey. CAFE Res. Pap. 13 (15). doi:10.1093/oxfordhb/9780199940042.013.0001
Copeland, B. R., and Taylor, M. S. (2013). “Trade and the environment,” in Trade and the environment (Princeton university press).
Cui, X., Wang, W., Işık, C., Uddin, I., Yan, J., Gu, X., et al. (2024). Do geopolitical risk and economic policy uncertainty cause CO2 emissions in BRICS? The role of institutional quality and energy productivity. Stoch. Environ. Res. Risk Assess. 38 (5), 1685–1699. doi:10.1007/s00477-023-02646-3
Dam, M. M., Durmaz, A., Bekun, F. V., and Tiwari, A. K. (2024). The role of green growth and institutional quality on environmental sustainability: a comparison of CO2 emissions, ecological footprint and inverted load capacity factor for OECD countries. J. Environ. Manag. 365, 121551. doi:10.1016/j.jenvman.2024.121551
Dogan, E., Ulucak, R., Kocak, E., and Isik, C. (2020). The use of ecological footprint in estimating the environmental Kuznets curve hypothesis for BRICST by considering cross-section dependence and heterogeneity. Sci. total Environ. 723, 138063. doi:10.1016/j.scitotenv.2020.138063
Dreher, A. (2006). Does globalization affect growth? Evidence from a new index of globalization. Appl. Econ. 38 (10), 1091–1110. doi:10.1080/00036840500392078
Dreher, A., Gaston, N., and Martens, P. (2008). Measuring globalisation. Gauging its consequences. New York: Springer.
Du, J., Ahmad, M., Uddin, I., Xu, H., and Gu, X. (2023). From growth to sustainability: investigating N-shaped EKC and the role of energy productivity, technological advancement, and human capital in OECD economies. Environ. Sci. Pollut. Res. 30 (46), 102374–102388. doi:10.1007/s11356-023-29514-5
Dumitrescu, E. I., and Hurlin, C. (2012). Testing for Granger non-causality in heterogeneous panels. Econ. Model. 29 (4), 1450–1460. doi:10.1016/j.econmod.2012.02.014
Espa, I., and Holzer, K. (2018). Negotiating 21st century rules on energy: what is at stake for the European Union, the United States and the BRICS? J. World Invest. and Trade 19 (3), 415–443. doi:10.1163/22119000-12340095
Eweade, B. S., Akadiri, A. C., Olusoga, K. O., and Bamidele, R. O. (2024). “The symbiotic effects of energy consumption, globalization, and combustible renewables and waste on ecological footprint in the United Kingdom,” in Natural resources forum (Oxford, UK: Blackwell Publishing Ltd).
Farooq, S., Ozturk, I., Majeed, M. T., and Akram, R. (2022). Globalization and CO2 emissions in the presence of EKC: a global panel data analysis. Gondwana Res. 106, 367–378. doi:10.1016/j.gr.2022.02.002
Figge, L., Oebels, K., and Offermans, A. (2017). The effects of globalization on Ecological Footprints: an empirical analysis. Environ. Dev. Sustain. 19, 863–876. doi:10.1007/s10668-016-9769-8
GFN (2023). Global footprint network. Available at: https://www.footprintnetwork.org/licenses/public-data-package-free/ (Accessed October 22, 2024).
Ibrahiem, D. M., and Hanafy, S. A. (2020). Dynamic linkages amongst ecological footprints, fossil fuel energy consumption and globalization: an empirical analysis. Manag. Environ. Qual. An Int. J. 31, 1549–1568. doi:10.1108/meq-02-2020-0029
International Energy Agency (IEA) (2017). Global energy and CO2 status report. OECD/IEA. Retrieved from: https://www.iea.org/reports/global-energy-co2-status-report-2017 (Accessed November 15, 2024).
Imran, M., Khan, M. K., Alam, S., Wahab, S., Tufail, M., and Jijian, Z. (2024). The implications of the ecological footprint and renewable energy usage on the financial stability of South Asian countries. Financ. Innov. 10 (1), 102. doi:10.1186/s40854-024-00627-1
Khalid, K., Usman, M., and Mehdi, M. A. (2021). The determinants of environmental quality in the SAARC region: a spatial heterogeneous panel data approach. Environ. Sci. Pollut. Res. 28 (6), 6422–6436. doi:10.1007/s11356-020-10896-9
Khan, D., and Ullah, A. (2019). Testing the relationship between globalization and carbon dioxide emissions in Pakistan: does environmental Kuznets curve exist? Environ. Sci. Pollut. Res. 26 (15), 15194–15208. doi:10.1007/s11356-019-04913-9
Khan, F., Uddin, I., Don, Y. B., and Awan, A. M. (2024a). Does women's education play a role in sustainable environment in Pakistan? A quantitative approach. Environ. Dev. Sustain., 1–19. doi:10.1007/s10668-024-05479-4
Khan, H., Weili, L., and Khan, I. (2022). Institutional quality, financial development and the influence of environmental factors on carbon emissions: evidence from a global perspective. Environ. Sci. Pollut. Res. 29, 13356–13368. doi:10.1007/s11356-021-16626-z
Khan, M. K., Teng, J. Z., Khan, M. I., and Khan, M. O. (2019). Impact of globalization, economic factors and energy consumption on CO2 emissions in Pakistan. Sci. Total Environ. 688, 424–436. doi:10.1016/j.scitotenv.2019.06.065
Khan, S., Afzal, S., Khan, Z., and Uddin, I. (2024b). Revisiting the role of renewable energy, government spending, exports, and imports, in economic growth: a panel data analysis of selected asian countries. Econ. Altern. (4), 781–795.
Khan A. A., A. A., Khan, S. U., Ali, M. A. S., Safi, A., Gao, Y., Ali, M., et al. (2022). Role of institutional quality and renewable energy consumption in achieving carbon neutrality: case study of G-7 economies. Sci. Total Environ. 814, 152797. doi:10.1016/j.scitotenv.2021.152797
Kirikkaleli, D., Adebayo, T. S., Khan, Z., and Ali, S. (2021). Does globalization matter for ecological footprint in Turkey? Evidence from dual adjustment approach. Environ. Sci. Pollut. Res. 28 (11), 14009–14017. doi:10.1007/s11356-020-11654-7
Lei, W., Xie, Y., Hafeez, M., and Ullah, S. (2022). Assessing the dynamic linkage between energy efficiency, renewable energy consumption, and CO2 emissions in China. Environ. Sci. Pollut. Res. 29 (13), 19540–19552. doi:10.1007/s11356-021-17145-7
Levin, A., Lin, C.-F., and Chu, C.-S. J. (2002). Unit root tests in panel data: asymptotic and finite-sample properties. J. Econ. 108 (1), 1–24. doi:10.1016/s0304-4076(01)00098-7
Li, K., and Lin, B. (2015). Impacts of urbanization and industrialization on energy consumption/CO2 emissions: does the level of development matter? Renew. Sustain. Energy Rev. 52, 1107–1122. doi:10.1016/j.rser.2015.07.185
Li, R., Wang, X., and Wang, Q. (2022). Does renewable energy reduce ecological footprint at the expense of economic growth? An empirical analysis of 120 countries. J. Clean. Prod. 346, 131207. doi:10.1016/j.jclepro.2022.131207
Liu, X., and Bae, J. (2018). Urbanization and industrialization impact of CO2 emissions in China. J. Clean. Prod. 172, 178–186. doi:10.1016/j.jclepro.2017.10.156
Lu, W. C. (2020). The interplay among ecological footprint, real income, energy consumption, and trade openness in 13 Asian countries. Environ. Sci. Pollut. Res. 27 (36), 45148–45160. doi:10.1007/s11356-020-10399-7
Ma, Y., Fan, Y., and Razzaq, A. (2023). Influence of technical efficiency and globalization on sustainable resources management: evidence from South Asian countries. Resour. Policy 81, 103281. doi:10.1016/j.resourpol.2022.103281
Majeed, M. T., and Mazhar, M. (2019). Financial development and ecological footprint: a global panel data analysis. Pak. J. Commer. Soc. Sci. (PJCSS) 13 (2), 487–514.
Mentel, U., Wolanin, E., Eshov, M., and Salahodjaev, R. (2022). Industrialization and CO2 emissions in sub-saharan Africa: the mitigating role of renewable electricity. Energies 15 (3), 946. doi:10.3390/en15030946
Murshed, M., and Tanha, M. M. (2021). Oil price shocks and renewable energy transition: empirical evidence from net oil-importing South Asian economies. Energy, Ecol. Environ. 6 (3), 183–203. doi:10.1007/s40974-020-00168-0
Nathaniel, S., Anyanwu, O., and Shah, M. (2020). Renewable energy, urbanization, and ecological footprint in the Middle East and North Africa region. Environ. Sci. Pollut. Res. 27 (13), 14601–14613. doi:10.1007/s11356-020-08017-7
Nathaniel, S., and Khan, S. A. R. (2020). The nexus between urbanization, renewable energy, trade, and ecological footprint in ASEAN countries. J. Clean. Prod. 272, 122709. doi:10.1016/j.jclepro.2020.122709
Nepal, S. R., and Shrestha, S. L. (2024). Modeling the ecological footprint and assessing its influential factors: a systematic review. Environ. Sci. Pollut. Res. 31 (38), 50076–50097. doi:10.1007/s11356-024-34549-3
Obobisa, E. S., Chen, H., and Mensah, I. A. (2022). The impact of green technological innovation and institutional quality on CO2 emissions in African countries. Technol. Forecast. Soc. Change 180, 121670. doi:10.1016/j.techfore.2022.121670
Ozturk, I., and Acaravci, A. (2013). The long-run and causal analysis of energy, growth, openness and financial development on carbon emissions in Turkey. Energy Econ. 36, 262–267. doi:10.1016/j.eneco.2012.08.025
Ozturk, I., and Bilgili, F. (2015). Economic growth and biomass consumption nexus: dynamic panel analysis for Sub-Sahara African countries. Appl. Energy 137, 110–116. doi:10.1016/j.apenergy.2014.10.017
Pata, U. K., Tiwari, A. K., and Erdogan, S. (2024). Technological innovation, globalization and ecological quality: a disaggregated ecological footprint approach for BRICS countries. J. Environ. Manag. 370, 122518. doi:10.1016/j.jenvman.2024.122518
Pesaran, M. H. (2007). A simple panel unit root test in the presence of cross-section dependence. J. Appl. Econ. 22 (2), 265–312. doi:10.1002/jae.951
Phillips, P. C., and Sul, D. (2003). Dynamic panel estimation and homogeneity testing under cross section dependence. Econ. J. 6 (1), 217–259. doi:10.1111/1368-423x.00108
Phillips, P. C. B., and Hansen, B. E. (1990). Statistical inference in instrumental variables regression with I(1) processes. Rev. Econ. Stud. 57 (1), 99–125. doi:10.2307/2297545
Qing, L., Usman, M., Radulescu, M., and Haseeb, M. (2024). Towards the vision of going green in South Asian region: the role of technological innovations, renewable energy and natural resources in ecological footprint during globalization mode. Resour. Policy 88, 104506. doi:10.1016/j.resourpol.2023.104506
Quito, B., del Río-Rama, M. D. L. C., Álvarez-García, J., and Durán-Sánchez, A. (2023). Impacts of industrialization, renewable energy and urbanization on the global ecological footprint: a quantile regression approach. Bus. Strategy Environ. 32 (4), 1529–1541. doi:10.1002/bse.3203
Rees, W., Wackernagel, M., and Testemale, P. (1996). Our ecological footprint: reducing human impact on the Earth. Gabriola Island: New Society Publishers, 3–12.
Roy, A. (2023). The impact of foreign direct investment, renewable and non-renewable energy consumption, and natural resources on ecological footprint: an Indian perspective. Int. J. Energy Sect. Manag. 18 (1), 141–161. doi:10.1108/ijesm-09-2022-0004
Sabir, S., and Gorus, M. S. (2019). The impact of globalization on ecological footprint: empirical evidence from the South Asian countries. Environ. Sci. Pollut. Res. 26 (32), 33387–33398. doi:10.1007/s11356-019-06458-3
Sahoo, M., and Sethi, N. (2021). The intermittent effects of renewable energy on ecological footprint: evidence from developing countries. Environ. Sci. Pollut. Res. 28 (40), 56401–56417. doi:10.1007/s11356-021-14600-3
Saint-Akadiri, S., Alola, A. A., and Akadiri, A. C. (2019). The role of globalization, real income, tourism in environmental sustainability target. Evidence from Turkey. Sci. total Environ. 687, 423–432. doi:10.1016/j.scitotenv.2019.06.139
Saqib, N., Usman, M., Ozturk, I., and Sharif, A. (2024). Harnessing the synergistic impacts of environmental innovations, financial development, green growth, and ecological footprint through the lens of SDGs policies for countries exhibiting high ecological footprints. Energy Policy 184, 113863. doi:10.1016/j.enpol.2023.113863
Sharma, E., and Das, S. (2020). Measuring impact of Indian ports on environment and effectiveness of remedial measures towards environmental pollution. Int. J. Environ. Waste Manag. 25 (3), 356–380. doi:10.1504/ijewm.2020.106295
Sharma, R., Sinha, A., and Kautish, P. (2020). Examining the impacts of economic and demographic aspects on the ecological footprint in South and Southeast Asian countries. Environ. Sci. Pollut. Res. 27 (29), 36970–36982. doi:10.1007/s11356-020-09659-3
Sharma, R., Sinha, A., and Kautish, P. (2021). Does renewable energy consumption reduce ecological footprint? Evidence from eight developing countries of Asia. J. Clean. Prod. 285, 124867. doi:10.1016/j.jclepro.2020.124867
Sheraz, M., Deyi, X., Sinha, A., Mumtaz, M. Z., and Fatima, N. (2022). The dynamic nexus among financial development, renewable energy and carbon emissions: moderating roles of globalization and institutional quality across BRI countries. J. Clean. Prod. 343, 130995. doi:10.1016/j.jclepro.2022.130995
Singh, S. K., Del Giudice, M., Chierici, R., and Graziano, D. (2020). Green innovation and environmental performance: the role of green transformational leadership and green human resource management. Technol. Forecast. Soc. Change 150, 119762. doi:10.1016/j.techfore.2019.119762
Stock, J. H., and Watson, M. W. (1993). A simple estimator of cointegrating vectors in higher order integrated systems. Econometrica 61 (4), 783–820. doi:10.2307/2951763
Sun, Q., Ma, R., Xi, Z., Wang, H., Jiang, C., and Chen, H. (2023). Nonlinear impacts of energy consumption and globalization on ecological footprint: empirical research from BRICS countries. J. Clean. Prod. 396, 136488. doi:10.1016/j.jclepro.2023.136488
Tamazian, A., Chousa, J. P., and Vadlamannati, K. C. (2009). Does higher economic and financial development lead to environmental degradation: evidence from BRIC countries. Energy policy 37 (1), 246–253. doi:10.1016/j.enpol.2008.08.025
Tamazian, A., and Rao, B. B. (2010). Do economic, financial and institutional developments matter for environmental degradation? Evidence from transitional economies. Energy Econ. 32 (1), 137–145. doi:10.1016/j.eneco.2009.04.004
Uddin, I., Ahmad, M., Ismailov, D., Balbaa, M. E., Akhmedov, A., Khasanov, S., et al. (2023a). Enhancing institutional quality to boost economic development in developing nations: new insights from CS-ARDL approach. Res. Glob. 7, 100137. doi:10.1016/j.resglo.2023.100137
Uddin, I., Khan, M. A., Tariq, M., Khan, F., and Malik, Z. K. (2024). Revisiting the determinants of life expectancy in Asia—exploring the role of institutional quality, financial development, and environmental degradation. Environ. Dev. Sustain. 26 (5), 11289–11309. doi:10.1007/s10668-023-03283-0
Uddin, I., Ullah, A., Saqib, N., Kousar, R., and Usman, M. (2023c). Heterogeneous role of energy utilization, financial development, and economic development in ecological footprint: how far away are developing economies from developed ones. Environ. Sci. Pollut. Res. 30 (20), 58378–58398. doi:10.1007/s11356-023-26584-3
Uddin, I., Usman, M., Saqib, N., and Makhdum, M. S. A. (2023b). The impact of geopolitical risk, governance, technological innovations, energy use, and foreign direct investment on CO2 emissions in the BRICS region. Environ. Sci. Pollut. Res. 30 (29), 73714–73729. doi:10.1007/s11356-023-27466-4
Ullah, S., and Lin, B. (2024). Harnessing the synergistic impacts of financial structure, industrialization, and ecological footprint through the lens of the EKC hypothesis. Insights from Pakistan. Energy 307, 132540. doi:10.1016/j.energy.2024.132540
Ulucak, R., and Khan, S. U. D. (2020). Determinants of the ecological footprint: role of renewable energy, natural resources, and urbanization. Sustain. Cities Soc. 54, 101996. doi:10.1016/j.scs.2019.101996
Usman, O., Rafindadi, A. A., and Sarkodie, S. A. (2021). Conflicts and ecological footprint in MENA countries: implications for sustainable terrestrial ecosystem. Environ. Sci. Pollut. Res. 28 (42), 59988–59999. doi:10.1007/s11356-021-14931-1
Van Tran, H., Tran, A. V., Bui Hoang, N., and Mai, T. N. H. (2024). Asymmetric effects of foreign direct investment and globalization on ecological footprint in Indonesia. Plos one 19 (1), e0297046. doi:10.1371/journal.pone.0297046
Villanthenkodath, M. A., and Pal, S. (2023). How economic globalization affects the ecological footprint in India? A novel dynamic ARDL simulations. J. Econ. Adm. Sci. doi:10.1108/jeas-01-2022-0005
Wang, Z., Bui, Q., Zhang, B., and Pham, T. L. H. (2020). Biomass energy production and its impacts on the ecological footprint: an investigation of the G7 countries. Sci. Total Environ. 743, 140741. doi:10.1016/j.scitotenv.2020.140741
World Bank Group (2024). Climate and development in South Asia. World Bank. Retrieved from: https://www.worldbank.org/en/region/sar/brief/integrating-climate-and-development-in-south-asia/integrating-climate-and-development-in-south-asia-region.
Wu, Q., and Madni, G. R. (2021). Environmental protection in selected one belt one road economies through institutional quality: prospering transportation and industrialization. Plos one 16 (1), e0240851. doi:10.1371/journal.pone.0240851
Xu, B., and Lin, B. (2015). How industrialization and urbanization process impacts on CO2 emissions in China: evidence from nonparametric additive regression models. Energy Econ. 48, 188–202. doi:10.1016/j.eneco.2015.01.005
Yilanci, V., and Gorus, M. S. (2020). Does economic globalization have predictive power for ecological footprint in MENA counties? A panel causality test with a Fourier function. Environ. Sci. Pollut. Res. 27 (32), 40552–40562. doi:10.1007/s11356-020-10092-9
You, W., and Lv, Z. (2018). Spillover effects of economic globalization on CO2 emissions: a spatial panel approach. Energy Econ. 73, 248–257. doi:10.1016/j.eneco.2018.05.016
Keywords: industrialization, institutional quality, ecological footprint, renewable energy, globalization
Citation: Li Q and Zhang S (2025) Impact of globalization and industrialization on ecological footprint: do institutional quality and renewable energy matter?. Front. Environ. Sci. 13:1535638. doi: 10.3389/fenvs.2025.1535638
Received: 27 November 2024; Accepted: 14 February 2025;
Published: 13 March 2025.
Edited by:
Lloyd George Banda, Stellenbosch University, South AfricaReviewed by:
Fatma Mabrouk, Princess Nourah bint Abdulrahman University, Saudi ArabiaChrispine Mtocha, The World Bank, United States
Copyright © 2025 Li and Zhang. This is an open-access article distributed under the terms of the Creative Commons Attribution License (CC BY). The use, distribution or reproduction in other forums is permitted, provided the original author(s) and the copyright owner(s) are credited and that the original publication in this journal is cited, in accordance with accepted academic practice. No use, distribution or reproduction is permitted which does not comply with these terms.
*Correspondence: Shuliang Zhang, NDM4MTk4NTE4QHFxLmNvbQ==