 Jazmin Campos Zeballos1*†
 Jefferson Valencia2†
 Fabia Codalli3†
 Fabian Mitze1†
 Frank Shagega3,4†
 Björn Weeser1†
 Suzanne Jacobs1,3†
- 1Centre for International Development and Environmental Research, Justus Liebig University Giessen, Giessen, Germany
- 2Alliance of Bioversity International and the International Center for Tropical Agriculture (CIAT), The Americas Hub, Cali, Colombia
- 3Institute for Landscape Ecology and Resources Management (ILR), Research Centre for BioSystems, Land Use and Nutrition (iFZ), Justus Liebig University Giessen, Giessen, Germany
- 4Water Resources Engineering Department, College of Engineering and Technology, University of Dar es Salaam, Dar es Salaam, Tanzania
In view of the considerable impact of climate change on water resources, it is crucial to promptly address the limited availability of consistent and reliable hydrometeorological data to enable timely decision-making. HydroCrowd employs a participatory monitoring approach to collect meteorological and hydrological data in vulnerable mountainous tourist areas. This paper presents an analysis of both non-frequent and regular volunteers who participated in the project, examines the motivation behind their participation, and evaluates the advantages and disadvantages of the project’s approach to data collection. The stations, smartphone application, and data collection process received, in general, a positive response. However, the lack of reliable internet connection in some regions hinders the observation upload process, which in turn hinders the participation of volunteers. The results suggest that such projects cannot solely rely on non-frequent volunteers, such as tourists. Communities and local stakeholders are instrumental in ensuring the continuous collection of data in a timely manner for projects of this nature.
1 Introduction
Participatory monitoring (PM) is a methodology involving volunteers to collect and process data and information, which has been successfully implemented in a range of different scientific fields in recent years (Kullenberg and Kasperowski, 2016; Hecker et al., 2018). It is particularly useful in the field of hydrology, as the lack of pertinent and openly available data to inform water resources management (United Nations, 2024) can be addressed cost-effectively while covering extensive areas and time frames (Njue et al., 2019).
Considering the significant impact of climate change on water resources and the rising prevalence of water-related hazards, there is an urgent need to address the scarcity of reliable hydrometeorological data for timely and informed decision-making. In this context, PM represents a valuable methodology that could be particularly beneficial in countries where resources for monitoring are limited.
HydroCrowd is a research project focused on hydrometeorological PM, with a particular emphasis on vulnerable mountainous regions of critical importance for water resources. The case studies located in Ecuador, Honduras, and Tanzania require open data in order to facilitate further adaptation to climate change. This is particularly pertinent, given that the case studies consist of national parks or reserves established for the protection of biodiversity and natural resources, including water. Thus, local communities benefit from the ecosystem services provided by these protected areas. Important actors in the targeted regions acknowledge the significance of data collection for monitoring weather and water resources, particularly due to their relevance to communities. In this context, the implementation of PM to collect open data could be of great benefit for the case studies.
HydroCrowd implemented networks of simple and low-cost weather and water stations, which are described in Section 2.2, in and around the case study regions. Data can be submitted and retrieved through a smartphone application (app), which can be used offline and at no cost. The app enables volunteers to contribute to weather and water data collection, which can provide near real-time open data for local governments, stakeholders, and communities.
The target groups for PM differed among case studies, based on the presence of different groups of people (e.g., local communities, university students, and local or international tourists) in the areas where data is collected. Despite the existence of studies that target tourists as volunteers for PM projects (Butler et al., 2023), HydroCrowd is unique in its application in mountainous regions that are difficult to reach and are typically visited by tourists only. The HydroCrowd approach involves the use of simple stations and instructions for weather and water data collection, with minimal researcher assistance. The present research seeks to ascertain whether tourists would be willing to collect data during their visits, even if it was not the primary objective of their visit. This is in contrast to other PM projects, in which tourists typically sign up for participation (Ashley et al., 2022; Bergmann et al., 2017; Branchini et al., 2015; Hesley et al., 2017).
The overall objective of HydroCrowd is to assess whether different target groups can collect data of sufficient quality and frequency to improve water management and hydrological modelling. In this paper, we analyse who participates in the project voluntarily and the motivation behind participation, in addition to examining the advantages and disadvantages of the approach to data collection. The analysis sheds light on the participation of regular (e.g., members of the local community) and non-frequent volunteers (e.g., tourists) in PM and whether non-frequent volunteers can be relied on to regularly collect data in areas where communities are not present.
2 Material and methodology
2.1 Case studies and targeted volunteers’ groups
HydroCrowd has case studies in Ecuador, Honduras, and Tanzania. The main case studies include Cajas National Park in Ecuador, Cacique Lempira Señor de las Montañas Biosphere Reserve in Honduras (hereafter referred to as Cacique Lempira Reserve), and Kilimanjaro National Park in Tanzania. Furthermore, water and weather stations were installed in Tomebamba, Paute, Ecuador, and a weather station was installed on the campus of the Centro Universitario Regional de Occidente–Universidad Nacional de Honduras (CUROC–UNAH), Santa Rosa de Copán, Honduras.
The case studies differ in terms of the expected number and background of volunteers. In the case of the Cajas National Park, a total of three water stations and five weather stations were installed in June 2023 (Figure 1). Most of the stations are situated along the park’s hiking routes, at the starting points of daily tours and at locations that are highly visited by tourists (e.g., Las Tres Cruces viewpoint). At the request of the water management authority, one water station was installed in an area that is accessible only to park rangers. Since tourists constitute the largest group of people in the area, it was anticipated that a high number of non-frequent volunteers (i.e., visitors) would participate, in addition to a small number of regular volunteers (i.e., tour guides and park rangers).
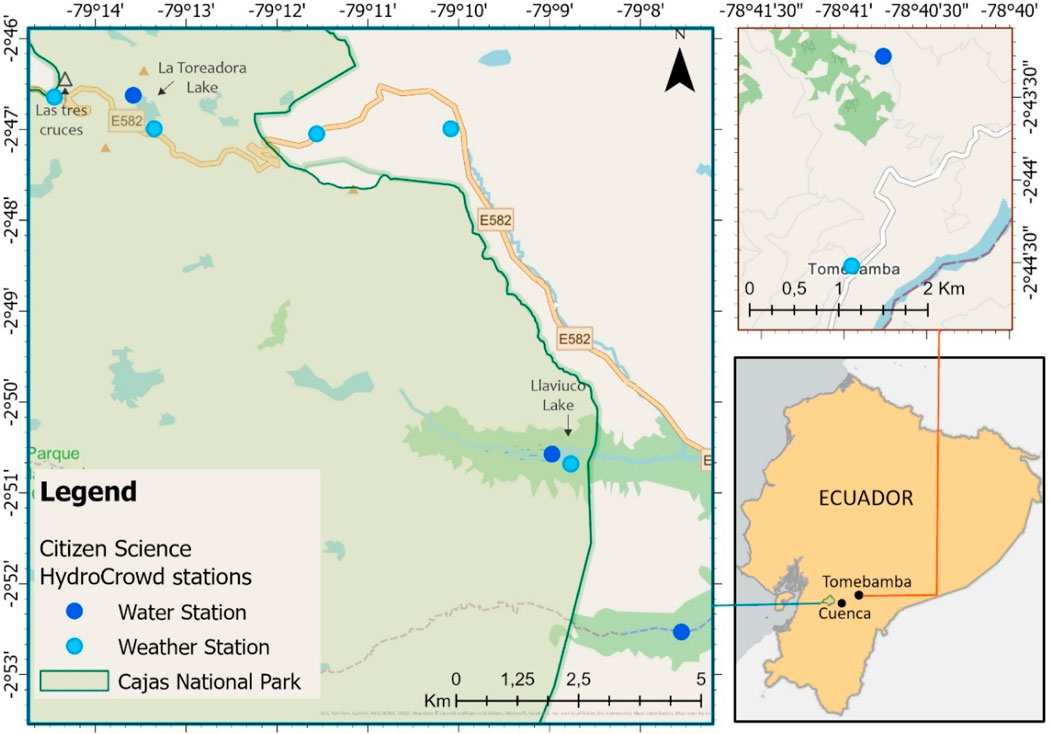
Figure 1. Location of case studies and stations in Ecuador.
In addition, one water and one weather stations were installed in June 2023 in Tomebamba, Paute, which are monitored and managed by the local community (Figure 1). It was, therefore, anticipated that a considerable number of regular volunteers would participate.
In the case of the Cacique Lempira Reserve in Honduras, the location of one weather and one water stations was determined based on their strategic positioning along hiking trails within the park, while the remaining ten stations are situated near communities (Figure 2). The installation of these stations was conducted in two phases: the first one, in May 2023 when four weather stations and one water station were installed; the second phase, in May 2024 when three weather stations and four water stations were installed. A further weather station was installed in Santa Rosa de Copán at the CUROC–UNAH in May 2024. Similar to the Tomebamba case study, it was expected the majority of the contributions would come from regular volunteers (i.e., members of the local communities), while non-frequent volunteers (i.e., visitors) were expected to contribute from the stations located within the park only.
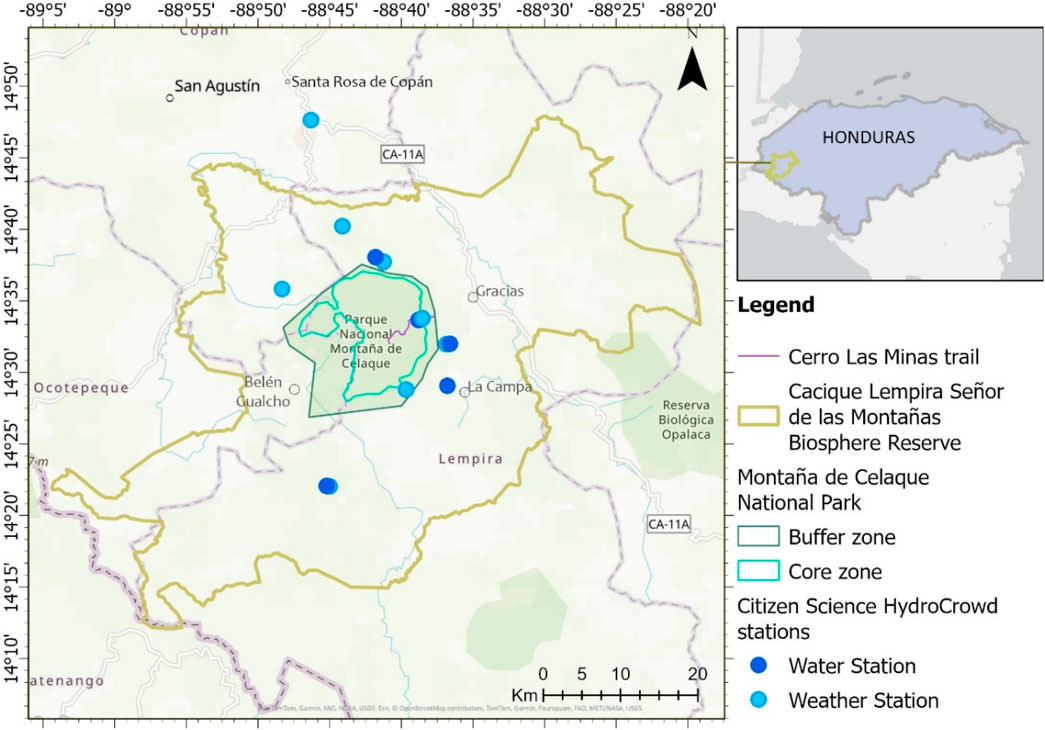
Figure 2. Location of case studies and stations in Honduras.
At the Kilimanjaro National Park, the installation of weather and water stations along the most popular climbing routes was conducted in August 2023 (Figure 3). One station was installed at a research station and is not accessible to the public. Additionally, rain gauges were installed on request in private residences (so-called ‘weather@home’ stations) and at Mweka Wildlife College, which are predominantly areas accessible to individuals or communities interested in data collection. In addition, several stations were installed at hotels and guest houses, with the objective of raising awareness about the project among tourists prior to their climbing Mt. Kilimanjaro. The stations installed in the Kilimanjaro National Park are shown in Figure 3 and include three water stations, ten weather stations, and nine weather@home stations. It was hypothesised that non-frequent volunteers (i.e., tourists) and, to a lesser extent, regular volunteers (i.e., their guides) would be the main groups contributing data in this case study.
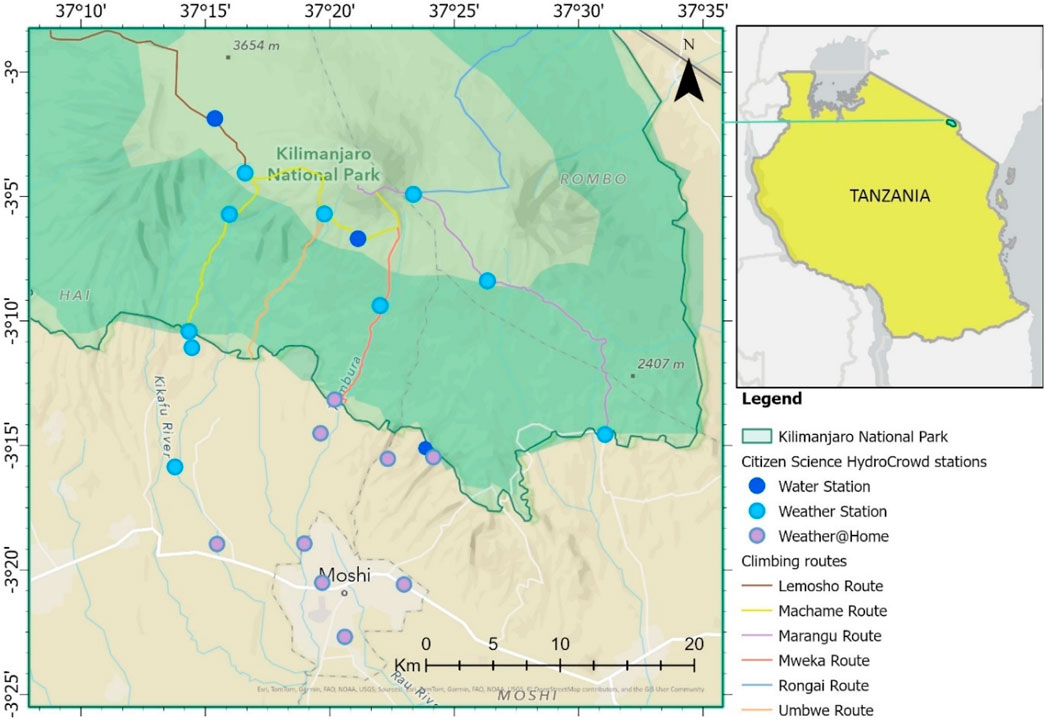
Figure 3. Location of stations in Tanzania.
Table 1 provides details on all the HydroCrowd stations, classified according to the volunteer group most likely to submit data. The term ‘community’ is employed to describe groups of people who reside in the same geographical area (e.g., the community in Tomebamba) or engage in similar activities (e.g., researchers at Nkweseko research station). In this regard, the stations classified as ‘communal’ are those installed in areas where it was anticipated that the majority of participants would be regular volunteers from the immediate communities. It was assumed that the number of volunteers would be limited, but that the number of submissions per volunteer would be considerable.
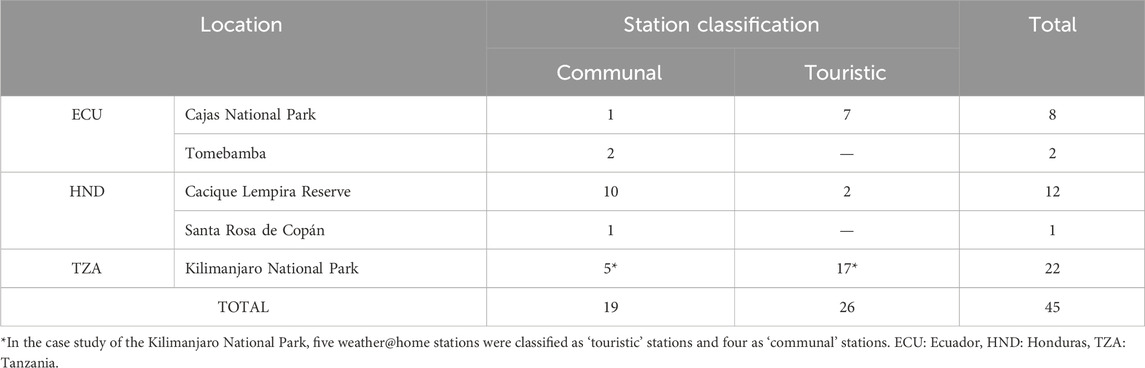
Table 1. Number of stations per location and target group classification.
The term ‘touristic’ is applied to stations located in places and along routes frequented by individuals who do not reside in the area and who may visit the region on a single occasion, ‘tourists’. Consequently, they are likely to be engaged only once in the data collection process. In this regard, the stations are targeted at tourists and tour guides. It was expected that data would be collected from a larger number of volunteers, with few submissions per volunteer.
2.2 PM station design and equipment
The HydroCrowd weather stations are equipped with an analogue hygrometer, a thermometer, and a rain gauge. The reading of these three instruments, which were installed so that all three can be captured in a single photograph, does not require any training. Volunteers are asked to submit the photograph as part of the data collection process for validation purposes (see Section 2.4). The HydroCrowd water stations are equipped with a turbidity tube and a bucket for the collection of water from the rivers. Water level gauges have been installed in a position that is both near to and visible from the station. At the water stations, volunteers are requested to submit a photograph of the water level gauge.
The signs at each station display graphical and written instructions on how to use the sensors and how to submit the data, in addition to what the photograph should contain. The signs have a corresponding QR code, which facilitates the submission of volunteers’ observations. The signs also contain information about the project, the reason behind the data collection, and the HydroCrowd contact details (Figure 4).
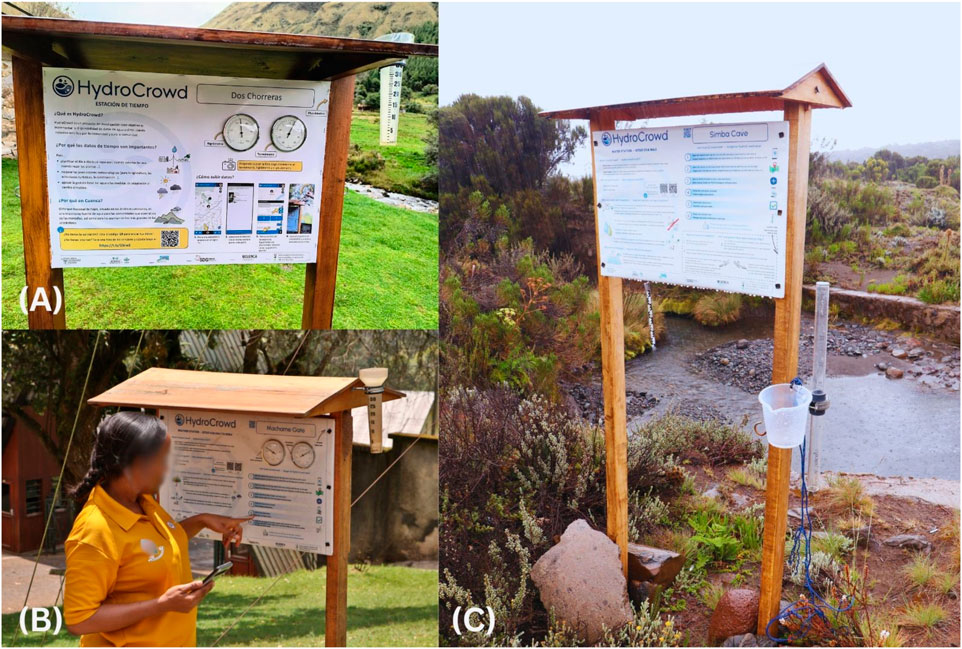
Figure 4. HydroCrowd stations. (A) Weather station in Cajas National Park. The panel features the provided instructions, the sensor installed, the rain gauge, and a QR code that can be used to submit data without downloading the app. (B) Weather station in Kilimanjaro National Park, which displays instructions for submitting data, which a volunteer can easily read. (C) Water station panel that includes a turbidity tube and a bucket for collecting water, as well as a water level gauge.
Weather@home stations are equipped with a rain gauge only. The stations were originally installed with a sign providing instructions on how to submit data and QR codes to download the application (Figure 5). However, following stakeholders’ feedback, the signs of weather@home stations installed at guest houses (i.e., Kisambi, Shimbwe Meadows, and Brubru Lodge) were modified to display solely the QR code for direct data submission through the web platform.
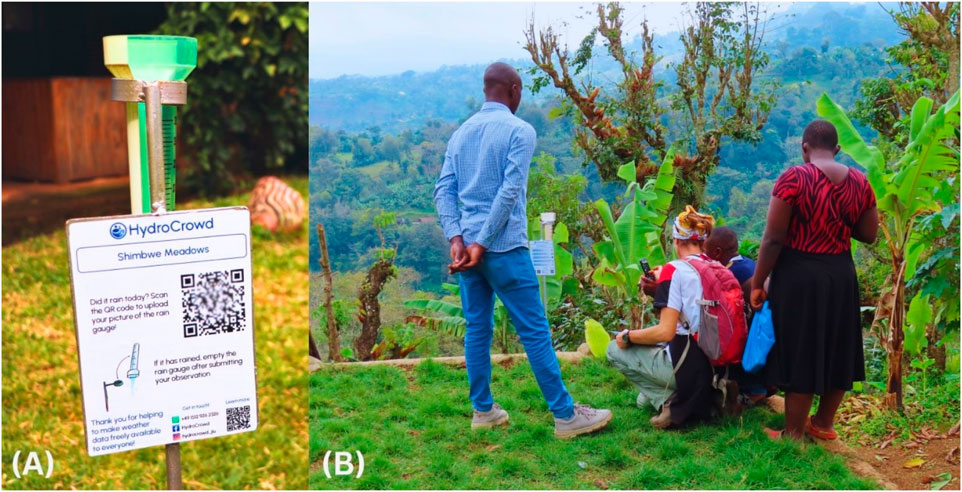
Figure 5. HydroCrowd weather@home stations around the Kilimanjaro National Park. (A) Close image of a weather@home station structure with instructions and the QR codes to download the app and submit data directly to the platform. (B) Volunteers collecting data from a weather@home station.
The installation of the stations was conducted by the researchers involved in the project in collaboration with local stakeholders. The posts of the signs of the weather and water stations were dug into the soil for at least 30 cm and stabilised with stones obtained from the surrounding area. Similarly, the weather@home structures were hammered to the ground to prevent easy removal. In windy regions, the stations were additionally anchored to the soil with steel tension cables to enhance their stability. Most water level gauges were installed with the help of a 30 cm metal spike at the bottom of the water level gauge, which went into the riverbed. The gauge was then stabilised with tension cables to avoid movement. The water level gauge at Materuni in Tanzania was later reinforced with concrete at the bottom of the gauge, as floods had washed away the previous gauge. In some locations, water level gauges were drilled against a vertical wall or rocky outcrops along the river.
The approximate costs of the different stations (excluding travel and labour) are provided in Table 2. Where possible, materials were sourced locally. Exceptions include the sensors and instruments which were all purchased from Germany to ensure comparability across the study regions. The locally made metal water level gauges in Ecuador used the same design as the rigid foam ones obtained in Germany, but did not require a metal holder for installation. Miscellaneous and smartphone application costs per station are obtained by dividing the overall costs by the total number of stations. It is important to mention that the basic costs for the application, including the web platform, amounted to approximately € 18,700 for a period of 3 years. This does not include project-specific feature developments or use in multiple countries with multiple languages.
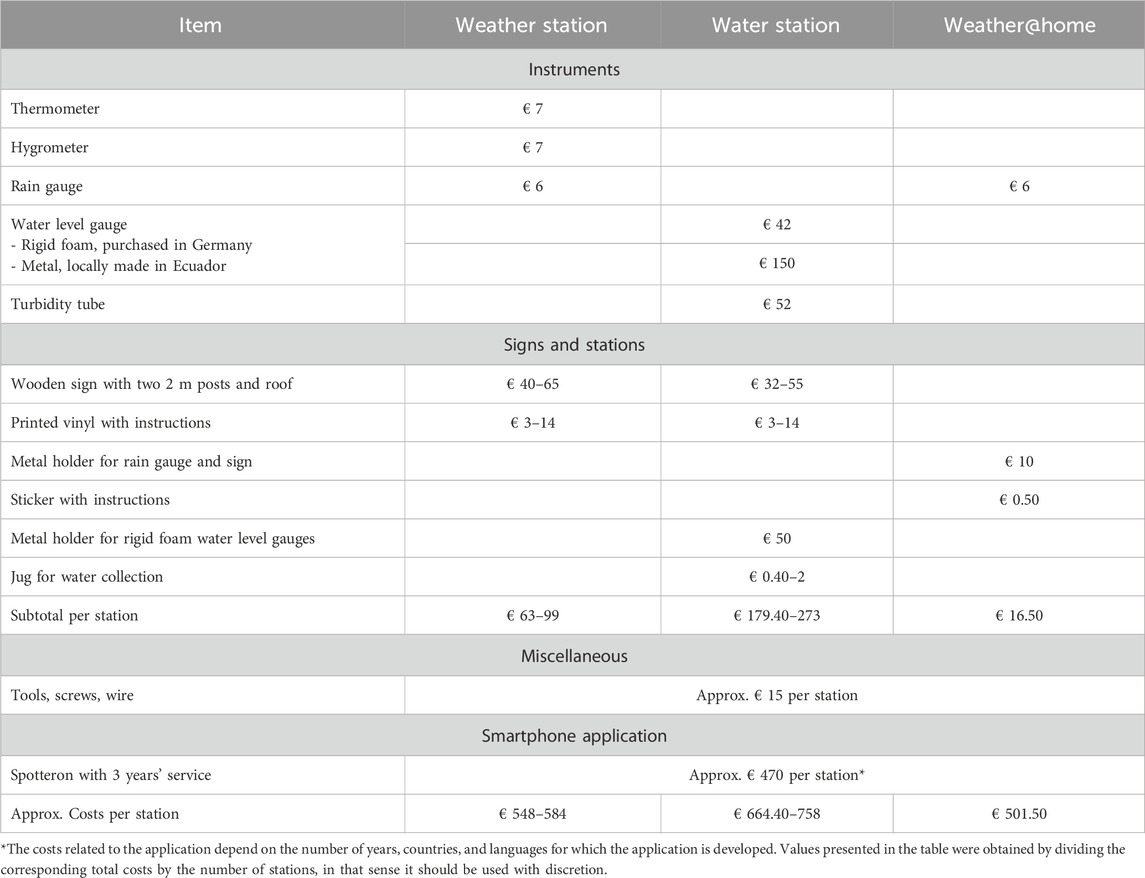
Table 2. Approximate material costs for the stations. Ranges of values are due to differences in costs between the countries where the materials were obtained.
2.3 Project promotion
Given the participatory nature of the project, its success is dependent upon the level of involvement demonstrated by the volunteers. Consequently, the project was disseminated through a range of channels, tailored to address the diverse characteristics of the target demographic, aiming at reaching a substantial number of volunteers.
During the fieldwork conducted in the case studies, the HydroCrowd team attended meetings organised by relevant institutions concerning the water management of the respective parks. During these meetings, the objectives of the project were presented, and the application process was outlined in brief.
Moreover, informal meetings were held with personnel from the institutions responsible for managing the national parks, park rangers, members of neighbouring communities, and members of the water councils. The purpose of these meetings was to disseminate comprehensive information about the project and the potential use of the app. Additionally, personnel from tourist information points, tourist agencies, tour guides, and hotel managers were approached. In Tanzania, the weather@home stations were requested by guest houses situated near the park, as their personnel expressed a keen interest in disseminating information about the project to their visitors. Furthermore, training sessions were conducted for mountain guides through tour operators and guides associations, to act as local promoters of the project.
In the case of Honduras, it was observed that communities require consistent support and engagement. Consequently, a local staff member was brought on board as part of the HydroCrowd team with the objective of leading the promotion of the project.
Promotional materials (e.g., posters, postcards, and flyers) were provided to facilitate further dissemination of the project among stakeholders. Instructional videos were produced in English, Spanish, and Swahili to raise awareness of the project, but primarily to train volunteers on how to use the smartphone application. Furthermore, stakeholders are provided with monthly and quarterly reports with the aim of keeping them informed about the status of the data collection and the variables monitored during the respective periods.
In order to disseminate information to the general public, the project has also established social media accounts on the most commonly used social media platforms. These accounts include Facebook, Instagram, X (formerly Twitter), and LinkedIn, with the latter being employed with greater frequency for the dissemination of academic content. The aforementioned media outlets are intended to further disseminate information regarding the project and the use of the application, to direct attention towards our case studies and the monitoring that HydroCrowd is conducting, as well as to share results.
2.4 Data collection platform and availability
In light of the extensive range of possibilities for data collection and sharing that smartphone applications offer, a project-specific data collection application was developed by SPOTTERON and is available for use on Android and iOS systems. The application is available in English, Spanish, and Swahili. It allows a volunteer to geographically locate a HydroCrowd station, access historical data (i.e., previous measurements submitted by volunteers) from all stations, and submit their own observations. To add an observation, the volunteer is required to take a single photograph of all instruments (weather station), the water level gauge (water station), or the rain gauge (weather@home station) and enter the corresponding readings. Furthermore, the app allows volunteers to respond to additional questions, such as those related to current weather conditions or about the water colour. The app includes pop-up screens that provide supplementary information and instructions on how to take a measurement. However, this feature relies on a stable internet connection. After the submission of an observation, the data is immediately visible to other volunteers in the application. Observations can be submitted when the volunteer is at a station, or at a later point in time. The correct date and time of the observation can be obtained from the metadata of the photo submitted by the volunteer or can be set manually before submission.
An alternative web interface (https://www.spotteron.com/hydrocrowd) is also provided, enabling volunteers to submit observations without the need to download the app on their phones. QR codes were created for some of the stations and are displayed in their panels, facilitating the direct submission of observations through the web interface.
Furthermore, the application enables volunteers to download stations and maps of an area of interest to be used offline. However, it should be noted that observations saved without an internet connection are not automatically uploaded to the platform. Volunteers are not prompted to register for SPOTTERON after downloading the application, and the application can also be used without registering. Observations which were submitted without prior registration or through the web interface are marked as ‘anonymous’. The downloading of data from individual stations requires the creation of a user account.
Volunteers also have the possibility to submit other weather and water-related observations in the form of a photographic note (Photo Note). Thus, the volunteers have the option of capturing an unusual event occurring in their surrounding area, such as heavy precipitation or the occurrence of hail, and submitting it to the application. For the purposes of this analysis, the data pertaining to Photo Notes has been excluded.
Volunteers who utilise the application with a user account are also able to delete their own observations and submissions, in cases where errors have been made or the submitted photographs are incorrect.
All the collected observations are publicly available and they can be accessed and retrieved using the application, the web platform, or the HydroCrowd interface (https:/interface.hydrocrowd.de/). Additionally, the online platform Agua de Honduras (https://aguadehonduras.gob.hn/), developed to facilitate free sharing of data concerning water resources in the country, directly imports the data and provides it for its users. This demonstrates the interoperability and possibility to directly support water management decision-making in the target country.
2.5 Data availability, classification of volunteers, and errors
The full dataset can be accessed by a restricted group of users via SPOTTERON’s back-end and contains all submitted observations, including those that were removed from the front end by volunteers. Each observation is identified by a unique ID (spot ID) and contains the following information: the station to which it was submitted, the date and time it was submitted, the weather or water data, and the associated photograph. This allows the researchers to manually verify the submitted data and to correct any mistakes, except when the volunteer submitted an incorrect photograph. Additionally, the user ID of the volunteer who submitted each observation is visible. It should be noted that anonymous volunteers are assigned the same ID number. This information is used to analyse the frequency and duration of participation by volunteers. Using this comprehensive set of information, a timeline of the number of submitted observations, the volunteer involvement, and the type and frequency of errors made by volunteers during the data submission process can be created. The classification of errors is outlined in Table 3.
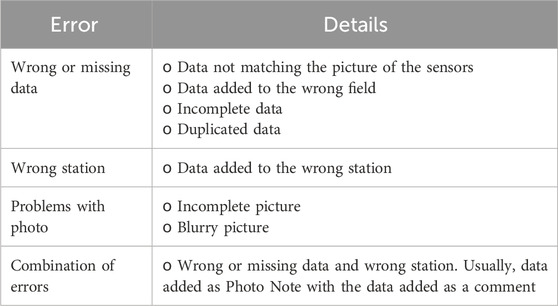
Table 3. Description of error types considered in this study.
As previously stated, the photograph submitted from weather stations must show the thermometer, hygrometer, and rain gauge in order for it to be considered complete. In the case of the water stations, a complete photograph must show the water level gauge. In the case of the weather@home stations, it should show the rain gauge with the scale visible in the photograph. Consequently, the values that can be verified and considered in this analysis for errors or missing data are precipitation, temperature, humidity and water level.
Given that HydroCrowd is targeting two different volunteer demographics, rules for classifying a volunteer to either of the two groups were established through analysis of the collected data. Since the groups can be distinguished by the amount of time they spend in the project regions, we quantified the time spent there based on the number of measurements a person was likely to submit during a short (touristic) stay. At Kilimanjaro, the Machame Route is the longest climbing route (6 to 7 days), which is also characterised by its high number of HydroCrowd stations (six stations). It was hypothesised that non-frequent volunteers (tourists) would be inclined to submit data within a seven-day period, contributing a maximum of six observations. The latter value was considered as it was observed that volunteers typically take one observation per station, even when they might be staying longer at a camping site close to a station and can submit several observations. It was also considered that a non-frequent volunteer would submit data to specific stations usually in a specific order, following the order of stations along a route. Consequently, a volunteer was classified as a non-frequent volunteer when: i) all submissions of the volunteer occurred within 7 days; ii) the data submitted followed a certain pattern (e.g., observations submitted to stations along the Machame Route); and iii) they submitted not more than six observations.
Furthermore, it was hypothesised that anonymous volunteers were non-frequent volunteers. This was based on the assumption that not all non-frequent volunteers have the time or interest to use the app or to create a user profile for only a few days.
Volunteers who contributed observations over a longer timeframe were classified as regular volunteers. It has been observed that most of their contributions are typically directed towards a single station, when located within a community or at the entrance to a tourist path. Few regular volunteers contributed to multiple stations, usually while overseeing the typical routes that facilitate the management of parks.
Moreover, it was possible to ascertain whether volunteers used the offline mode or uploaded the data after the moment of the observation. The application collects the time at which the image was captured, a detail that is typically recorded in the metadata of images stored on mobile devices. Furthermore, the application also records the time at which the image was uploaded. A larger time difference between the time the image was captured and uploaded suggests offline use or later upload.
2.6 Survey
To analyse the involvement and motivation for the participation of volunteers in the region, an online survey was disseminated via the SPOTTERON app. The link was distributed twice a week for a period of 2 months, after which a review of the responses was conducted. In addition, surveys were conducted in person, when possible, in the three case study areas.
The questionnaire was designed to serve as a mid-term evaluation, to assess:
• The motivation of volunteers participating in PM.
• The potential for improvement of the general set-up of the project, particularly concerning the app.
• The most effective methods for engaging more people in the collection and submission of data.
The survey employed a rating scale to evaluate the app design, ease of use, and accessibility of data. Additionally, open-ended questions were included to ascertain the participants’ motivation for using the app and the data, as well as their perception of the necessity of the data. The full survey is available in Supplementary Appendix I.
It is important to note that the project did not consider any monetary incentives or rewards. Consequently, it was assumed that the motivations of the volunteers were primarily intrinsic rather than extrinsic (Ryan and Deci, 2000). This assumption was later confirmed by the analysis of the motivation reasons that the volunteers submitted.
The motivation was classified into four categories: individual interests, altruism, collectivism, and principlism (Batson et al., 2002). The individual interest category comprises individuals who were more inclined to volunteer in the HydroCrowd context, driven primarily by a personal desire. The altruism category, meanwhile, includes those who are driven by a desire for the improvement of other individuals. The collectivism category encompasses individuals motivated by the objective of enhancing the availability of data or information for the benefit of a collective. Finally, the principlism category refers to the motivation driven by a moral principle. As previously stated by Larson et al. (2020), the initial three categories are highly suitable for the classification of volunteers’ motivations in this particular context. Furthermore, Larson et al. (2020) employed a thematic classification approach to identify the motivational drivers underlying the volunteers’ participation. Based on this methodology, a few key themes were identified and utilised to organise the topics of interest by the volunteers expressed:
• Science: This group was characterised by individuals engaged in research activities, including the investigation of research topics, the collection of data for research purposes, and the advancement of research efforts.
• Recreation: This group was comprised of individuals who participated in volunteering activities as part of outdoor pursuits, environmental stewardship, or for personal enjoyment.
• Accomplishment: This group was characterised by individuals seeking to gain new skills or to transition into a new sector or field of work.
• Information: The volunteers in this group engaged in the collection of data to create a database to inform themselves or others about the characteristics of the weather. It should be noted that their activities did not involve any scientific use.
3 Results and discussion
3.1 Descriptive analysis
The data set under consideration comprises all data submitted prior to 30 June 2024 that has not been deleted by the volunteers from the front end. By the specified deadline, a total of 2,333 observations had been submitted. As previously stated, the data excluded from this analysis are those from stations outside the scope of this analysis. The observations contributed by the HydroCrowd team were also excluded. The final data set, thus, comprised 71% of the total submissions, resulting in a total of 1,585 observations.
3.1.1 Data distribution per case study and type of station
Table 4 illustrates the proportion of data derived from each case study, categorised according to the kind of HydroCrowd stations (weather stations, water stations, and weather@home stations). Given the considerable number of stations situated in the Kilimanjaro National Park, it was anticipated that the majority of the data would originate from there (67%). This was followed by data from Tomebamba (21%), Cacique Lempira Reserve (8%), Cajas National Park (4%), and finally Santa Rosa de Copán (1%).
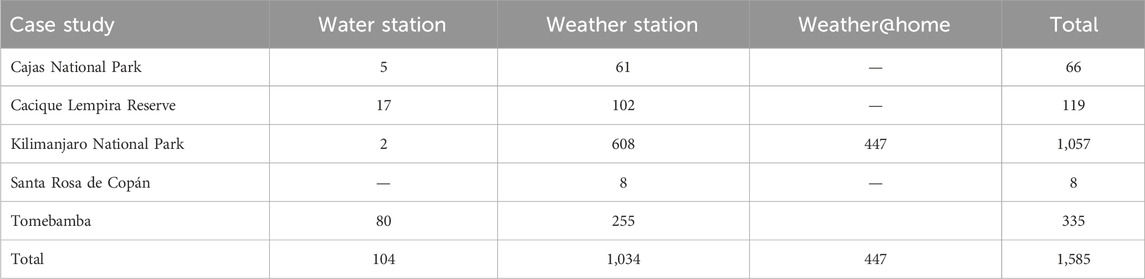
Table 4. Amount of observations per case study differentiated by type of HydroCrowd stations.
The dataset predominantly constitutes data from weather stations (38% of the total data collected) installed in the Kilimanjaro National Park. Additionally, 28% of the total data is sourced from weather@home stations, all of which are situated in the aforementioned region. This result underscores the substantial contribution of volunteers within the area.
Additionally, the weather station in Tomebamba contributed a considerable number of observations to the dataset. A total of 16% of the data analysed was collected at the weather station installed as part of this case study. This is a notable figure given that only one weather station was installed. The results of this case study demonstrate the high potential of community engagement in PM to increase data availability. This aligns with the outcomes of previous studies that have examined the role of community engagement in PM in similar contexts (Weeser. et al., 2018; Wilson et al., 2018; Shinbrot et al., 2020; Starkey et al., 2017; Pandeya et al., 2021). The weather stations installed in Cacique Lempira Reserve and Cajas National Park contributed 6% and 4% of the total data, respectively. The weather station in Santa Rosa de Copán contributed 1% of the total data, a figure that is consistent with expectations due to its recent installation.
The data collected at the water stations represent approximately 7% of the total observations submitted. The data were predominantly collected at the case study site of Tomebamba (5% of the total data), followed by the Cacique Lempira Reserve (1% of the total data collected) (Table 4).
3.1.2 Data distribution in time
The temporal distribution of data across the case studies exhibits considerable variation (Figure 6). The Kilimanjaro National Park and the Tomebamba case studies are the only cases where data has been submitted consistently. A notable decline in the quantity of data submitted in the Tomebamba case study indicates a decline in interest in the data and the project.
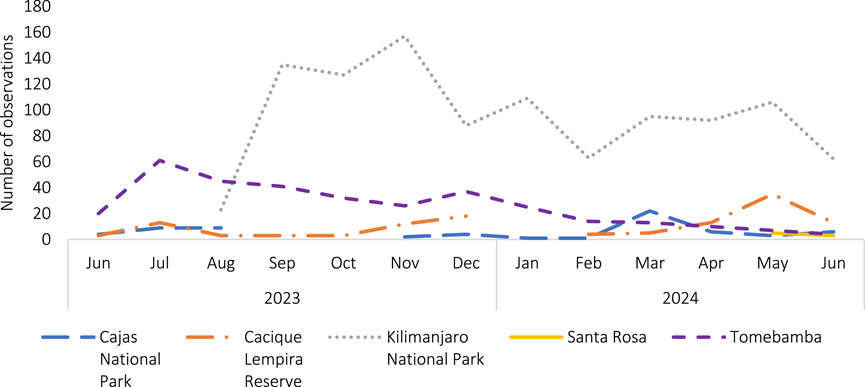
Figure 6. Number of observations over time per case study.
In general, the peaks in the number of observations occurred during the months in which field trips were conducted by the HydroCrowd team. In the case of Kilimanjaro National Park, the highest number of observations submitted can be attributed to the first HydroCrowd field trip and associated awareness-raising and training meetings, which took place from September to December 2023. Following this period, there was a decline in observations, which then increased during the second trip to the region between March and May 2024, when another round of training was conducted. In June 2024, the final month within the scope of this analysis, the amount of observations declined once more.
Similar to Ecuador, peaks in the number of submitted observations occurred in the months during which field trips were conducted, namely, June 2023, December 2024, and March 2024. The data demonstrate that following the initial field trip, there was a rapid decline in data collection, with no data collected between August and November 2023. The case study of Cajas National Park exhibits the lowest number of observations of all three case studies. The case study in Tomebamba also exhibited peaks during the aforementioned field trips, except for March 2024.
In the case study of the Cacique Lempira Reserve, a comparable pattern is observed, although the absence of observations is limited to January 2024. However, the number of observations submitted is relatively low. It is evident that there is a peak in data collection corresponding to the field trip undertaken between April and May 2024, when the majority of the stations were installed and when there was more intensive interaction with local communities living around the stations.
The results demonstrate that when the team is engaged in promoting the project, there is a notable increase in participation. Otherwise, there is a gradual decline in the number of observations submitted.
The data was analysed on the assumption that in areas with poor internet connectivity, the data upload takes a couple of minutes. Accordingly, a 10-min window between data spotting (i.e., taking the photograph) and submission was considered to be a reasonable timeframe for the two events to occur concurrently. The data indicated that some case studies rely considerably more than others on the offline features and the option of uploading a previously taken picture at a later stage. The Cacique Lempira Reserve area demonstrated the highest reliance on the aforementioned options, with 42% of the data uploaded in this manner. Tomebamba exhibited a 31% submission rate with a time difference, while Cajas National Park and Santa Rosa exhibited 27% and 25%, respectively. In the Kilimanjaro National Park, only 7% of the data was uploaded using either the offline feature or after it was collected. However, most of the data from Kilimanjaro National Park was submitted from stations with relatively good mobile network coverage, suggesting that these stations are typically located in areas with greater access to the internet. Only 27 observations were submitted from stations in more remote locations, particularly within the park, which have limited internet connectivity.
These results are pertinent and highlight the significance of internet access in data collection using smartphones. In the Cacique Lempira Reserve region, a considerable number of stations have been installed in locations with limited internet access, which has led to a high level of data uploaded after being collected by volunteers. Notably, the percentages of data using the offline features in the Cajas National Park (27%) and the Kilimanjaro National Park (7%) are relatively low, particularly considering the absence of internet connectivity in major parts of these regions. This also demonstrates that the majority of observations were submitted from stations with internet access. While volunteers may have taken photographs of their observations at stations without internet access, they did not subsequently upload them on return to a location with internet.
3.1.3 Data submitted by type of volunteer
In terms of the number of observations submitted by the two types of volunteers, 89% of the data is contributed by regular volunteers, the majority of which are located in the Kilimanjaro National Park region, where two volunteers collected around 26% of the total data. In addition, around 19% of the data was collected by a single regular volunteer in Tomebamba. Non-frequent volunteers account for 11% of the data submitted.
This evidence indicates that there is principally one single individual in Tomebamba responsible for data collection. A potential explanation for the observed decline in data submission is that the volunteer may have lost interest. This outcome is also comparable to that of other long-term initiatives utilising the PM methodology, wherein it is evident that there are volunteers who demonstrate greater levels of engagement than others and more lasting commitment (Davids et al., 2019; Tiago et al., 2017; Sauermann and Franzoni, 2015; Lowry et al., 2019; Njue et al., 2021; Dagorne et al., 2020; Harley and Kinsela, 2022).
The presence of regular volunteers in the Kilimanjaro National Park region explains the constant amount of observations submitted in this particular case study. A detailed examination of the data set from the Kilimanjaro National Park region revealed that approximately 91% of the data was collected by regular volunteers (Figure 7). The few observations from non-frequent volunteers indicate a lack of engagement in the region from both visitors and the tourism agencies visited as part of the promotion of the project. These findings align with some results found by Butler et al. (2023), who analysed the utilisation of PM as a methodology for the collection of environmental data from tourists as volunteers. The authors observed that, while tourists may be a valuable source of data in certain projects, their participation is not always consistent. This is due to several factors, including the time and geographical constraints associated with tourism, as well as the varying levels of effort among volunteers in providing high-quality images and other forms of data (Balaguera-Reina et al., 2020; Beale et al., 2019; Andrzejaczek et al., 2016; Araujo et al., 2017; Krželj et al., 2020). This may be attributed to the fact that tourists may be unaware of the project or its specific circumstances (e.g., the need for a phone application or internet), or that their travel plans may not align with the project’s requirements (Dagorne et al., 2020). However, there are also projects in which the involvement of recreational visitors has been highly successful, with a considerable quantity of relevant and consistent data being contributed (Mascioni et al., 2019; Rameli et al., 2020; Wright et al., 2016). In some cases, the data collected from remote areas was entirely sourced from tourists (Armstrong et al., 2019). The success of these projects was largely attributable to the significant involvement of researchers (Armstrong et al., 2019) or the necessity for continuous interaction with the research team (Fischer et al., 2023; Mascioni et al., 2019).
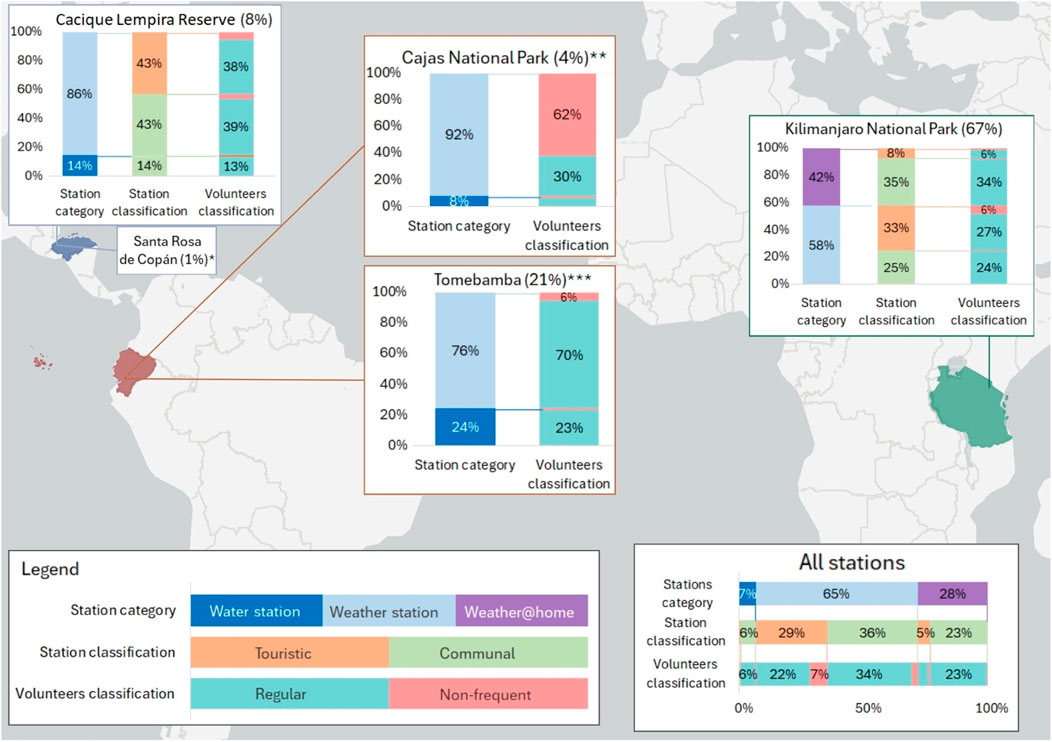
Figure 7. Distribution of observations according to the case study, HydroCrowd station categorisation, station classification according to targeted volunteer groups, and the classification of actual volunteers that submitted observations. The percentage of data contributed by each case study to the total is indicated between brackets.* In Santa Rosa de Copán, the weather station installed was classified as communal, and all the data was submitted by non-frequent volunteers.** In the Cajas National Park, all the stations are located in areas frequented by tourists; therefore, they are classified as touristic.*** In Tomebamba, all the stations were classified as communal.
A thorough evaluation of the data reveals that in the Kilimanjaro National Park case study, the communal stations are of significant importance in the data collection process, contributing 60% of the total data (Figure 7). Furthermore, the data analysis showed that 40% of the data came from touristic stations. However, only 12% of the total observations came from stations installed at guest houses and hotels, demonstrating that this method for engaging tourists in PM might not be effective.
In the case of the Cacique Lempira Reserve, approximately 91% of the data was provided by regular volunteers (Figure 7). This outcome was anticipated, given that most of the monitoring stations are situated within local communities. Results are indicative of the organisational structure of the communities, in which there are typically designated roles and responsibilities for individuals involved in community management. The results show that the stations managed by communities contribute approximately 57% of the total data collected. In contrast to the expectation that the majority of the data from the stations located along the tourist paths within the national park would be submitted by tourists, the analysis shows that the majority of the data from those stations is collected by regular volunteers.
In the case of Cajas National Park, the data collected represent only 4% of the total data collected in the case studies in the scope of this analysis. In this case study, approximately 38% of the data was collected by regular volunteers, while the remainder was collected by non-regular volunteers (Figure 7).
The findings in the Cacique Lempira Reserve and Cajas National Park are largely consistent with the volunteer groups that are the primary focus of the data collection efforts. Nevertheless, the low numbers indicate that it is necessary to attract the interest of a greater number of volunteers in order to ensure the long-term viability of the project and of PM methods in general. This point is also highlighted by Sauermann and Franzoni (2015), Hansen and Bonney (2023), West and Pateman (2016), and Ronda (2021).
The limited number of observations from non-frequent volunteers is a recurring issue across the three case studies. In addition to the aforementioned issue in the Kilimanjaro National Park, it is crucial to acknowledge that guides have scheduled tours and that they may be disinclined to participate in supplementary activities, which could have a negative impact on their revenue (Ronda, 2021). Additionally, some guides and tourist agencies may feel that the project’s objectives, including explaining the purpose of data collection to tourists, exceed their knowledge base. This could result in a lack of clarity in their ability to effectively communicate the project’s goals and ensure accurate information dissemination to tourists (Ronda, 2021).
In general, the absence of non-frequent volunteers gives rise to concern, as the departure of regular volunteers from the area would result in a notable decline in the observations submitted in the case studies, thereby jeopardising the sustainability of the project under current conditions. Furthermore, the data indicated that regular volunteers typically do not access the stations situated on the mountain. It can be reasonably deduced that data collection by tourists in remote areas may require a greater researcher presence in the initial stages. This would serve to establish a robust foundation for guides and tourist agencies to subsequently promote the project.
3.2 Data quality
A total of 18% of the dataset was found to contain some form of error. The majority of errors (57%) are the result of the submission of incorrect or incomplete values in comparison to the values depicted in the pictures provided (Table 5). These values can be rectified with relative ease, as the images serve as a reference for correcting the values. A similar situation arises with data submitted to the incorrect station (5%). The pictures are utilized to assign the data to the correct stations.
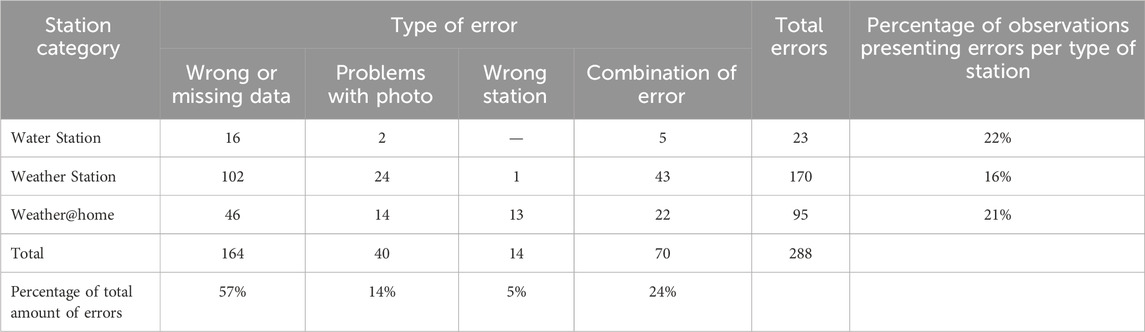
Table 5. Distribution of type of errors by station category.
The erroneous data (incorrect or incomplete values) indicate that users encounter difficulties when reading the sensors and submitting the data. The underlying reasons for the failure to submit complete data or the occurrence of errors remain speculative; however, some volunteers have indicated that the sensors are challenging to read. Such errors could be avoided by providing citizen scientists with training. However, this would not work for approaches that rely on non-frequent volunteers (e.g., tourists), as they would not be able to receive training. The selection of clear, easy-to-read sensors for citizen science projects could also contribute to reducing this type of error, but depends on the availability of such sensors or the ability to develop these within the project. One could also decide to omit the step whereby the volunteer has to manually enter the values and simply use the photographs and, for example, an AI approach to extract the values from the photograph. This, however, requires that the volunteers submit photographs of sufficient quality and our data show that this is not always the case.
Challenges arise when the errors concern the images themselves, as this hinders the ability to validate the observations, rectify mistakes, or add missing data. This accounts for approximately 14% of the total number of errors identified in the data set.
Despite the instructions at the stations detailing the sensors and tools that must be included in the photograph to be uploaded, this issue persists. It is therefore important to consider enhancing the design of the panel to ensure a clearer example of the photograph to be uploaded. Potential modifications to the design may include the incorporation of a larger image of the sensors that must be included. In addition, the photo field in the smartphone application could be adapted with a mask that clearly guides the user on how to take a photograph (e.g., with the photo orientation and the shape of the objects that should be in the photo). Training of regular volunteers, including tour guides that could support tourists with their submissions, would also help to mitigate such errors.
In instances where data is submitted with a combination of errors, it is typically due to challenges with the app’s usage and functionality. These errors pertain to the submission of a station’s observation as a Photo Note rather than to the corresponding station (24%). Submissions made as Photo Notes were corrected by manually allocating the submission to the corresponding station. A decline in errors pertaining to this issue occurred after the application was modified and the process of adding a submission to an existing station made easier. It is nevertheless clear that the application remains challenging to navigate. Although the Photo Note provides the possibility to collect additional information that cannot be captured with the weather and water stations, removing this possibility, given its sporadic utilisation, from the application would be the most effective way to mitigate these kinds of errors.
Table 5 illustrates the number of observations with errors per station category and per type of error. In the last column, the percentage of data with errors per station category is shown. Water and weather@home stations demonstrated an error rate of 22% and 21%, respectively, while the weather stations exhibited a lower error rate (16%). The final row of the table provides the distribution in percentage terms per error type.
The quality of the data exhibited fluctuations over time. Figure 8 illustrates a series of peaks in the percentage of errors (total and by type), with the most notable occurring in November 2023. This period coincided with the installation of all stations in the Kilimanjaro area, resulting in a surge in data collection and the addition of new volunteers. The proportion of erroneous data exhibited a gradual decline until February when incremental modifications to the application were implemented. The proportion of erroneous data submissions ranged from 13% to 25% of the total data set.
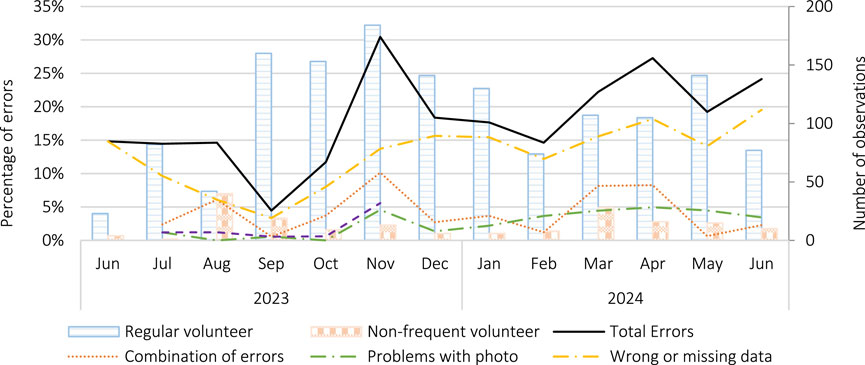
Figure 8. Total amount of errors and per type of error, expressed as percentage of total amount of observations (black line and coloured lines, left axes) and number of observations submitted per type of volunteers (clustered bar, right axes) during the study period.
It is evident from these figures that issues with data uploaded to the incorrect station have ceased since November 2023, when the application was modified to display only stations in the volunteer’s vicinity, as previously mentioned. It is also noteworthy that there has been a decrease in observations involving a combination of errors since that point, suggesting that more recent errors likely concern either wrong or missing data and incomplete photographs. The observed decline in errors suggests that the application modification has contributed to error reduction. While errors related to incorrect photographs persist, they no longer occur in conjunction with other types of errors, such as erroneous station identification. This underscores the need for clearer instructions on the station panels, as previously highlighted.
It was anticipated that the incidence of errors would decline due to the increased familiarity of regular volunteers with the data collection and submission process; however, this has not occurred. There is no discernible reduction in the number of errors, indicating that our volunteers continue to face challenges, especially regarding reading the sensors.
In general, errors are predominantly attributable to non-frequent volunteers, with 29% of their data exhibiting errors, compared to 17% for regular volunteers. These values vary slightly across the case studies. In the Cajas National Park, for instance, 53% of non-frequent volunteers’ data contain errors, while 33% of observations by frequent volunteers are similarly affected by errors. The majority of these errors are attributable to issues during the upload process, where incomplete or incorrect data is submitted to the incorrect stations. In the Cacique Lempira Reserve, 18% of observations submitted by non-frequent volunteers contained errors, while 25% of data submitted by local volunteers was found to be incorrect. The majority of these errors in the local data were due to incomplete or incorrect submissions, with some users submitting only photographs. In the Kilimanjaro National Park, 25% of the non-frequent volunteers’ observations contained errors, while 18% of the regular volunteers’ observations were found to be incorrect, largely due to errors in the observation values uploaded.
While the number of observations with errors is higher in the Kilimanjaro National Park, this accounts for only 20% of the data collected there. In the other regions, the data with error account for 53% in the Cajas National Park, 45% in the Cacique Lempira Reserve, 38% in Santa Rosa de Copán, and 6% in Tomebamba. The low error percentage at Tomebamba is likely due to the engagement of one designated and trained individual for data collection. In Supplementary Appendix II, a comprehensive overview of the identified errors is provided, along with a detailed analysis of their probable causes and potential mitigation strategies.
3.3 Questionnaire results
A total of eleven complete surveys were received in response to the online survey. However, two volunteers submitted the same responses on two separate occasions, resulting in a total of nine complete surveys. All volunteers reside within the boundaries of one of the case study regions.
In the case of the surveys conducted in person in the Kilimanjaro National Park region, a total of eight completed surveys were obtained. Upon examination of the data, it was discovered that two of the respondents to the survey had also completed the survey online. Consequently, the subsequent analysis focused exclusively on the in-person survey responses. The survey was conducted close to the stations in areas where respondents had the opportunity to participate, for instance, before embarking on the trail or at guest houses and with the participation of the relevant stakeholders at each of the designated stations. It is noteworthy that the individuals who participated in the survey in the Kilimanjaro region were people who had experience with the app and the stations, and thus the answers predominantly reflected the views of regular volunteers.
In the case of the Cacique Lempira Reserve, the research team carried out a total of 19 surveys in person, of which three were complete. The surveys were conducted in person during the meetings of the water councils of the two main basins within the region of the project, during which the project was presented once more. All volunteers were provided with the survey, thus offering them the opportunity to share their comments and suggestions regarding the data they require or would utilise. It was evident that a considerable number of volunteers had observed the station but had not participated actively in the data collection process. The results demonstrated that there is a limited number of volunteers, as the majority of the water council members lacked awareness of the app, its data submission process, and the project.
The online survey unfortunately received only one response from volunteers in Ecuador. Further efforts to obtain complete survey responses in person were unsuccessful.
While the online survey was aimed at reaching non-frequent volunteers, only regular volunteers responded in the online survey. This may be attributed to the fact that the survey link was disseminated via the app, which is likely to be utilized frequently by regular volunteers. In contrast, non-frequent volunteers may have used the QR codes to submit data, and if they had the app, it is likely that they no longer use it.
While it is evident that volunteers from the Kilimanjaro National Park contributed approximately 60% of the survey responses, it is notable that 51% of the HydroCrowd volunteers are located within the region. In contrast, 13% of volunteers are located in Honduras, and 33% of surveys completed come from there. A further 23% of volunteers were located in Cajas National Park, while the survey completed in Ecuador accounted for 6% of the total. This outcome was anticipated, as Cajas National Park and Tomebamba have been observed to have the lowest quantity of regular volunteers. Consequently, the survey results are consistent with the observed level of involvement from each region.
However, it is evident that a certain degree of bias exists, primarily because the majority of responses originate from regular volunteers. In order to enhance the application and the project as a whole, it is important to comprehend the reasons behind the under-participation of non-frequent volunteers. To this end, further surveys are required, such as participating in trail excursions with tourist groups, with the aim of observing and analysing their reasons for not submitting more observations.
The findings from both the in-person and online surveys suggest that the majority of volunteers had used the app on their mobile phones rather than on the web platform. In contrast, one volunteer indicated that they had used the web platform. This outcome was anticipated, as the distribution of the survey link was conducted through the application, thereby, potentially excluding non-frequent volunteers from survey participation. Nevertheless, the substantial quantity of data submitted anonymously serves to illustrate the significant role played by the online HydroCrowd platform in the collection of data.
Figure 9 illustrates the findings of the comprehensive assessment of the mobile app. Overall, the app has been well-received; however, several areas require attention.
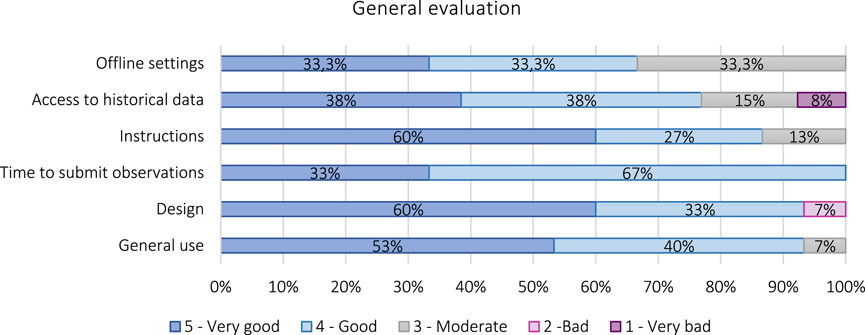
Figure 9. General evaluation of the smartphone application (n = 18).
For instance, the offline settings have been met with a largely positive response, with circa 33% of respondents rating them as ‘very good’ and a further around 33% describing them as ‘good’. However, a notable proportion of volunteers (circa 33%) have indicated that their experience with the settings was rather moderate. In general, the process of downloading stations and maps in a region is relatively straightforward. However, challenges have been identified in the process of offline data collection. While volunteers have the ability to collect and save observations, they must also remember to upload them once they have an internet connection. This potential discrepancy in the data collection process may contribute to the overall perception of the feature as ‘moderate.’
The provision of access to historical data was also met with a favourable response, although it is the sole feature to have been subjected to a negative evaluation (very bad = 8%). The historical data is displayed within the application, although it is not presented in graphical form. Furthermore, the data cannot be downloaded without first creating a volunteer account. The design also received some unfavourable reviews (bad = 7%), as some volunteers found the overall design to be user unfriendly.
It is noteworthy that volunteers expressed high levels of satisfaction with the time required to submit observations, rating it as ‘very good’ (33%) and ‘good’ (67%). Additionally, the instructions and general use received a favourable rating, 60% and 27% of respondents finding them ‘very good’ and ‘good’, respectively. A minimal proportion of 13% of respondents considered it ‘moderate’.
In terms of the ease with which data can be submitted and subsequently read, the different sensors and tools are considered. Figure 10 illustrates that the majority of volunteers perceive the data collection process to be either very easy or easy.
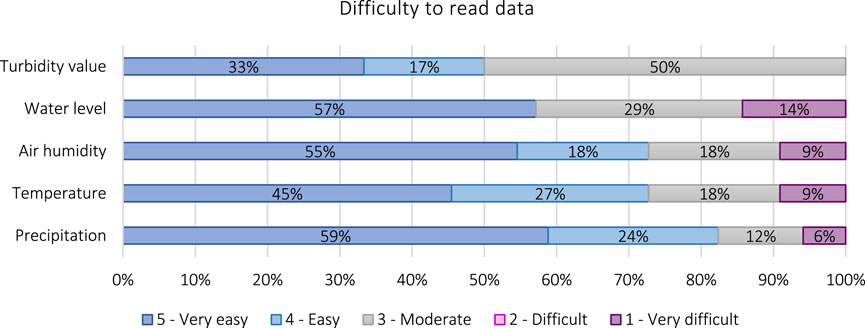
Figure 10. Volunteer’s evaluation of the difficulty of reading the sensors and instruments (n = 18).
However, a small number of volunteers have indicated that it can be challenging to collect data (very difficult = around 38%). This is primarily because some volunteers have indicated that the numbers in the sensors are either too small to be legible or not sufficiently straightforward to interpret. This is exemplified by the water level gauges, which display large numbers at 10-cm intervals, thereby creating confusion among some volunteers as to the precise value to be entered. In this regard, 14% of the volunteers surveyed indicated that it was ‘very difficult’ to read the value due to the displayed format numbers.
The data regarding temperature and humidity was considered to be ‘very difficult’ by 9% of respondents, largely due to the aforementioned issues with the size of the numbers. Similarly, 6% of respondents found precipitation data to be ‘very difficult’ to read, again for the same reasons.
The research team examined the potential for installing sensors at the stations that could be readily readable not only by the volunteers but also by those engaged in subsequent data verification. Regrettably, the current market offers a restricted range of analogue sensors that are straightforward to install, reasonably priced, and require minimal or no maintenance.
3.4 Motivation analysis
The analysis of the survey results demonstrated that the predominant motivations of the HydroCrowd volunteers were individualistic (circa 46%), followed by altruistic (27%), collectivist (13%), and principlism (circa 14%) motivations (Figure 11). Etter et al. (2023) analysed the motivations underlying initial and long-term commitment to a similar project. Their findings indicated that altruistic and principled motivations were the primary drivers. In the context of our analysis, altruistic volunteers are primarily interested in collaborating to create an open source of information for the community and for volunteers who are interested in this kind of information. This is, in fact, the most significant motivating driver as the largest proportion of volunteers can be classified under the ‘information’ category (around 47% in total). This indicates that the volunteers considered the submission of data to share it with the community and the creation of a database to be of significance. Some volunteers indicated that the collection of data is crucial for the benefit of communities and the enhancement of preparedness.
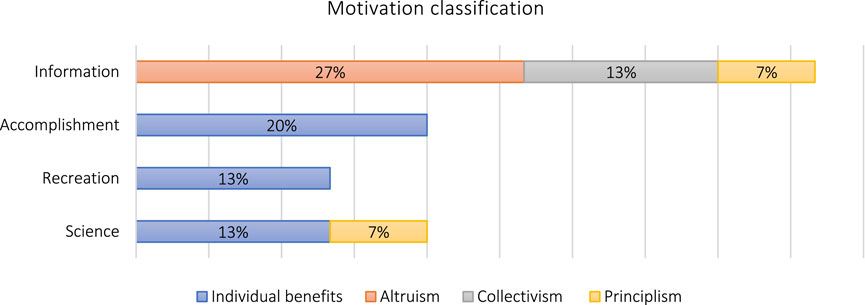
Figure 11. Accumulative motivation by drivers underlying volunteering (information, achievement, recreation, science) classified under the motivational categories (individual benefit, altruism, collectivism, principle). Motivation classification by category (n = 15).
Scientific inquiry and accomplishment both represent a significant motivating driver (20% each). It was also noted by volunteers that they engage in research activities within the region, or that they wish to provide support to research initiatives in the region. It is important to note that information and science represent 66% of the reasons why volunteers are engaged in data collection activities. This is a notable finding, as a considerable proportion of the volunteers recognise the potential value of the data they collect and its applicability to a range of issues, including climate change adaptation. Etter et al. (2023) similarly identified that regular volunteers are highly motivated by the opportunity to collect data, to be available to others, and to facilitate the accessibility of scientific knowledge.
‘Accomplishment’, which encompasses learning new skills or deepening one’s understanding of hydrometeorological monitoring, represents approximately 20% of the total responses. Shinbrot et al. (2020) also observed that volunteers showed a high level of interest in learning about the environment and precipitation patterns. This interest was identified as a constant priority throughout the various stages of the project under analysis. This is a finding that presents an opportunity for further exploration, particularly concerning the potential for enhancing educational outcomes. For instance, there is a possibility of providing more detailed instruction on the utilisation of data, the potential for analysis, and the identification of focal points for the project that can utilise the data collected to further inform the community and advance the use of data for adaptation to climate change. Since several HydroCrowd stations are installed at schools, games and educational packages could be developed that stimulate students to interact with the stations while learning about weather and climate.
This, in conjunction with the volunteers’ motivation driven by data collection, availability of open information, and research improvement, can facilitate the development of a more robust approach in which the data collected by volunteers is useful for the communities and they can conduct their analysis following their specific requirements.
Additionally, around 13% of the volunteers submitted observations while engaged in recreational activities, with some citing this as an opportunity to explore nature. Etter et al. (2023) similarly identified motivations associated with recreation, enjoyment of nature, and the desire to spend time outside, yet these were not identified as primary drivers of motivation in terms of commitment to the project. On the other hand, Shinbrot et al. (2020) identified motivations related to recreation under two distinct categories. Both categories demonstrated high scores, yet both exhibited a decline over time, suggesting that this may not be a primary motivation for engaging long-term volunteers.
Despite measures to reach non-frequent volunteers through the app, no non-frequent volunteers responded to the survey. It is therefore not possible to shed light on the motivations of non-frequent volunteers, nor their perceptions of the project and the application. However, given their low overall participation, it is evident that measures must be taken to motivate non-frequent volunteers to participate. A potential solution to the issue under discussion could be the addition of a game mode to the application in order to collect points by “completing missions” by submitting observations from all the stations along a route. Furthermore, it is argued that more intensive collaboration with tourist agencies and water councils is required to increase participation. In addition, it would be advantageous to participate in international tourist fairs, as this would open doors to a larger collaboration with a more diverse range of stakeholders.
4 Conclusion
The objective of the paper was to analyse the type of volunteers involved in the project, thereby providing insights into the comparison between regular and non-frequent volunteers. In addition, the possibility of relying on non-frequent volunteers to regularly collect data in areas where communities are not present was also investigated. The study further delves into the advantages and disadvantages of the approach adopted for data collection, encompassing the app utilized, and undertakes a thorough analysis of the motivation behind volunteer participation in the context of weather and water data collection in mountainous regions.
The analysis demonstrated the significance of exploring alternatives to engage tourists in a manner that does not necessitate researchers to be on site permanently. This is a relevant consideration for PM projects seeking to implement such initiatives in areas where other target groups for data collection are absent. The lack of responses to the survey calls for further consideration, as it raises questions regarding the reasons behind the observed lack of participation.
The data analysis suggests that the project relies primarily on the contributions of regular volunteers rather than on the participation of non-frequent volunteers. In this sense, it seems reasonable to conclude that the engagement of communities is crucial to the success of projects of this characteristic.
This analysis further demonstrates the importance of open data for communities without access to it, as evidenced by motivation analysis. Volunteers are aware of the significance of data collection for the communities’ water management and climate change adaptation strategies. In this sense, generating open data is highly beneficial. This suggests that the data collected by the project could be utilised for these purposes. The data collected by the communities, for the benefit of the communities, could have a further impact on the environments and society if it is used to establish appropriate ecological flow thresholds or to supply water more sustainably. It can also assist in the maintenance of records on water levels, which can be used to identify extreme events and their further characterisation. In this regard, the collected data can be utilised for disaster risk reduction in accordance with the Sendai Framework, particularly contributing to the enhancement of early warning systems. Additionally, the data can assist in achieving several Sustainable Development Goals (SDGs), including SDG 6 (Clean Water and Sanitation) by facilitating the monitoring of water availability, quality, and usage, and SDG 15 (Life on Land) by providing insights on drought and flood monitoring, thereby contributing to the effective management of ecosystems and the preservation of biodiversity. PM has the potential to empower communities by providing them with enhanced data for decision-making purposes.
Additionally, the desire for personal accomplishment and the pursuit of scientific knowledge could potentially further the development of the educational component of PM projects. In this regard, the development of a parallel initiative to promote data collection in schools where HydroCrowd (or similar projects) operates may be considered. Teachers could utilise these stations to facilitate more interactive weather and climate education, thereby enhancing the learning experience for students. Moreover, it is recommended that communities prioritise education on the importance of data collection from an early age, intending to foster a deeper understanding of water cycles among future generations.
Data availability statement
The raw data supporting the conclusions of this article will be made available by the authors, without undue reservation.
Ethics statement
Written informed consent was not obtained from the individual(s) for the publication of any potentially identifiable images or data included in this article because These photos were taken during fieldwork, and at the time, we were unsure if we would be using them for publications. To ensure compliance with data protection regulations, we have blurred the faces and will delete any that may be problematic before publication.
Author contributions
JZ: Data curation, Formal Analysis, Visualization, Writing – original draft, Writing – review and editing, Investigation, Methodology. JV: Writing – review and editing, Investigation, Resources. FC: Investigation, Writing – review and editing. FM: Investigation, Writing – review and editing. FS: Investigation, Writing – review and editing. BW: Investigation, Project administration, Writing – review and editing. SJ: Investigation, Methodology, Project administration, Supervision, Writing – original draft, Writing – review and editing.
Funding
The author(s) declare that financial support was received for the research and/or publication of this article. This research was funded by the Kurt-Eberhard-Bode Foundation in the framework of the junior research group “HydroCrowd”.
Acknowledgments
We would like to thank the Mancomunidad de Municipios del Parque Nacional Montaña de Celaque (Mapance), Honduras; Alliance of Bioversity International and CIAT, Honduras; Empresa Pública Municipal de Telecomunicaciones, Agua Potable, Saneamiento y Gestión Ambiental del cantón Cuenca (ETAPA), Ecuador; the Kilimanjaro National Park Authority (KINAPA); to the DFG Research Unit “The role of nature for human wellbeing in the Kilimanjaro Social-Ecological System (Kili-SES)” for their support of the HydroCrowd project, and to the volunteers for their invaluable contribution, without their dedication and commitment, the success of this project would not have been attainable.
Conflict of interest
The authors declare that the research was conducted in the absence of any commercial or financial relationships that could be construed as a potential conflict of interest.
Generative AI statement
The author(s) declare that no Generative AI was used in the creation of this manuscript.
Publisher’s note
All claims expressed in this article are solely those of the authors and do not necessarily represent those of their affiliated organizations, or those of the publisher, the editors and the reviewers. Any product that may be evaluated in this article, or claim that may be made by its manufacturer, is not guaranteed or endorsed by the publisher.
Supplementary material
The Supplementary Material for this article can be found online at: https://www.frontiersin.org/articles/10.3389/fenvs.2025.1537278/full#supplementary-material
References
Andrzejaczek, S., Meeuwig, J., Rowat, D., Pierce, S., Davies, T., Fisher, R., et al. (2016). The ecological connectivity of whale shark aggregations in the Indian ocean: a photo-identification approach. R. Soc. open Sci. 3 (11), 160455. doi:10.1098/rsos.160455
Araujo, G., Snow, S., Lee So, C., Labaja, J., Murray, R., Colucci, A., et al. (2017). Population structure, residency patterns and movements of whale sharks in southern leyte, Philippines: results from dedicated photo-ID and citizen science. Aquat. Conserv. 27 (1), 237–252. doi:10.1002/aqc.2636
Armstrong, A. J. A., Bennett, M. B., Richardson, A. J., Townsend, K. A., Dudgeon, C. L., and Dudgeon, C. L. (2019). Photographic identification and citizen science combine to reveal long distance movements of individual reef manta rays Mobula alfredi along Australia’s east coast. Mar. Biodivers. Rec. 12 (1), 14. doi:10.1186/s41200-019-0173-6
Ashley, E. A., Pattengill-Semmens, C. V., Orr, J. W., Nichols, J. D., and Gaydos, J. K. (2022). Documenting fishes in an inland sea with citizen scientist diver surveys: using taxonomic expertise to inform the observation potential of fish species. Environ. Monit. Assess. 194 (3), 227. doi:10.1007/s10661-022-09857-1
Balaguera-Reina, S. A., Pinzón-Barrera, C., Farfán-Ardila, N., Vargas-Ortega, D., and Densmore, L. D. (2020). Individual identification patterns as a monitoring strategy for American crocodiles: tayrona national natural park as a study case. Amphib.-Reptilia 42 (1), 73–80. doi:10.1163/15685381-bja10033
Batson, C. D., Nadia, A., and Tsang, J. –A. (2002). Four motives for community involvement. J. Soc. Issues 58 (3), 429–445. doi:10.1111/1540-4560.00269
Beale, C. S., Stewart, J. D., Setyawan, E., Sianipar, A. B., and Erdmann, M. V. (2019). Population dynamics of oceanic manta rays (Mobula birostris) in the Raja ampat archipelago, west papua, Indonesia, and the impacts of the el niño–southern oscillation on their movement ecology. Divers. Distributions 25 (9), 1472–1487. doi:10.1111/ddi.12962
Bergmann, M., Lutz, B., Tekman, M. B., and Lars, G. (2017). Citizen scientists reveal: marine litter pollutes arctic beaches and affects wild life. Mar. Pollut. Bull. 125 (1-2), 535–540. doi:10.1016/j.marpolbul.2017.09.055
Branchini, S., Meschini, M., Covi, C., Piccinetti, C., Zaccanti, F., and Goffredo, S. (2015). Participating in a citizen science monitoring program: implications for environmental education. PloS one 10 (7), e0131812. doi:10.1371/journal.pone.0131812
Butler, G., Ross, K., Beaman, J., Hoepner, C., Baring, R., and Silva, K.Da B. (2023). Utilising tourist-generated citizen science data in response to environmental challenges: a systematic literature review. J. Environ. Manag. 339, 117889. doi:10.1016/j.jenvman.2023.117889
Dagorne, D., Kanté, A., and Rose, J. B. (2020). A citizen science approach to monitoring of the lion Panthera leo (carnivora: felidae) population in niokolo-koba national park, Senegal. J. Threat. Taxa 12 (1), 15091–15105. doi:10.11609/jott.5549.12.1.15091-15105
Davids, J. C., Devkota, N., Pandey, A., Prajapati, R., Ertis, B. A., Rutten, M. M., et al. (2019). Soda bottle science—citizen science monsoon precipitation monitoring in Nepal. Front. Earth Sci. 7. doi:10.3389/feart.2019.00046
Etter, S., Strobl, B., Seibert, J., van Meerveld, H. J., Niebert, K., and Stepenuck, K. F. (2023). Why do people participate in app-based environment-focused citizen science projects? Front. Environ. Sci. 11. doi:10.3389/fenvs.2023.1105682
Fischer, H., Wentz, E., and Gerber, L. (2023). Examining visitor collected species data from denali national park and preserve. CSTP 8 (1). doi:10.5334/cstp.475
Hansen, B., and Bonney, P. (2023). Learning from successful long-term citizen science programs. Pac. Conserv. Biol. 29 (4), 292–299. doi:10.1071/PC21065
Harley, M. D., and Kinsela, M. A. (2022). CoastSnap: a global citizen science program to monitor changing coastlines. Cont. Shelf Res. 245, 104796. doi:10.1016/j.csr.2022.104796
Hecker, S., Bonney, R., Haklay, M., Hölker, F., Hofer, H., Goebel, C., et al. (2018). Innovation in citizen science – perspectives on science-policy advances. CSTP 3 (1), 4. doi:10.5334/cstp.114
Hesley, D., Burdeno, D., Drury, C., Schopmeyer, S., and Lirman, D. (2017). Citizen science benefits coral reef restoration activities. J. Nat. Conservation 40, 94–99. doi:10.1016/j.jnc.2017.09.001
Krželj, M., Cerrano, C., and Camillo, C.D. (2020). Enhancing diversity knowledge through marine citizen science and social platforms: the case of hermodice carunculata (Annelida, polychaeta). Diversity 12 (8), 311. doi:10.3390/d12080311
Kullenberg, C., and Kasperowski, D. (2016). What is citizen science? a scientometric meta-analysis. PloS one 11 (1), e0147152. doi:10.1371/journal.pone.0147152
Larson, L. R., Cooper, C. B., Futch, S., Singh, D., Shipley, N. J., Dale, K., et al. (2020). The diverse motivations of citizen scientists: does conservation emphasis grow as volunteer participation progresses? Biol. Conserv. 242, 108428. doi:10.1016/j.biocon.2020.108428
Lowry, C. S., Fienen, M. N., Hall, D. M., and Stepenuck, K. F. (2019). Growing pains of crowdsourced stream stage monitoring using mobile phones: the development of CrowdHydrology. Front. Earth Sci. 7. doi:10.3389/feart.2019.00128
Mascioni, M., Almandoz, G. O., Cefarelli, A. O., Allison, C., Ferrario, M. E., and Vernet, M. (2019). Phytoplankton composition and bloom formation in unexplored nearshore waters of the western antarctic peninsula. Polar Biol. 42 (10), 1859–1872. doi:10.1007/s00300-019-02564-7
Njue, N., Stenfert Kroese, J., Gräf, J., Jacobs, S. R., Weeser, B., Breuer, L., et al. (2019). Citizen science in hydrological monitoring and ecosystem services management: state of the art and future prospects. Sci. total Environ. 693, 133531. doi:10.1016/j.scitotenv.2019.07.337
Njue, N., Gräf, J., Weeser, B., Rufino, M. C., Breuer, L., and Jacobs, S. R. (2021). Monitoring of suspended sediments in a tropical forested landscape with citizen science. Front. Water 3. doi:10.3389/frwa.2021.656770
Pandeya, B., Buytaert, W., and Potter, C. (2021). Designing citizen science for water and ecosystem services management in data-poor regions: challenges and opportunities. Curr. Res. Environ. Sustain. 3, 100059. doi:10.1016/j.crsust.2021.100059
Rameli, M., Nurul, I. A., Lappan, S., Bartlett, T. Q., Ahmad, S. K., and Ruppert, N. (2020). Are social media reports useful for assessing small ape occurrence? A pilot study from peninsular Malaysia. Am. J. primatology 82 (3), e23112. doi:10.1002/ajp.23112
Ronda, J. G. (2021). Tourists and tour operators as citizen scientists: potential and challenges. J. Hosp. and Tour. 19 (2), 16–26. Available online at: https://johat.org/wp-content/uploads/2022/05/2-green.pdf (Accessed November 04, 2024).
Ryan, R. M., and Deci, E. L. (2000). Self-determination theory and the facilitation of intrinsic motivation, social development, and well-being. Am. Psychol. 55 (1), 68–78. doi:10.1037//0003-066x.55.1.68
Sauermann, H., and Franzoni, C. (2015). Crowd science user contribution patterns and their implications. Proc. Natl. Acad. Sci. U. S. A. 112 (3), 679–684. doi:10.1073/pnas.1408907112
Shinbrot, X. A., Muñoz-Villers, L., Mayer, A., López-Portillo, M., Jones, K., López-Ramírez, S., et al. (2020). Quiahua, the first citizen science rainfall monitoring network in Mexico: filling critical gaps in rainfall data for evaluating a payment for hydrologic services program. CSTP 5 (1). doi:10.5334/cstp.316
Starkey, E., Parkin, G., Birkinshaw, S., Large, A., Quinn, P., and Gibson, C. (2017). Demonstrating the value of community-based (‘Citizen science’) observations for catchment modelling and characterisation. J. Hydrology 548, 801–817. doi:10.1016/j.jhydrol.2017.03.019
Tiago, P., Gouveia, M. J., Capinha, C., Santos-Reis, M., and Pereira, H. M. (2017). The influence of motivational factors on the frequency of participation in citizen science activities. NC 18, 61–78. doi:10.3897/natureconservation.18.13429
United Nations (2024). The united Nations world water development report 2024: water for prosperity and peace. The united Nations world water development report 2024. Paris: United Nations Educational, Scientific and Cultural Organization.
Weeser, B., Stenfert Kroese, J., Jacobs, S. R., Njue, N., Kemboi, Z., Ran, A., et al. (2018). Citizen science pioneers in Kenya - a crowdsourced approach for hydrological monitoring. Sci. total Environ. 631-632, 1590–1599. doi:10.1016/j.scitotenv.2018.03.130
West, S., and Pateman, R. (2016). Recruiting and retaining participants in citizen science: what can Be learned from the volunteering literature? CSTP 1 (2), 15. doi:10.5334/cstp.8
Wilson, N. J., Mutter, E., Inkster, J., and Satterfield, T. (2018). Community-based monitoring as the practice of indigenous governance: a case study of indigenous-led water quality monitoring in the yukon river basin. J. Environ. Manag. 210, 290–298. doi:10.1016/j.jenvman.2018.01.020
Keywords: citizen science, stakeholder participation, water monitoring, volunteer participation, weather monitoring
Citation: Zeballos JC, Valencia J, Codalli F, Mitze F, Shagega F, Weeser B and Jacobs S (2025) Evaluating participatory monitoring in mountainous tourist regions. Front. Environ. Sci. 13:1537278. doi: 10.3389/fenvs.2025.1537278
Received: 30 November 2024; Accepted: 31 March 2025;
Published: 14 April 2025.
Edited by:
Shelley MacDonell, University of Canterbury, New ZealandReviewed by:
Gagan Matta, Gurukul Kangri University, IndiaShuvojit Nath, Monash University, Australia
Copyright © 2025 Zeballos, Valencia, Codalli, Mitze, Shagega, Weeser and Jacobs. This is an open-access article distributed under the terms of the Creative Commons Attribution License (CC BY). The use, distribution or reproduction in other forums is permitted, provided the original author(s) and the copyright owner(s) are credited and that the original publication in this journal is cited, in accordance with accepted academic practice. No use, distribution or reproduction is permitted which does not comply with these terms.
*Correspondence: Jazmin Campos Zeballos, amF6bWluLmNhbXBvcy16ZWJhbGxvc0B6ZXUudW5pLWdpZXNzZW4uZGU=
†ORCID: Jazmin Campos Zeballos, orcid.org/0000-0003-0454-2029; Jefferson Valencia, orcid.org/0000-0002-6774-6996; Fabia Codalli, orcid.org/0009-0003-5226-2352; Fabian Mitze, orcid.org/0000-0002-5127-2378; Frank Shagega, orcid.org/0009-0005-7174-2778; Björn Weeser, orcid.org/0000-0001-7400-319X; Suzanne Jacobs, orcid.org/0000-0003-2223-6973