- 1Yunnan University of Finance and Economics, School of Economics, Kunming, Yunnan, China
- 2Ningbo University of Finance and Economics, School of International Economics and Trade, Ningbo, Zhejiang, China
Introduction: This study investigates the impact of urban digital economy development on pollution emissions across 285 Chinese cities from 2002-2022.
Methods: Utilising threshold regression, spatial autoregressive, and mediation models, we identify a nonlinear inverted U-shaped relationship where initial digital expansion initially elevates emissions before mature digital ecosystems drive reductions.
Results: Spatial heterogeneity reveals significant emission reductions in eastern/central regions versus limited effects in western/northeastern areas, while spatial spillover effects necessitate inter-regional policy coordination. Mediation analysis highlights green technology innovation and industrial upgrading as critical mitigating mechanisms.
Discussion: Findings advocate context-specific policies prioritising energy efficiency during digital emergence and advanced technology promotion in mature contexts, providing empirical groundwork for balancing digital economic benefits with environmental sustainability objectives.
1 Introduction
The digital economy, underpinned by transformative technologies such as the Internet, big data analytics, and artificial intelligence (AI), has emerged as a pivotal driver of modern economic growth and structural transformation. By fostering innovation ecosystems, enhancing operational efficiencies, and redefining industrial value chains, digital technologies have significantly bolstered the competitiveness of urban economies worldwide (Bai et al., 2022; Song et al., 2022; Chen and Qi, 2023). For instance, the integration of “digital+” solutions into manufacturing, logistics, and service sectors has enabled real-time optimisation of resource allocation, streamlined supply chains, and created new markets, thereby elevating productivity and GDP performance across metropolitan regions. However, this technological revolution has unfolded alongside escalating concerns over its environmental footprint, particularly concerning pollution emissions.
The environmental paradox of urban digitalisation lies at the intersection of infrastructure expansion and operational energy demands. Rapid proliferation of data centres, fibre-optic networks, and IoT devices—while essential for sustaining digital economies—has amplified energy consumption, with data centre electricity use projected to exceed 8% of global demand by 2030, accompanied by carbon emissions rivalling aviation (Andrae, 2020). Concurrently, resource-intensive hardware production exacerbates environmental degradation through energy-intensive manufacturing and mineral extraction under ecologically damaging conditions (Song et al., 2022; Meinhold et al., 2025). Urban centres, as digital innovation hubs, concentrate demands for connectivity, frequent device turnovers, and energy-intensive cooling systems, further intensifying these pressures. Operational phase challenges persist, as blockchain operations, AI training, and streaming services generate indirect emissions via fossil fuel-dependent electricity generation, while shortened electronics lifespans escalate toxic e-waste streams (Serpe et al., 2024). This dual environmental burden—scaling infrastructure and operational energy use—underscores the imperative for quantifying digitalisation’s pollution trade-offs to enable policymakers to design mitigation frameworks balancing technological advancement with ecological integrity, ensuring cities harness digital dividends sustainably.
A substantial body of literature has addressed the trade-offs between a city’s digital economic development and environmental stressors, highlighting the dual realities of technological advancement and ecological impact. While studies like Chen and Qi (2023) have underscored the role of GDP per capita and digital infrastructure in driving this expansion, a critical paradox persists: the environmental repercussions of its infrastructure. The proliferation of data centres, fibre-optic networks, and IoT devices—while indispensable for digital service delivery—has engendered substantial energy consumption and electronic waste (Andrae, 2020). For instance, Google’s 2024 Environmental Report revealed a 13% year-on-year increase in greenhouse gas emissions, largely attributable to escalating data centre energy demands. Such trends highlight the tension between digital innovation and ecological sustainability, particularly in developing economies where infrastructure deficits exacerbate energy inefficiencies (DCO, 2024).
Scholarly discourse on pollution emissions has traditionally centred on industrial activities, with the Environmental Kuznets Curve (EKC) hypothesis dominating debates (Grossman and Krueger, 1995; Dinda, 2004; Shahbaz et al., 2014). This hypothesis posits an inverted U-shaped relationship between economic growth and pollution levels, yet its applicability to the digital economy remains contested. More recent studies have shifted focus to the spatial dynamics of pollution, emphasizing cross-regional spillover effects (Xu et al., 2022; Cheng and Yang, 2023). For example, Zhai et al. (2024) demonstrated how pollution levels in one region can be influenced by neighbouring jurisdictions due to industrial clustering and policy diffusion. This spatial lens is further validated by the 2025 Global Risks Report, which advocates for transboundary collaboration to mitigate environmental hazards (Elsner et al., 2025).
Attempts to reconcile the digital economy’s environmental impact have yielded mixed conclusions. Proponents argue that digital technologies enhance resource efficiency and promote clean energy transitions (Han et al., 2022; Yang et al., 2023). Conversely, critics highlight the rebound effect, wherein energy savings from digital optimisation are offset by increased consumption from expanded infrastructure (Yuan et al., 2024). This dichotomy is exemplified in studies of urban agglomerations, where concentrated digital demand amplifies energy use and electronic waste (Song et al., 2022). Methodologically, spatial econometric frameworks have been deployed to disentangle these effects, with Shen et al. (2022) and Wang et al. (2022) demonstrating significant spatial autocorrelation in digital-pollution linkages across Chinese cities. However, such analyses often overlook non-linear thresholds and cross-national heterogeneities.
Recent literature has yielded critical insights into the impact mechanism between a city’s digital economy development and pollution emissions, with particular emphasis on the mediating roles of technological innovation and industrial structural transformation (Gao et al., 2024; Yang et al., 2024). A growing body of research posits that digital transformation fosters environmental improvements through dual pathways: enhancing technological innovation capabilities and facilitating structural shifts towards greener economies (Mai et al., 2025; Yue and Han, 2025). For instance, digital innovation not only directly reduces pollution through optimised resource allocation and smart monitoring systems but also indirectly through green technological advancements that mitigate environmental footprints (Xiong et al., 2022). Concurrently, industrial structural upgrading, often catalysed by digital penetration, sees traditional high-pollution industries gradually replaced by knowledge-intensive and service-oriented sectors, thereby lowering overall emission intensities (Gao et al., 2024; Yang et al., 2024). Notably, while some studies highlight the bidirectional causality between digitalisation and environmental outcomes—with pollution levels conversely impeding digital transition progress in certain contexts (Wang et al., 2024)—the dominant narrative underscores digital economy’s transformative potential in steering sustainable urban development. Contextual factors such as urban agglomeration economies and regulatory frameworks further modulate these relationships, creating complex non-linear effects that warrant nuanced empirical investigations (Xiong et al., 2022; Yue and Han, 2025). This study builds upon this evolving discourse to unravel the intricate mechanisms through which digital economy development influences pollution trajectories in Chinese cities.
While existing scholarship has significantly advanced understanding of the digital economy’s environmental footprint by illuminating the tension between technological progress and ecological degradation—particularly through insights into energy consumption patterns, spatial spillover effects, and methodological frameworks like the Environmental Kuznets Curve hypothesis (Grossman and Krueger, 1995; Zhai et al., 2024)—critical gaps remain in three dimensions. First, the overwhelming focus on high-income economies has obscured how digitalisation in developing regions, such as China’s rapidly urbanising cities, amplifies pre-existing vulnerabilities like inefficient infrastructure and lax regulatory frameworks (Song et al., 2022). Second, prevailing linear and static analytical models inadequately capture the dynamic feedback loops between digital expansion, pollution emissions, and technological adaptation, particularly across heterogeneous geographic contexts (Shen et al., 2022). Finally, limited attention has been paid to the multidimensional nature of digital pollution, which extends beyond energy use to encompass electronic waste, water scarcity impacts, and cross-border supply chain emissions. This study addresses these lacunae by integrating the Spatial Autoregression Model with threshold regression analysis, leveraging granular cross-country datasets to disentangle non-linear relationships and regional heterogeneities. By doing so, it not only refines theoretical frameworks for digital-environmental synergies but also equips policymakers with actionable insights, thereby bridging the divide between innovation imperatives and sustainability imperatives.
This study investigates the complex interplay and mechanistic linkages between a city’ economy development and pollution emissions within China’s dual realities of rapid digital transformation and mounting environmental pressures. Utilising a comprehensive dataset from 285 Chinese municipalities, we empirically validate the presence of an inverted U-shaped relationship between digital economy development and pollutant emission intensities. Incorporating spatial econometric methodologies, our analysis reveals significant positive spatial autocorrelation in emission patterns, highlighting the systemic interconnectivity of environmental degradation across administrative boundaries and accentuating the need for collaborative governance frameworks spanning regional divisions. Beyond direct effects, we explore the mediating influences of green technological advancements and structural shifts within industrial ecosystems. Employing rigorous mediation analysis, we disentangle the indirect pathways through which digital integration affects emission trajectories. This multifaceted investigative strategy not only clarifies the environmental consequences of digitalisation but also provides policymakers with actionable insights to leverage technological transitions as catalysts for sustainable development. Our findings introduce novel evidence into global discussions on the digital-environmental nexus while proposing region-specific policies to decouple economic growth from environmental costs.
This study makes three interrelated contributions while acknowledging the foundational work of prior scholars and the collaborative efforts involved. First, it seeks to advance theoretical understanding by tentatively integrating the dynamics of urban digital economy development with pollution emission intensities within a unified analytical framework. Building upon existing literature that often examines these elements in isolation, this approach aims to shed light on the complex interplay between technological advancement and environmental sustainability in China’s rapidly urbanizing context. Second, recognizing methodological limitations in conventional single-model analyses, the study employs a multi-method econometric strategy—incorporating fixed effects, threshold regression, spatial autoregressive, and mediation analysis models—to more robustly examine non-linear relationships and spatial spillover effects. While acknowledging the challenges inherent in longitudinal analyses spanning 21 years (2002–2022) across 285 Chinese cities, the study’s comprehensive dataset enables preliminary exploration of digitalization’s evolving environmental impacts across diverse urbanization stages. Third, the research attempts to unpack the mediating roles of green technological innovation and industrial structural transformation, recognizing these as critical yet under-examined pathways through which digital penetration may influence environmental outcomes. By tentatively proposing a mechanism linking digitalization to structural change, the study aims to inform policy discussions around targeted interventions that harness technology’s dual potential as economic driver and environmental steward. Collectively, these contributions represent exploratory steps toward a more nuanced understanding of digital economy-environment interactions, inviting further research to refine theoretical models and empirical approaches.
The remainder of this paper is organised as follows: Section 2 reviews the relevant literature and formulates our research hypotheses. Section 3 describes the empirical methods used in our study and provides an overview of our dataset. Section 4 presents the results of our empirical analysis. Section 5 focuses on robustness testing to ensure the reliability of our findings. Section 6 summarises our research conclusions and discusses the limitations and the direction of future research in this field.
2 Research hypothesis
With its inherent benefits of transcending temporal information dissemination, facilitating data sharing, and minimising transaction costs, a city’s digital economy development exerts both direct and indirect influences on environmental pollution through industrial structural upgrading and green technological innovation (Xu and Li, 2022; Yang et al., 2023; Yuan et al., 2024). Furthermore, the pace of marketisation impacts the digital economy’s emission reduction efficacy (Jiang and Deng, 2022; Yuan et al., 2024). This study focuses on examining the influence of a city’s digital economy development on its pollution emissions and the underlying mechanisms.
2.1 The direct effect of digital economy development on pollution emissions
To understand the impact of digital economy development on pollution emissions, it is imperative to delineate the bipartite aspects of digital economic development: industrial digitalisation and digital industrialisation (Shi Y. et al., 2022; Shi et al., 2023). This classification could provide a framework for understanding the nuanced relationship between digital economy development and environmental impact. In the early stages of digital economic development, the focus is shifting towards digital industrialisation. This phase is characterised by the rapid construction and operationalisation of digital infrastructure, which includes a wide range of facilities and networks. This phase, marked by technological advancements, also poses significant environmental challenges. The construction and maintenance of infrastructure require considerable energy, mainly derived from non-renewable sources, leading to increased pollution emissions and heightened environmental degradation.
However, as the digital economy matures and evolves, a shift occurs in its focal point, with industrial digitisation taking precedence. This transition means the integration of digital technologies into traditional industries, facilitating productivity enhancement by stimulating technological innovations, including green technologies. By leveraging the capabilities of digital tools and platforms, traditional industries are able to optimise their processes, reduce waste, and mitigate pollution. Adopting such practices aligns with the principles of sustainable development, fostering a more environmentally friendly industrial landscape and reducing pollution emissions.
Considering the interplay between those two aspects of the digital economy development, we hypothesised a non-linear relationship between the digital economy development development and pollution emissions. Specifically, we proposed an inverted U-shaped impact: In the short term, pollution emissions are expected to increase due to the energy-intensive nature of constructing and operating digital infrastructure. However, in the long term, as the economy evolves and industrial digitisation takes precedence—along with the adoption of advanced digitalised technologies and improvements in productivity—we anticipate a reduction in pollution emissions. Thus, we propose Hypothesis 1 as follows:
Hypothesis 1:. Digital economy development has an inverted U-shaped impact on pollution emissions.
2.2 The spillover effect of the pollution emissions
When examining the impact of the digital economy development on pollution emissions, it is imperative to consider the intricate mechanism through which pollution emissions exhibit spatial spillover effects (Shi F. et al., 2022; Xu et al., 2022). This phenomenon suggests that the pollution emissions in one city are not solely determined by its own economic activities and environmental policies but are also influenced by the pollution emissions of neighbouring cities.
The underlying mechanism for this spatial spillover phenomenon can be elucidated through several intertwined factors. Firstly, cities’ geographical proximity often results in the sharing of atmospheric and water resources, facilitating the dispersion of pollutants across city boundaries. For instance, industrial emissions from a heavily industrialised city can easily travel via wind or waterways to nearby cities, thereby contributing to their pollution levels.
Secondly, economic integration and regional cooperation among cities can increase trade and mobility of goods, services, and people. This, in turn, can exacerbate pollution levels as the transportation sector, a significant source of emissions, becomes more active. By fostering interconnectedness and facilitating transactions across vast distances, the digital economy, especially digital trades, may inadvertently intensify this regional economic activity, leading to higher pollution emissions in neighbouring cities.
Furthermore, the spillover effect can also be attributed to imitating and adopting production practices and environmental standards. Cities with lax environmental regulations may serve as “pollution havens”, attracting industries from more stringently regulated cities. As digital technologies enable more accessible access to information about such regulatory differences, firms may relocate to these less regulated cities, resulting in increased pollution emissions that spill over to adjacent regions. Thus, we propose the following Hypothesis:
Hypothesis 2:. Pollution emissions exhibit spatial spillover effects, meaning that neighbouring cities’ pollution emissions positively influence a given city’s pollution emissions.
2.3 The indirect effect of digital economy development on pollution emissions
In examining the indirect effect of digital economy development on pollution emissions, previous research has found that digital economy development exerts its influence through two primary mediation channels: green technology innovations and industrial structure upgrading (Xu and Li, 2022; Yang and Liang, 2023; Yuan et al., 2024). This study delves into these indirect effect mechanisms, focusing on green technology innovations and industrial structure upgrading dimensions.
2.3.1 Through green technological innovation
Digital economy development exerts an indirect influence on pollution emissions, mediated through the pivotal role of green technology innovations (Han et al., 2022; Jiang and Deng, 2022; Wang et al., 2022). As the digital economy explosions, it fosters an environment conducive to creating and adopting novel, environmentally friendly technologies. These green innovations, encompassing a wide array of sustainable practices and solutions, are crucial in mitigating pollution emissions. By enhancing efficiency, reducing resource consumption, and enabling cleaner production processes, green technologies effectively buffer against the potentially detrimental environmental impacts associated with digital economic growth.
Furthermore, the digital economy facilitates the dissemination and scaling up of these green innovations through enhanced connectivity, data analytics, and the sharing of best practices. This, in turn, accelerates the pace of technological progress in the environmental sector, leading to a reduction in pollution emissions. The interplay between digital economy development and green technology innovations thus underscores the complexity of the relationship between economic development and pollution emissions, highlighting the need for integrated policies that harness the synergies between the two to achieve a more sustainable future. So, we propose the following Hypothesis:
Hypothesis 3.1:. Digital economy development indirectly affects pollution emissions through green technology innovations.
2.3.2 Through industrial structure upgrading
Industrial structure upgrading plays another mediator in the digital economy development’s impact on pollution emissions (Li Y. et al., 2022; Yuan et al., 2024). The digital transformation of economies often catalyses a shift from pollution-intensive industries to those that are more knowledge- and technology-intensive. The digital economy development promotes the emergence and growth of industries such as digital services, e-commerce, and clean technology manufacturing. These industries typically have lower pollution intensities than traditional sectors like heavy manufacturing or fossil fuel extraction. As these new industries gain prominence, they contribute to an upgrading and rebalancing of the economic structure, reducing the overall pollution emissions of the economy. Furthermore, digital technologies enable traditional industries to undergo a process of greening. By adopting digital tools and technologies, these industries can improve resource consumption efficiency, reduce waste, and thus minimise emissions. Therefore, we present the following hypothesis:
Hypothesis 3.2:. Digital economy development indirectly affects pollution emissions through Industrial Structure Upgrading.
3 Methodology and data
3.1 Econometric model
3.1.1 Baseline model
In this paper, we construct the baseline model as follows:
where the subscript i denotes the city, t denotes the year.
This model accounts for both time-fixed and individual-fixed effects, with the coefficient
3.1.2 Threshold model
To more precisely delineate the non-linear relationship between the level of digital economy development and pollution emissions, this study employs a threshold regression model as an enhancement over merely introducing higher-order terms. The threshold regression model offers a refined approach to fitting the intricate non-linear relationship between the two variables, providing greater accuracy than Formula 2. This methodology allows a more nuanced understanding of how digital economy development impacts environmental pollution levels. The specific formulation of the threshold regression model is as follows:
In the model (3), the coefficients
3.1.3 Spatial Autoregression Model
As previously discussed, pollution emissions inherently exhibit spatial spillover effects, whereby the pollution emissions of neighbouring cities can significantly impact those of the city in question. This phenomenon underscores the importance of considering inter-city connections in assessing environmental outcomes. Consequently, this study employs a Spatial Autoregression (SAR) Model to investigate the influence of a city’s digital economy development on its pollution emissions. This model is specifically designed to capture the spatial dependencies that exist among cities, allowing for a more nuanced analysis of the relationship between digital economic development and pollution emissions.
The SAR model incorporates a spatial weights matrix, which accounts for the geographical proximity and potential interaction between cities. Doing so enables us to assess not only the direct effects of digital economy development on local pollution emission levels but also the indirect effects that arise from interactions with neighbouring cities. The specific SAR model is as follows:
where
3.1.4 Mediating effect model
We delve into the intricate mechanisms through which a city’s digital economy development influences pollution emissions, specifically focusing on the intermediary roles of green technology innovation and industrial structure upgrading. Our investigation aims to dissect these pathways to provide a comprehensive understanding of how digital transformation can foster environmentally sustainable outcomes.
We firstly scrutinise the mediation effect of green technology innovation on the impact of digital economy development on pollution emissions. To this end, we construct the mediating model to test the mechanism of green innovation as follows:
where
To test the role of industrial structure upgrading as a crucial channel through which the digital economy development impacts pollution emissions, we formulate this model as follows:
For the models (Equations 5.1–5.3), and (Equations 6.1–6.3) should the regression analysis reveal statistical significance for
However, when estimating (Equations 5.1, 5.3), and (Equations 6.1, 6.3) directly and testing the significance of
This study proceeds to employ the Bootstrap method for the mediation effect test. It examines the null hypothesis H0:
3.2 Variables and data
3.2.1 Dependent variables
We use the pollution emissions index as the dependent variable to evaluate a city’s pollution emission strength. This index is calculated by the entropy TOPSIS method, using three pollutants emission data from 281 prefecture-level cities and 4 municipalities, and spans 21 years from 2002 to 2022. We use three main pollutant emission data, industrial wastewater discharge, industrial sulphur dioxide (SO2) emissions, and industrial smoke and dust emissions, from the China City Statistical Yearbook. These indicators were selected based on their significance in contributing to overall environmental pollution and their availability within the chosen dataset. This extensive dataset provides a robust foundation for analysing temporal and spatial variations of pollution levels.
The entropy TOPSIS method was employed to integrate and standardise these diverse pollution metrics into a single composite index—the Pollution Emission Strength (PES). This method ensures that each pollutant’s contribution to the overall index is appropriately weighted according to its relative importance and variability, specifically in the following steps:
Firstly, to normalise the original pollution emission data using Equation 7, as follows:
where the subscript i denotes the city, j represents the specific pollutant (i.e., wastewater, SO2, or industrial dust), and t indicates the year.
Secondly, to calculate the weight of each pollutant using Equation 8:
where
Finally, to calculate the final pollution emissions, which serve as our proxy for the overall pollution emission strength, was computed as the weighted average of the standardised emission values for each pollutant. This was done using Equation 9:
The
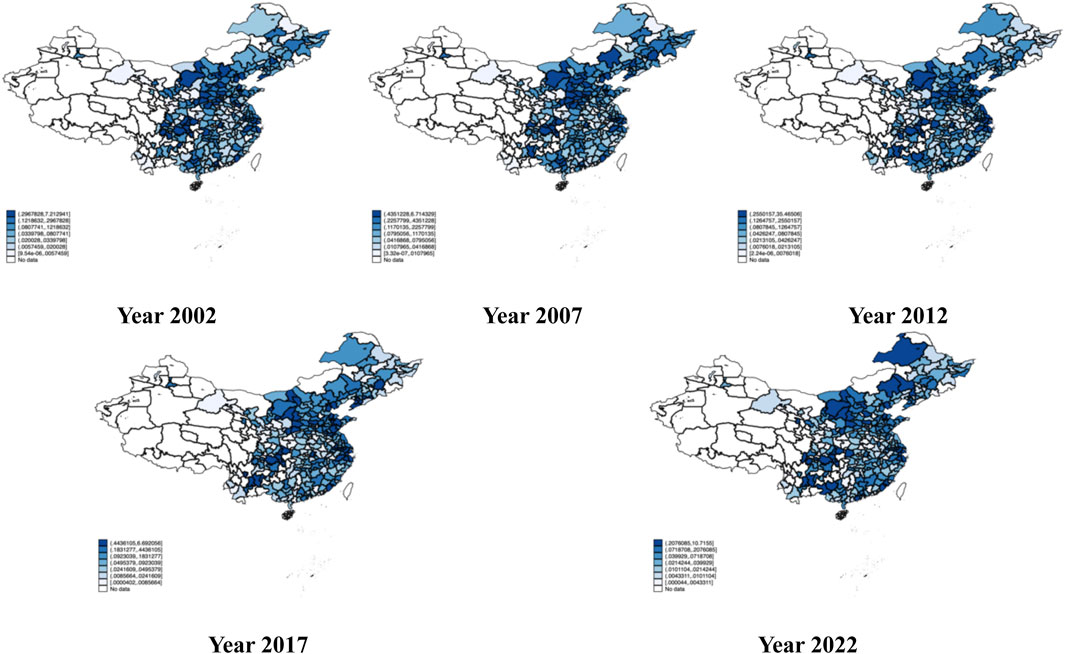
Despite this overall trend, there are discernible differences in pollution patterns across the years. In 2002, the map highlights significant pollution hotspots in central and eastern China, with major urban and industrial centres marked by darker blue shades. By 2007, the pollution discharge in these regions remains high, with several clusters of high-pollution cities evident, particularly around major economic hubs. The 2012 map continues to show higher pollution levels in eastern and central China, with deep blue shades indicating substantial emissions in key cities and industrial regions. In 2017, the trend persists, with eastern China’s industrialized regions, such as Shandong, Jiangsu, and parts of Zhejiang, exhibiting significantly higher pollution levels. However, by 2022, while major urban areas in eastern and northern China still show significant pollution, there is a noticeable shift, with some western regions maintaining lower pollution levels, indicating potential improvements or stable conditions in these areas.
In summary, the maps illustrate a consistent spatial variability in pollution levels across China’s prefecture-level cities from 2002 to 2022. Eastern and central China, with their intensive industrial activities and high population densities, consistently experience higher pollution levels compared to western China. Although there are variations in pollution patterns across the years, the overall trend remains consistent, highlighting the need for targeted interventions in high-emission areas to improve air quality and environmental sustainability. Meanwhile, lower emission regions may focus on maintaining or improving their current pollution levels through effective pollution control measures and sustainable development practices. It is worth mention that we take the logarithm of
3.2.2 Explanatory variables
Referring to Li J. et al. (2022), this study assesses the digital economy development level in two First-level indicators: Internet development level and digital financial inclusion.
The Internet development level is based on four Second-level indicators: Internet penetration, employment in related fields, related output, and mobile phone penetration rate. To evaluate these indicators, we use the Number of Internet broadband users per 100 people, the proportion of employees in the computer services and software industry to total urban employees, per capita total telecommunications business volume, and the Number of mobile phone users per 100 people respectively. For Digital Financial Inclusion, we adopt the China Digital Financial Inclusion Index developed by Guo et al. (2020). This index, jointly compiled by the Peking University Digital Financial Research Centre and Ant Financial Services Group, provides a holistic and robust measure of digital financial access and usage across various dimensions.
To precisely quantify the Digital Economy development index (
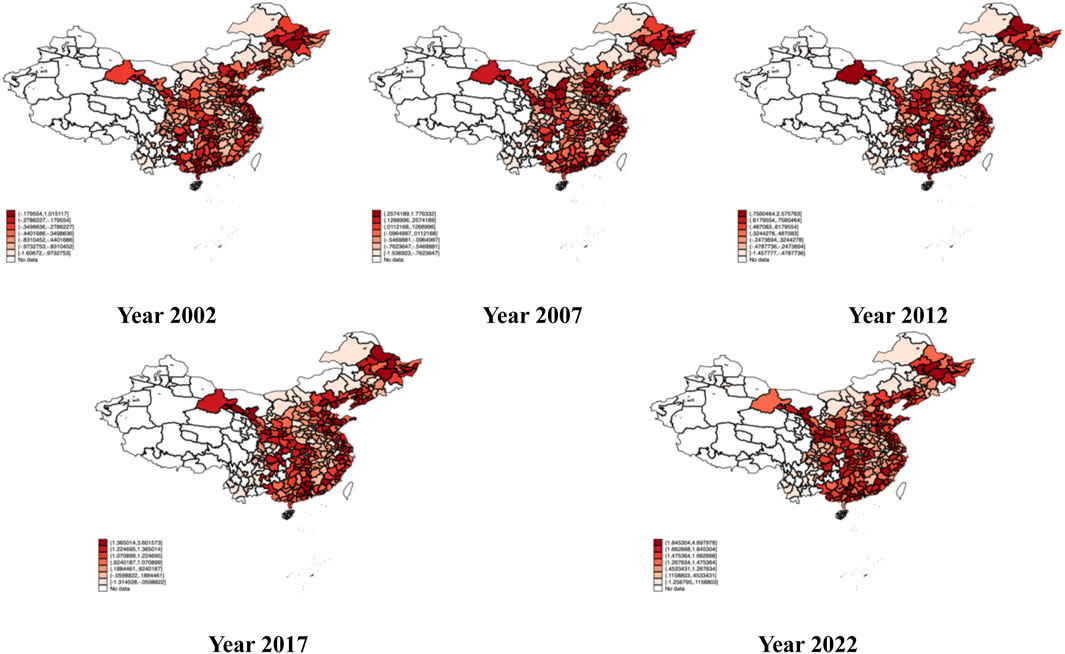
The spatial distribution and temporal evolution of China’s digital economy development across the years 2002, 2007, 2012, 2017, and 2022 are visually represented in Figure 2. A striking commonality observed throughout these maps is the pronounced concentration of digital economy activities in the eastern coastal regions of China. Urban hubs such as Beijing, Shanghai, and Guangzhou consistently stand out, marked by the darkest hues of red and orange, indicative of the most intense levels of digital economy engagement. This phenomenon underscores the effective utilisation of technological advancements by cities endowed with robust economic infrastructures. The eastern coastal areas are distinguished by their superior internet connectivity, advanced technological infrastructure, and vibrant ecosystem, which have collectively fostered a proliferation of digital endeavours, encompassing e-commerce, digital financial transactions, and technological innovations.
Despite this overall trend, there are notable differences in digital economy development levels across different regions and over time. In 2002, the map reveals significant variation in digital economy development, with many cities in eastern China shaded in darker reds, while western and northern China exhibit lighter shades. This disparity persists through the subsequent years, although some regions in the west and north show gradual improvements. By 2022, the map indicates that while clusters of cities in eastern and southern China continue to exhibit high levels of digital economy development, there are also pockets of relatively high development in certain cities in the northeastern part of China. These cities, historically industrial powerhouses, have transitioned and invested in digital sectors, contributing to their improved standing in the digital economy landscape. In contrast, the western region of China, characterized by vast geographies and sparse populations, faces challenges in data collection and digital infrastructure development, resulting in relatively low digital economy development levels. Additionally, some western cities lack comprehensive statistical data, complicating efforts to accurately assess and compare their digital economy growth.
In summary, the descriptive statistics derived from the choropleth maps reveal significant regional disparities in digital economy development across Chinese cities from 2002 to 2022. The eastern coastal regions consistently exhibit the highest levels of digital economy activity, driven by favorable economic and infrastructural conditions. In contrast, the western and northern regions lag behind, with some improvement observed over time. The northeastern region shows a unique pattern of relatively high digital economy development, reflecting historical industrial transitions and investments in digital sectors. These spatial heterogeneities underscore the need for tailored policies and interventions to promote sustainable digital economy growth while mitigating environmental impacts. As we delve into the analysis of the impact of digital economy development on pollution emissions in subsequent sections, it will be crucial to consider these regional disparities to gain a comprehensive understanding of the relationship between digital economy and environmental sustainability in Chinese cities.
3.2.3 Mediating variables
To thoroughly explore the mediating role of green innovation in the context of our research on the impact of the digital economy development on pollution emissions, we employ the logarithm of the aggregate number of green patent applications within a city as a proxy variable for green innovation, denoted as
This study also incorporates the index of industrial structure upgrading (
3.2.4 Control variables
In this study, we have controlled for several variables that may have influenced a city’s pollution emissions, ensuring a comprehensive and nuanced analysis. These variables are as follows:
3.2.4.1 Gross domestic product (gdp)
This variable serves as an indicator of a city’s economic development level. It is posited that GDP has a positive impact on pollution emissions, as heightened economic activity often leads to increased industrial production and, consequently, greater pollution emissions.
3.2.4.2 Foreign direct investment (fdi)
FDI measures the level of foreign capital utilisation in a city. Its impact on pollution emissions is multifaceted and can be both positive and negative. On the one hand, FDI may introduce advanced technologies and environmental management practices that reduce pollution. On the other hand, it could also lead to increased industrial activity and, subsequently, higher emissions.
3.2.4.3 Year-end loan balance (loan)
This variable reflects the level of financial support and, by extension, the overall economic vitality of a city. Similar to FDI, the impact of loan balance on pollution emissions is ambivalent, potentially contributing to both increased emissions through enhanced economic activity and decreased emissions through the financing of eco-friendly projects.
3.2.4.4 Science and technology expenditure (sciexp)
This metric gauges a city’s investment in and commitment to scientific and technological advancement. In the short term, such expenditure may lead to increased pollution due to the initial stages of research and development. However, in the long run, technological innovations are expected to facilitate more sustainable practices, thereby reducing pollution emissions.
3.2.4.5 Population density (popd)
Population density provides insights into the distribution of a city’s populace. It is hypothesised that a higher population density correlates positively with pollution emissions, as a denser population often results in greater demand for resources and energy, leading to increased environmental degradation.
3.2.4.6 Energy consumption (lnenergy)
This encompasses the conversion of electricity consumption, artificial gas, natural gas, and liquefied petroleum gas into standard coal equivalents, serving as a pivotal indicator of both national economic development and living standards. The greater the energy consumption, the higher the pollution emissions are anticipated to be. For the sake of precision, the conversion factors used are as follows: 0.1229 kg of standard coal per kilowatt-hour for electricity (equivalent to 1.229 tonnes of standard coal per 10,000 kilowatt-hours), 1.33 kg of standard coal per cubic meter for natural gas (equivalent to 13.3 tonnes of standard coal per 10,000 cubic meters), and 1.7143 kg of standard coal per kilogram for liquefied petroleum gas (equivalent to 1.7143 tonnes of standard coal per tonne).
By controlling for these variables, this study aims to provide a more accurate and holistic understanding of the digital economy development’s impact on pollution emissions in urban areas.
3.2.5 Spatial matrix
In this study, a spatial matrix is constructed utilising the inverse distance matrix of 285 cities to capture the geographical proximity and potential interaction effects among these urban centres in the context of the development of digital economy influence on pollution emissions. The matrix is calculated as follows:
where i and j denote the city,
By employing the inverse distance matrix, we aim to quantify the degree of spatial correlation and spillover effects, acknowledging that cities closer to each other are likely to experience more pronounced influences due to shared resources, transportation networks, and policy implementations. The selection of 285 cities ensures a comprehensive and representative sample, allowing for a robust analysis of how the proliferation of digital technologies across diverse urban landscapes correlates with changes in pollution levels.
3.3 The descriptive statistics
To facilitate subsequent analyses and construct a balanced panel dataset, we have undertaken the following methodological adjustments to address missing values and zero entries:
Firstly, in order to mitigate the impact of incomplete data, interpolation techniques were employed to estimate and fill in missing values encountered within the China City Statistical Yearbook. This approach ensures that the dataset remains as comprehensive as possible, minimising the disruption caused by data gaps.
Secondly, considering the inherent non-negativity of the variables under investigation, any negative values resulting from the interpolation process, as well as any remaining empty entries, were systematically replaced with the mean of the respective variable’s original non-zero observations for each city. This step preserves the integrity of the data by maintaining realistic and representative values where direct observations are lacking or inaccurate.
Thirdly, to stabilise data fluctuations and enhance the robustness of analytical outcomes, all variables underwent a logarithmic transformation. It is noteworthy that the application of the logarithm function to zero values would result in errors, leading to their exclusion from subsequent regression analyses by computational algorithms. To circumvent this issue, all zero entries were substituted with a value equal to one-thousandth of the smallest non-zero value observed for that particular variable. This strategy strikingly balances the need to maintain data logic and sequence integrity while avoiding the loss of crucial data points.
Moreover, the Digital Economy development index (
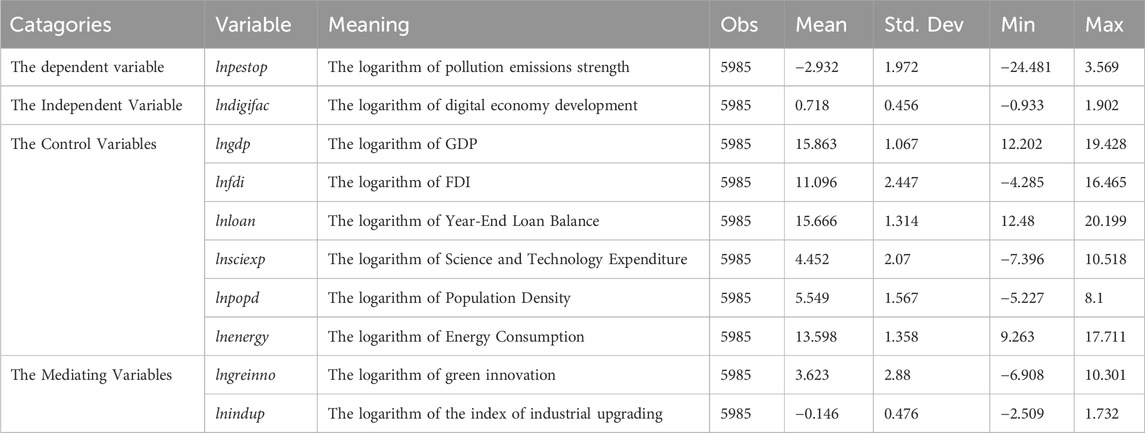
These preprocessing steps have been meticulously implemented to enhance the quality and reliability of the dataset, thereby laying a solid foundation for the rigorous exploration of the impact of digital economy development on pollution emissions. By managing missing data, outliers, and stabilising distributions, the descriptive statistics were presented in Table 2.
4 Empirical results
4.1 Baseline regression results
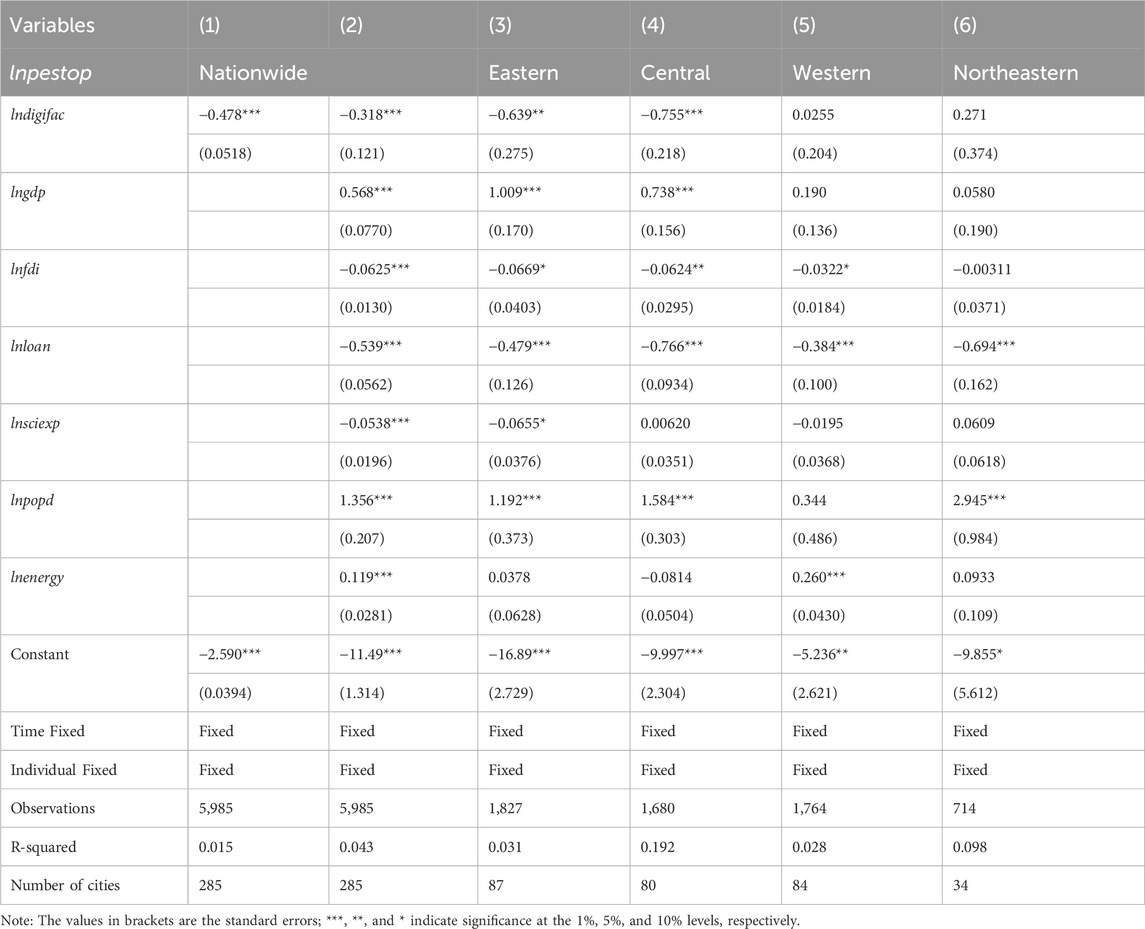
The baseline regression specified by Formula 1 is employed to assess the direct impact of digital economy development on pollution emissions. The results presented in Table 3, offer a comprehensive view at both the nationwide level and across diverse economic regions.
In the initial phase of our investigation, Regression (1) was employed to provide an unadulterated assessment of the impact of digital economy development on pollution emissions, without the inclusion of any control variables. The results obtained indicated a significantly negative coefficient for digital economy development, suggesting an inherent tendency for digital economy development to reduce pollution emissions. To further refine our analysis, Regression (2) was subsequently conducted, incorporating a comprehensive set of control variables. This adjusted model allowed for a more accurate exploration of the relationship, accounting for other influential factors that might confound the association. Notably, the findings from Regression (2) were consistent with those of the initial regression, reinforcing the robustness of the observed inhibitory effect of digital economy development on pollution emissions. This consistency across models underscores the stability and reliability of our results, providing compelling evidence for the potential of digital economy growth to mitigate pollution emissions.
Then, our research endeavours shift towards exploring the regional heterogeneity inherent in the impact of digital economy development on pollution emissions. Adopting the classification methodology outlined by the China National Bureau of Statistics, we segment the nation into four distinct economic regions: the Eastern, Central, Western, and Northeastern regions. The regression results are summarised in Columns (3)–(6):
Columns (3)–(4) show in the Eastern and Central regions, the impact of digital economy development on pollution emission levels is markedly negative, suggesting a beneficial role in mitigating emissions. However, Columns (5)–(6) show that within the Western and Northeastern regions, the coefficients associated with digital economy development are statistically insignificant. This heterogeneity in different economic regions in outcomes may be attributed to a multitude of factors. For instance, the relatively limited sample sizes in the Western and Northeastern regions may contribute to the statistical insignificance, as smaller datasets can be less representative and more susceptible to variability. Moreover, the digital economy development level in these regions is at a nascent stage of development compared to the Eastern and Central regions, potentially limiting its immediate environmental impact.
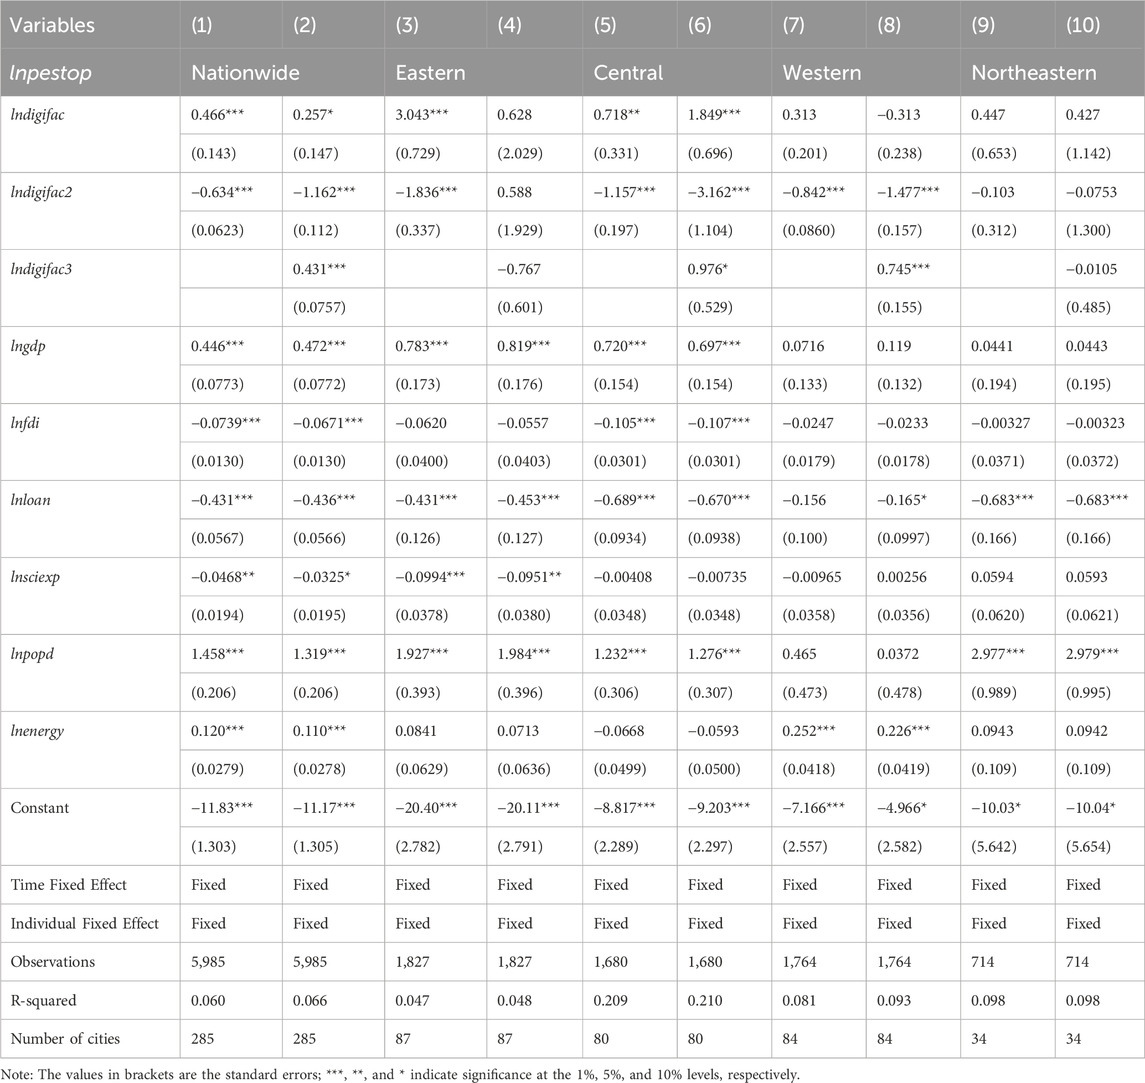
Based on Hypothesis 1, this study first employs higher-order terms in the regression to empirically validate the nonlinear impact of digital economy development on pollution emissions. Building upon Formula 2, we incorporate higher-order terms of the digital economy development indicator (lndigifac), the specific regression results are presented in Table 4.
Table 4 presents the regression results of Formula 2 after incorporating quadratic and cubic terms of digital economy development with regional heterogeneity. These findings reveal a notable regional heterogeneity in the impact of digital economy development on pollution emissions levels. Columns (1)–(2) show the regression results by adding the quadratic and both quadratic and cubic terms for the nationwide sample respectively. It can be seen that the coefficients of the higher-order terms of the digital economy development are statistically significant, along with all control variables, providing initial evidence of a nonlinear impact on the digital economy development on pollution emission, validating Hypothesis 1.
Regionally, the findings exhibit considerable variation. Within the Eastern region, the quadratic term demonstrates statistical significance, albeit this diminishes upon inclusion of the cubic term. Both Central and Western regions diverge from the nationwide pattern, with both quadratic and cubic terms attaining marginal significance. In contrast, neither term achieves significance in the Northeastern region, where the insensitivity to digital economy effects stems from structural peculiarities. The region’s industrial structure, heavily reliant on capital-intensive heavy industries with inherently high emission intensities, establishes a baseline of persistent pollution that overshadows the moderating effects of digital transformation. Concurrently, the digital economy in this region remains underdeveloped compared to coastal areas, with digital infrastructure penetration and e-commerce adoption lagging significantly. This dual reality—high industrial emission rigidity coupled with digital development deficits—creates a unique scenario where conventional industrial paradigms dominate environmental outcomes, rendering statistical detection of digital economy impacts challenging within the model’s timeframe. Collectively, these regional disparities underscore pronounced heterogeneity in the digital economy’s pollution-mitigating effects across geographic contexts.
4.2 Threshold regression results
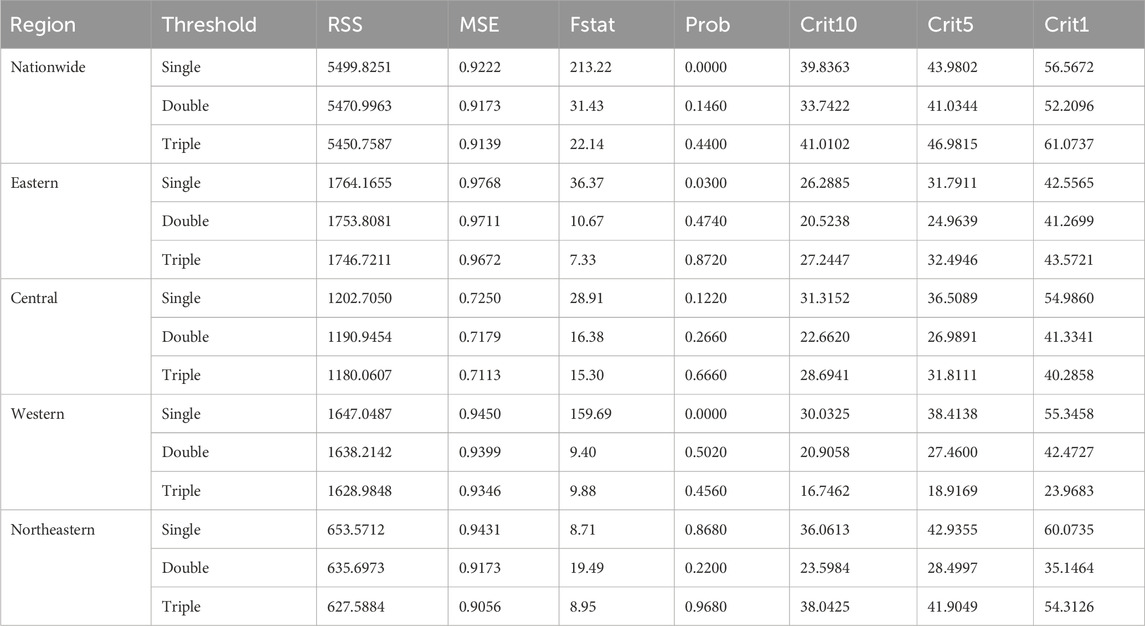
To capture the non-linear impact of digital economy development on pollution emissions more accurately, this study employs a refined threshold regression model, refer to Formula 3, for subsequent analysis. Initially, a three-threshold regression model was applied to examine data from the Nationwide, Eastern, Central, Western and Northeastern regions. The critical values for the confidence intervals were generated through 500 bootstrap resamples. The detailed results of these tests are presented in Table 5.
Table 5 reveals a significant single-threshold effect for the nationwide sample, indicating the presence of a single-threshold effect in the impact of digital economy development on pollution emission levels. This finding justifies the application of a single-threshold regression analysis. When examining regional heterogeneity, the results indicate that only the samples from the Eastern and Western regions exhibit significant single-threshold effects at the 5% and 1% significance levels, respectively, while the threshold effects for samples from other regions are not significant.
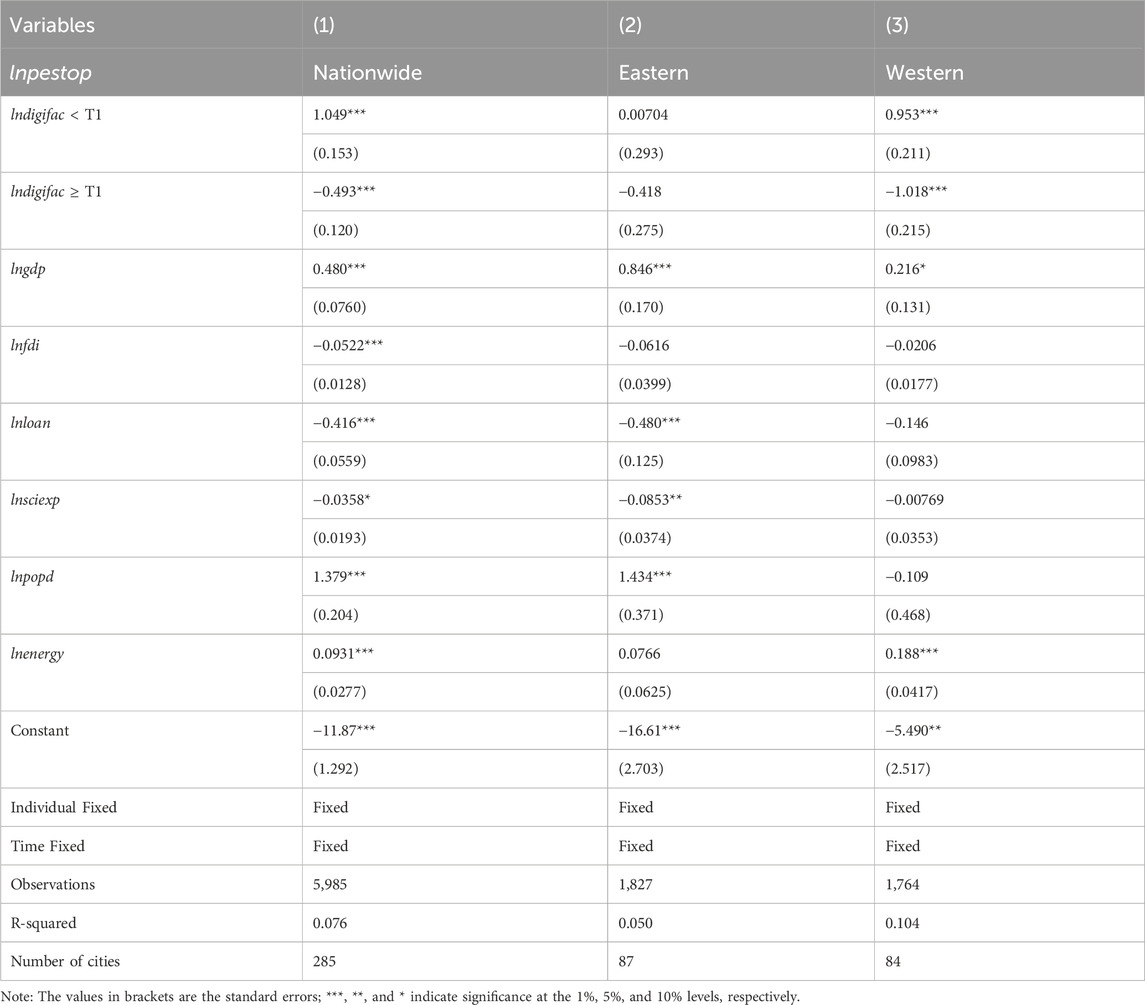
Tables 6, 7 present the single threshold regression results and the threshold value for the Nationwide, Eastern, and Western regions, respectively.
The regression results above indicate that the coefficient of digital economy development is significant both before and after the threshold in the Nationwide sample, suggesting a significant single-threshold effect across the entire dataset. However, in Regression (2), the coefficient of digital economy development is insignificant both before and after the threshold, implying that the Eastern region sample does not support the threshold effect. Conversely, the threshold is significant in the Western region sample, indicating the presence of a threshold effect in this area.
The inconsistent threshold test results across regions may be attributed to various factors. Primarily, the substantially reduced number of observations in regional regressions may introduce observational bias. Secondly, there is a spatial aggregation effect among cities, where cities in the same economic region tend to exhibit similar levels of digital economy development and pollution emissions, clustering the observations within a small range, potentially omitting the threshold effect.
It suggests considerable regional heterogeneity across the four economic regions of the country. The primary reason for this heterogeneity may lie in the geographical and economic characteristics of these regions. The Eastern, Central, and Northeastern regions are relatively concentrated, with similar levels of digital economy development and pollution emissions, thus failing to demonstrate a threshold effect. Conversely, the western region, characterised by its vast territory and diverse conditions, shows significant variations in both digital economy development and pollution emission levels, leading to the emergence of a discernible threshold effect. To specify the regional heterogeneity, this study conducts a descriptive statistical analysis of digital economy development and pollution emission levels by region. The results are presented in Table 8.
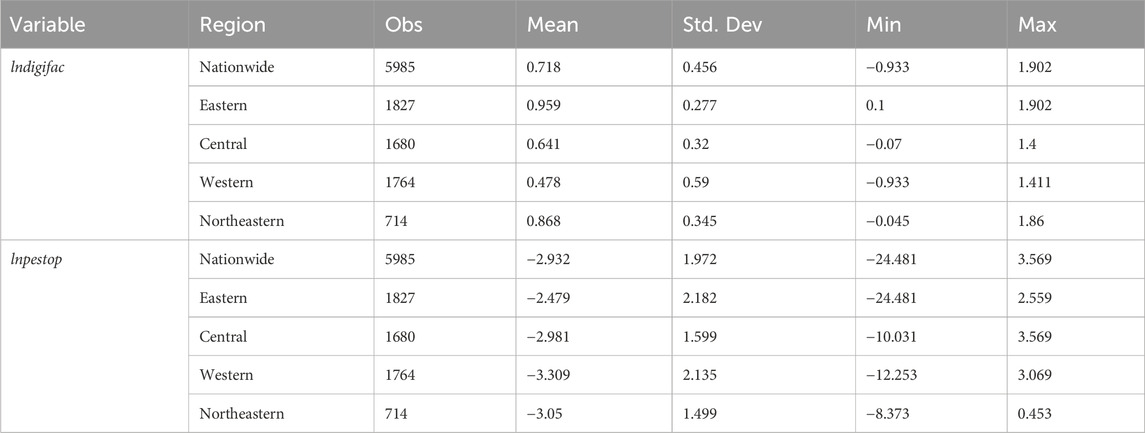
Table 8. The descriptive statistics of digital economy development and pollution emissions by region.
Table 8 presents the regional descriptive statistics for digital economy development and pollution emission levels. A discernible spatial clustering is evident in both indicators: the Eastern region exhibits the lowest pollution emission levels concomitant with the highest digital economy development, whereas the Western region demonstrates the converse, with the highest pollution emissions and lowest digital economy development. The standard deviations and value ranges further suggest a spatial spillover effect, albeit requiring further analysis through spatial models to confirm and elucidate these patterns.
4.3 Spatial autoregression results
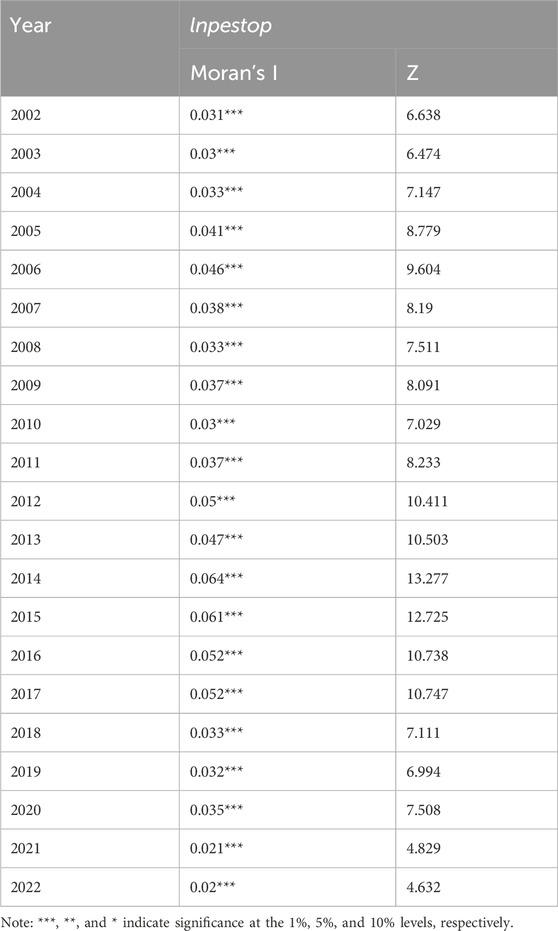
This study employs the Moran’s I statistic, calculated using inverse distance weighting matrices, to investigate the spatial spillover dynamics of urban pollution emissions. While acknowledging the modest global Moran’s I values presented in Table 9 (ranging between 0.02–0.064 across the 2002–2022 period), our analysis reveals statistically significant positive spatial autocorrelation at the 1% level for all observed years. This finding demonstrates that, despite moderate overall spatial correlation coefficients, localised spatial dependencies persist due to the specific configuration of our inverse distance weighting matrix, which captures fine-grained geographic proximities often overlooked by simpler binary contiguity matrices. The observed positive spillover effects - where pollution levels in one urban area exert demonstrable influence on neighbouring regions’ emission patterns - are validated through three critical observations: (1) the consistent significance of spatial coefficients across two decades; (2) Z-scores exceeding 4.6 in all years, indicating robust spatial structuring; and (3) the operationalisation of geographic proximity through inverse distance decay parameters, which amplify spillover detection in peri-urban zones. These results collectively justify the subsequent SAR model specifications, which explicitly account for these identified spatial transmission pathways. The study’s selection of inverse distance weighting - defined in Section 3.2.5 - enhances sensitivity to distance-decay effects, revealing meaningful spillover mechanisms even within the context of moderate global Moran’s I values. This underscores the importance of methodological transparency in spatial econometric analyses, particularly when addressing scale-dependent environmental impacts.
This paper investigates the spatial spillover effects of cities’ pollution emissions, with a particular focus on how digital economic development influences these dynamics. To ensure the appropriateness of the modelling framework, we initially conducted Lagrange Multiplier (LM) tests to verify the presence of spatial autocorrelation. The results confirmed the significance of spatial autoregressive terms, prompting us to augment the baseline model with a spatial autoregression term. Specifically, we employed a Spatial Autoregressive (SAR) model as outlined in Formula 4, where spatial dependencies are captured using an inverse distance weighting matrix defined in Formula 10. This matrix was selected to account for the nuanced geographic proximities that may influence pollution transmission patterns.
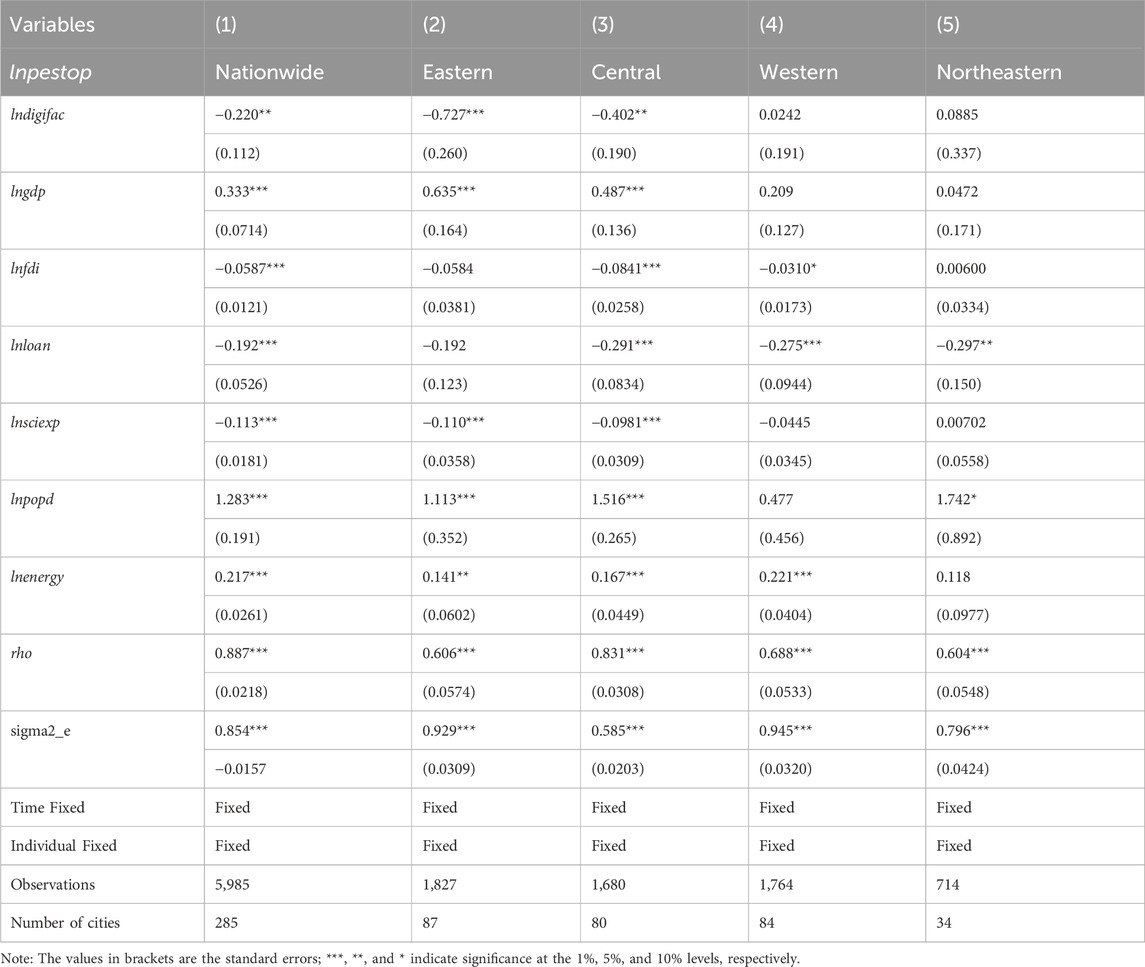
Subsequent spatial diagnostic tests were performed to determine the optimal model specification. The Hausman test indicated the rejection of random effects in favour of fixed effects, while the Likelihood Ratio (LR) test supported the adoption of a two-way fixed effects model, incorporating both cross-sectional and temporal dimensions. The final SAR two-way fixed effects regression results, presented in Table 10, reveal compelling insights. Column (1) demonstrates that digital economic development exerts a significantly negative impact on pollution emissions at the 5% significance level across the national scale. Concurrently, the spatial lag coefficient (rho) maintains statistical significance at the 1% level, alongside all control variables. These findings collectively suggest that the SAR model effectively captures the inhibitory effect of digital economic development on pollution emissions, underscoring the importance of considering spatial spillovers in environmental impact assessments.
From the perspective of regional heterogeneity, Columns (2)–(5) show that the impact of digital economic development on pollution emissions is significant only in the Eastern and Central regions but not in the Western and Northeastern regions. Nonetheless, the spatial lag term remains significant across all regressions, highlighting a significant spatial spillover effect. This may be attributed to several factors, including the relatively smaller sample sizes in the Western and Northeastern regions, relatively lower levels of digital economic development in these areas, the concentration of the observations within the same economic region and differences in industrial structure across different economic regions.
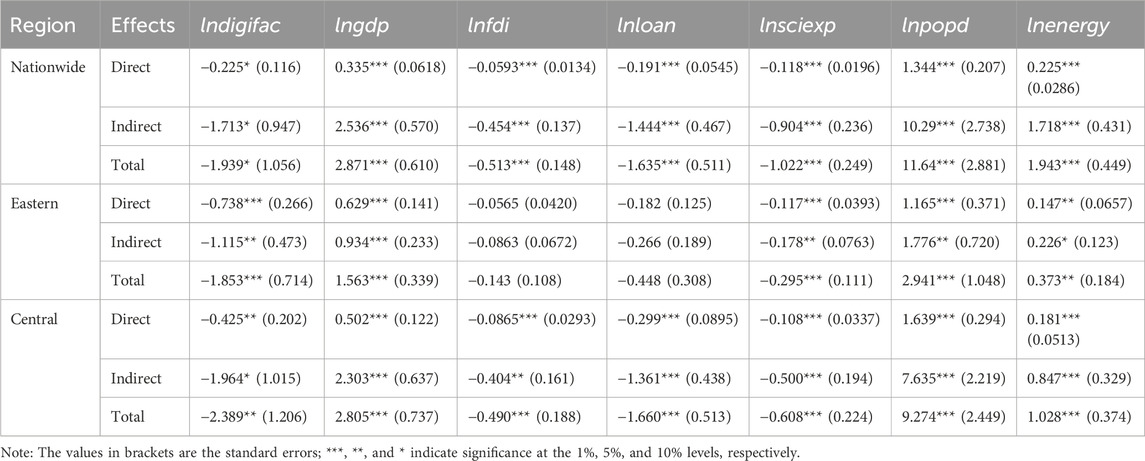
Table 11 shows the breakdown of the direct, indirect, and total effects derived from the SAR. The direct effect denotes the influence of a city’s own independent variables on its pollution emissions. The indirect effect represents the impact on a city’s emissions from a one-unit change in independent variables of neighbouring cities. The total effect is the sum of these two effects. Analysing the nationwide sample shows that the indirect effect has a statistically significant negative impact on pollution emissions with a coefficient of −1.713. Similarly, the direct effect also demonstrates a notable negative influence on pollution emissions with a coefficient of −0.225. Both these effects are statistically significant at the 10% level. This underscores a negative correlation between the level of digital economic development in neighbouring cities and pollution emission levels. Furthermore, this negative influence is observed to be statistically significant in both the eastern and central regions of the country, indicating a consistent pattern across these geographical areas.
4.4 Mediating effect results
This study performed a mediating effect analysis using the Bootstrap method to explore how green technological innovations and industrial upgrading mediate the digital economy’s influence on pollution emissions. Building upon the estimation of (Equations 5.1, 5.3), and (Equations 6.1, 6.3) the method tested the null hypothesis H0:
Table 12 presents the regression results of the mediation effects of green technological innovation and industrial structure upgrading. The indirect effect of green technological innovation is significant at the 5% level, while the indirect effect of industrial upgrading is significant at the 1% level. It indicates that both green technological innovation and industrial upgrading exhibit notable mediation effects.
Furthermore, the direct effects of digital economy development on pollution emissions remain statistically significant, even when accounting for the intermediary pathways of green technological innovation and industrial structural upgrading. This dual-pronged mechanism elucidates that digital transformation not only exerts a primary effect on environmental outcomes but also operates through secondary channels. Specifically, digital technologies enhance the diffusion of clean production methodologies and resource-efficient systems, fostering green innovation by enabling data-driven optimisation of energy consumption patterns and pollution abatement processes. Concurrently, digital penetration facilitates industrial restructuring by automating traditional manufacturing, promoting service-sector expansion, and reducing reliance on high-emission heavy industries. These structural shifts, mediated by digitalisation, create a synergistic effect that amplifies the pollution-mitigating potential of technological progress. Collectively, these findings substantiate the theoretical framework underpinning Hypotheses 3.1 and Hypotheses 3.2, demonstrating both direct and indirect transmission mechanisms in the digital economy’s environmental impact.
5 Robustness tests
Considering the endogeneity of variables, the heterogeneity among different levels of cities, and the examination of various types of spatial matrices, we perform a series of robustness tests on the econometric methods previously discussed. This approach seeks to validate the reliability of our findings related to the impact of digital economy development on pollution emissions.
5.1 Endogenous problems
To address the issue of endogeneity inherent in the digital economy variable, this study constructs the “Bartik instrument” for implementation in a two-stage least squares (2SLS) regression (Bartik, 2006; Goldsmith-Pinkham et al., 2020). This “Bartik instrument” is formulated as the product of the lagged digital economy development (lndigifacit-1) and the first-order difference of the national digital economy development index (Δlndigifact-1), denoted as (ivlndigifac).
The rationale behind constructing this instrumental variable is twofold. The national digital economy development index, derived from the average values of 285 cities, is intended to reflect overarching trends that are resistant to significant influence from the dynamics of any individual city. Consequently, the differenced term can be considered exogenous relative to individual cities, thereby fulfilling the requirement for an effective instrumental variable. Secondly, although environmental pollution may be influenced by various unobserved shocks, the validity of our instrument depends on these shocks not being substantial enough to affect the national digital economy development. Under these conditions, the Bartik instrument continues to serve as a reliable proxy for the expected value of each city’s digital economy development, contingent upon the observed national trend. Moreover, the instrumental variable has successfully passed the weak IV test, thereby affirming its validity.
Table 13 shows two methodologies we conducted to address the issue of endogeneity. First, we utilised the standard Two-Stage Least Squares (2SLS) method to mitigate potential biases arising from endogenous variables. The results are presented in Columns (1) and (2). It demonstrates that the coefficient for digital economy development is markedly negative, aligning with the significance observed in the baseline model regression (2). This preliminary finding indicates robust baseline model results, accounting for endogeneity issues.
Furthermore, this study delves into the threshold effect of digital economy development on pollution emission levels. To this end, a two-stage threshold regression was conducted, inspired by the two-stage least squares (2SLS) approach. In the first stage, a fixed-effects regression was performed using an instrumental variable for digital economy development, with the results presented in Column (3). Then, the fitted values obtained from this regression were employed as a substitute for the original independent variable, namely digital economy development, in the second-stage threshold effect regression. The threshold effect regression utilised the Bootstrap method with 500 resamples to determine the confidence intervals and critical values, and the results are displayed in Column (4). The findings reveal that both the instrumental variable and the fitted values for digital economy development are statistically significant. Consequently, this suggests that, after accounting for endogeneity, the results of the threshold regression remain significant and robust.
5.2 Excluded municipalities sample
In the previous regressions, the initial sample encompassed 281 prefecture-level cities and 4 municipalities. Given municipalities’ higher administrative authority, mixing them with prefecture-level cities could introduce bias. Consequently, we excluded the municipalities from the sample and re-ran the regression analysis. The revised results are presented subsequently.
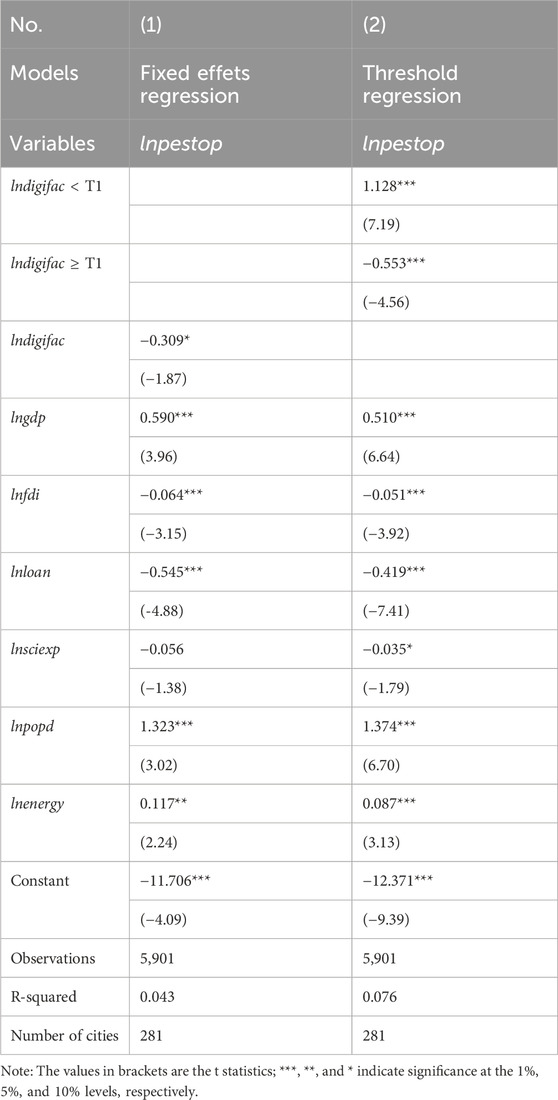
Table 14 presents the regression results of the fixed-effects model and the threshold regression model after excluding municipalities. The parameters for the digital economy development are found to be significant in both models, which aligns with the findings from the baseline model and the threshold regression model in Tables 3, 6. This consistency underscores the robustness of our regression results, indicating that the digital economy development’s impact on pollution emissions remains stable across different model specifications.
5.3 Change the spatial matrix
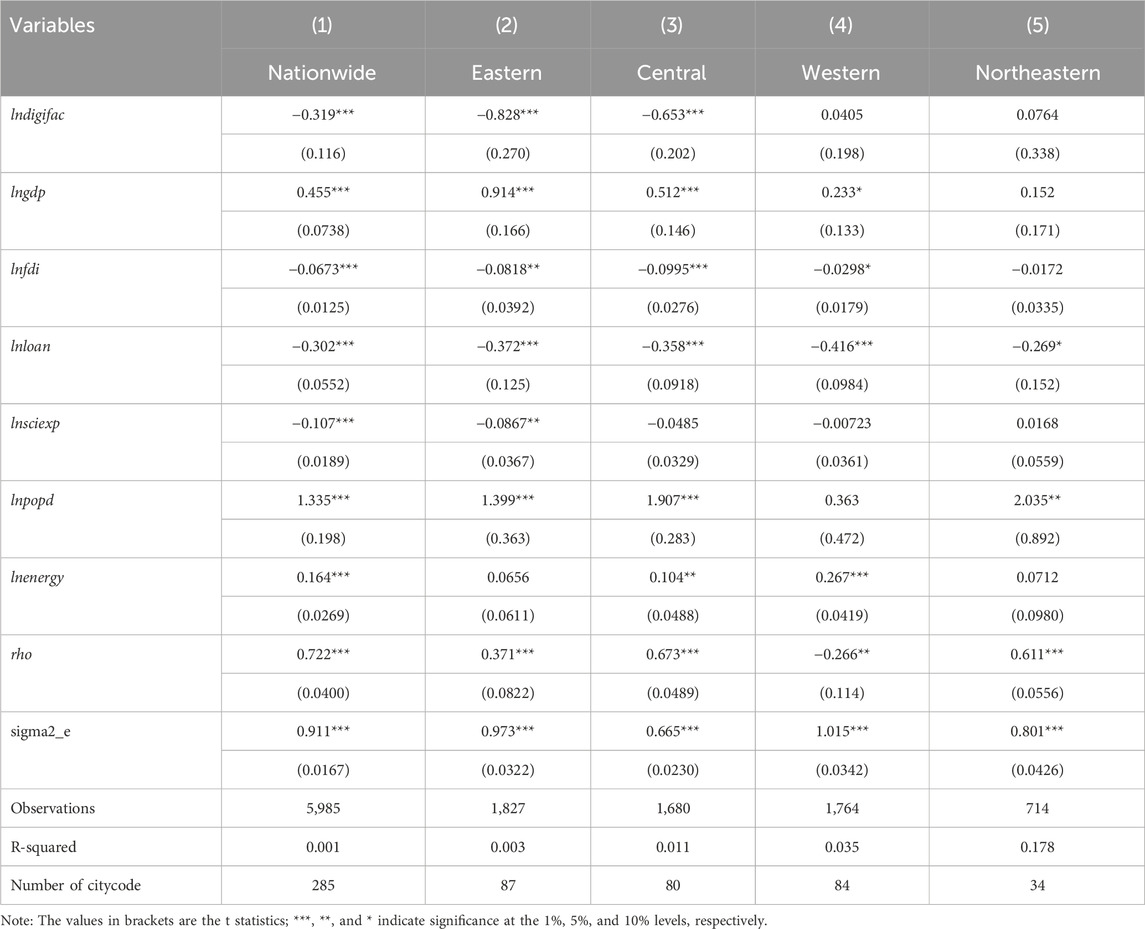
After replacing the spatial matrix with a distance matrix, the results obtained were consistent with the original spatial regression outcomes, thereby demonstrating the robustness of the spatial regression analysis. This consistency suggests that the impact of the digital economy development on pollution emissions is stable across different spatial configurations.
Table 15 presents SAR regression results after altering the spatial weight matrix. Specifically, the regression results indicate that, with the exception of the western and northeastern regions, the impact of the digital economy development on pollution emissions is statistically significant. This finding further confirms the robustness of our spatial regression results and underscores the importance of considering spatial factors in studying the complex relationship between digital economy development and pollution emissions.
6 Conclusion and discussion
6.1 Conclusion
This study delves into the intricate relationship between urban digital economy development and pollution emissions, employing a comprehensive array of econometric models to unravel this dynamic. The findings reveal a distinctive inverted U-shaped pattern in the impact of digital economy advancement on pollution levels. Initially, the expansion of digital infrastructure and the energy-intensive operations associated with it may contribute to increased emissions. However, as the digital economy matures and industrial digitisation progresses, it facilitates enhanced productivity and fosters green technological innovations, ultimately leading to a reduction in pollution emissions. This transition underscores the transformative potential of the digital economy in environmental sustainability.
Furthermore, the analysis highlights significant regional disparities and spatial spillover effects in the influence of digital economy development on pollution emissions. Urban agglomerations and industrial hubs in eastern and central China exhibit more pronounced pollution reductions, attributed to their advanced digital infrastructure, higher internet penetration, and robust technological ecosystems. Conversely, regions with less developed digital economies and lower population densities demonstrate a lesser impact on pollution abatement. Additionally, the spatial spillover effect implies that pollution management strategies must extend beyond individual cities to encompass regional collaboration, as emissions in one city can affect neighbouring areas.
The study also elucidates the mediating roles of green technological innovation and industrial structural upgrading. The digital economy serves as a catalyst for the emergence and diffusion of green technologies, enhancing resource utilisation efficiency and mitigating emissions. Simultaneously, it propels a shift in industrial structures towards knowledge-intensive and technology-intensive sectors, thereby reducing the overall pollution intensity of economic activities.
6.2 Discussion
The findings of this study carry substantial policy implications. Policymakers should recognise the dual nature of the digital economy’s environmental impact and implement targeted environmental regulations that adapt to different stages of digital development. In the early stages, emphasis should be placed on energy-efficient infrastructure and green technology adoption to offset potential emission increases. As the digital economy matures, policies should focus on promoting advanced digital technologies and industrial upgrading to harness the emission-reducing benefits.
Moreover, the study underscores the critical role of regional environmental policies in coordinating the development of the digital economy and pollution control. Cities should collaborate to establish unified environmental standards and implement joint pollution management initiatives. For instance, the implementation of regional carbon trading markets or joint technological innovation platforms could facilitate the sharing of resources and best practices, thereby enhancing the overall effectiveness of pollution abatement efforts.
The analysis also reveals the necessity for policymakers to consider the heterogeneous impacts of digital economy development across regions. One-size-fits-all policies may not be effective, as the digital economy’s influence on pollution emissions varies significantly depending on local economic structures, infrastructure, and environmental regulations. Therefore, policies should be tailored to the specific contexts of different regions to maximise their efficacy.
Beyond the foregoing analysis, promising avenues for future research lie in dissecting the micro-level determinants of the digital-environmental interplay. This could entail, for instance, granular examinations of how region-specific digital innovations—such as AI-driven energy management systems or blockchain-based supply chain decarbonisation frameworks—might interact with local industrial configurations and policy ecosystems to yield emission reductions. Equally critical would be cross-regional comparative studies of institutional architectures, particularly how variations in environmental governance paradigms (e.g., carbon taxation vs. cap-and-trade systems) and digital infrastructure policies modulate the environmental efficacy of urban digitalisation trajectories. Longitudinal investigations adopting such comparative lenses would not only elucidate the temporal evolution of digital economies’ environmental footprints but also disentangle the complex, context-dependent synergies and trade-offs inherent in this relationship.
Data availability statement
The original contributions presented in the study are included in the article/supplementary material, further inquiries can be directed to the corresponding author.
Author contributions
TL: Conceptualization, Investigation, Project administration, Resources, Supervision, Writing – review and editing. JM: Data curation, Formal Analysis, Methodology, Software, Writing – original draft, Writing – review and editing.
Funding
The author(s) declare that no financial support was received for the research and/or publication of this article.
Conflict of interest
The authors declare that the research was conducted in the absence of any commercial or financial relationships that could be construed as a potential conflict of interest.
Generative AI statement
The author(s) declare that no Generative AI was used in the creation of this manuscript.
Publisher’s note
All claims expressed in this article are solely those of the authors and do not necessarily represent those of their affiliated organizations, or those of the publisher, the editors and the reviewers. Any product that may be evaluated in this article, or claim that may be made by its manufacturer, is not guaranteed or endorsed by the publisher.
References
Andrae, A. S. (2020). New perspectives on internet electricity use in 2030. Eng. Appl. Sci. Lett. 3 (2), 19–31. doi:10.30538/psrp-easl2020.0038
Bai, F., Huang, Y., Shang, M., and Ahmad, M. (2022). Modeling the impact of digital economy on urban environmental pollution: empirical evidence from 277 prefecture-level cities in China. Front. Environ. Sci. 10. doi:10.3389/fenvs.2022.991022
Bartik, T. (2006). How do the effects of local growth on employment rates vary with initial labor market conditions. Kalamazoo: W.E. Upjohn Institute for Employment Research. doi:10.17848/wp09-148
Chen, X., and Qi, Y. (2023). Research on factors influencing the digital economy based on principal component analysis: a case study of liaoning province. Highlights Bus. Econ. Manag. 22, 424–433. doi:10.54097/78t78662
Cheng, Y., and Yang, J. (2023). Spatial and temporal divergence in the coupling coordination of digital economy, environmental regulation and sustainable development: an experience study in China. Sustainability 15 (12), 9649. doi:10.3390/su15129649
Dinda, S. (2004). Environmental Kuznets curve hypothesis: a survey. Ecol. Econ. 49 (4), 431–455. doi:10.1016/j.ecolecon.2004.02.011
Elsner, M., Atkinson, G., and Zahidi, S. (2025). Global Risks Report 2025. Cologny, Geneva: World Economic Forum.
Gao, J., Guihong, H., AbidAli, R., Baofeng, H., and Li, Z. (2024). Towards a green digital city: digital economy, digital innovation, and urban haze pollution. J. Urban Technol. 31(4-5), 157–189. doi:10.1080/10630732.2024.2419349
Goldsmith-Pinkham, P., Sorkin, I., and Swift, H. (2020). Bartik instruments: what, when, why, and how. Am. Econ. Rev. 110 (8), 2586–2624. doi:10.1257/aer.20181047
Grossman, G. M., and Krueger, A. B. (1995). Economic growth and the environment. Q. J. Econ. 110 (2), 353–377. doi:10.2307/2118443
Guo, F., Wang, J., Wang, F., Kong, T., Zhang, X., and Cheng, Z. (2020). Measuring the development of digital financial inclusion in China: index compilation and spatial characteristics. China Econ. Q. 19 (04), 1401–1418. [In Chinese]. doi:10.13821/j.cnki.ceq.2020.03.12
Han, D., Ding, Y., Shi, Z., and He, Y. (2022). The impact of digital economy on total factor carbon productivity: the threshold effect of technology accumulation. Environ. Sci. Pollut. Res. 29 (37), 55691–55706. doi:10.1007/s11356-022-19721-x
Hayes, A. F. (2009). Beyond baron and kenny: statistical mediation analysis in the new millennium. Commun. Monogr. 76 (4), 408–420. doi:10.1080/03637750903310360
Jiang, Y., and Deng, F. (2022). Multi-dimensional threshold effects of the digital economy on green economic growth? new evidence from China. Sustainability 14 (19), 12888. doi:10.3390/su141912888
Li, J., Chen, L., Chen, Y., and He, J. (2022a). Digital economy, technological innovation, and green economic efficiency—empirical evidence from 277 cities in China. Manag. Decis. Econ. 43 (3), 616–629. doi:10.1002/mde.3406
Li, Y., Wang, Y., Zhang, X., and Huang, Q. (2022b). Impact of global value chain embedding on industrial environmental performance: an empirical study based on the countries along the Belt and Road. Front. Environ. Sci. 10. doi:10.3389/fenvs.2022.1026068
Mackinnon, D., Fairchild, A. J., and Fritz, M. S. (2007). “Mediation analysis,” in Annual review of psychology. Editors S. Fiske, A. Kazdin, and D. Schacter, 593–614.
MacKinnon, D. P., Lockwood, C. M., Hoffman, J. M., West, S. G., and Sheets, V. (2002). A comparison of methods to test mediation and other intervening variable effects. Psychol. Methods 7 (1), 83–104. doi:10.1037/1082-989X.7.1.83
Mai, W., Xiong, L., Liu, B., and Liu, S. (2025). Spatial–temporal evolution, drivers, and pathways of the synergistic effects of digital transformation on pollution and carbon reduction in heavily polluting enterprises. Sci. Rep. 15 (1), 11963. doi:10.1038/s41598-025-96834-6
Meinhold, R., Wagner, C., and Dhar, B. K. (2025). Digital sustainability and eco-environmental sustainability: a review of emerging technologies, resource challenges, and policy implications. Sustain. Dev. 33 (2), 2323–2338. doi:10.1002/sd.3240
Preacher, K. J., and Hayes, A. F. (2008). Asymptotic and resampling strategies for assessing and comparing indirect effects in multiple mediator models. Behav. Res. Methods 40 (3), 879–891. doi:10.3758/BRM.40.3.879
Preacher, K. J., Rucker, D. D., and Hayes, A. F. (2007). Addressing moderated mediation Hypotheses: theory, methods, and prescriptions. Multivar. Behav. Res. 42 (1), 185–227. doi:10.1080/00273170701341316
Serpe, A., Purchase, D., Bisschop, L., Chatterjee, D., De Gioannis, G., Garelick, H., et al. (2024). 2002–2022: 20 years of e-waste regulation in the European Union and the worldwide trends in legislation and innovation technologies for a circular economy. RSC Sustain. 3, 1039–1083. doi:10.1039/D4SU00548A
Shahbaz, M., Khraief, N., Uddin, G. S., and Ozturk, I. (2014). Environmental Kuznets curve in an open economy: a bounds testing and causality analysis for Tunisia. Renew. Sustain. Energy Rev. 34, 325–336. doi:10.1016/j.rser.2014.03.022
Shen, X., Zhao, H., Yu, J., Wan, Z., He, T., and Liu, J. (2022). Digital economy and ecological performance: evidence from a spatial panel data in China. Front. Environ. Sci. 10. doi:10.3389/fenvs.2022.969878
Shi, F., Ding, R., Li, H., and Hao, S. (2022a). Environmental regulation, digital financial inclusion, and environmental pollution: an empirical study based on the spatial spillover effect and panel threshold effect. Sustainability 14 (11), 6869. doi:10.3390/su14116869
Shi, Y., Gao, Y., Luo, Y., and Hu, J. (2022b). Fusions of industrialisation and digitalisation (FID) in the digital economy: industrial system digitalisation, digital technology industrialisation, and beyond. J. Digital Econ. 1 (1), 73–88. doi:10.1016/j.jdec.2022.08.005
Shi, Y., Hu, J., Shang, D. T., Liu, Z., and Zhang, W. (2023). Industrialisation, ecologicalisation and digitalisation (IED): building a theoretical framework for sustainable development. Industrial Manag. & Data Syst. 123 (4), 1252–1277. doi:10.1108/IMDS-06-2022-0371
Song, X., Tian, Z., Ding, C., Liu, C., Wang, W., Zhao, R., et al. (2022). Digital economy, environmental regulation, and ecological well-being performance: a provincial panel data analysis from China. Int. J. Environ. Res. Public Health 19 (18), 11801. doi:10.3390/ijerph191811801
Wang, C., Liu, T., Zhu, Y., Lin, M., Chang, W., Wang, X., et al. (2022). Digital economy, environmental regulation and corporate green technology innovation: evidence from China. Int. J. Environ. Res. Public Health 19 (21), 14084. doi:10.3390/ijerph192114084
Wang, W., Xiao, D., Wang, J., and Wu, H. (2024). The cost of pollution in the digital era: impediments of air pollution on enterprise digital transformation. Energy Econ. 134, 107575. doi:10.1016/j.eneco.2024.107575
Xiong, L., Ning, J., and Dong, Y. (2022). Pollution reduction effect of the digital transformation of heavy metal enterprises under the agglomeration effect. J. Clean. Prod. 330, 129864. doi:10.1016/j.jclepro.2021.129864
Xu, J., and Li, W. (2022). The impact of the digital economy on innovation: new evidence from panel threshold model. Sustainability 14 (22), 15028. doi:10.3390/su142215028
Xu, S., Yang, C., Huang, Z., and Failler, P. (2022). Interaction between digital economy and environmental pollution: new evidence from a spatial perspective. Int. J. Environ. Res. Public Health 19 (9), 5074. doi:10.3390/ijerph19095074
Yang, J., Wang, Y., Tang, C., and Zhang, Z. (2024). Can digitalization reduce industrial pollution? Roles of environmental investment and green innovation. Environ. Res. 240, 117442. doi:10.1016/j.envres.2023.117442
Yang, Y., and Liang, Q. (2023). Digital economy, environmental regulation and green eco-efficiency—empirical evidence from 285 cities in China. Front. Environ. Sci. 11. doi:10.3389/fenvs.2023.1113293
Yang, Z., Fu, L., and Chen, Y. (2023). Digital economy and pollution reduction–Mechanism and regional heterogeneity. PLOS ONE 18 (2), e0277852. doi:10.1371/journal.pone.0277852
Yuan, H., Liu, J., Li, X., and Zhong, S. (2024). The impact of digital economy on environmental pollution: evidence from 267 cities in China. PLOS ONE 19 (1), e0297009. doi:10.1371/journal.pone.0297009
Yue, L., and Han, L. (2025). The digital empowerment promotes synergistic efficiency in regional pollution reduction and carbon emission Reduction—analysis of the moderating effects of market structure and government behavior. J. Clean. Prod. 493, 144867. doi:10.1016/j.jclepro.2025.144867
Keywords: digital economy development, pollution emissions, inverted U-shaped relationship, spatial spillover effect, green technological innovation, industrial structure upgrading
Citation: Lan T and Ma J (2025) How does a city’s digital economy development impact pollution emissions?. Front. Environ. Sci. 13:1538077. doi: 10.3389/fenvs.2025.1538077
Received: 02 December 2024; Accepted: 23 April 2025;
Published: 02 May 2025.
Edited by:
Gabriela Mustata Wilson, University of Louisiana at Lafayette, United StatesReviewed by:
Rui Huang, Nanjing Normal University, ChinaJia Liu, Jiangxi University of Finance and Economics, China
Copyright © 2025 Lan and Ma. This is an open-access article distributed under the terms of the Creative Commons Attribution License (CC BY). The use, distribution or reproduction in other forums is permitted, provided the original author(s) and the copyright owner(s) are credited and that the original publication in this journal is cited, in accordance with accepted academic practice. No use, distribution or reproduction is permitted which does not comply with these terms.
*Correspondence: Jun Ma, bWFqdW5AbmJ1ZmUuZWR1LmNu
 Tian Lan1
 Jun Ma