 Yasi Yang1,2
 Wensheng Wang1,2*
- 1School of Management, China University of Mining and Technology-Beijing, Beijing, China
- 2Research Institute of Decision-Making Science and Big Data, China University of Mining and Technology-Beijing, Beijing, China
This study examines the complex relationship between renewable energy penetration (REP) and CO2 emissions in China, aiming to provide insights into deep decarbonization strategies. Using the advanced and robust pooled mean group-autoregressive distributed lag (PMG-ARDL) estimation, this paper analyzes the long-run equilibrium and short-run dynamics of REP and CO2 emissions based on panel data from 30 Chinese provinces (1997–2021). Wavelet coherence analysis (WCA) and exploratory spatio-temporal data analysis (ESTDA) are also employed to explore time-frequency relationships and spatial correlation dynamics. The findings indicate that: (1) A 1% increase in REP reduces long-term and short-term carbon emissions by 0.05% and 0.26%, respectively. (2) A more pronounced coherence in the 1–2 year time-frequency band. (3) REP and CO2 exhibit opposing spatial distribution patterns (−0.224), with distinct north-south clustering, dominated by low-high and low and high clustering, respectively. (4) Most provinces’ LISA time paths demonstrate strong spatiotemporal stability, while Central, South, and Southwest China exhibit a more complex spatial variability process, and the spatiotemporal transitions, predominantly of Type IV, reflect strong locking effects. This paper offers policy suggestions for China’s low-carbon energy system and lessons for other economies.
1 Introduction
Fossil fuels have long dominated the global energy mix, accounting for 82.6% of global energy consumption in 2022 (Bob, 2023). However, the greenhouse gas emissions caused by long-term consumption of fossil fuels have seriously exceeded the purification capacity of natural ecosystems, resulting in rising global temperatures and frequent occurrence of extreme weather, and measures to mitigate climate change on earth have become a focus of global attention in recent years (Khan et al., 2022). At the same time, fossil fuels themselves have depletion characteristics, and for the concerns of energy security and climate change, realizing energy transition has increasingly become the consensus of the international community (Gielen et al., 2019). The 2019 United Nations Climate Action Summit emphasized the realization of net-zero carbon emissions by 2050 and called for accelerating the transition from fossil to renewable energy (RE) sources, which has pointed out the direction of the global energy transition has pointed out the direction.
China’s rapid economic development has created a rigid demand for energy, which is accompanied by a rapid increase in CO2 emissions. As a major player and leader in the carbon emissions landscape (Yue et al., 2017), China faces enormous domestic and international pressure to reduce emissions (Zhao et al., 2020). China attaches great importance to combating climate change and has set ambitious dual-carbon targets. However, the huge energy demand and the fossil fuel-based energy structure had increased the security risks of energy supply, especially in the winter of 2021, when some areas resurfaced the situation of “power rationing,” which signals that China’s energy structure urgently needs to carry out a profound systematic change. RE demands an urgent leap from “small scale” and “low penetration” to “large scale” and “high penetration”.
The 14th Five-Year Plan explicitly proposed to significantly increase the proportion of RE in the electricity supply. The position of RE in power supply has become increasingly prominent (Yu et al., 2021), and increasing the penetration of RE in power generation has been identified as a key countermeasure to curb carbon emission reduction and an important hand in promoting energy transition (Zheng et al., 2021). Given the urgency of combating climate change and the imperative of energy transition, it is of enormous practical value to deeply investigate the dynamic relationship between REP and CO2 emission.
Although many scholars have initiated discussions in the area of the relationship between RE and CO2, there are still several research gaps: (1) Existing literature mostly focuses on cross-country comparisons or single-country level, ignoring the heterogeneity of different regions within a country, which reduces the generalizability and adaptability of regional policies. In particular, there are relatively few case studies of a large energy-consuming country like China with a vast territory and unbalanced development of RE, and even fewer studies exploring the relationship between REP and CO2 emissions from the production side of RE. (2) Although WCA has been applied in the field of energy economy, no study has empirically examined the time-frequency relationship between RE and CO2 in China and failed to capture the synergistic or lagging effects of the two at different time-frequency scales. (3) Most of the previous studies adopt a single methodology, focusing on the dynamic relationship in the time dimension, and lack in-depth exploration of the linkage relationship in the spatial and temporal scales, which makes it difficult to effectively support the formulation of context-specific matching policies.
The necessity of this study lies in the fact that the evolving relationship between REP and CO2 emissions has important policy-level implications for achieving carbon neutrality goals and enhancing energy security. Given that locally adapted regional strategies are essential to effectively drive the energy transition, policymakers need to have a deeper understanding of how REP affects carbon emissions at the temporal and even spatial levels, as well as at the overall and regional levels.
To address this policy challenge and fill the identified research gap. By combining the PMG-ARDL model, WCA, and ESTDA analytical methods, based on Chinese provincial data and from the production side, this study constructs an integrated analytical framework that can simultaneously capture the differences in long-term trends, short-term fluctuations, and spatial dynamics between the two variables at the provincial level in China, which provides a more comprehensive and in-depth perspective for the study of the dynamic relationship between REP and CO2, and supports the effectiveness and precision of policy.
The purpose of this study is to deeply investigate the spatio-temporal dynamic relationship between REP and CO2 emissions and to provide a theoretical basis and decision-making reference for the formulation of more targeted regional carbon emission reduction policies through the revelation of the temporal and spatial relationship between the two.
Compared with previous studies, the innovations and main contributions of this paper include: (1) Based on provincial panel data, this study analyzes in-depth the contribution of REP to carbon emission reduction from the production side, which provides a direct decision-making basis for the precise regulation of regional energy policies. (2) For the first time, this study extends the time-scale analysis through the WCA method in the Chinese context, verifies the time-frequency relationship of variables, and provides new evidence to reveal the evolution pattern of renewable energy power generation and CO2 in China. (3) It makes up for the shortcomings of the temporal and spatial linkage analysis by combining the PMG-ARDL model with the ESTDA method to consider the relationship between REP and CO2 simultaneously in both time and space dimensions, which captures both the long-term cointegration and short-term dynamic relationships among the variables and reveals the regional interdependence and spatial agglomeration pattern characteristics and their evolution.
In summary, this study not only makes up for the deficiencies of the existing literature in the analysis of spatial and temporal linkages, but also injects new vitality into the theoretical study of REP and CO2 emissions, and provides policymakers with a more accurate basis for regional decision-making. This paper not only has guiding significance for China’s energy policy, but also provides important policy insights for other economies, especially developing countries, to formulate low-carbon development strategies, and provides a multidimensional and multi-scale relationship analysis framework for subsequent studies. The research framework is shown schematically in Figure 1.
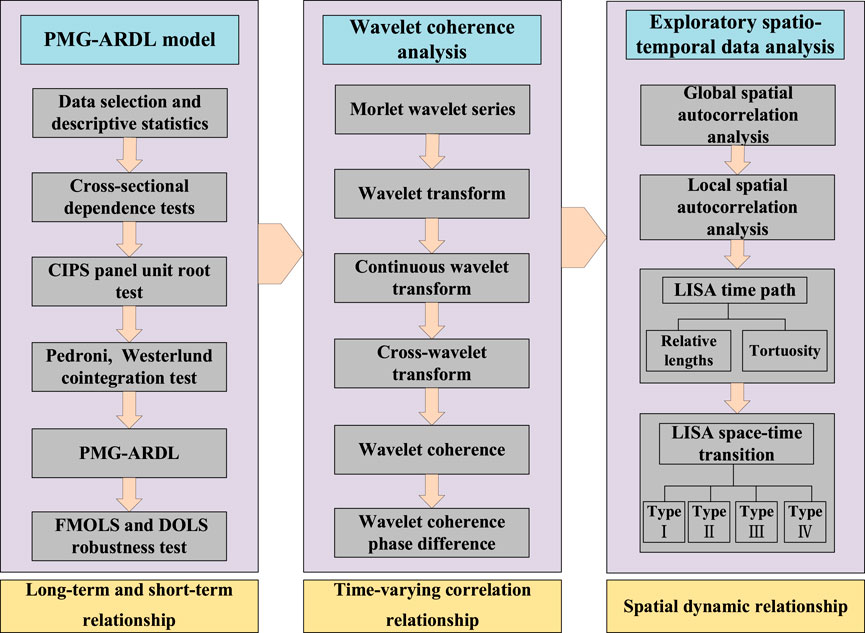
Figure 1. Schematic of research framework.
2 Literature review
The intensifying problem of climate change on a global scale has prompted countries to actively explore low-carbon development paths, and they have taken measures to reduce CO2 emissions. RE, as a kind of clean energy, has attracted widespread attention in terms of its relationship with CO2 emissions, and although relevant literature has been abundant, no clear consensus has been reached so far.
Most scholars agree that there is a negative correlation between RE and CO2. For instance, both Ali et al. (2023) 46-year-long panel data analysis of emerging economies in Asia and Apergis et al. (2018) study of 42 countries in sub-Saharan Africa consistently shows that renewable energy consumption (REC) has a long-term dampening impact on carbon emissions. Naseem et al. (2024) quantified the environmental and economic impacts of (un)RE resources and showed that RE demonstrates significant advantages in protecting the environment in G20 countries. This conclusion is corroborated by Rahman et al.'s study (Rahman et al., 2024) on several countries that are highly dependent on fossil fuels. Yao et al., (2019) highlighted that the carbon-reducing effect of RE is universal across countries with different levels of economic development. In addition to multi-country comparative studies, scholars have also explored specific countries or regions in depth. Zuhal and Göcen (2024) used spectral Granger causality analysis to suggest that RE is the key to achieving sustainable development in the United States. The spatial Durbin modeling analysis of Li et al. (2024) showed the carbon reduction effect is not only limited to the local area but also has a positive demonstration effect on the neighboring areas.
Some scholars have pointed out that this negative effect is not immediately apparent, but an accumulation process. For example, Yu et al. (2020) found that the CO2 emission reduction effect of RE generation in China has a time lag through a panel quantile regression model, which is gradually enhanced over time, and Chen et al. (2022a) further supported this view by using a nonlinear panel threshold model, which shows that the emission reduction effect of RE can only be significantly manifested after REC reaches a certain scale. Through the ARDL model, Wang (2022) observed that REC has a significant long-term inhibitory effect on CO2, but no notable effect in the short term. With the help of WCA, Bilgili et al. (2016) and Kuşkaya and Bilgili (2020) emphasized that the effect of time lags should be fully considered when evaluating the carbon-reducing effects of biomass and wind energy in the United States.
However, some studies come to different conclusions. A worldwide Nonlinear ARDL (NARDL) model research by Rehman et al. (2023) found that the carbon reduction effect of REC on CO2 emissions was not as significant as expected, which triggered new thinking about the carbon reduction potential of RE. Ali et al. (2022) surprisingly uncovered that REC not only fails to reduce carbon emission intensity but even has the opposite effect. The results of WCA by Bilgili et al. (2021) indicated that there is temporal heterogeneity in the carbon-reducing effect of hydropower, which may temporarily intensify carbon emissions in the short term, while the investigation by Arain et al. (2020) revealed that the correlation between REC and CO2 emissions is not strong.
These conflicting findings may be due to differences in variable selection, study scales, and methodological and technical changes. First, A majority of previous research variable selection focuses on the consumption side of RE, and few studies have been conducted from the generation side (Yu et al., 2021). Accelerating the deployment of RE focuses on adjusting and optimizing the power supply structure, which requires increasing the proportion of RE power generation; therefore, this paper will focus on uncovering the relationship from the production side.
Second, the choice of research scale affects the conclusions. Globally, scholars often select a representative sample of continents or countries, such as Africa (Abban et al., 2022), Asia (Wu et al., 2022), the top 74 countries in carbon emissions (Sharif et al., 2019), MINT countries (Akram et al., 2022), major nuclear power countries (Kartal et al., 2023), developing countries (Dimitriadis et al., 2021), and so on. Additionally, it is also more common to conduct comparative studies based on international organizations or regional cooperation platforms, for example, the European Union (Shahnazi and Shabani, 2021), the BRICS (Sebri and Ben-Salha, 2014), the Group of 20 (Naseem et al., 2024), the Belt and Road (Sheraz et al., 2022), the Group of Seven (Cai et al., 2018), and so on. Meanwhile, some studies focus on single energy varieties, such as biomass (Bilgili et al., 2016), wind energy (Kuşkaya and Bilgili, 2020), and hydroelectric (Bilgili et al., 2021), etc., to explore in depth the characteristics and developmental patterns of specific energy types. However, the above studies are often limited by the level of economic development, policy environment, and institutional differences between countries, which makes it difficult to directly generalize to other regions. Instead, the literature focuses on a single country as the object of study, such as China (Wang, 2022), the United States (Twumasi, 2017), Thailand (Phadkantha and Tansuchat, 2023), Turkey (Yurtkuran, 2021; Pata, 2018), India (Kang et al., 2019), and Saudi Arabia (AlNemer et al., 2023), etc., although they can analyze the energy transition process of a specific country, they tend to neglect the heterogeneity of different regions within the country, especially China, a large energy-consuming country. Given this, this study, based on Chinese provincial panel data, examines the dynamics of Chinese provinces in the time dimension and the heterogeneity in the spatial dimension.
Furthermore, the existing literature presents a diversity of research methods on the relationship between RE and CO2. Traditional econometric models, such as the Vector Autoregression (VAR) model (Kang et al., 2019; khoshnevis Yazdi and Shakouri, 2018), Error Correction Model (ECM) (Apergis and Payne, 2014; Gwani and Sek, 2023), causality test (Inglesi-Lotz and Dogan, 2018), Fully Modified Ordinary Least Squares (FMOLS) (Saidi and Omri, 2020; Shao et al., 2019), and Dynamic Ordinary Least Squares (DOLS) (Inglesi-Lotz and Dogan, 2018; Qudrat-Ullah and Nevo, 2022) are widely used to depict the long-term stable relationship between variables. To dig deeper into the mechanism of the impact of RE on CO2, some studies have also adopted methods such as panel threshold models (Chen et al., 2022a) and quantile regression models (Yu et al., 2020; Chen and Lei, 2018), the former of which is effective in capturing the nonlinear relationship between variables, and the latter of which can characterize the heterogeneous relationship between variables. In recent years, the ARDL model (Khan et al., 2022; Yu et al., 2020; Yurtkuran, 2021; Chen et al., 2019) and its extensions, such as the Cross-Sectionally Augmented ARDL(CS-ARDL) model (Sheraz et al., 2022; Mehmood et al., 2023); NARDL model (Rehman et al., 2023), and PMG-ARDL model (Wu et al., 2022; Wang et al., 2021), have received favor thanks to their advantages in dealing with non-stationary panel data. However, many studies ignore cross-sectional dependence (CSD), which can bring about unreliable and inefficient assessments (Banerjee et al., 2004). Besides, WCA (Kuşkaya and Bilgili, 2020; Abban et al., 2022; AlNemer et al., 2023) is gradually being introduced into the field of energy economics as a multiscale analysis tool. Considering the spatial effects, spatial econometric models, such as spatial autocorrelation (SAC) analysis (Li et al., 2024; Grodzicki and Jankiewicz, 2022; Zhu et al., 2022) and the spatial Durbin model (Liu et al., 2023a; Chen et al., 2022b) are commonly applied to portray interregional spatial effects. However, differences in the assumptions and treatments of data structure in different models may lead to inconsistencies in research conclusions. Table 1 summarizes some of the previous literature.
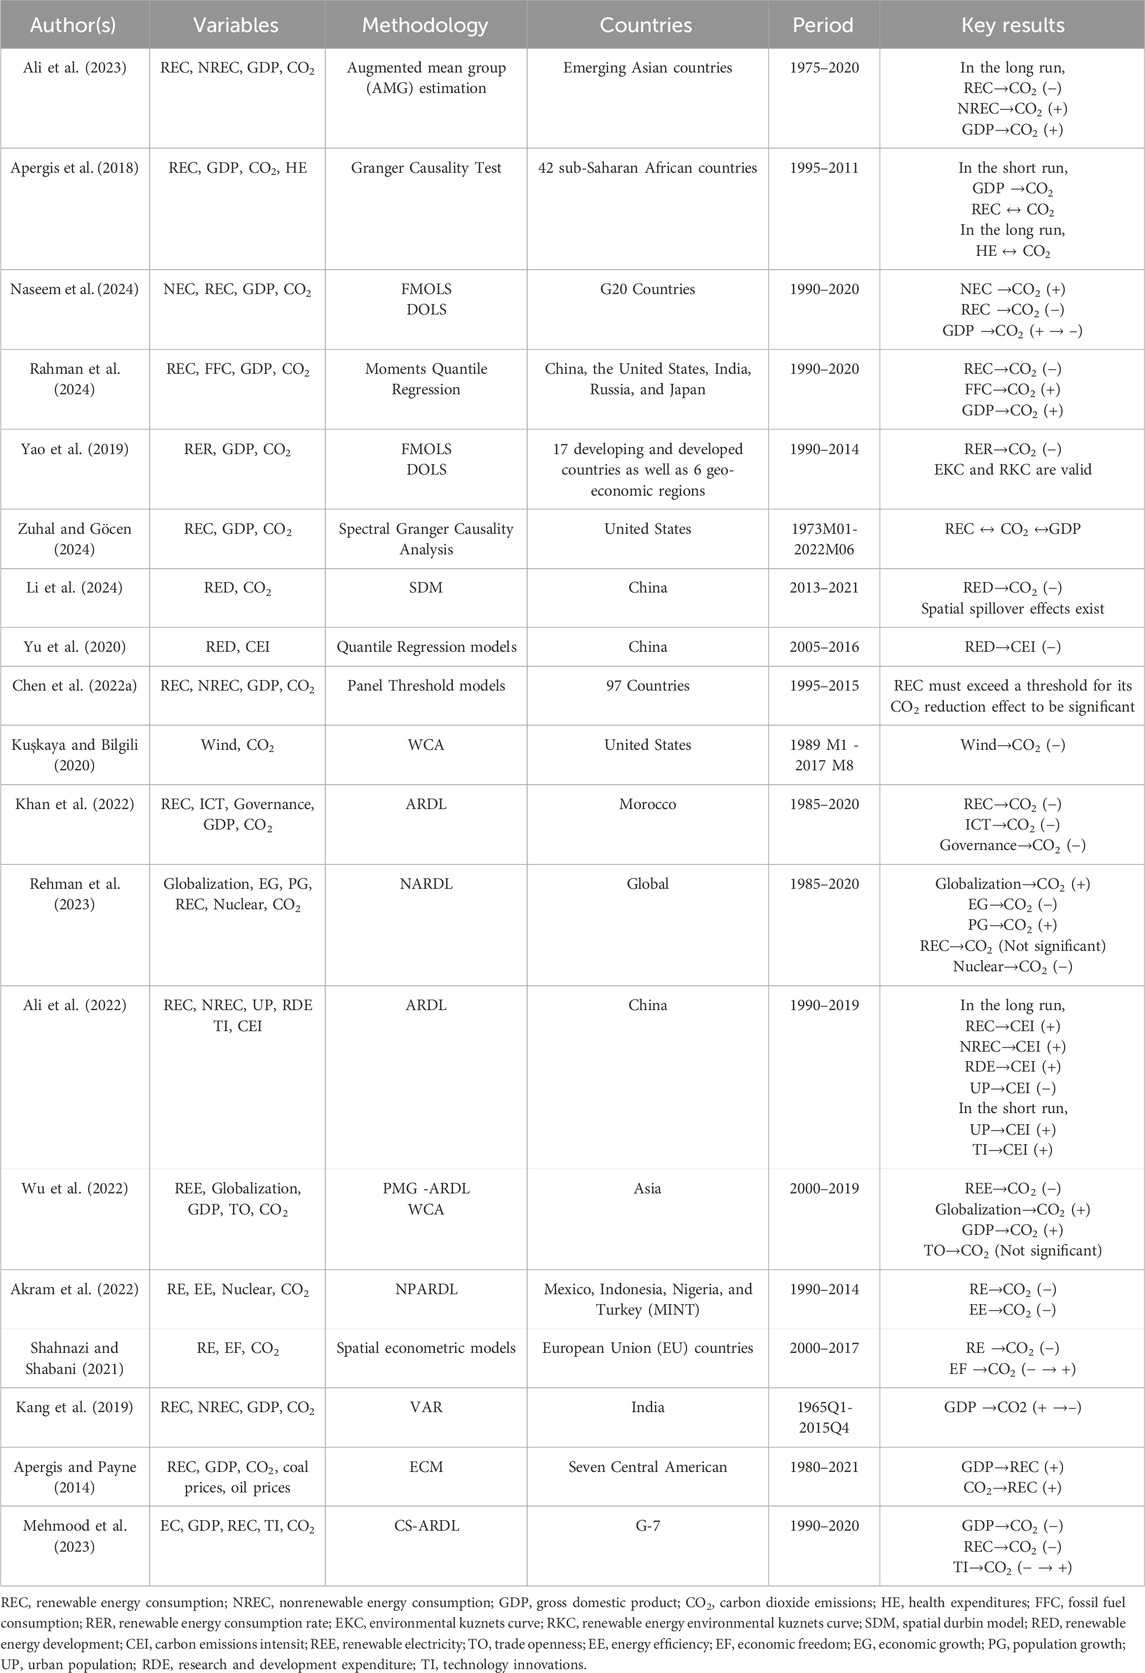
Table 1. Literature summary.
In summary, while existing research has been fruitful, there are some shortcomings in existing studies that need to be further improved. First, existing studies mostly start from the energy consumption side, and the analysis of the power generation side is relatively insufficient; Second, previous studies have primarily focused on the macro level (cross-country comparison or single-country analysis), neglecting the micro-level regional differences, especially for countries with significant differences in resource endowments and policy environments. In the case of China, for example, while RE has made breakthroughs, the spatial imbalance of RE is highlighted, and there are great differences in carbon emission reductions, which suggests that it is necessary to study the regional-level differences in depth. Third, although existing studies have attempted to use wavelet analysis to reveal the volatility of the relationship between the two, there is still a lack of wavelet analysis studies on the specific correlation between RE and CO2 in China. Finally, most of the previous studies have adopted a single methodology, mainly focusing on the dynamic relationship in the time dimension, while the spatio-temporal dynamic relationship between RE and CO2 has been insufficiently explored. Therefore, this study provides an in-depth analysis of China’s panel data by employing a multi-method combination of the PMG-ARDL model, WCA, and ESTDA to reveal the complex and dynamic spatiotemporal correlation between REP and CO2 emissions and to characterize regional heterogeneity.
3 Data and methods
3.1 Data
This paper adopts panel data for 30 provinces, autonomous regions, and municipalities in China (barring Hong Kong, Macao, Taiwan, and Tibet) for the period 1997–2021. The selection of periods and provinces for this study depends on the availability of data for the variables involved.
Following Yu et al. (2023), the share of renewable electricity generation in total electricity generation is used as a measure of REP. Considering the availability of data, renewable electricity is represented by hydropower, wind power, and solar power. Carbon emissions are measured by per capita CO2 emissions. In line with earlier literature, economic growth (Wang, 2022), energy consumption structure (ECS) (Xiao and Zhang, 2019), and industrial structure(IS) (Liu et al., 2023a) control variables are linked to CO2 emissions. Therefore, this study includes them as control variables in the regression analysis and expresses them as the gross domestic product per capita (PGDP) (1997 base period), the share of coal consumption in total energy consumption, and the ratio of tertiary sector output to GDP, respectively. Considering the effect of population size, per capita size indicators are used for CO2 emissions and economic growth. All indicators are treated as natural logarithms in this paper, and the descriptive statistics for the variables are tabulated in Table 2.
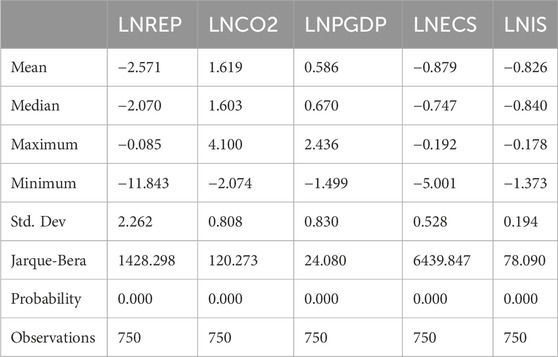
Table 2. Descriptive statistics.
The data for this study were derived chiefly from the China Statistical Yearbook (NBSC, 2022a), China Electric Power Yearbook (China Electricity Council, 2022), China Energy Statistical Yearbook (NBSC, 2022b), provincial statistical yearbooks, and Carbon Emission Accounting and Data Sets (CEADs, 2022). A few missing data were supplemented by linear interpolation.
3.2 Methodology
3.2.1 PMG-ARDL model
This study seeks to discuss the relationship between REP and CO2, to determine the relationship, the subsequent empirical model is considered while controlling for other explanatory variables (Equation 1):
Where
The long- and short-term dynamics between REP, PGDP, ESC, IS, and per capita CO2 emissions were investigated through the PMG-ARDL method developed by Pesaran and Yamagata (2008). This method is theoretically based on dynamic panel data theory, cointegration theory, and the ECM. The PMG-ARDL model integrates the ideas of the PMG estimator (Pesaran et al., 1999) in panel data analysis and the ARDL model (Pesaran et al., 2001) in time series analysis, which is a novel tool for panel analysis. The model comprehensively considers individual heterogeneity and the overall characteristics of panel data, and by introducing the lag term, it establishes a dynamic panel model that can effectively address the endogeneity problem. Several empirical studies (Wu et al., 2022; Wang et al., 2021) have employed PMG-ARDL to examine the energy-carbon nexus. A key point to consider is that the PMG-ARDL model presupposes that the order of integration of the variables cannot exceed the first order. However, considering the possibility of CSD in panel data, traditional unit root tests (URT) [LLC (Levin et al., 2002), IPS (Im et al., 2003)] may lead to biased results (Pesaran, 2006). Therefore, the CIPS test (Pesaran, 2007) is chosen for this study, which can effectively deal with the CSD problem and deliver more reliable test results. Meanwhile, to ensure the validity of the cointegration relationship between variables, we successively use the Pedroni cointegration test (CT) (Pedroni, 1999) (for individual heterogeneity) and the Westerlund ECM cointegration test (Westerlund, 2007) (more robust when CSD exists).
On the confirmation of cointegration between variables, the subsequent analysis can be carried out through the PMG-ARDL model. The model is as Equation 2:
In Equation 2,
The reparameterized model becomes a form of error correction that arranges the variables used in this study and can be constructed as follows Equation 3:
where,
In Equation 3,
To verify the reliability of the estimation results of the PMG-ARDL approach, FMOLS, and DOLS were applied for robustness testing following Dam et al. (2024).
3.2.2 WCA
The WCA method is based on wavelet transform theory. This method is derived from mathematics and has been studied in the field of energy economics, such as by Kuşkaya and Bilgili (2020), Abban et al. (2022), and AlNemer et al. (2023), who have applied the WCA to the United States, African oil-producing countries, and Saudi Arabia, respectively, to study the time-frequency relationship between RE and CO2. These studies provide a strong reference for this study. This paper uses the WCA developed by Goupillaud et al. (1984) in 1984 to capture the time-frequency dependence among the variables. The breakthrough of WCA is the multiscale decomposition of the time series data, thus mining the interaction between the two at different frequencies, as described in Equations 4–9.
The wavelets used in this study are from the Morlet wavelet series with the following equations:
Where
By varying the scale parameter
The continuous wavelet transform is the inner product operation of the original time series n(t) with wavelet functions of different scales and positions as follows:
A cross-wavelet transform is applied to the two-time series:
Where
Where C is the smoothing factor, indicating the time smoothing process.
Since
Where L and O represent the Hilbert transform’s imaginary and real part operators, respectively.
3.2.3 Spatial autocorrelation method
Exploratory spatial data analysis (ESDA) is a set of technical methods for exploring the characteristics of spatial data (Hou et al., 2022), the core of which is to delve into the distributional characteristics of spatial objects (Overmars et al., 2003), including global SAC and local SAC analysis (Sun et al., 2013). ESTDA (Rey et al., 2011) systematically analyzes temporal behavior based on ESDA, which compensates for the shortcomings of ESDA ephemeral measures. ESTDA is mainly based on spatial econometrics and the theory of spatial dynamic change, which can reveal the spatial dependence patterns of variables and their evolution paths. Already studies (Kao et al., 2023) have analyzed the characteristics of the spatial relationship between EC and CO2 using the ESDA method, and then Liu et al. (2023b) explored the spatio-temporal dynamics of CO2 and the role of influencing factors on CO2 based on ESTDA. Therefore, the application of ESTDA to the study of the spatial and temporal dynamics of REP and CO2 in this study is a justifiable extension.
SAC is usually quantified by calculating Moran’s I value. The range of Moran’s index is when the calculation result falls in the interval of (0,1], it indicates a positive autocorrelation and the positive correlation is enhanced with the increase of the value; when the calculation result falls in the interval of, the formula is as follows Equation 10:
Traditional univariate Moran’s I index primarily measures the SAC of a single variable. Anselin (1995) extended the traditional Moran’s I to a bivariate Moran’s I, enabling the exploration of spatial relationships between two variables and effectively capturing their spatial covariation. This study employs bivariate SA analysis to investigate the spatial response pattern between REP and per capita CO2 emissions. The formula is as Equations 11, 12:
In Equations 11, 12,
3.2.4 LISA time path
LISA time paths (Zhang et al., 2022) can describe the dynamic migration changes realized by LISA coordinates in Moran scatter plots in the time dimension, i.e., it can reveal the degree of stability of LISA coordinates over time, and the geometrical characteristics of the LISA time paths are expressed in terms of the relative lengths, and tortuosity, the formula is shown in Equations 13–14.
Where
3.2.5 LISA space-time transition
LISA space-time transition (Liu et al., 2023b) is used to reveal the changes of local spatial correlation types in Moran’s I scatterplot, combining local Markov transfer and spatio-temporal leaps to classify the leaps into four types, as shown in Table 3. Among them, “Type III” can be subdivided into two types according to whether the direction of its own and neighboring leaps are consistent or not (
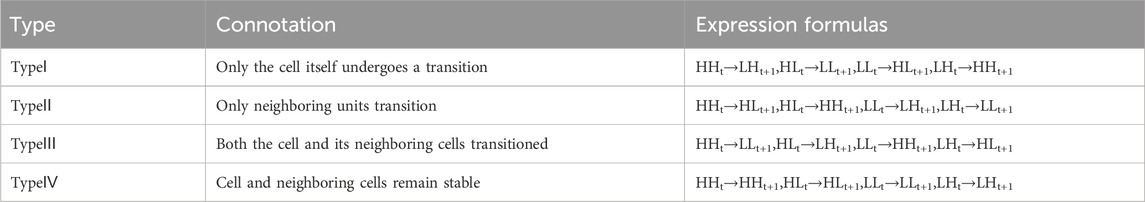
Table 3. Spatiotemporal transition type.
4 Results and discussion
4.1 PMG-ARDL model results
4.1.1 CSD tests results
To mitigate the potential estimation bias caused by neglecting CSD in existing studies, this paper examines the CSD in the panel data by using four methods, including the Breusch-Pagan LM test (Breusch and Pagan, 1980) and the Pesaran CD test. The results in Table 4 provide strong evidence of CSD in the sample data, as all tests reject the null hypothesis at the 1% significance level.
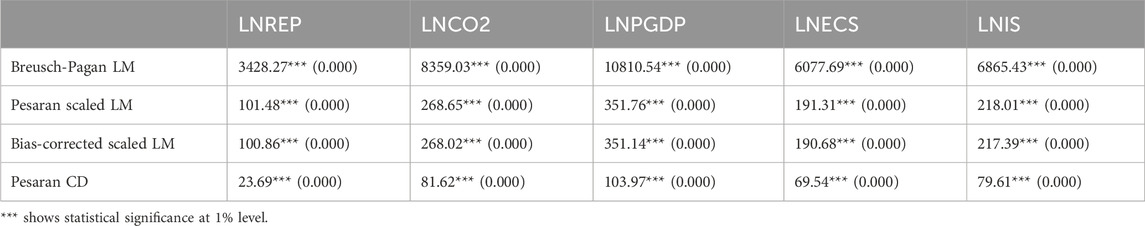
Table 4. CSD tests results.
4.1.2 CIPS unit root test results
Considering the potential impact of CSD on the results of the first-generation panel URT, this paper further employs Pesaran’s CIPS test to conduct more robust tests of stationarity while controlling for CSD, thereby providing a more accurate assessment of the integration properties of the variables. Table 5 provides strong evidence against the occurrence of a unit root at first differences for all variables. Regardless of whether the model contains a constant term or both a constant and trend term. Given that variables are smooth either at I (0) or I (1), there is no evidence of I (2) processes. Therefore, the PMG-ARDL model is appropriate for this paper.
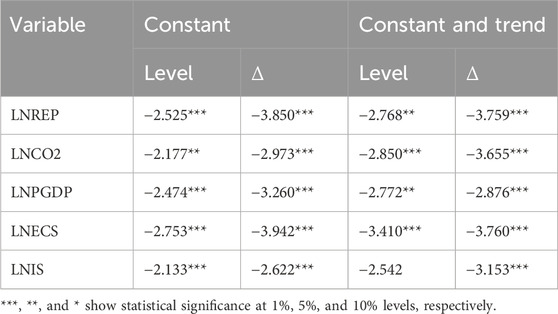
Table 5. CIPS unit root test results.
4.1.3 Cointegration test result
In this study, Pedroni and Westerlund CT were applied and the results are presented in Tables 5, 6. Four out of seven statistics in Table 6 and three out of four statistics in Table 7 reject the null hypothesis at the 1% significance level. Thus, the outcome provides evidence for a long-term association between the variables.
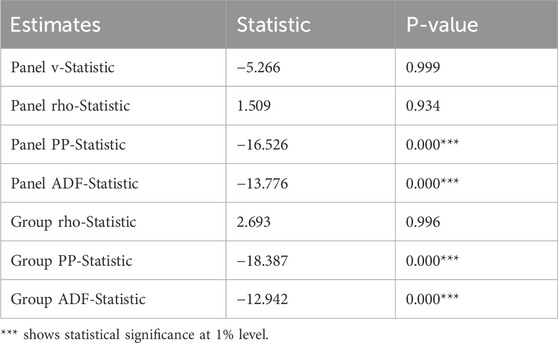
Table 6. Pedroni cointegration test result.
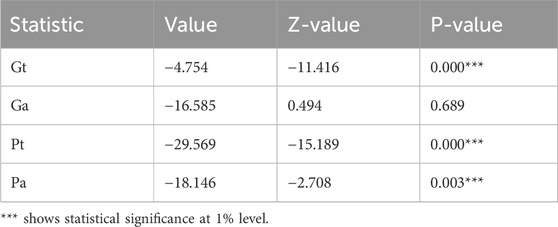
Table 7. Westerlund cointegration test result.
4.1.4 Regression results
Table 8 displays the PMG-ARDL model results, which demonstrate a robust negative correlation between REP and CO2 in both the long and short term. Specifically, every 1% increase in REP leads to a reduction in long-term and short-term per capita CO2 emissions by 0.05% and 0.26%, respectively. Consistent with the previous findings of Zheng et al. (2021), and Wang (2022), which highlights the suppressive effect of RE on CO2 emissions and emphasizes the importance of increasing the share of RE. A noteworthy finding is that the coefficient of influence of REP on per capita CO2 emissions in the results is low compared to other variables. Although RE is regarded as an important means of reducing CO2, its effectiveness is influenced by numerous factors, insufficient capacity of the power system and inefficient transmission are the main bottlenecks limiting the role of RE (Chen and Lei, 2018), and the development of RE has not yet led to a fundamental shift in the structure of power production, the resulting in its relatively limited impact on CO2 (Yu et al., 2020). To maximize the carbon reduction potential of RE, the policy level should focus on the construction of power grid infrastructure, accelerate the implementation of the strategy of building a smart grid, and synchronize the enhancement of the power system’s acceptance capacity and transmission efficiency.
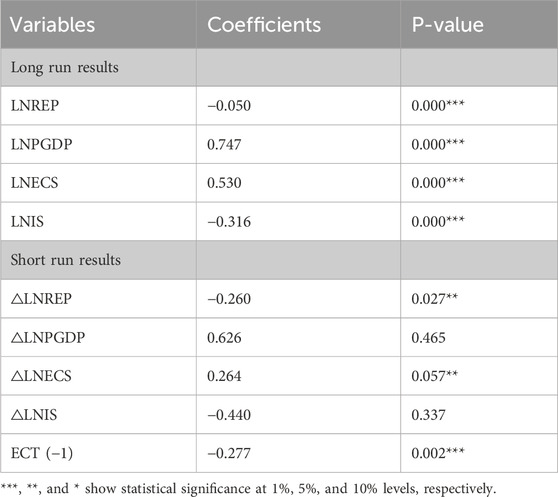
Table 8. PMG-ARDL estimation results.
According to the long-term estimation results, among other explanatory variables, PGDP and ECS exert a powerful positive influence on CO2, with an increase of 0.75% and 0.53% in CO2 for every 1% increase in both. This suggests that economic growth and the proportion of coal consumption impede progress toward carbon emission reduction goals in China in the long run. Numerous studies have corroborated this finding (Chen et al., 2019), economic growth is often accompanied by an increase in production activities, which will directly or indirectly increase CO2 emissions; coal combustion is the main source of CO2, and the higher the proportion of coal in the ECS, the more CO2 will be emitted. In contrast, the improvement of IS has a significant contribution to the reduction of per capita CO2 emissions, and every 1% increase in IS index will reduce CO2 by 0.32%. Similar findings are found in the literature by Zhao et al. (2022) and Yu et al. (2018). Industrial restructuring is a substantial initiative to promote low-carbon development by improving energy efficiency (Wang and Yang, 2024), which in turn mitigates CO2 emissions. Based on the above findings it is necessary to promote a society-wide low-carbon transition through market mechanisms and policy regulation. Green investment can be encouraged through tax incentives and green financial instruments to reduce the dependence of economic growth on high-carbon energy. Gradually reduce the share of coal in the ECS, promote coal consumption to reach the peak, and accelerate the formulation and implementation of a stricter plan for the orderly rollout of coal. Improve the decarbonization of the industrial structure, develop strategic emerging industries, encourage the development of green industries such as smart manufacturing and the digital economy, and implement stricter energy-efficiency standards for electricity, a high-energy-consuming and high-emission industry.
The PMG-ARDL model also provides results for short-term dynamics, and as expected the error correction term is significantly negative, confirming the presence of a long-run equilibrium relationship; in other words, shocks in the short run do not permanently change the path of the system, which will always ultimately return to the long-run equilibrium. The ECS has a similar short-term relationship to its long-run relationship, increasing per capita CO2 emissions, and the short-term relationships for the other control variables are less clear.
4.1.5 Robustness tests
This paper employs FMOLS and DOLS to examine the robustness of the estimation outcomes, the outcomes are tabulated in Table 9. The observations of FMOLS and DOLS are consistent with the results of the PMG-ARDL model.
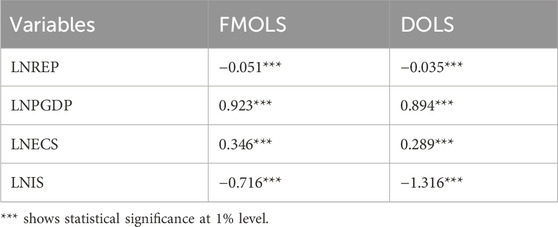
Table 9. FMOLS and DOLS robustness test results.
4.2 WCA results
The PMG-ARDL model neglects regional heterogeneity and fails to capture the time-frequency spatial dependence among variables. This study further employs WCA to explore the time-frequency local correlations across different regions and at various time intervals and frequencies. This method combines time-domain information and frequency-domain information to uncover information that traditional methods cannot capture, as highlighted by Kirikkaleli (2020). Figure 2 presents the results of the WCA, where the correlation between the two variables is shown by the color warm and cold, and the results outside of the conical white line (cone of influence) are unreliable.
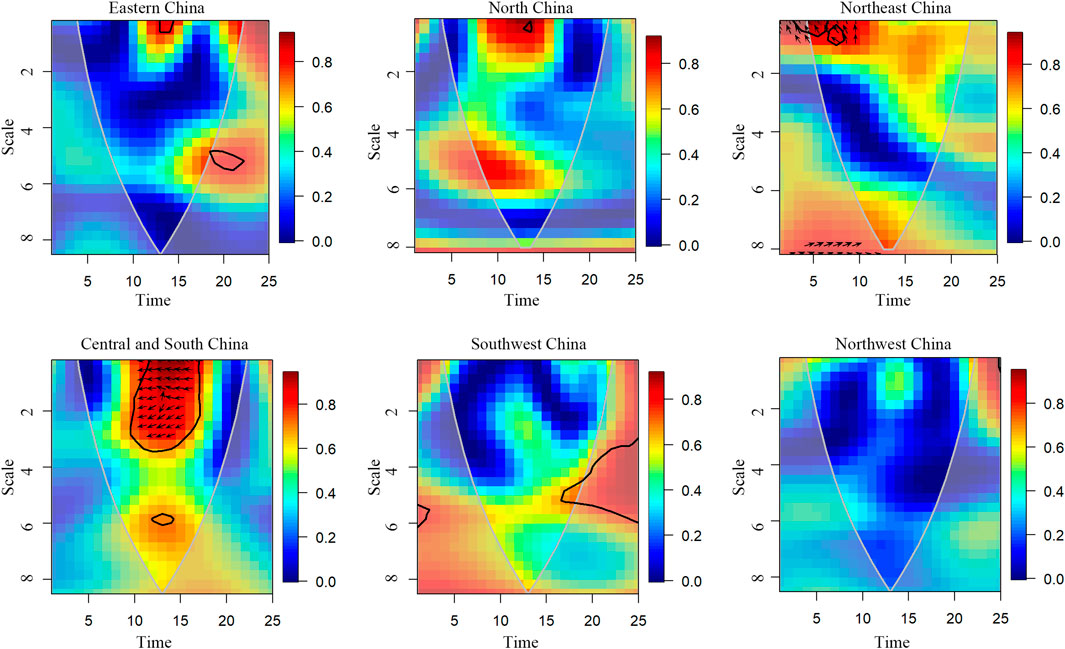
Figure 2. Wavelet coherence between REP and CO2 in different regions.
The WCA plot visually presents the correlation between the two variables. It is obvious that the coherence between regional REP and per capita CO2 emission is stronger in the entire heat map in Northeast China, Central and South China, and the weakest in Northwest China, and the other regions also show different degrees of coherence. Although the Northwest region is rich in resources, it has a weak industrial base and a relatively small demand for energy. At the same time, the Northwest region’s lagging economic development and the low elasticity of demand for energy in industrial production mean that the penetration of RE will have a limited ability to mitigate CO2. This phenomenon suggests that current energy policies should be further optimized to enhance the efficiency of renewable energy use in the Northwest region. During the study period, leftward arrows appeared within the significant regions of Northeast China and Central and South China, indicating a phase difference between REP and CO2 (CO2 lags behind REP). The wide variation in REP-CO2 correlations in different regions suggests that current energy policies are not working evenly across regions. Although no significant common movement is found in other regions in time and scale, it is interesting to note that except for Southwest and Northwest regions, all other regions have shown a strong correlation between REP and per capita CO2 emission on a 1–2 year scale, which is mainly attributed to the cyclical influence of government energy policies and the cyclical characteristics of RE project construction. Therefore, the government should establish a long-term stable renewable energy support policy to reduce market uncertainty caused by short-term adjustments and enhance market confidence, and at the same time, optimize the approval process of renewable energy projects and improve the efficiency of policy implementation1.
4.3 ESTDA results
The difference in wavelet coherence maps provides important clues for the study to explore the spatial correlation. Based on the correlation between REP and per capita CO2 emission in the time dimension revealed earlier, this study further adopts the ESTDA to explore the relationship between the two in the spatial dimension to reveal the strength and direction of the spatial correlation between different regions.
4.3.1 Bivariate global Moran’s I results
As Figure 3 illustrates, the global Moran’s I value of REP and per capita CO2 emission in 30 provinces cluster below the zero value and pass the 1% significance test, demonstrating that there is a negative spatial correlation between the two, i.e., the regions with high REP tend to be neighboring to the regions with low values of CO2, which corroborates with the results of the PMG-ARDL model.
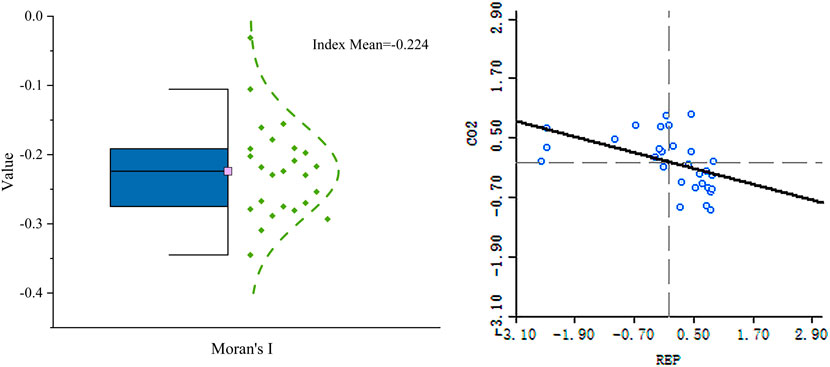
Figure 3. Bivariate global Moran’s I results.
4.3.2 Bivariate local SAC analysis
The bivariate LISA agglomeration map (Figure 4) reflects the clustering of the six-time points, and during the study period, the regions with significant correlations (5%) are mainly clustered in northern and southern, and the regions with negative correlations of L-H clustering and H-L clustering are widely distributed. The former spatial distribution is concentrated in the northern part of China, especially in Inner Mongolia, Liaoning Province, and Hebei Province. The latter are primarily situated in the southward regions such as Yunnan, Guizhou, and Hunan. This may be due to the strong industrial base in northern China and its high dependence on coal. Although wind power has been vigorously developed in recent years, the heavy historical burden has led to a relatively slow adjustment of the energy structure, and the pressure to reduce carbon emissions remains significant. In contrast, southern regions are rich in hydropower and solar resources, providing ample conditions for hydropower and photovoltaic power generation. Moreover, the construction of the southern power grid is relatively complete, which is conducive to the grid connection of renewable electricity, the combined effect has led to significant carbon reduction in these southern regions. This spatial difference reflects the unbalanced regional development in China and also provides important insights for regional synergistic emission reduction. In response to the above phenomenon of differentiation between the North and the South and its analysis, the government should implement differentiated low-carbon transformation policies, accelerate coal substitution, industrial upgrading and power grid construction and upgrading in the North, and optimize green power consumption and market-based trading in the south, to enhance the synergistic effect of the national carbon emission reduction.
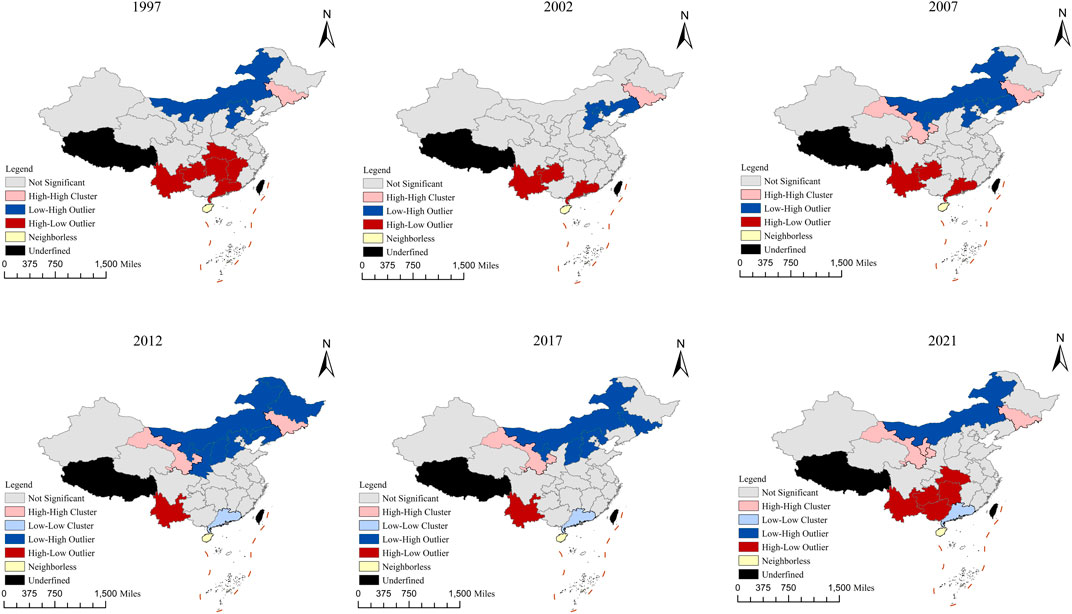
Figure 4. Bivariate LISA clustering diagram of REP and CO2.
Interestingly, even within the same region with similar renewable resource conditions, the carbon reduction effects of REP may exhibit different characteristics across provinces, suggesting that intra-regional spatial heterogeneity also deserves attention. Although both Yunnan and Sichuan are major hydropower provinces, Yunnan has performed more prominently in terms of RE emission reductions. The main reason may be that, the industry in Yunnan Province is dominated by tourism and services, which have relatively low fossil energy demands, thus facilitating the expansion of RE. In contrast, Sichuan, with a stronger industrial base and greater reliance on fossil fuels, has higher CO2 emissions. Additionally, Sichuan as an important power exporter in China, has long undertaken the task of transmitting power to the eastern region, and the priority of power transmission is higher, which to some extent squeezes the space for local consumption of clean energy, whereas Yunnan has less pressure on power transmission, the highest power self-sufficiency rate, with less pressure on carbon emission reduction. This phenomenon suggests that the energy consumption structure and industrial structure are important resistance to the pressure of emission reduction in high RE production regions. Differentiated policies should be formulated according to the regional characteristics. Sichuan Province should optimize the local energy consumption structure and increase the proportion of local clean energy consumption while ensuring the transmission of electricity, and Yunnan Province should further take advantage of its service and tourism industries to promote the development of low-carbon industries and consolidate its renewable energy emission reduction results.
4.3.3 Relative length and tortuosity analysis
The spatial distribution of LISA time path length and curvature is shown in Figure 5. Provinces with LISA time paths less than 1 accounted for 70% of the total in the study period, and the whole shows a relatively stable local spatial pattern. The spatial structure of Northeast and Eastern China is more stable, but the causes are different, as Northeast China found it difficult to get rid of the fossil-energy-dominated energy structure quickly resulting in slower changes; Eastern China is due to the relatively mature economy and energy structure, and there is less room for advancement, and therefore shows a stable structure. Therefore, Northeast China should accelerate the adjustment of energy structure and reduce the dependence on fossil energy, and East China should further improve the efficiency of renewable energy utilization through technological innovation. The LISA time path tortuosity is generally greater than 1, while 66.7% of the provinces are lower than the national average, suggesting that the direction of dependence between REP and CO2 local spatial patterns is stable. Regionally, Central and South China and southwestern China have more dynamic spatial variability processes, indicating that these regions have more complex and dynamic interactions between REP and CO2. For these regions with large spatial variations, regional energy coordination and policy guidance should be strengthened to promote the synergistic development of renewable energy and carbon emission reduction, to adapt to the dynamically evolving energy structure.
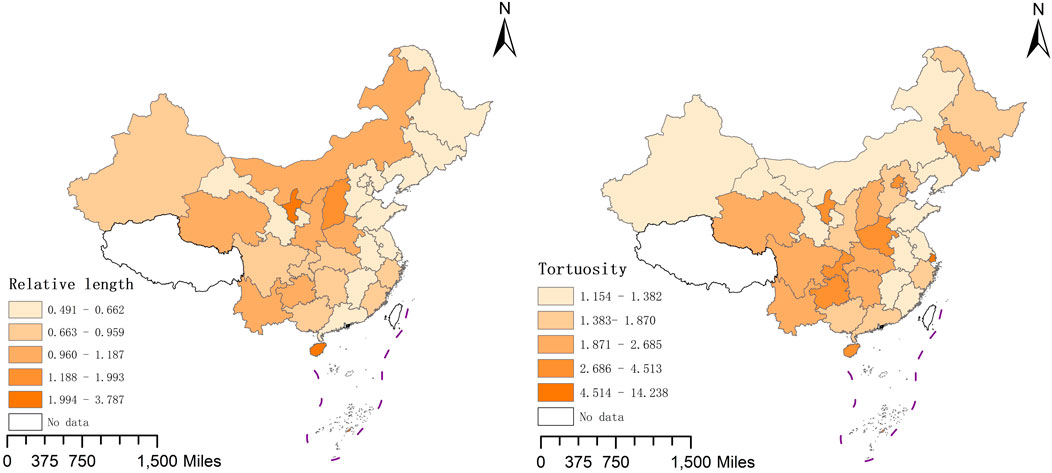
Figure 5. Spatial distribution of LISA time path length and curvature.
4.3.4 LISA spatiotemporal transition analysis
The local Moran’s I transfer probability matrix is shown in Table 10. Overall, the structure of local spatial association between REP and CO2 in China is relatively stable, and most of the provinces and regions have not been separated from their original clustering categories, and the probability of spatial and temporal mobility is significantly lower than the probability of spatial and temporal cohesion, presenting a certain degree of inertia in the transitions. The most prevalent type of transition is TypeⅣ (94.3%), indicating a strong path-locking characteristic, and the proportion of TypeⅠ, TypeⅡ, and TypeⅢ transition is only 3.5%, 2.2%, and 0.0%, respectively, which is a relatively small number of transition phenomena, suggesting that the reforms and changes in this area are more inclined to be adjusted gradually. Given this, policymaking should balance stability and breakthroughs, and while maintaining the continuity and stability of energy transition policies, it should increase reform efforts in key regions, break path dependency, and promote synergistic development of green energy among regions.
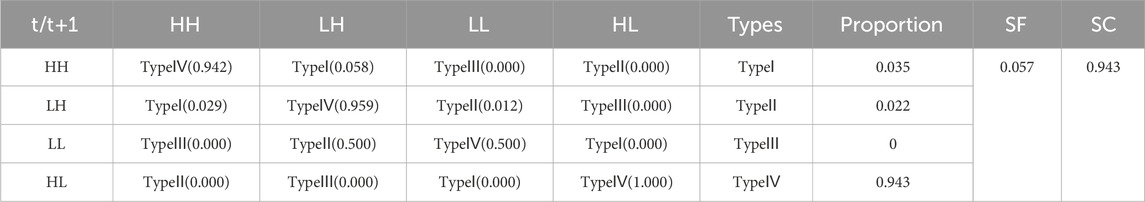
Table 10. The spatial and temporal transition matrix.
5 Conclusion and policy implications
In order to cope with the increasingly severe climate change, it is of strategic significance to delve into the spatio-temporal dynamic relationship between REP and CO2 emissions. In this study, the dynamic relationship between the two in the short and long term from 1997 to 2021 is simultaneously estimated using the PMG-ARDL methodology for 30 provinces in China. Furthermore, to reveal their heterogeneity in the time-frequency dimension, the WCA is introduced to compare the time evolution patterns in different regions. Finally, their spatial correlation is explored in the spatial dimension through ESTDA, to more comprehensively understand the complex spatio-temporal interactions between the two.
The empirical analysis leads to the following conclusions: The impact of REP on per capita CO2 emission is relatively weak in the study period, but this negative correlation exhibits consistent and stable characteristics in the time dimension, persisting across various time scales. The wavelet correlation analysis reveals significant spatiotemporal heterogeneity, with varying degrees of coherence between REP and CO2 across regions—except for Northwest China—primarily concentrated in the 1–2 year time-frequency interval. Spatially, REP and CO2 emission levels in neighboring regions exhibit a seesaw pattern, with L-H clusters dominating the north and H-L clusters prevalent in the south. The relative lengths of LISA time paths indicate strong spatiotemporal stability, while the Type IV and spatial-temporal cohesion probabilities exceed 0.9, suggesting that most provinces maintained stable spatial clustering without significant state transitions during the study period.
5.1 Policies implications
Undoubtedly, achieving low-carbon development is a challenging and complex process. Given the above findings, the following policies are recommended. First, the implementation of regionally differentiated low-carbon transition strategies. As there are significant differences in the energy structure and level of economic development of different regions, carbon emission reduction policies should avoid a “one-size-fits-all” approach. For example, in the northwestern region, in the short term, the focus could be on improving the transmission and local consumption of renewable energy. Through the carbon market linkage mechanism, the government can enable the eastern region to purchase green power from the northwest region through carbon trading, thus indirectly increasing the carbon emission reduction contribution of renewable energy. Northeast China should speed up energy structure adjustment, reduce dependence on fossil energy, and promote low-carbon upgrading of traditional industries. East China can improve the utilization efficiency of renewable energy through technological innovation and industrial upgrading.
Second, accelerate the process of energy electrification and optimize the stability of energy policies. Take the power system as the core of energy transformation, vigorously develop renewable energy generation, and gradually replace traditional fossil energy. Realize the fundamental transformation of energy production mode, needs long-term stable policy support, to enhance policy continuity, reduce the frequent adjustment of short-term energy policy, to ensure the predictability and feasibility of low-carbon transformation.
Third, improve the construction of energy infrastructure and vigorously develop the smart grid. Renewable energy is subject to regional and climatic conditions such as great restrictions, and can only rely on the form of power generation to achieve cross-regional transmission, so we must increase the renewable energy resources in areas rich in power grid investment and construction, to enhance renewable energy access capacity. At the same time in the face of growing renewable energy demand for a high proportion of grid, to enhance the resilience of the energy system, the smart grid is the realization of the energy system’s flexible, stable operation of the key, which can effectively coordinate the renewable energy power generation and traditional fossil energy power generation, improve the efficiency of energy use.
Fourth, optimize the regional synergy mechanism to break the path dependence of the energy structure. Policies should break the path of regional dependence, strengthen inter-regional power interconnection and sharing of energy resources, realize the complementary advantages of the region, and jointly meet the challenges of energy transition, by clarifying the regional differences and commonalities, to achieve the “integrated” development of energy, to better safeguard the sustainable development of the regional economic and social development. For example, the “West-East Power Transmission” project has been strengthened to transmit surplus renewable energy from the northwestern region to the eastern and central regions, where the energy demand is stronger, to reduce the phenomenon of abandoned wind and light, and to optimize the allocation of energy resources through cross-provincial cooperation, thereby enhancing the effectiveness of carbon emission reduction at the national level.
5.2 Limitations and future research
This research has some limitations. First, there are limitations in the data selection process due to the accessibility of statistical data, other types of RE such as geothermal energy and biomass energy are relatively under-considered, and future research should be based on data availability, should expand the scope of the data, and comprehensively examine the REP in China. Second, the study analyzes RE as a whole, and future studies can subdivide RE and analyze the relationship between different types of RE, such as wind power, solar power, and hydropower, and carbon emissions, to reveal the carbon reduction potential and characteristics of different types of RE. Finally, there may be other unconsidered factors in the wavelet analysis that correlate with the relationship between the two-time series. In the future, it is possible to consider conducting a more comprehensive quantitative analysis of the problem after removing the influence of other factors.
Data availability statement
Publicly available datasets were analyzed in this study. This data can be found here: The datasets used and/or analyzed during the current study are available from the corresponding author on reasonable request.
Author contributions
YY: Data curation, Formal Analysis, Methodology, Software, Visualization, Writing – original draft. WW: Conceptualization, Funding acquisition, Resources, Supervision, Writing – review and editing.
Funding
The author(s) declare that financial support was received for the research and/or publication of this article. This work was supported by the National Social Science Fund of China (Grant No. 23AGL033).
Conflict of interest
The authors declare that the research was conducted in the absence of any commercial or financial relationships that could be construed as a potential conflict of interest.
Generative AI statement
The author(s) declare that no Generative AI was used in the creation of this manuscript.
Publisher’s note
All claims expressed in this article are solely those of the authors and do not necessarily represent those of their affiliated organizations, or those of the publisher, the editors and the reviewers. Any product that may be evaluated in this article, or claim that may be made by its manufacturer, is not guaranteed or endorsed by the publisher.
Footnotes
1Eastern China: Shanghai, Jiangsu, Zhejiang, Anhui, Fujian, Jiangxi, Shandong; North China: Beijing, Tianjin, Hebei, Shanxi; Northeast China: Liaoning, Jilin, Heilongjiang, Inner Mongolia; Central and South China: Henan, Hubei, Hunan, Guangdong, Guangxi, Hainan; Southwest China: Sichuan, Guizhou, Yunnan, Chongqing; Northwest China: Shaanxi, Gansu, Qinghai, Ningxia, Xinjiang.
References
Abban, O. J., Hongxing, Y., Nuta, A. C., Dankyi, A. B., Ofori, C., and Cobbinah, J. (2022). Renewable energy, economic growth, and CO2 emissions contained Co-movement in African oil-producing countries: a wavelet based analysis. Energy Strategy Rev. 44, 100977. doi:10.1016/j.esr.2022.100977
Akram, R., Umar, M., Xiaoli, G., and Chen, F. (2022). Dynamic linkages between energy efficiency, renewable energy along with economic growth and carbon emission. A case of MINT countries an asymmetric analysis. Energy Rep. 8, 2119–2130. doi:10.1016/j.egyr.2022.01.153
Ali, A., Radulescu, M., and Balsalobre-Lorente, D. (2023). A dynamic relationship between renewable energy consumption, nonrenewable energy consumption, economic growth, and carbon dioxide emissions: evidence from Asian emerging economies. Energy and Environ. 34 (8), 3529–3552. doi:10.1177/0958305x231151684
Ali, U., Guo, Q., Kartal, M. T., Nurgazina, Z., Khan, Z. A., and Sharif, A. (2022). The impact of renewable and non-renewable energy consumption on carbon emission intensity in China: fresh evidence from novel dynamic ARDL simulations. J. Environ. Manag. 320, 115782. doi:10.1016/j.jenvman.2022.115782
AlNemer, H. A., Hkiri, B., and Tissaoui, K. (2023). Dynamic impact of renewable and non-renewable energy consumption on CO2 emission and economic growth in Saudi Arabia: fresh evidence from wavelet coherence analysis. Renew. Energy 209, 340–356. doi:10.1016/j.renene.2023.03.084
Anselin, L. (1995). Local indicators of spatial association—LISA. Geogr. Anal. 27 (2), 93–115. doi:10.1111/j.1538-4632.1995.tb00338.x
Apergis, N., Jebli, M. B., and Youssef, S. B. (2018). Does renewable energy consumption and health expenditures decrease carbon dioxide emissions? Evidence for sub-Saharan Africa countries. Renew. energy 127, 1011–1016. doi:10.1016/j.renene.2018.05.043
Apergis, N., and Payne, J. E. (2014). Renewable energy, output, CO2 emissions, and fossil fuel prices in Central America: evidence from a nonlinear panel smooth transition vector error correction model. Energy Econ. 42, 226–232. doi:10.1016/j.eneco.2014.01.003
Arain, H., Sharif, A., Akbar, B., and Younis, M. Y. (2020). Dynamic connection between inward foreign direct investment, renewable energy, economic growth and carbon emission in China: evidence from partial and multiple wavelet coherence. Environ. Sci. Pollut. Res. 27, 40456–40474. doi:10.1007/s11356-020-08836-8
Banerjee, A., Marcellino, M., and Osbat, C. (2004). Some cautions on the use of panel methods for integrated series of macroeconomic data. Econ. J. 7 (2), 322–340. doi:10.1111/j.1368-423x.2004.00133.x
Bilgili, F., Lorente, D. B., Kuşkaya, S., Ünlü, F., Gençoğlu, P., and Rosha, P. (2021). The role of hydropower energy in the level of CO2 emissions: an application of continuous wavelet transform. Renew. Energy 178, 283–294. doi:10.1016/j.renene.2021.06.015
Bilgili, F., Öztürk, İ., Koçak, E., Bulut, Ü., Pamuk, Y., Muğaloğlu, E., et al. (2016). The influence of biomass energy consumption on CO 2 emissions: a wavelet coherence approach. Environ. Sci. Pollut. Res. 23, 19043–19061. doi:10.1007/s11356-016-7094-2
Breusch, T. S., and Pagan, A. R. (1980). The Lagrange multiplier test and its applications to model specification in econometrics. Rev. Econ. Stud. 47 (1), 239–253. doi:10.2307/2297111
Cai, Y., Sam, C. Y., and Chang, T. (2018). Nexus between clean energy consumption, economic growth and CO2 emissions. J. Clean. Prod. 182, 1001–1011. doi:10.1016/j.jclepro.2018.02.035
CEADs (2022). Carbon emission accounts and datasets for emerging economics. Available online at: https://www.ceads.net/. (Accessed 15 June 2024).
Chen, C., Pinar, M., and Stengos, T. (2022a). Renewable energy and CO2 emissions: new evidence with the panel threshold model. Renew. Energy 194, 117–128. doi:10.1016/j.renene.2022.05.095
Chen, W., and Lei, Y. (2018). The impacts of renewable energy and technological innovation on environment-energy-growth nexus: new evidence from a panel quantile regression. Renew. energy 123, 1–14. doi:10.1016/j.renene.2018.02.026
Chen, Y., Shao, S., Fan, M., Tian, Z., and Yang, L. (2022b). One man's loss is another's gain: does clean energy development reduce CO2 emissions in China? Evidence based on the spatial Durbin model. Energy Econ. 107, 105852. doi:10.1016/j.eneco.2022.105852
Chen, Y., Wang, Z., and Zhong, Z. (2019). CO2 emissions, economic growth, renewable and non-renewable energy production and foreign trade in China. Renew. energy 131, 208–216. doi:10.1016/j.renene.2018.07.047
Dam, M. M., Kaya, F., and Bekun, F. V. (2024). How does technological innovation affect the ecological footprint? Evidence from E-7 countries in the background of the SDGs. J. Clean. Prod. 443, 141020. doi:10.1016/j.jclepro.2024.141020
Dimitriadis, D., Katrakilidis, C., and Karakotsios, A. (2021). Investigating the dynamic linkages among carbon dioxide emissions, economic growth, and renewable and non-renewable energy consumption: evidence from developing countries. Environ. Sci. Pollut. Res. 28, 40917–40928. doi:10.1007/s11356-021-13613-2
Gielen, D., Boshell, F., Saygin, D., Bazilian, M. D., Wagner, N., and Gorini, R. (2019). The role of renewable energy in the global energy transformation. Energy strategy Rev. 24, 38–50. doi:10.1016/j.esr.2019.01.006
Goupillaud, P., Grossmann, A., and Morlet, J. (1984). Cycle-octave and related transforms in seismic signal analysis. Geoexploration 23 (1), 85–102. doi:10.1016/0016-7142(84)90025-5
Grodzicki, T., and Jankiewicz, M. (2022). The impact of renewable energy and urbanization on CO2 emissions in Europe-Spatio-temporal approach. Environ. Dev. 44, 100755. doi:10.1016/j.envdev.2022.100755
Gwani, A. A., and Sek, S. K. (2023). Dynamic modelling of renewable energy consumption and production on African economic growth and the environment using vector error correction models. Matematika, 15–31. doi:10.11113/matematika.v39.n1.1447
Hou, M., Deng, Y., and Yao, S. (2022). Coordinated relationship between urbanization and grain production in China: degree measurement, spatial differentiation and its factors detection. J. Clean. Prod. 331, 129957. doi:10.1016/j.jclepro.2021.129957
Im, K. S., Pesaran, M. H., and Shin, Y. (2003). Testing for unit roots in heterogeneous panels. J. Econ. 115 (1), 53–74. doi:10.1016/s0304-4076(03)00092-7
Inglesi-Lotz, R., and Dogan, E. (2018). The role of renewable versus non-renewable energy to the level of CO2 emissions a panel analysis of sub-Saharan Africa’s big 10 electricity generators. Renew. energy 123, 36–43. doi:10.1016/j.renene.2018.02.041
Kang, S. H., Islam, F., and Tiwari, A. K. (2019). The dynamic relationships among CO2 emissions, renewable and non-renewable energy sources, and economic growth in India: evidence from time-varying Bayesian VAR model. Struct. Change Econ. Dyn. 50, 90–101. doi:10.1016/j.strueco.2019.05.006
Kao, X., Wang, W., Zhu, X., and Zhang, J. (2023). Spatial and temporal characteristics of coal consumption and carbon emissions in China. Environ. Sci. Pollut. Res. 30 (48), 105770–105780. doi:10.1007/s11356-023-29774-1
Kartal, M. T., Pata, U. K., Depren, Ö., and Erdogan, S. (2023). Effectiveness of nuclear and renewable electricity generation on CO2 emissions: daily-based analysis for the major nuclear power generating countries. J. Clean. Prod. 426, 139121. doi:10.1016/j.jclepro.2023.139121
Khan, Y., Oubaih, H., and Elgourrami, F. Z. (2022). The effect of renewable energy sources on carbon dioxide emissions: evaluating the role of governance, and ICT in Morocco. Renew. energy 190, 752–763. doi:10.1016/j.renene.2022.03.140
khoshnevis Yazdi, S., and Shakouri, B. (2018). The renewable energy, CO2 emissions, and economic growth: VAR model. Energy Sources, Part B Econ. Plan. Policy 13 (1), 53–59. doi:10.1080/15567249.2017.1403499
Kirikkaleli, D. (2020). The effect of domestic and foreign risks on an emerging stock market: a time series analysis. North Am. J. Econ. Finance 51, 100876. doi:10.1016/j.najef.2018.11.005
Kuşkaya, S., and Bilgili, F. (2020). The wind energy-greenhouse gas nexus: the wavelet-partial wavelet coherence model approach. J. Clean. Prod. 245, 118872. doi:10.1016/j.jclepro.2019.118872
Levin, A., Lin, C. F., and Chu, C. S. J. (2002). Unit root tests in panel data: asymptotic and finite-sample properties. J. Econ. 108 (1), 1–24. doi:10.1016/s0304-4076(01)00098-7
Li, C., Yang, X., and Wang, L. (2024). The impact of renewable energy development on regional carbon emission reduction: based on the spatio-temporal analysis of 30 provinces in China. Environ. Manag. 74, 439–460. doi:10.1007/s00267-024-01995-1
Liu, X., Jin, X., Luo, X., and Zhou, Y. (2023b). Quantifying the spatiotemporal dynamics and impact factors of China's county-level carbon emissions using ESTDA and spatial econometric models. J. Clean. Prod. 410, 137203. doi:10.1016/j.jclepro.2023.137203
Liu, X., Niu, Q., Dong, S., and Zhong, S. (2023a). How does renewable energy consumption affect carbon emission intensity? Temporal-spatial impact analysis in China. Energy 284, 128690. doi:10.1016/j.energy.2023.128690
Mehmood, U., Tariq, S., Haq, Z. U., Nawaz, H., Ali, S., Murshed, M., et al. (2023). Evaluating the role of renewable energy and technology innovations in lowering CO2 emission: a wavelet coherence approach. Environ. Sci. Pollut. Res. 30 (15), 44914–44927. doi:10.1007/s11356-023-25379-w
Naseem, S., Hu, X., Sarfraz, M., and Mohsin, M. (2024). Strategic assessment of energy resources, economic growth, and CO2 emissions in G-20 countries for a sustainable future. Energy Strategy Rev. 52, 101301. doi:10.1016/j.esr.2024.101301
NBSC (National Bureau of Statistics of China) (2022a). 1998-2022. China energy statistical yearbook. Beijing: China Statistical Press.
NBSC (National Bureau of Statistics of China) (2022b). 1998-2022. China statistical yearbook. Beijing: China Statistical Press.
Overmars, K. D., De Koning, G. H. J., and Veldkamp, A. (2003). Spatial autocorrelation in multi-scale land use models. Ecol. Model. 164 (2-3), 257–270. doi:10.1016/s0304-3800(03)00070-x
Pal, D., and Mitra, S. K. (2017). Time-frequency contained co-movement of crude oil and world food prices: a wavelet-based analysis. Energy Econ. 62, 230–239. doi:10.1016/j.eneco.2016.12.020
Pata, U. K. (2018). Renewable energy consumption, urbanization, financial development, income and CO2 emissions in Turkey: testing EKC hypothesis with structural breaks. J. Clean. Prod. 187, 770–779. doi:10.1016/j.jclepro.2018.03.236
Pedroni, P. (1999). Critical values for cointegration tests in heterogeneous panels with multiple regressors. Oxf. Bull. Econ. statistics 61 (S1), 653–670. doi:10.1111/1468-0084.0610s1653
Pesaran, M. H. (2006). Estimation and inference in large heterogeneous panels with a multifactor error structure. Econometrica 74 (4), 967–1012. doi:10.1111/j.1468-0262.2006.00692.x
Pesaran, M. H. (2007). A simple panel unit root test in the presence of cross-section dependence. J. Appl. Econ. 22 (2), 265–312. doi:10.1002/jae.951
Pesaran, M. H., Shin, Y., and Smith, R. J. (2001). Bounds testing approaches to the analysis of level relationships. J. Appl. Econ. 16 (3), 289–326. doi:10.1002/jae.616
Pesaran, M. H., Shin, Y., and Smith, R. P. (1999). Pooled mean group estimation of dynamic heterogeneous panels. J. Am. Stat. Assoc. 94 (446), 621–634. doi:10.2307/2670182
Pesaran, M. H., and Yamagata, T. (2008). Testing slope homogeneity in large panels. J. Econom. 142 (1), 50–93. doi:10.1016/j.jeconom.2007.05.010
Phadkantha, R., and Tansuchat, R. (2023). Dynamic impacts of energy efficiency, economic growth, and renewable energy consumption on carbon emissions: evidence from Markov Switching model. Energy Rep. 9, 332–336. doi:10.1016/j.egyr.2023.10.013
Qudrat-Ullah, H., and Nevo, C. M. (2022). Analysis of the dynamic relationships among renewable energy consumption, economic growth, financial development, and carbon dioxide emission in five Sub-Saharan African countries. Energies 15 (16), 5953. doi:10.3390/en15165953
Rahman, A., Murad, S. W., Mohsin, A. K. M., and Wang, X. (2024). Does renewable energy proactively contribute to mitigating carbon emissions in major fossil fuels consuming countries? J. Clean. Prod. 452, 142113. doi:10.1016/j.jclepro.2024.142113
Rehman, A., Alam, M. M., Ozturk, I., Alvarado, R., Murshed, M., Işık, C., et al. (2023). Globalization and renewable energy use: how are they contributing to upsurge the CO2 emissions? A global perspective. Environ. Sci. Pollut. Res. 30 (4), 9699–9712. doi:10.1007/s11356-022-22775-6
Rey, S. J., Murray, A. T., and Anselin, L. (2011). Visualizing regional income distribution dynamics. Lett. Spatial Resour. Sci. 4, 81–90. doi:10.1007/s12076-010-0048-2
Saidi, K., and Omri, A. (2020). The impact of renewable energy on carbon emissions and economic growth in 15 major renewable energy-consuming countries. Environ. Res. 186, 109567. doi:10.1016/j.envres.2020.109567
Sebri, M., and Ben-Salha, O. (2014). On the causal dynamics between economic growth, renewable energy consumption, CO2 emissions and trade openness: fresh evidence from BRICS countries. Renew. Sustain. Energy Rev. 39, 14–23. doi:10.1016/j.rser.2014.07.033
Shahnazi, R., and Shabani, Z. D. (2021). The effects of renewable energy, spatial spillover of CO2 emissions and economic freedom on CO2 emissions in the EU. Renew. Energy 169, 293–307. doi:10.1016/j.renene.2021.01.016
Shao, Q., Wang, X., Zhou, Q., and Balogh, L. (2019). Pollution haven hypothesis revisited: a comparison of the BRICS and MINT countries based on VECM approach. J. Clean. Prod. 227, 724–738. doi:10.1016/j.jclepro.2019.04.206
Sharif, A., Raza, S. A., Ozturk, I., and Afshan, S. (2019). The dynamic relationship of renewable and nonrenewable energy consumption with carbon emission: a global study with the application of heterogeneous panel estimations. Renew. energy 133, 685–691. doi:10.1016/j.renene.2018.10.052
Sheraz, M., Deyi, X., Sinha, A., Mumtaz, M. Z., and Fatima, N. (2022). The dynamic nexus among financial development, renewable energy and carbon emissions: moderating roles of globalization and institutional quality across BRI countries. J. Clean. Prod. 343, 130995. doi:10.1016/j.jclepro.2022.130995
Sun, C. Z., Chen, S., and Zhao, L. S. (2013). Spatial correlation pattern analysis of water footprint intensity based on ESDA model at provincial scale in China. J. Nat. Resour. 28 (4), 571–582.
Torrence, C., and Compo, G. P. (1998). A practical guide to wavelet analysis. Bull. Am. Meteorological Soc. 79 (1), 61–78. doi:10.1175/1520-0477(1998)079<0061:apgtwa>2.0.co;2
Twumasi, Y. (2017). Relationship between CO2 emissions and renewable energy production in the United States of America. Archives Curr. Res. Int. 7 (1), 1–12. doi:10.9734/acri/2017/30483
Wang, J., Zhang, S., and Zhang, Q. (2021). The relationship of renewable energy consumption to financial development and economic growth in China. Renew. Energy 170, 897–904. doi:10.1016/j.renene.2021.02.038
Wang, L. (2022). Research on the dynamic relationship between China's renewable energy consumption and carbon emissions based on ARDL model. Resour. Policy 77, 102764. doi:10.1016/j.resourpol.2022.102764
Wang, W., and Yang, Y. (2024). Spatial-temporal differentiation characteristics and driving factors of China's energy eco-efficiency based on geographical detector model. J. Clean. Prod. 434, 140153. doi:10.1016/j.jclepro.2023.140153
Westerlund, J. (2007). Testing for error correction in panel data. Oxf. Bull. Econ. statistics 69 (6), 709–748. doi:10.1111/j.1468-0084.2007.00477.x
Wu, J., Abban, O. J., Boadi, A. D., Addae, E. A., Akhtar, M., Hongxing, Y., et al. (2022). Time–frequency contained co-movement of renewable electricity production, globalization, and CO2 emissions: a wavelet-based analysis in Asia. Energy Rep. 8, 15189–15205. doi:10.1016/j.egyr.2022.11.054
Xiao, D., and Zhang, Y. (2019). Statistical test of the impact of renewable energy consumption on carbon dioxide emissions. Stat. Decis. 35 (10), 87–90. doi:10.13546/j.cnki.tjyjc.2019.10.020
Yao, S., Zhang, S., and Zhang, X. (2019). Renewable energy, carbon emission and economic growth: a revised environmental Kuznets Curve perspective. J. Clean. Prod. 235, 1338–1352. doi:10.1016/j.jclepro.2019.07.069
Yu, B., Fang, D., Xiao, K., and Pan, Y. (2023). Drivers of renewable energy penetration and its role in power sector's deep decarbonization towards carbon peak. Renew. Sustain. Energy Rev. 178, 113247. doi:10.1016/j.rser.2023.113247
Yu, B., Fang, D., Yu, H., and Zhao, C. (2021). Temporal-spatial determinants of renewable energy penetration in electricity production: evidence from EU countries. Renew. Energy 180, 438–451. doi:10.1016/j.renene.2021.08.079
Yu, S., Hu, X., Li, L., and Chen, H. (2020). Does the development of renewable energy promote carbon reduction? Evidence from Chinese provinces. J. Environ. Manag. 268, 110634. doi:10.1016/j.jenvman.2020.110634
Yu, Y., Deng, Y. R., and Chen, F. F. (2018). Impact of population aging and industrial structure on CO2 emissions and emissions trend prediction in China. Atmos. Pollut. Res. 9 (3), 446–454. doi:10.1016/j.apr.2017.11.008
Yue, S., Yang, Y., and Pu, Z. (2017). Total-factor ecology efficiency of regions in China. Ecol. Indic. 73, 284–292. doi:10.1016/j.ecolind.2016.09.047
Yurtkuran, S. (2021). The effect of agriculture, renewable energy production, and globalization on CO2 emissions in Turkey: a bootstrap ARDL approach. Renew. Energy 171, 1236–1245. doi:10.1016/j.renene.2021.03.009
Zhang, Z., Shi, K., Tang, L., Su, K., Zhu, Z., and Yang, Q. (2022). Exploring the spatiotemporal evolution and coordination of agricultural green efficiency and food security in China using ESTDA and CCD models. J. Clean. Prod. 374, 133967. doi:10.1016/j.jclepro.2022.133967
Zhao, J., Jiang, Q., Dong, X., Dong, K., and Jiang, H. (2022). How does industrial structure adjustment reduce CO2 emissions? Spatial and mediation effects analysis for China. Energy Econ. 105, 105704. doi:10.1016/j.eneco.2021.105704
Zhao, X., Shang, Y., and Song, M. (2020). Industrial structure distortion and urban ecological efficiency from the perspective of green entrepreneurial ecosystems. Socio-Economic Plan. Sci. 72, 100757. doi:10.1016/j.seps.2019.100757
Zheng, H., Song, M., and Shen, Z. (2021). The evolution of renewable energy and its impact on carbon reduction in China. Energy 237, 121639. doi:10.1016/j.energy.2021.121639
Zhu, Y., Taylor, D., and Wang, Z. (2022). The role of renewable energy in reducing residential fossil energy-related CO2 emissions: evidence from rural China. J. Clean. Prod. 366, 132891. doi:10.1016/j.jclepro.2022.132891
Keywords: renewable energy penetration, CO2 emissions, spatio-temporal dynamic relationship, PMG-ARDL, WCA, ESTDA
Citation: Yang Y and Wang W (2025) Spatio-temporal dynamic relationship of renewable energy penetration and CO2 emissions in China: new evidence from PMG-ARDL model and ESTDA. Front. Environ. Sci. 13:1538630. doi: 10.3389/fenvs.2025.1538630
Received: 03 December 2024; Accepted: 07 April 2025;
Published: 28 April 2025.
Edited by:
Guoxiang Li, Nanjing Normal University, ChinaReviewed by:
José Ramón Cardona, University of the Balearic Islands, SpainCüneyt Dumrul, Erciyes University, Türkiye
Copyright © 2025 Yang and Wang. This is an open-access article distributed under the terms of the Creative Commons Attribution License (CC BY). The use, distribution or reproduction in other forums is permitted, provided the original author(s) and the copyright owner(s) are credited and that the original publication in this journal is cited, in accordance with accepted academic practice. No use, distribution or reproduction is permitted which does not comply with these terms.
*Correspondence: Wensheng Wang, d3dzQGN1bXRiLmVkdS5jbg==