 Ran Peng
 Keyuan Ding
 Xueliang Liu2,3
 Wei Zhang
- 1School of Transportation and Logistics Engineering, Wuhan University of Technology, Wuhan, China
- 2School of Civil Engineering and Architecture, Wuhan Institute of Technology, Wuhan, China
- 3Hubei Provincial Engineering Research Center for Green Civil Engineering Materials and Structures, Wuhan, China
Introduction: The transition to carbon-centric urban policies requires innovative strategies to reduce transportation-related emissions. One such strategy is to shift travelers from high-carbon to low-carbon modes of transportation, a potential that has not been thoroughly quantified in urban planning frameworks.
Methods: This study introduces the concept of urban transportation carbon reduction potential, defined as the share of travelers who could feasibly switch to low-carbon modes under optimized public transit conditions. A dynamic evaluation model was developed, integrating key factors such as connection, detour, and transfer barriers that influence residents’ public transit adoption. The model was applied to cross-river travel in Wuhan, China, using 10,327 Origin-Destination (OD) survey data points collected between 2023 and 2024. Multiple optimization scenarios were simulated to assess responses to transit improvements.
Results: The analysis revealed three distinct zones of carbon reduction potential: stable, unlocking, and re-stable. Particularly, the unlocking zone exhibited substantial carbon reduction effects when targeted public transit improvements were implemented. Key thresholds were identified where small enhancements in transit connectivity led to sharp increases in low-carbon travel adoption.
Discussion: This study presents a novel optimization model for urban transit planning, which explicitly incorporates natural environmental constraints and provides quantitative decision support for achieving SDG11 targets on sustainable cities and communities. It offers valuable insights for cities within the Yangtze River Economic Belt, aiding strategic investment in public transit to enhance low-carbon mobility.
Introduction
The growing urgency of climate change has accelerated global efforts to adopt low-carbon strategies. The transportation sector accounts for 21% of global carbon dioxide emissions (Tiseo, 2025) and is projected to comprise 41% of global fuel-based emissions by 2030 (World Energy Outlook, 2022 – Analysis, 2022). Meanwhile, China, responsible for 34% of global CO2 emissions in 2023 (CO2 Emissions in 2023 – Analysis, 2024), is currently the world’s largest emitter; of China’s total transport-related carbon emissions in 2023, 90% stem from road transport, with private automobiles contributing the majority of passenger-related emissions (Figure 1). Against this backdrop, China’s “Dual-Carbon” strategy mandates achieving peak carbon emissions by 2030, compelling megacities to explore pathways for structural emission reductions (Actively and steadily advance carbon peak and carbon neutrality__China Government Website, 2023). Consequently, there is an urgent need for innovative approaches to low-carbon transportation that address infrastructure constraints, travel behavior preferences, and inefficiencies within existing systems.
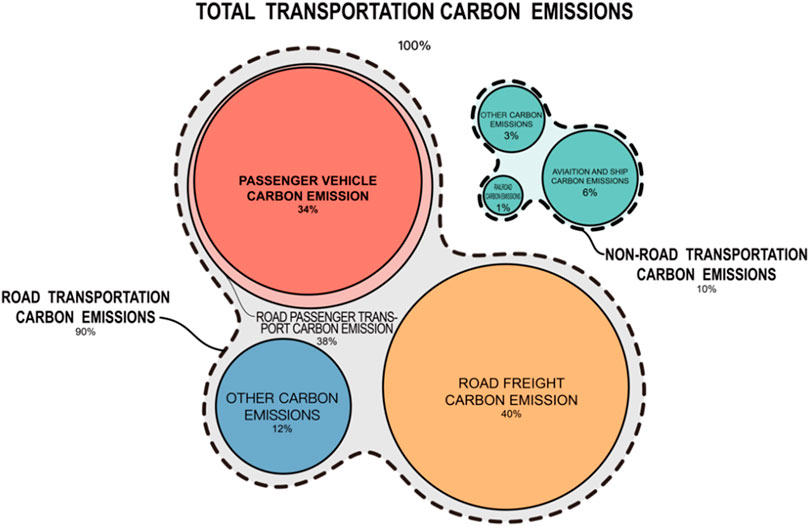
Figure 1. Composition of China’s transportation carbon emissions in 2023.
China is experiencing the world’s fastest motorization surge, with annual new vehicle registrations exceeding 30 million for ten consecutive years (The national motor vehicle fleet has reached 453 million vehicles, and the number of drivers has reached 542 million people - Ministry of Public Security website, 2025). Accordingly, China’s efforts to reduce road transport carbon emissions hold significant leverage for global climate governance. Public transit, given its higher passenger capacity and substantially lower per capita emissions relative to private vehicles, offers a compelling solution (Lu et al., 2015; Andong and Sajor, 2017; Li H. et al., 2019; Yu et al., 2021; Bi et al., 2024). For instance, a medium-sized gasoline car emits approximately 192 g of CO2 per person-kilometer (Figure 2), compared to 105 g for a bus and merely 41 g for rail transit (Greenhouse gas reporting, 2019).
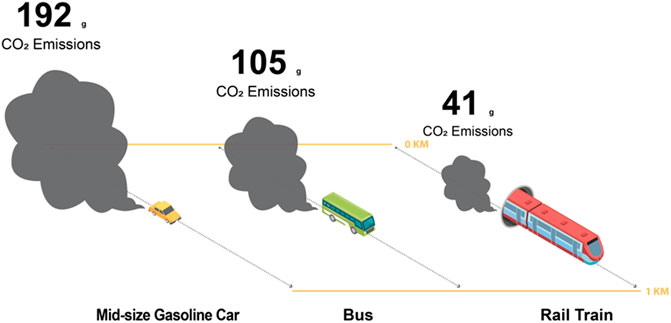
Figure 2. The carbon emission per person-kilometer of a medium-sized gasoline car is about 192 g, a bus is only about 105 g, and a rail train is only about 41 g.
Cities divided by rivers face distinct challenges in transitioning to low-carbon transportation systems. River-crossing corridors act as critical bottlenecks in urban networks: their construction is not only costly but also poses significant ecological impacts (Chen et al., 2021). In addition, the mechanisms and externalities associated with low-carbon land use policies on both sides of the river also contribute to the overall sustainable development of the city (Liu et al., 2025). Assessing the carbon reduction potential of these transportation bottlenecks is thus crucial for meeting China’s dual-carbon goals and providing guidance for other topographically constrained cities aiming to fulfill Sustainable Development Goal 11 (SDG11).
The Yangtze River Basin alone accounts for over 40% of China’s population and GDP (Strategic Basic Information - Yangtze River Economic Belt, 2019), with eleven cities bisected by the Yangtze, creating distinctive cross-river travel demands. Wuhan—a megacity partitioned by both the Yangtze and Han Rivers—provides a key case study in this regard. Unlike Shanghai or Nanjing, which have largely developed along one side of the Yangtze, Wuhan is divided into Wuchang, Hankou, and Hanyang, thereby generating complex and substantial cross-river traffic needs. These geographic constraints, combined with soaring travel demand and China’s pilot information consumption policy that deeply integrates information technology with traditional consumption (Liu et al., 2023), make Wuhan an ideal setting for investigating the policy-driven unlocking of low-carbon transportation potential.
Public transportation is expected to provide point-to-point service from origin to destination for people, excessive connections, detours, and transfers are generally disliked in public transportation travel, and may affect the willingness of urban residents to travel by public transportation. This leads us to consider three key questions: First, in comparison to driving, how does the higher occurrence of connections, detours, and transfers in public transportation affect the travel mode preferences of urban residents (Figure 3)? Second, considering the resource allocation constraints of cross-river transportation, is there a disparity in the impact between cross-river travel and non-cross-river travel? Additionally, what is the relationship between the resource allocation of cross-river transportation and this disparity? Addressing the above questions will assist city managers in implementing targeted transportation optimization measures to create a cross-river transportation environment that promotes low-carbon travel, and then effectively unlock the carbon reduction potential associated with urban cross-river transportation.
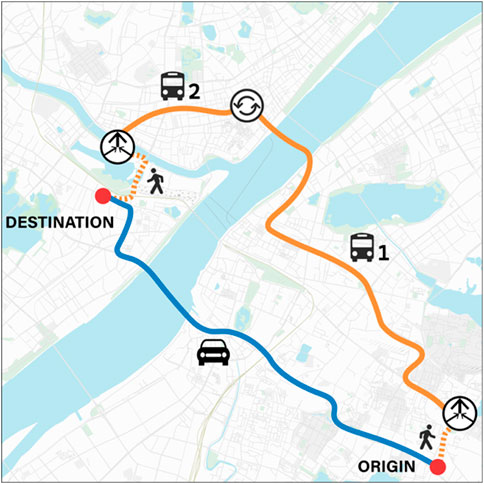
Figure 3. Comparison of OD routes between public transportation travel and driving travel: orange is the public transportation travel route, and blue is the driving travel route, which shows that public transportation travel may generate more connections, detours, and transfers.
Although public transit is widely recognized as a key driver of decarbonization, existing models often fall short of capturing its dynamic potential in topographically constrained cities. Traditional assessment approaches tend to assume a linear relationship between infrastructure improvements and shifts in travel modes, overlooking the adaptive behavioral responses and threshold effects underlying residents’ transition to low-carbon mobility. This non-linear relationship remains largely unexplored in the current literature, underscoring the need for a paradigm shift from “comprehensive coverage” to “precise targeting.” Such a shift is particularly critical for river-divided cities, where infrastructure expansion entails high financial and environmental costs, making targeted interventions both more cost-effective and more impactful.
This study investigates the impact of connection, detour, and transfer on urban residents’ willingness to travel by public transportation, highlighting their implications for the carbon emissions of urban transportation systems. To address this, a dynamic evaluation method is proposed to quantify the urban transportation carbon reduction potential, defined as the proportion of travelers who could shift from high-carbon to low-carbon travel modes under optimized public transit conditions. This method, grounded in Origin-Destination (OD) survey data, calculates the number of potential low-carbon travelers based on thresholds of acceptable connection, detour, and transfer strength for public transportation users. Unlike static assessments, the urban transportation carbon reduction potential in this study is dynamic, as it varies with residents’ acceptance thresholds for public transit attributes. Analyzing the variation trends and identifying rapid unlocking zones of the urban transportation carbon reduction potential are key objectives of this research, as this information enables city managers to develop precise, cost-effective transportation policies that achieve significant reductions in carbon emissions at a lower marginal cost.
We applied this method with the evaluation of the carbon reduction potential of cross-river transportation in Wuhan, China, as an example. River-crossing passages serve as crucial transportation nodes in cities, but their construction entails substantial costs and poses a threat to the ecological environment. Consequently, the allocation of resources for urban cross-river transportation is often limited. Excessive car usage for crossing the river can lead to urban road congestion and, subsequently, a significant increase in overall carbon emissions from transportation. Thus, advocating the use of public transportation becomes particularly essential for cross-river travel. In order to effectively analyze the differences in the impacts of connection, detour, and transfer on residents’ travel mode choices between cross-river and non-cross-river trips, as well as the underlying relationship with the allocation of cross-river transportation resources, this study compared the carbon reduction potential of urban cross-river transportation and non-cross-river transportation. By analyzing the disparities between the two, the study investigated the influencing characteristics of public transportation connection, detour, and transfer on the carbon reduction potential of cross-river transportation. Subsequently, based on the OD data of relevant traffic flow, a specialized carbon reduction potential evaluation of the main river-crossing passages in the urban area of Wuhan was conducted. This aimed to reflect the disparities in transportation carbon reduction potential in different cross-river regions of the city, thereby providing quantitative evidence for the formulation of targeted measures.
Based on this framework, the study makes four key innovative contributions: Firstly, it introduces the concept of the urban transportation carbon reduction potential, shifting the focus from static evaluations of current conditions to the dynamic potential for unlocking low-carbon travel. Secondly, it identifies and analyzes the mechanisms through which connection, detour, and transfer barriers—critical disadvantages of public transit compared to private vehicles—affect the urban transportation carbon reduction potential. Thirdly, it emphasizes the identification of rapid unlocking zones for the urban transportation carbon reduction potential, determining the specific thresholds of connection, detour, and transfer strength corresponding to these zones. Lastly, recognizing the limited resources available for urban cross-river transportation, the study conducts a targeted evaluation of its carbon reduction potential.
These contributions are particularly valuable for informing the optimization of urban transportation policies, with a specific emphasis on cross-river transportation systems. Furthermore, the evaluation framework relies on basic OD survey data, making it highly applicable in low-data environments and accessible to non-specialists. This accessibility ensures that the methodology can be implemented in underdeveloped regions lacking advanced platforms and expertise, promoting its broader adoption and practical impact.
The remainder of this paper is organized as follows: the literature review related to this study is presented in Section 2; The Section 3 explains and elaborates on the OD survey and evaluation methods; the Section 4 presents and discusses the evaluation results; the Section 5 presents the conclusions, limitations, and prospects for the follow-up work of this study.
Literature review
Evaluation and control of carbon emissions in urban transportation
Transportation carbon emissions constitute a significant portion of overall urban carbon emissions, it is widely acknowledged internationally that effectively evaluating and managing urban transportation carbon emissions is essential. According to the statistics of the Cities Climate Leadership Group on the three basic emissions of stationary energy, transport, and waste (Greenhouse gas emissions interactive dashboard, 2022), cities such as São Paulo, Ho Chi Minh City, Auckland, Stockholm, Oslo, and Houston, characterized by high motorization rates or underdeveloped public transportation systems, contribute nearly 60% of transportation carbon emissions. The proportion of most cities in the world falls between 20% and 60%. The promotion and utilization of new vehicle types and alternative transportation energy in recent years have garnered attention for their positive contributions to carbon emission reduction in urban transportation systems. For example, bicycle sharing (Zhang L. et al., 2018; Kou et al., 2020a; D’Almeida et al., 2021a; Wang X. et al., 2021), electric bicycles (Ji et al., 2012b; McQueen et al., 2020a), electric motorcycles (Hsu and Wang, 2016a), and e-scooters (de Bortoli and Christoforou, 2020; Ehrenberger et al., 2022; Gebhardt et al., 2022; Weschke et al., 2022; Chien et al., 2023) in reducing carbon emissions from urban transportation, and the extent of carbon emission reduction from urban public transportation with the completion of electrification or the use of biofuels (Pereira et al., 2017a), etc. Notably, highly developed public transportation cities like Tokyo, Seoul, and Paris account for less than 20% of transportation carbon emissions, while Rotterdam, where bicycle travel is prevalent, only contributes to 4.8% of transportation carbon emissions. This evidence underscores the importance of promoting and guiding low-carbon travel among urban residents as a key strategy for controlling urban transportation carbon emissions.
Numerous studies have shown that walking, cycling or public transport travel has a positive effect on reducing the city’s overall carbon emissions (Patalas-Maliszewska and Losyk, 2020; Chen et al., 2023; Di Martino et al., 2024), so investigating the urban spatial structure conducive to low-carbon travel has emerged as a prominent area of research interest (Stojanovski, 2019; Su et al., 2023; Zhao et al., 2023). Moreover, the promotion and utilization of new vehicle types and alternative transportation energy in recent years have garnered attention for their positive contributions to carbon emission reduction in urban transportation systems. For example, bicycle sharing (Kou et al., 2020b; D’Almeida et al., 2021b; Wang S. et al., 2021; Liu et al., 2024), electric bicycles (Ji et al., 2012a; McQueen et al., 2020b), and electric motorcycles (Hsu and Wang, 2016b) in reducing carbon emissions from urban transportation, and the extent of carbon emission reduction from urban public transportation with the completion of electrification (Hou et al., 2023; Cai et al., 2024) or the use of biofuels (Pereira et al., 2017b), etc. Methodological advancements of dynamic traffic assignment methods in the application of environmentally sustainable road transport. The research findings indicate that dynamic traffic assignment methods can effectively assess carbon emissions in urban traffic and provide a scientific basis for policy formulation (Wang et al., 2018).
Connection, detour and transfer in urban transportation
The willingness of urban residents to use public transportation is directly influenced by connection, detour, and transfer factors. Efficient connections are crucial for optimizing the “last mile” of urban public transportation operations, while excessive detours and transfers significantly impact the efficiency and user experience of public transportation travel. Empirical research on typical connection, detour, and transfer issues is presented in Supplementary Table S1, and the progress in research on these three aspects is discussed below.
Connection
The establishment of an efficient transportation connection system can facilitate the transition of residents from private to public modes of travel, thereby reducing the operational costs of urban transportation (Almasi et al., 2016). The concept of the “last mile” has been extensively discussed in transportation connection studies, highlighting the importance of effectively transporting urban commuters to public transportation arteries. Currently, the connection of urban railway systems is a prominent area of research, and the convenience of connection is one of the core indicators in the applicability evaluation of urban railway system (Bajaj and Singh, 2021). The feeder bus plays a pivotal role in connecting urban rail trains, the accessibility and operational tatus of feeder bus services directly impact the overall accessibility of urban railway systems (Tang and Du, 2020; Saiyad et al., 2022), thus the demand (Pan et al., 2015; Zhu et al., 2017) and dispatch (Deng et al., 2013; Jiang et al., 2020; Yang et al., 2022) of feeder bus are crucial for the research, which can provide the basis for the route planning of feeder buses. In addition, the role of shared bicycles and taxis in transportation connection has also garnered attention, relevant research primarily focuses on the influence of social and environmental factors on their usage patterns (Ni and Chen, 2020; Zhao et al., 2022) and the synergistic effects of different connection tools (Zgheib et al., 2020). The urban transportation planning and construction of the “last mile” significantly impact the reduction of traffic congestion and carbon emissions, thereby enhancing the sustainability of urban transportation (Campisi et al., 2023).
Detour
Research on urban transportation detours primarily focuses on road network analysis and solution strategies related to detours. Identifying the shortest routes (Fei and Guo-Ping, 2011; Nutanong et al., 2012; Abdelghany et al., 2016) that avoid excessive detours and comparing the detour strength of different travel modes (Lee and Kim, 2015; Meeder and Weidmann, 2018; Costa et al., 2021) is the research focus in this field. In addition, studies based on various big data such as vehicle trajectories and GPS positioning have found that travel distance, road type, and architectural environment may have an impact on the regional distribution of detour strength in cities (Winters et al., 2010; Yang et al., 2018). For strategy, major studies focus on the detour control during the carpooling of online car-hailing. In this regard, matching algorithms, prospect theory, and evolutionary game models (Zhang et al., 2016; Zhang et al., 2018 W.) are used to analyze the optimal strategy selection of drivers in the carpooling process, and passengers are advised to get on and off at an alternative meeting point in the shared route (Aliari and Haghani, 2023), thereby reducing the detour strength and improving passenger matching during online carpooling.
Transfer
Research on urban transportation transfers primarily focuses on identifying various factors that lead to transfer obstacles within multimodal transportation systems and proposing corresponding solutions. The macro-level factors mainly include station location (Roquel et al., 2021; Chen et al., 2022), social economy (Wu et al., 2022a), building environment (Gan et al., 2021; Liu et al., 2022; Wu et al., 2022a), and transportation mode (Gan et al., 2021), and the key micro-level factors include waiting time and walking distance for transfers (Navarrete and Ortúzar, 2013; Hernandez and Monzon, 2016; Yang et al., 2020). Moreover, the psychological state of passengers during the transfer process was also included in the research (Navarrete and Ortúzar, 2013; Hernandez and Monzon, 2016; Espino and Roman, 2020). In recent years, the widespread use of smart cards in urban public transportation has made transfer issues based on smart card big data a current research focus (Chia et al., 2020; Hussain et al., 2021), the negative effect evaluation and sensitivity analysis of transfer penalties (Yang et al., 2020; Ye et al., 2023) have also gained increased attention. In terms of strategies, some researchers have developed optimization models for urban public transportation networks that aim to reduce the number of transfers (Wang C. et al., 2020; Owais et al., 2021a) and minimize waiting time (Takamatsu and Taguchi, 2020; Wu et al., 2022b), to enhance the connectivity of the urban transportation system (Owais et al., 2021b), and have also developed the public transportation passenger assistance system to address transfer obstacles such as vehicle congestion, missed connection, inconvenient luggage transport (Faulhaber et al., 2022) and so on, thereby enhancing the attractiveness of public transportation to city residents. Therefore, addressing the challenges and obstacles brought about by the transition to connecting corridors through intelligent transportation systems and resilient planning will enhance the sustainability and resilience of urban traffic (Campisi et al., 2021).
Travel mode transformation of urban residents
Supplementary Table S2 presents empirical studies on travel mode transformation, the impact of specific travel environments on residents’ willingness to travel has received major attention, including some extreme environments such as disastrous weather (Stamos et al., 2015; Caprì et al., 2016; Zhang and Li, 2022), floods (Morelli and Cunha, 2021), road damage (Azolin et al., 2020a), or energy constraints (Krumdieck et al., 2010). Consequently, researchers focus on examining how residents’ travel modes change under specific conditions and analyze the factors and characteristics influencing this transformation. For instance, in recent years, the COVID-19 pandemic has led many urban residents to shift from public transportation travel to driving or non-motorized travel, subjective and objective factors such as urban location, socio-economic, travel psychology, and travel behavior are considered to have an impact on the travel mode transformation under the COVID-19 pandemic, and it has been verified in Bangladesh, Belgium, Thailand, Australia and many other countries in the world (Currie et al., 2021; Hook et al., 2021; Zafri et al., 2022; Zubair et al., 2022; Ciuffini et al., 2021). In addition, in order to alleviate urban traffic congestion and air pollution while reducing greenhouse gas emissions (Bagheri et al., 2020; Liu et al., 2020; Mocanu et al., 2021; Ramakrishnan et al., 2021), many places in the world have introduced targeted incentive policies, positive measures such as “car sharing” services (Fuller et al., 2013; Gao et al., 2019; Diana and Ceccato, 2022) or “public transport priority” programs (Wang et al., 2013; Ding and Zhang, 2017; Asitha and Khoo, 2020), etc., negative measures such as private car congestion charges (Li Y. et al., 2019) and private driving restrictions (Zhang et al., 2017), etc. Many studies have examined the transformation characteristics from driving to public transportation or non-motorized travel under the influence of these incentives, and the research areas include Germany, Italy, Finland, Canada, India, China, Malaysia, etc. In general, the built environment (Heinen et al., 2017; Barnett et al., 2019), residential location (Hu and Schneider, 2015), population characteristics (Gao and Sun, 2018; Venkadavarahan and Marisamynathan, 2022), social psychology (Venkadavarahan and Marisamynathan, 2022), transportation layout (Gao and Sun, 2018), and working system (Gao and Sun, 2018) are often considered impact factors in the study of travel mode transformation, while the restrictive conditions include short-distance traffic, travel environment change, transportation facility activation, traffic interruption, and safety hazard upgrade, etc.
Some researchers have also considered the residents’ travel mode transformation in the construction of urban transportation resilience evaluation systems. In this regard, Martins et al. (2019a) proposed the concept of “maximum possible distance” and used it as the critical distance for the transformation between walking, cycling and motorized travel, so that the proportion of non-motorized travel under restrictive conditions was used as the primary criterion for evaluating the city’s inherent transportation resilience. This study is also based on the premise of travel mode transformation in the variation process in the acceptable strength thresholds of urban residents for public transportation connection, detour, and transfer, dynamically judges the number of people with low-carbon travel potential. To achieve this, a series of scenarios combining these thresholds are constructed. Subsequently, the urban transportation carbon reduction potential is calculated for each scenario, and the variation trends in these values in relation to the connection, detour, and transfer thresholds are analyzed. Furthermore, this study identifies the zone where the urban transportation carbon reduction potential can be rapidly unlocked. Azolin et al. (2020b) considered the conversion of car travel to non-motorized or public transportation during destructive events, thus analyzed the contribution of urban public transportation systems and evaluated the overall transportation resilience of the city. Martins et al. used distance as a penalty factor influencing residents’ willingness to use non-motorized modes, and based on this, our study further introduced the penalty factors of connection, detour, and transfer influencing residents’ willingness to use public transportation. According to this, we have developed a transportation carbon reduction potential evaluation system based on the premise of the travel mode shift in the changing process of urban residents’ acceptable strength threshold in public transportation connections, detours, and transfers.
Data and methodology
Data collection for Wuhan
This study takes Wuhan City as the object, which is located in the central region of China and is the capital of Hubei Province with a permanent population of more than 13 million (Wuhan, 2024). Wuhan is known as the “River City” as it is situated along the Yangtze River and its major tributary, the Han River, which divide the city into three regions: Hankou, Wuchang, and Hanyang. Being a city with the highest demand for cross-river transportation in China, Wuhan witnessed the completion and opening of the first Yangtze River bridge in 1957. By the end of 2024, as many as thirteen Yangtze River Bridges and ten Han River Bridges have been completed or are under construction in Wuhan. Additionally, there are two vehicle tunnels and four subway tunnels that traverse the Yangtze River. Therefore, Wuhan serves as an appropriate example for evaluating the carbon reduction potential in urban cross-river transportation.
In order to gather data on the travel characteristics of residents in Wuhan, a questionnaire survey was employed in this study. The survey was conducted between 2023 and 2024, resulting in a total of 10,327 valid questionnaires collected via online surveys. The survey content encompassed various aspects, including respondents’ daily travel modes, OD (Origin-Destination) coordinates, gender, age, income level, and more. Among the respondents, 2,152 individuals (20.84% of the total survey participants) reported traveling across the river. Respondents in this survey were mainly located in seven central districts of Wuhan, including Jiang’an District, Jianghan District, Qiaokou District, Hanyang District, Wuchang District, Qingshan District, and Hongshan District, and some respondents were located in distant districts. In the calculation of OD distance and related connection, detour, and transfer strength, although dividing the city into traffic analysis zones (TAZs) and assigning all OD points to a central point in their TAZs helps to simplify the calculation significantly (Martins et al., 2019b; Azolin et al., 2020a; Wang et al., 2022), it may lead to large deviations from the actual results, so all calculated points in this study are actual OD points.
Calculation of connection, detour, and transfer strength
In this study, the connection strength is defined as the non-vehicle distance in the whole journey of public transportation travel between the origin and destination, represented as
where
There is a correlation between the detour distance that urban residents can accept and the total travel distance, passengers with a total travel distance of 10 km are often willing to accept a detour distance of 3 km, but passengers with a total travel distance of only 1 km obviously cannot accept a detour distance of 3 km. In addition, for the calculation of detour strength, if only the ratio of the shortest path distance to the Euclidean distance between two points is considered, in most cases the shorter the travel distance, the higher the detour strength (Yang et al., 2018), so it is impossible to truly quantify the detour degree of public transportation travel compared with driving travel. Therefore, it is more appropriate to define the detour strength as the ratio of the shortest path distance of public transportation travel to the shortest path distance of driving travel, the calculation formula can be expressed as Equation 2:
where
The number of transfers and the non-motorized travel distance during the transfer process directly impact the acceptance of public transportation travel by residents. The consideration of the non-motorized travel distance has already been incorporated into the calculation Equation (1) for connection strength, so the calculation formula for transfer strength can be expressed as Equation 3:
where
Travel mode classification
Objective factors such as travel necessity (Krumdieck et al., 2010) and external environmental impact (Stamos et al., 2015; Caprì et al., 2016) are the basis for the classification of urban residents’ travel modes. Martins et al. (2019b) and Wang et al. (2022) categorized modes based on residents’ willingness distance for non-motorized travel, this study considers that residents’ willingness of public transportation travel may be affected by connection, detour, and transfer, and defines thresholds for
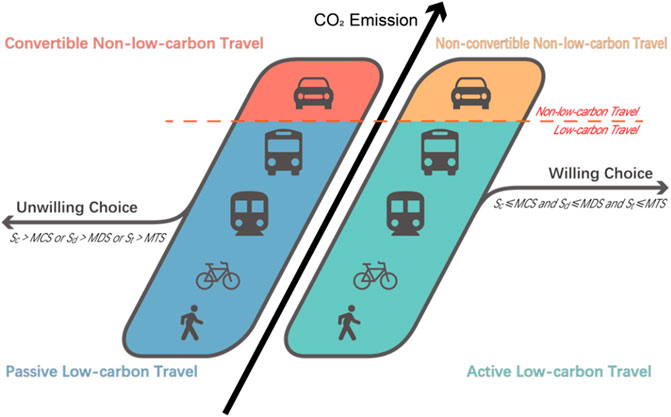
Figure 4. Four classifications of travel modes of urban residents.
Active low-carbon travel refers to situations where the strengths of connection, detour, and transfer in public transportation travel fall below the maximum acceptable thresholds, and residents deliberately opt for non-motorized or public transportation modes. Passive low-carbon travel occurs when one or more of the strengths related to connection, detour, or transfer in residents’ public transportation travel exceeds the maximum acceptable threshold. Despite this, residents still opt for non-motorized or public transportation modes, this choice could be influenced by factors such as high driving costs or other personal considerations. Consequently, their low-carbon travel becomes passive and may not align with their preferences. Non-convertible non-low-carbon travel refers to situations where the strengths of connection, detour, and transfer in public transportation travel are all below the maximum acceptable thresholds, yet residents still opt for driving travel. This choice indicates that the primary reason for not choosing low-carbon travel is not the inconvenience of public transportation, and the improvement of public transportation convenience alone will not lead to a transformation in travel mode. Therefore, this travel mode cannot be transformed when only the improvement of public transportation travel conditions. Convertible non-low-carbon travel refers to situations where at least one of the strengths of connection, detour, and transfer in public transportation travel exceeds the maximum acceptable threshold, and residents opt for driving travel. In such cases, improvements in public transportation travel conditions may result in a transformation of travel mode for some residents towards low-carbon travel.
As mentioned above, only the travel mode categorized as convertible non-low-carbon has the potential to be transformed into low-carbon travel by improving public transportation travel conditions within the four travel modes. Therefore, this study introduces the concept of urban transportation carbon reduction potential, which represents the proportion of convertible non-low-carbon travelers to the total number of travelers. This measure reflects the potential scope for reducing carbon emissions in urban transportation by implementing relevant measures to enhance public transportation travel conditions.
Index calculation and evaluation system construction of urban transportation carbon reduction potential
The calculation formulas to determine the proportions of active low-carbon travelers, passive low-carbon travelers, non-convertible non-low-carbon travelers, and convertible non-low-carbon travelers among the total number of travelers are as Equations 4-7:
where
To further analyze the variation trend of urban transportation carbon reduction potential with MCS, MDS and MTS values, and identify the rapid unlocking zone of this potential along with its corresponding key threshold, a series of combined scenarios were constructed. These scenarios were created by varying the MCS, MDS, and MTS values, the MCS value ranged from 0 to 5.0 with an increment of 0.1, the MDS value ranged from 0.50 to 3.00 with an increment of 0.05, while the MTS value ranged from 0 to 4 with an increment of 1. Each combined scenario was assigned a unique name and number. For instance, C0.5D1.50T1 represented a scenario with an MCS value of 0.5, an MDS value of 1.50, and an MTS value of 1. In total, this study constructed 13,005 combined scenarios, the starting scenario, denoted as C0D0.50T0, was numbered 1, while the ending scenario, denoted as C5.0D3.00T4, was numbered 13,005 (Table 1).
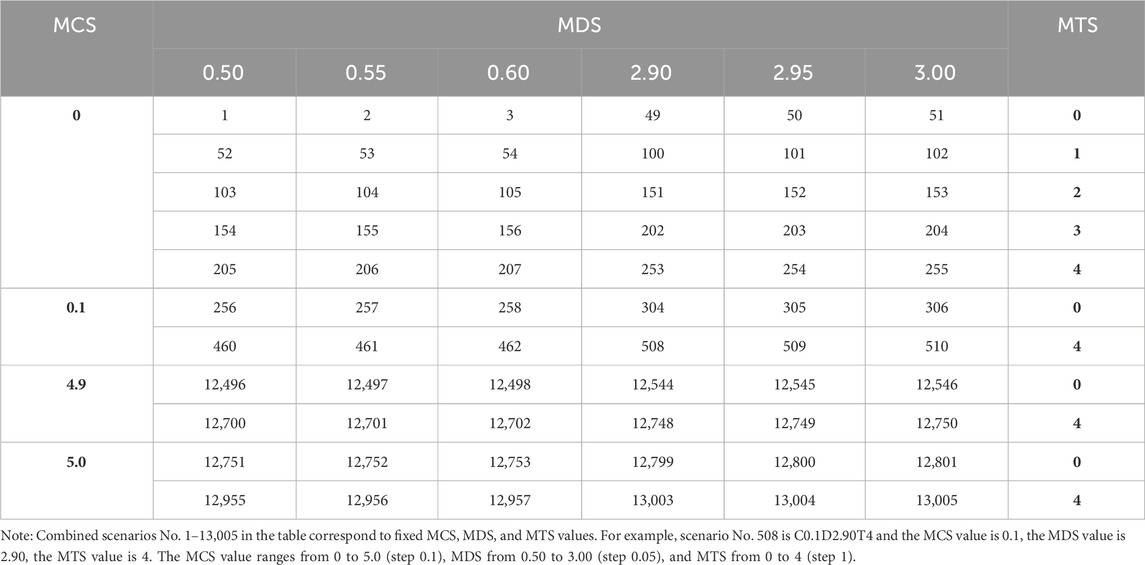
Table 1. Combined scenarios constructed based on differences in MCS, MDS, and MTS values.
After constructing a total of 13,005 combined scenarios, the 10,327 OD survey samples were divided into two groups: a river-crossing sample group and a non-river-crossing sample group. Based on the Baidu Maps API, the optimal public transportation and driving routes for all samples were obtained, and then the
In addition, regarding the issue raised by the reviewer that the subway and traditional public transit systems are considered as two different networks in public transportation, this study, based on the Baidu Map API, comprehensively considers the different transfer distances, waiting times, and potential delays associated with subway and bus systems, and then derives the optimal travel solutions for evaluation. Therefore, it can be said that the Baidu Map API has already incorporated the subway and traditional public transit systems into a unified transportation network in the process of generating optimal travel solutions. The above represents our considerations on this matter, and we welcome any suggestions from the reviewer if there are any concerns. Following the completion of the aforementioned tasks, the calculated data was used to fit relationship curves between the urban transportation carbon reduction potential value and the MCS, MDS, and MTS values for both the river-crossing and non-river-crossing cases. The fitting formula was then derived, enabling a comprehensive comparison and analysis of the overall difference in urban transportation carbon reduction potential between the two cases. Lastly, an in-depth evaluation was conducted on the urban transportation carbon reduction potential of the primary river-crossing passages in Wuhan by considering the distribution of river-crossing traffic flow in each surveyed passage.
Results and discussion
Statistics on travel characteristics of Wuhan residents
Out of the 10,327 samples in this survey, 2,152 individuals (20.84% of all respondents) traveled across the river, signifying that approximately one-fifth of Wuhan residents require river crossings in their daily travel. Additionally, out of those, 1,757 individuals crossed the Yangtze River, accounting for 81.6% of all respondents, or approximately four-fifths, while only 395 individuals crossed the Han River, representing 18.4% or approximately one-fifth of the total. The demand for river crossings in Wuhan is predominantly focused on the Yangtze River due to historical reasons. Hankou, Wuchang, and Hanyang were independent cities in the past, resulting in comparable development levels on both sides of the Yangtze River and a significant need for commuting across it. Consequently, this has led to heightened traffic congestion on the river, distinguishing it from cities like Shanghai and Nanjing, which are situated along the Yangtze River but are primarily developed on one side.
Analysis of travel characteristics depicted in Figure 5 reveals that the majority of OD distances for non-river-crossing travel are typically under 10 km. Specifically, 26.43% of the samples fall within the 2 km range, while 45.86% fall within the 4 km range. In contrast, river-crossing travel entails considerably greater OD distances, primarily concentrated within the 10–30 km range, with a sample size accounting for 70.38%. Consequently, out of the respondents, only 11.5% utilized non-motorized vehicles to cross the river, 18.8% used cars, and 69.7% relied on public transportation. In contrast, when not crossing the river, 40.4% of the respondents traveled by non-motorized vehicles, 20.4% by car, and another 39.2% by public transportation (Figure 6). It can be seen that public transportation travel is the most important mode for Wuhan residents to travel, and traveling across river is especially dependent on public transportation.
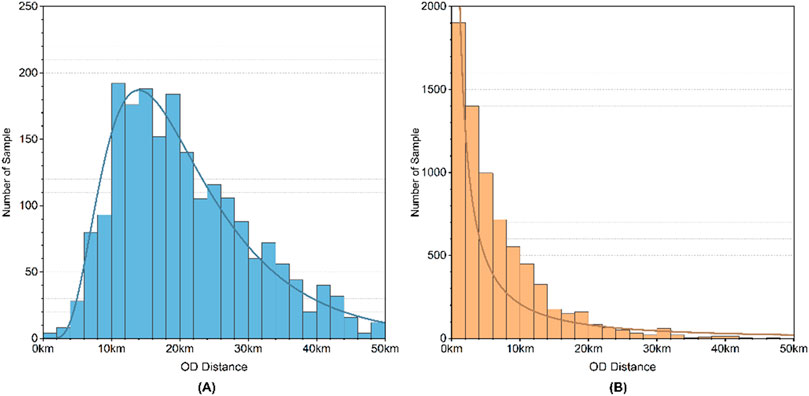
Figure 5. (A) OD distance distribution of river-crossing travel, (B) OD distance distribution of non-river-crossing travel.
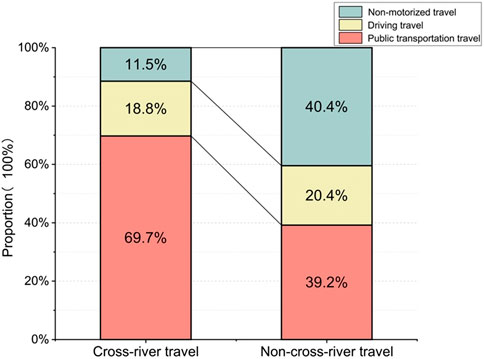
Figure 6. Comparison of the proportion of travel modes in the case of crossing river and non-crossing river.
Figure 7 illustrates the distribution of OD distances for river-crossing public transportation travel, exhibiting a notable concentration of samples within the 10–20 km range, accounting for 44.31% of the total. In contrast, the OD distance distribution for river-crossing driving travel displays greater dispersion, with no significant variation in sample distribution across the 10–40 km range. This suggests that public transportation may not offer an advantage over driving for long-distance river-crossing travel exceeding 20 km. In Figure 8, the OD distance distribution of non-river-crossing public transportation travel exhibits its highest concentration around 5 km, with 53.41% of samples falling within 10 km, this indicates that the distance of river-crossing public transportation travel in Wuhan is generally about 10 km longer than non-river-crossing public transportation travel, while non-river-crossing driving travel predominantly covers short distances within 10 km, with 73.97% of samples falling into this category.
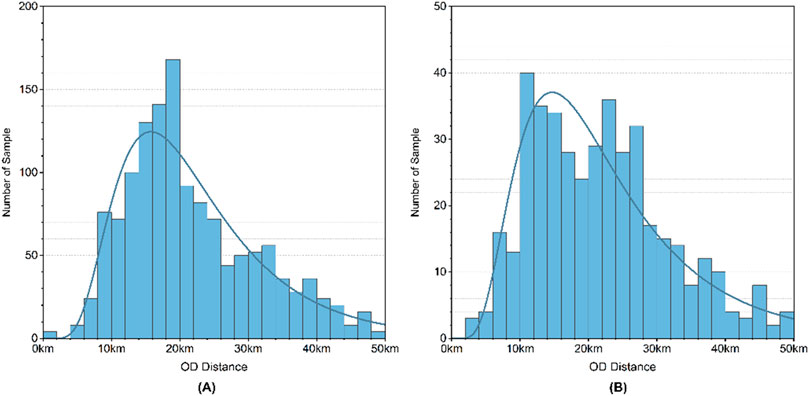
Figure 7. (A) OD distance distribution of river-crossing public transportation travel, (B) OD distance distribution of river-crossing driving travel.
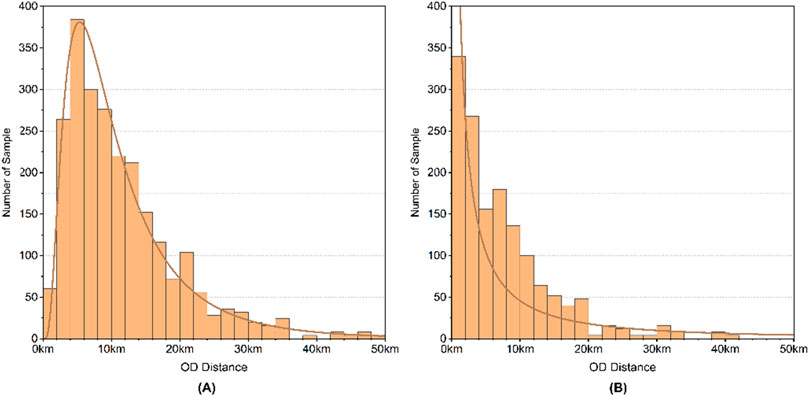
Figure 8. (A) OD distance distribution of non-river-crossing public transportation travel, (B) OD distance distribution of non-river-crossing driving travel.
As shown in Figure 9, the
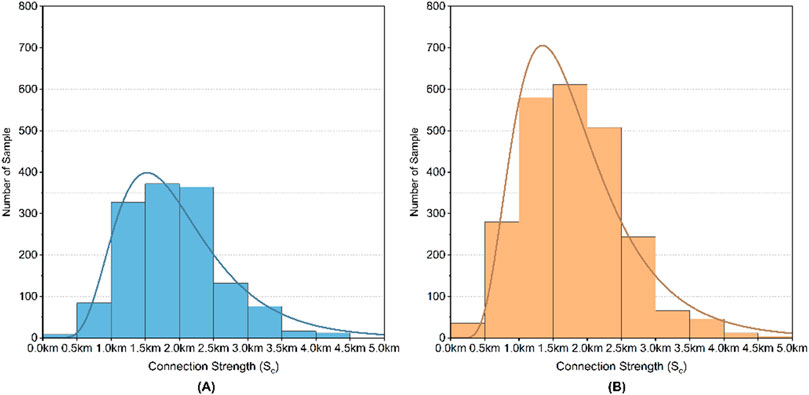
Figure 9. (A) The distribution of
As shown in Figure 10, the
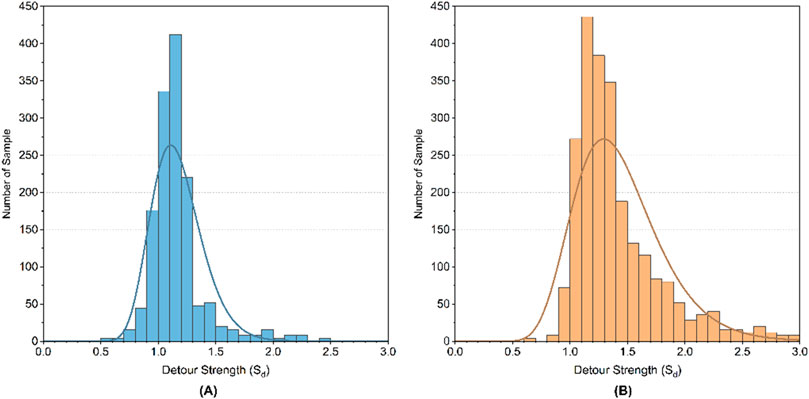
Figure 10. (A) The distribution of
As shown in Figure 11, the
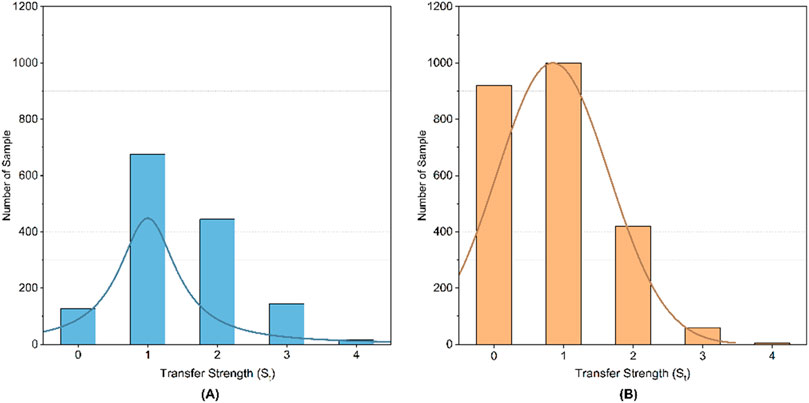
Figure 11. (A) The distribution of
Evaluation and comparison of cross-river transportation carbon reduction potential in Wuhan
The urban transportation carbon reduction potential was determined by individually calculating all survey samples across 13,005 combined scenarios. Table 2 presents the calculation results for cross-river transportation, which consists of 2,152 samples. Similarly, Table 3 displays the calculation results for non-cross-river transportation, comprising 8,175 samples. The
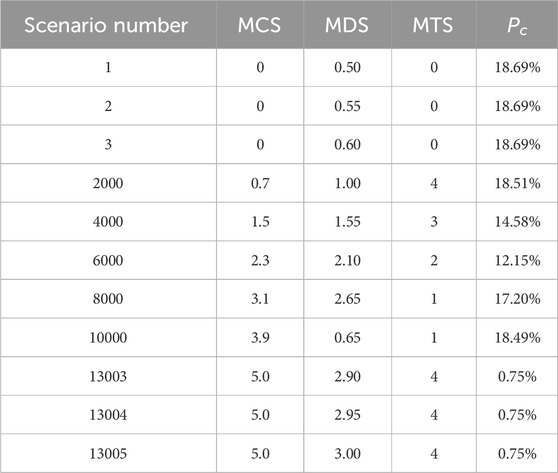
Table 2. The values of cross-river transportation carbon reduction potential in combined scenarios.
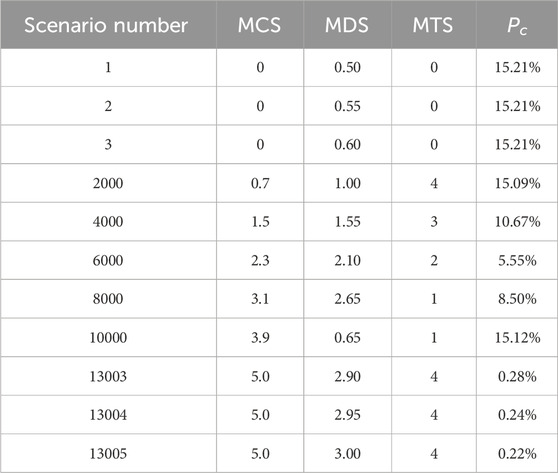
Table 3. The values of non-cross-river transportation carbon reduction potential in combined scenarios.
In order to further determine the relationship function between the urban transportation carbon reduction potential and MCS, MDS and MTS, taking MCS, MDS and MTS as independent variables respectively, as well as the effect of degradation due to interference from the other two variables is not considered and defaulting them to the maximum value, and then the relationship curve is plotted with the value of
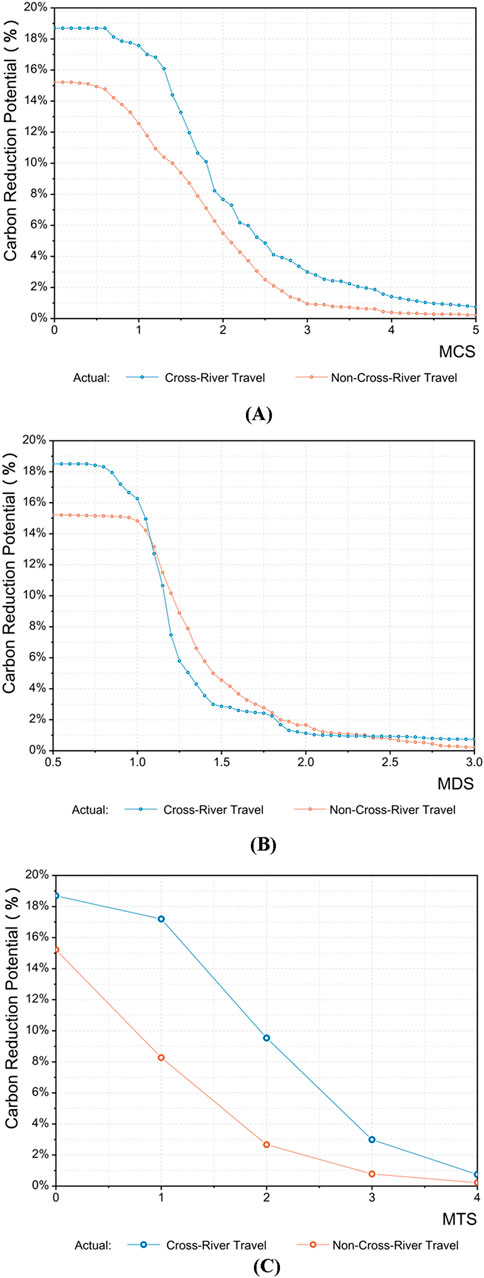
Figure 12. (A) The relationship curve between urban transportation carbon reduction potential and MCS in Wuhan, (B) The relationship curve between urban transportation carbon reduction potential and MDS in Wuhan, (C) The relationship curve between urban transportation carbon reduction potential and MTS in Wuhan.
The curves shown in Figure 12 are fitted by the four-parameter logistic fit algorithm, resulting in the inverse “S”-shaped curves shown in Figure 13, the R2 of these three fitting curves are all greater than 0.99, showing a high degree of fitting, and the fitting results are shown in Supplementary Table S3. The inverse “S”-shaped fitting curve shows that the urban transportation carbon reduction potential of Wuhan can be divided into three parts: the stable zone (slow unlocking), the unlocking zone (rapid unlocking) and the re-stable zone (slow unlocking) (Figure 14). The unlocking zone is crucial, within this zone, as MCS, MDS, and MTS values increase, the rate of decrease in
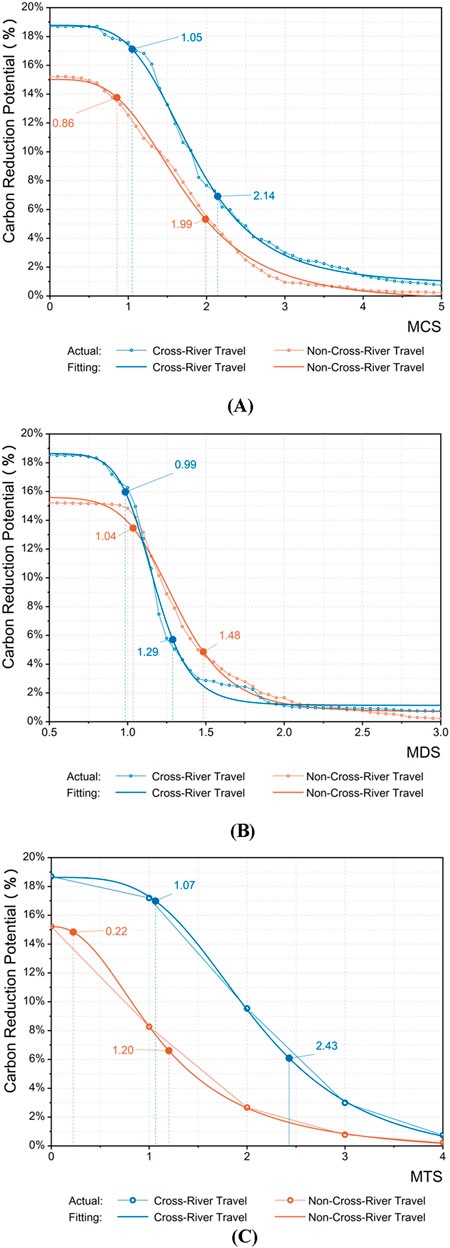
Figure 13. (A) The fitting curve of the relationship between urban transportation carbon reduction potential and MCS in Wuhan, (B) The fitting curve of the relationship between urban transportation carbon reduction potential and MDS in Wuhan, (C) The fitting curve of the relationship between urban transportation carbon reduction potential and MTS in Wuhan.
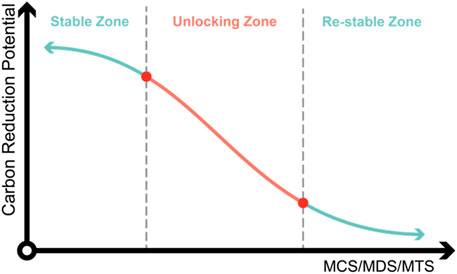
Figure 14. Three zones of the process of Wuhan’s transportation carbon reduction potential variation with MCS, MDS and MTS.
After derivation, the fitting process in Figure 13 can be expressed as Equations 8:
where
According to Figure 13A, the urban cross-river transportation carbon reduction potential in Wuhan is consistently higher than that of non-cross-river transportation, regardless of variations in the MCS value. The starting and ending points of the carbon reduction potential unlocking zone for cross-river transportation have greater MCS values compared to the starting and ending points of the unlocking zone for non-cross-river transportation. Specifically, the unlocking zone for urban cross-river transportation carbon reduction potential is observed between MCS = 1.05 km and MCS = 2.14 km, with corresponding carbon reduction potential values of 17.12% and 6.92% respectively. On the other hand, the unlocking zone for urban non-cross-river transportation carbon reduction potential is situated between MCS = 0.86 km and MCS = 1.99 km, with corresponding carbon reduction potential values of 13.76% and 5.32% respectively. These findings indicate that the urban cross-river transportation carbon reduction potential in Wuhan can be rapidly unlocked when the maximum acceptable public transportation connection strength for residents reaches 1.05 km. However, beyond an acceptable public transportation connection strength of 2.14 km, the unlocking of the urban cross-river transportation carbon reduction potential in Wuhan becomes less significant. To effectively unlock the urban cross-river transportation carbon reduction potential, measures should be implemented to encourage residents to accept higher connection strengths in public transportation compared to non-cross-river transportation.
According to Figure 13B, with the increase of MDS value, the carbon reduction potential of cross-river transportation is higher than that of non-cross-river transportation in the stable zone in Wuhan, but the value of carbon reduction potential of cross-river transportation decreases rapidly in the unlocking zone, and is generally lower than that of non-cross-river transportation, until the carbon reduction potential of cross-river transportation in the re-stable zone is higher again than that of non-cross-river transportation. Different from Figure 13A, in the fitting curve of Figure 13B, the MDS values of the starting and ending points of the carbon reduction potential unlocking zone of cross-river transportation are all smaller than those of non-cross-river transportation, of which the unlocking zone of urban cross-river transportation carbon reduction potential is located between MDS = 0.99 and MDS = 1.29, and the corresponding carbon reduction potential values are 15.97% and 5.71% respectively, the unlocking zone of urban non-cross-river transportation carbon reduction potential is located between MDS = 1.04 and MDS = 1.48, and the corresponding carbon reduction potential values are 13.45% and 4.86% respectively. These findings indicate that the urban cross-river transportation carbon reduction potential in Wuhan will be rapidly unlocked when the maximum acceptable public transportation detour strength for residents reaches 0.99, until the maximum acceptable public transportation connection strength for residents exceeds 1.29, then the urban cross-river transportation carbon reduction potential in Wuhan will no longer be unlocked at a significant rate. Based on the aforementioned analysis, when the overall detour strength of public transportation in Wuhan decreases or the acceptable threshold of detour strength for residents increases, the carbon reduction potential of cross-river transportation is unlocked earlier compared to non-cross-river transportation. Moreover, due to the considerably higher reduction rate of carbon reduction potential in the unlocking zone for cross-river transportation compared to non-cross-river transportation, the efficiency of unlocking the carbon reduction potential of cross-river transportation may be higher when effective measures are implemented.
According to Figure 13C, the carbon reduction potential of urban cross-river transportation in Wuhan consistently surpasses that of non-cross-river transportation, regardless of variations in the MTS value. The unlocking zone for the carbon reduction potential of urban cross-river transportation is observed between MTS = 1.07 and MTS = 2.43, which corresponds to 1 and 3 transfers respectively. As the number of transfers must be a positive integer, the unlocking zone for the carbon reduction potential of urban cross-river transportation is adjusted to range from MTS = 1 to MTS = 3, with corresponding carbon reduction potential values of 17.29% and 3.11% respectively. Similarly, the unlocking zone for the carbon reduction potential of urban non-cross-river transportation is situated between MTS = 0.22 and MTS = 1.20, equivalent to 0 and 2 transfers, so the unlocking zone for the carbon reduction potential of urban non-cross-river transportation is adjusted to range from MTS = 0 to MTS = 2, with corresponding carbon reduction potential values of 15.21% and 2.63% respectively. Thus, there is no need to enforce zero transfers for river-crossing public transportation, because the difference in the value of cross-river transportation carbon reduction potential between 0-transfer and 1-transfer is only 1.34 percentage points, but when the number of transfers is 2, the value of cross-river transportation carbon reduction potential will drop by 7.75 percentage points, and when the number of transfers is 3, the value of cross-river transportation carbon reduction potential will continue to drop by 6.43 percentage points, so when residents’ maximum acceptable transfer strength for public transportation travel is increased from 1 to 3, the urban cross-river transportation carbon reduction potential in Wuhan will be unlocked at a quicker rate.
Based on the aforementioned information, MCS = 1.05, MDS = 0.99 and MTS = 1 are the initial critical values of the unlocking zone in the fitted curves shown in Figures 13A–C respectively, and MCS = 2.14, MDS = 1.29 and MTS = 3 are the final critical values of the unlocking zone in the fitted curves shown in Figures 13A–C respectively. Therefore, the carbon reduction potential value corresponding to the initial critical scenario MCS = 1.05, MDS = 0.99, and MTS = 1 in the unlocking zone is defined as the initial unlocking value, denoted as IUV, and the carbon reduction potential value corresponding to the final critical scenario MCS = 2.14, MDS = 1.29, and MTS = 3 in the unlocking zone is defined as the final unlocking value, denoted as FUV. According to the calculation, the IUV = 19.1% and the FUV = 9.5% of the urban cross-river transportation carbon reduction potential in Wuhan. The determination of IUV, FUV, and their respective critical scenarios can assist city managers to assess the urban cross-river transportation carbon reduction potential as a whole and the extent to which the urban cross-river transportation carbon emissions may be reduced after relevant optimization measures are implemented.
Evaluation and comparison of carbon reduction potential for river-crossing passages in Wuhan
Section 4.2 of this paper provides a comprehensive evaluation of the carbon reduction potential of urban cross-river transportation in Wuhan. However, the findings do not capture the variations in carbon reduction potential across different regions of the city. The crucial aspect of cross-river transportation lies in the river-crossing passages, as they serve as convergence points for all the city’s river-crossing traffic flows. Consequently, when conducting a zoning evaluation of the carbon reduction potential in urban cross-river transportation, it is more advantageous to adopt river-crossing passages as the basis for regional division rather than relying on urban administrative divisions (Martins et al., 2019b; Wang et al., 2022) or geographic grids (Li X. et al., 2020). This approach is justified by the fact that identifying the variations in carbon reduction potential among urban river-crossing passages aids in optimizing the allocation of transportation resources specific to each river-crossing passage.
As mentioned above and considering that the travel volume across the Yangtze River in Wuhan is far more than that across the Han River, this section selected the vehicle passages across Yangtze River in the urban area of Wuhan, and then calculated their carbon reduction potential values in each combined scenario based on the traffic flow OD data of each river-crossing vehicle passages, and finally the carbon reduction potential of each river-crossing vehicle passage was compared and analyzed. There are eight vehicle passages across Yangtze River located in the urban area of Wuhan, from north to south, they are four passages connecting Hankou and Wuchang including the Erqi Yangtze River Bridge, Wuhan Yangtze River Second Bridge, Wuhan Yangtze River Highway and Railway Tunnel, and Wuhan Yangtze River Tunnel, and four passages connecting Hanyang and Wuchang including the Wuhan Yangtze River Bridge, Yingwuzhou Yangtze River Bridge, Yangsigang Yangtze River Bridge and Baishazhou Bridge. In addition, there are four river-crossing subway lines in the urban area of Wuhan, from north to south, they are Wuhan Metro Line 8, Line 7, Line 2, and Line 4. Among them, Yangsigang Yangtze River Bridge and Baishazhou Bridge are located in the peripheral area of Wuhan, Yingwuzhou Yangtze River Bridge and Erqi Yangtze River Bridge are located in the critical area between the center and the periphery in Wuhan, and other river-crossing passages are located in the central area of Wuhan. (Figure 15). Since subway travel is inherently low-carbon, the traffic flow of subway crossings is individually assigned to the river-crossing vehicle passages that would be utilized if subway travel were replaced with driving. As a result, all 1,757 traffic flows crossing the Yangtze River in this survey were allocated to the eight vehicle passages across the river within the urban area of Wuhan.
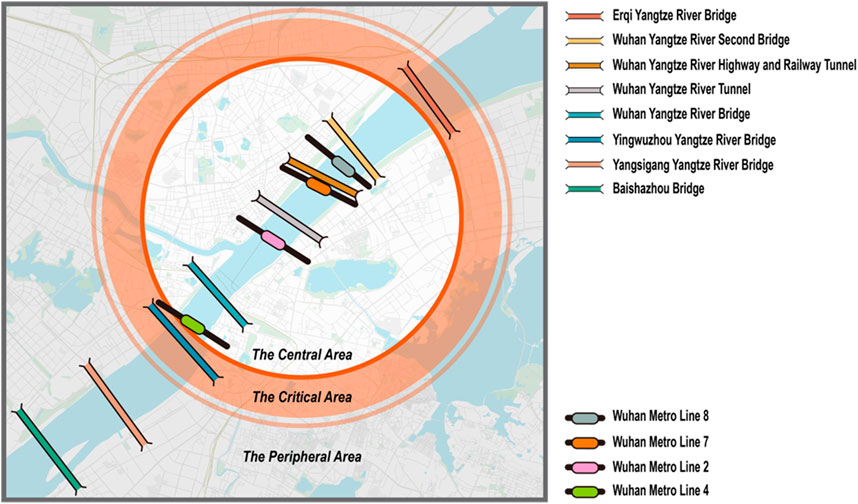
Figure 15. The river-crossing passages and regional division in urban area of Wuhan.
Calculating the
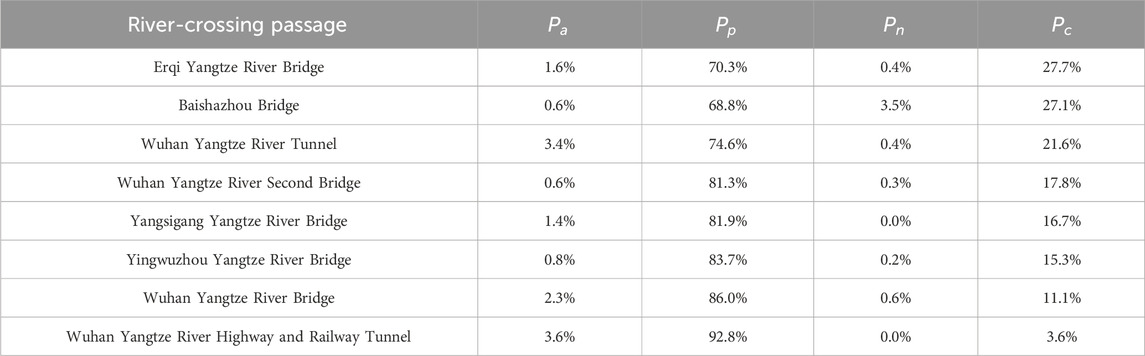
Table 4. The
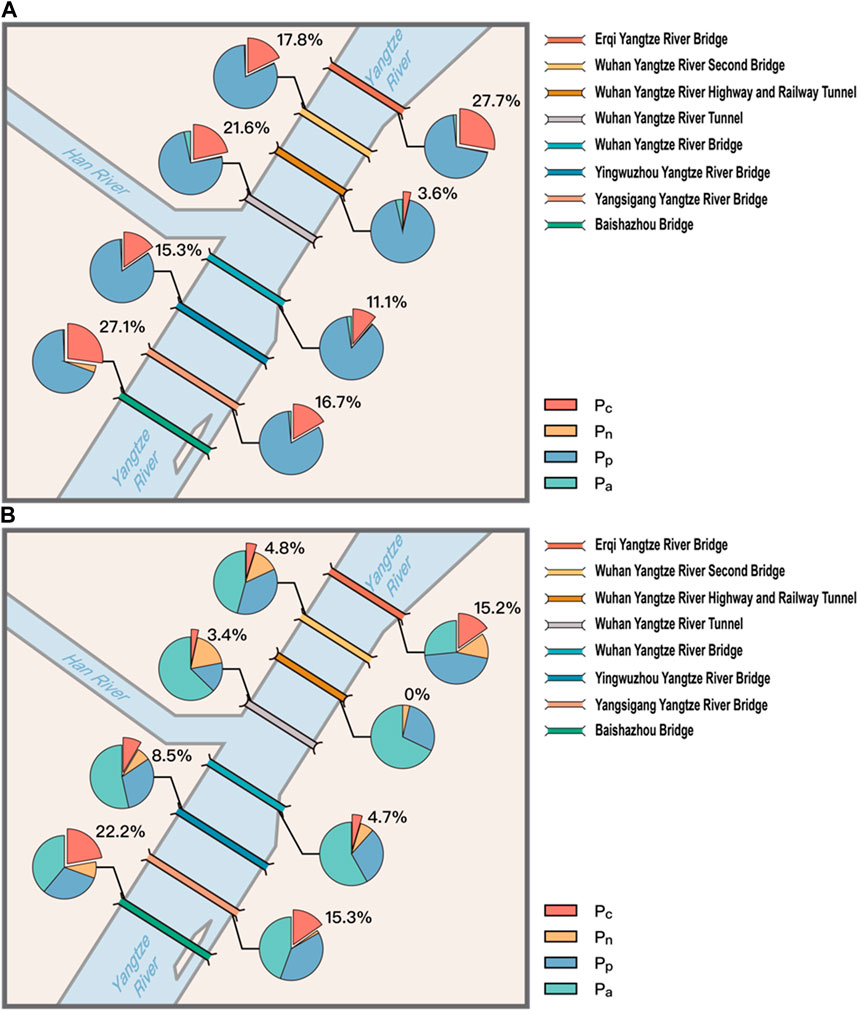
Figure 16. (A) Proportions of
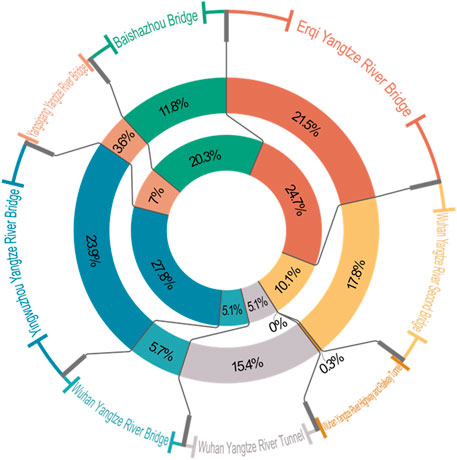
Figure 17. The WCV values of the vehicle passages across Yangtze River in the urban area of Wuhan: the inner circle is at the initial critical scenario, and the outer circle is at the final critical scenario.
The analysis presented in Tables 4, 5, Figure 16 demonstrates that the river-crossing passages located in the peripheral areas of Wuhan exhibit a considerably greater potential for carbon reduction compared to those in the central areas. Notably, the Erqi Yangtze River Bridge at the northernmost point attains the highest
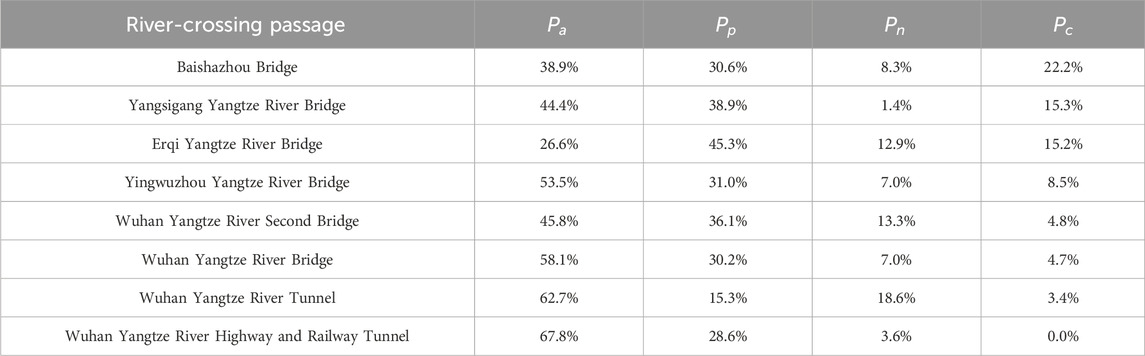
Table 5. The
In contrast to the peripheral areas of Wuhan, the central areas have a dense bus network and an extensive array of public transportation routes, providing residents with diverse travel options, so driving is frequently not the most cost-effective and convenient mode of transportation. In the central areas of Wuhan, when there is a high degree of substitutability between public transportation and driving, the carbon reduction potential of the river-crossing vehicle passages tends to decrease. This phenomenon is observed in cases such as the Wuhan Yangtze River Highway and Railway Tunnel, which serves as a shared tunnel for vehicles and the Wuhan Metro Line 7, resulting in the lowest
The analysis of Tables 4, 5; Figures 16A,B indicates that the river-crossing passages in the peripheral areas of Wuhan exhibit significantly higher carbon reduction potential compared to those in the central areas. By visualizing the data, we found that the analysis reveals a greater disparity in the carbon reduction potential of river-crossing passages between the initial critical scenario and the final critical scenario in the central area of Wuhan compared to the peripheral area. For instance, in the peripheral area of Wuhan, the
Although there is a large difference in the carbon reduction potential of the river-crossing passages in Wuhan, it does not mean that the river-crossing passage with a larger difference of carbon-reducing potential before and after the critical scenario change has a greater actual unlocking of carbon reduction potential, the reason is that the number of traffic flows of different river-crossing passages are completely different, the river-crossing passage with a large difference in carbon reduction potential may have a small amount of traffic flows, and conversely, the river-crossing passage with a small difference in carbon reduction potential may have a large amount of traffic flows. Therefore, in order to compare the relative size of the actual carbon reduction potential can be unlocked of each river-crossing passage in Wuhan after considering the weight of the number of traffic flows, it is defined as the weighted comparable value of the carbon reduction potential of the urban river-crossing passage, and the calculation formula can be expressed as Equation 9:
where
Figure 17 shows the WCV values of the eight vehicle passages across Yangtze River in the urban area of Wuhan in the initial critical scenario and final critical scenario. The WCV values of Yingwuzhou Yangtze River Bridge and Erqi Yangtze River Bridge are obviously on the high side in the initial critical scenario and the final critical scenario. Yingwuzhou Yangtze River Bridge is the most convenient urban expressway from the south of Wuchang to Hanyang and Hankou and is also an important part of the Second Ring Road of Wuhan, its traffic volume is much larger than the other seven vehicle passages across Yangtze River in the urban area of Wuhan, and there is a lack of public transportation in this direction, taking the Wuhan Metro line 4 across Yangtze River to Hankou requires multiple transfers, which consumes much more time than driving. The Erqi Yangtze River Bridge is also a part of the Second Ring Road of Wuhan, and it is also the urban expressway across Yangtze River at the northernmost point of the urban area of Wuhan, since the Wuhan Yangtze River Second Bridge which is closer to the city center has a diversion effect on it, the traffic volume of Erqi Yangtze River Bridge is smaller than that of the Yingwuzhou Yangtze River Bridge, but its
The Yingwuzhou Yangtze River Bridge and the Erqi Yangtze River Bridge are both situated on the Second Ring Road of Wuhan, which serves as the boundary between the central and peripheral areas of the city (“As of 24 November 2024, Wuhan Planning Network - Wuhan, 2019”). Surprisingly, it is observed that the river-crossing passages in Wuhan with the highest WCV values are not located in the urban center or the periphery but in the critical area that lies between these two regions. This critical area exhibits a distinct characteristic of high demand for crossing the Yangtze River, while facing a lack of adequate public transportation routes. Therefore, implementing measures to enhance the feasibility of public transportation across the Yangtze River in this critical area becomes crucial to unlock the carbon reduction potential of urban cross-river transportation in Wuhan. This critical area encompasses the locations where Wuhan Metro lines 11 and 12 cross the Yangtze River three times. However, these lines are currently under construction and not yet operational. It is anticipated that unlocking the carbon reduction potential of Wuhan’s cross-river transportation will be further enhanced upon their completion and opening.
Discussion
This study’s analysis of Wuhan’s urban transportation carbon reduction potential offers valuable insights for cities with similar challenges. Wuhan’s cross-river transportation issues highlight the importance of targeted interventions to address geographic constraints. Aligned with Sustainable Development Goal 11.2 (SDG 11.2) - “By 2030, provide access to safe, affordable, accessible and sustainable transport systems for all, improving road safety, notably by expanding public transport” - this research offers globally applicable solutions. Strategies such as enhancing subway connectivity and reducing transfer barriers, which have proven effective in unlocking low-carbon travel potential, could be equally applicable to other cities confronting natural or infrastructural bottlenecks, such as Istanbul or Bangkok.
The “Connection-Detour-Transfer (CDT)” dynamic assessment framework proposed in this study emphasizes the necessity of understanding local travel behaviors and preferences. By identifying key thresholds for connection, detour, and transfer, city planners can focus on high-impact interventions, ensuring efficient resource allocation and maximizing carbon reduction outcomes. This is particularly relevant for cities with limited budgets, where prioritizing investments in critical corridors or high-demand zones can yield substantial benefits.
Additionally, the methodology’s reliance on basic OD survey data makes it accessible and applicable to cities in low-data environments, such as those in developing regions. Wuhan’s experience further illustrates how optimizing public transit systems and focusing on critical transit corridors can simultaneously address local transportation challenges and align with broader global sustainability goals.
In conclusion, Wuhan serves as a representative case for other cities aiming to transition to low-carbon transportation systems, further aligning with the SDG 11.2 – “Make cities and human settlements inclusive, safe, resilient and sustainable.”. Its approach to identifying and unlocking urban transportation carbon reduction potential offers a replicable model that can inform policy and planning in diverse urban contexts, contributing to global climate change mitigation efforts.
Conclusion and outlook
The evaluation method of urban transportation carbon reduction potential proposed in this study is focuses on the identification of potential non-low-carbon travelers who may be conformed to low-carbon travel, and its proportion in the total travelers is defined as the carbon reduction potential of urban transportation, then the trend of the variation of indicator values with the maximum acceptable connection, detour, and transfer strength values of urban residents for public transportation travel is analyzed and the relationship curve is fitted, and it is revealed that the fitting curve presents an inverse “S” shape, thus the variation trend is divided into “stable zone”, “unlocking zone” and “re-stable zone.” The “unlocking zone” is particularly critical, as it represents the phase where small improvements in transit conditions lead to rapid increases in carbon reduction potential. The most significant innovative contribution of this study lies in breaking through the traditional static evaluation paradigm by pioneering the dynamic evaluation framework of “Connection-Detour-Transfer (CDT),” achieving triple breakthroughs in threshold quantification, spatial analysis, and policy adaptation on both theoretical and practical levels. Based on the CDT dynamic evaluation framework, threshold ranges for connection, detour, and transfer intensities corresponding to the “unlocking zone” have been determined. This enables a quantitative assessment of which intensity of measures can trigger the rapid unlocking of urban transportation’s carbon reduction potential and which intensity will halt this rapid unlocking. Measures to improve public transportation travel conditions are mainly classified into two categories, one is mainly to increase residents’ maximum acceptable connection, detour, and transfer strength for public transportation travel, and the other is mainly to reduce the actual connection, detour, and transfer strength of residents’ public transportation travel. The former includes improving the urban slow-moving traffic environment, optimizing the public transportation riding experience, and improving the convenience of public transportation transfers, etc., while the latter includes adding new public transportation lines, improving public transportation operation plans, and building new public transportation facilities, etc. The implementation of the above measures is based on a large amount of cost input, insufficient cost input cannot obtain expected benefits, and excessive cost input may not be able to obtain matching benefits, while the evaluation method proposed in this study can clarify where the cost input of measures to improve public transportation travel conditions must start and where it can end, this will help city managers formulate precise transportation policies and maximize the unlocking of urban transportation carbon reduction potential at the lowest marginal cost.
This study applied this method to evaluate the carbon reduction potential of cross-river transportation in Wuhan, and found that MCS = 1.05, MDS = 0.99, and MTS = 1 was the initial critical value of the carbon reduction potential unlocking zone of cross-river transportation, and MCS = 2.14, MDS = 1.29, and MTS = 3 was the final critical value of the carbon reduction potential unlocking zone of cross-river transportation, the carbon reduction potential values corresponding to the two are 19.1% and 9.5% respectively. This threshold system can precisely determine the initiation boundary for policy interventions, thereby avoiding inefficient investments. To effectively unlock the carbon reduction potential of Wuhan’s cross-river transportation, the acceptable connection intensity threshold for residents’ cross-river public transport trips must be higher than that for non-cross-river trips. Moreover, when residents’ acceptable detour intensity threshold for public transport increases, the carbon reduction potential of cross-river transportation will unlock more rapidly compared to non-cross-river transportation. Additionally, the strict “zero transfer” requirement for cross-river public transport trips does not further enhance its carbon reduction potential, which differs from the situation for non-cross-river trips. By evaluating the carbon reduction potential of Wuhan’s major vehicular corridors crossing the Yangtze River, the study identified distinct spatial hierarchies—specifically, the peripheral areas of the city exhibit significantly higher carbon reduction potential than the central area, with the differences between the two being more pronounced under the final critical scenario than the initial one. Furthermore, when accounting for the weighted traffic flows of different cross-river corridors, it was found that the critical zone between Wuhan’s central and peripheral areas actually possesses the highest unlockable carbon reduction potential, making it the area most urgently in need of improved public transportation feasibility and convenience. In addition, this study responds in depth to the core demands of the United Nations Sustainable Development Goal (SDG11.2), providing a theoretical foundation for constructing an inclusive, safe, and sustainable transportation system and developing a dedicated potential evaluation template and policy simulator for river network cities.
The “Connection-Detour-Transfer” evaluation method proposed in this study currently focuses primarily on the impact of endogenous constraints within the transportation system to assess the carbon reduction potential of urban transportation. Although it effectively analyzes the interactive mechanisms between travel behavior and infrastructure, it still has its limitations. Residents’ willingness to choose public transport is often influenced by various factors, including exogenous variables such as social development, industrial layout, economic level, and population structure. These factors lie beyond the realm of urban transportation and cannot be addressed solely by improving public transport conditions; therefore, they are not considered in the scope of this study. In addition, factors such as the cost comparison of different travel modes, the experience of riding public transport, urban road congestion, and even the meteorological characteristics of the city also affect residents’ willingness to use public transport. Taking these factors into comprehensive consideration and establishing a more holistic evaluation system for the carbon reduction potential of urban transportation will be the focus of our future work. To enhance the practicality of the proposed method, future work will leverage tools such as ArcGIS and Python to automate and visualize the evaluation system. This will enable non-experts to perform macro-level evaluations through simplified operations, thereby increasing accessibility for local policymakers. Furthermore, comparative studies across different types of cities will be conducted to disseminate the research findings and offer tailored recommendations for carbon reduction strategies in varied urban contexts.
In conclusion, the proposed evaluation framework serves as a strategic tool for policymakers to unlock urban transportation carbon reduction potential. By focusing on key zones, prioritizing resource-efficient measures, and aligning policies with broader sustainability goals, cities can transition toward low-carbon mobility systems while addressing local transportation challenges.
The evaluation method proposed in this study, termed “connect-detour-transfer,” primarily focuses on the impact of endogenous constraints within the transportation system to assess the carbon reduction potential of urban transportation. This serves as a basis for urban transportation planners and managers to implement direct transportation measures, encouraging residents to shift from driving to public transportation, thereby reducing the overall carbon emissions of urban transport. When discussing the factors influencing public transportation willingness, it is essential to consider certain external factors, including socio-economic conditions, industrial layouts, population structures, travel costs, and road congestion. These factors may also influence the residents’ preference for public transportation. However, the impact of these external factors on residents’ willingness to use public transportation is often indirect, and the effectiveness of direct transportation measures taken by urban planners and managers in addressing these issues is limited; hence, they are not considered within the scope of this study.
Therefore, it is emphasized that the evaluation framework includes endogenous factors directly related to urban transportation systems and residents’ willingness to use public transport, ensuring that the evaluation results correspond to policy guidance. Our next focus will be to compare and analyze the effects of various transportation measures in facilitating the unlocking of urban transportation carbon reduction potential areas, as well as to determine the relationship between the costs of these measures and the threshold of unlocking areas. Moreover, we plan to develop the automation and visualization of this assessment system based on ArcGIS and Python. This will assist numerous grassroots managers lacking professional skills by simplifying macro assessments of urban transportation’s carbon reduction potential. Thus, the implementation of this evaluation system can be widely adopted across multiple cities and provide a basis for decision-making regarding transportation carbon reduction targets in various regions.
Data availability statement
The original contributions presented in the study are included in the article/Supplementary Material, further inquiries can be directed to the corresponding authors.
Ethics statement
Ethical review and approval was not required for the study on human participants in accordance with the local legislation and institutional requirements. Written informed consent from the [patients/participants OR patients/participants legal guardian/next of kin] was not required to participate in this study in accordance with the national legislation and the institutional requirements.
Author contributions
RP: Conceptualization, Funding acquisition, Methodology, Resources, Supervision, Writing – original draft. KD: Methodology, Data curation, Formal Analysis, Investigation, Project administration, Software, Validation, Visualization, Writing – review and editing. XL: Data curation, Investigation, Validation, Writing – original draft. KY: Data curation, Investigation, Validation, Visualization, Writing – original draft. XZ: Data curation, Investigation, Visualization, Writing – original draft. WZ: Project administration, Software, Validation, Writing – review and editing.
Funding
The author(s) declare that financial support was received for the research and/or publication of this article. This research was funded by Key Laboratory of Road and Traffic Engineering of the Ministry of Education, Tongji University (Grant K202407), Philosophy and Social Sciences Research Project of Hubei Provincial Department of Education (Grant 24D048), Wuhan Social Science Fund (Post-Funding Program)(Grant 2023004), Hubei Provincial Social Science Fund (Post-Funding Program)(Grant HBSKJJ20243300).
Conflict of interest
The authors declare that the research was conducted in the absence of any commercial or financial relationships that could be construed as a potential conflict of interest.
Generative AI statement
The author(s) declare that no Generative AI was used in the creation of this manuscript.
Publisher’s note
All claims expressed in this article are solely those of the authors and do not necessarily represent those of their affiliated organizations, or those of the publisher, the editors and the reviewers. Any product that may be evaluated in this article, or claim that may be made by its manufacturer, is not guaranteed or endorsed by the publisher.
Supplementary material
The Supplementary Material for this article can be found online at: https://www.frontiersin.org/articles/10.3389/fenvs.2025.1540620/full#supplementary-material
References
Abdelghany, K., Hashemi, H., and Alnawaiseh, A. (2016). Parallel all-pairs shortest path algorithm: network-decomposition approach. Transp. Res. Rec. 2567, 95–104. doi:10.3141/2567-11
Actively and steadily advance carbon peak and carbon neutrality__China Government Website (2023). Available online at: https://www.gov.cn/yaowen/2023-04/06/content_5750183.htm (Accessed February 25, 2025).
Aliari, S., and Haghani, A. (2023). Alternative pickup locations in taxi-sharing: a feasibility study. Transp. Res. Rec. 2677, 1391–1403. doi:10.1177/03611981221104690
Almasi, M. H., Sadollah, A., Kang, S., and Karim, M. R. (2016). Optimization of an improved intermodal transit model equipped with feeder bus and railway systems using metaheuristics approaches. Sustainability 8, 537. doi:10.3390/su8060537
Andong, R. F., and Sajor, E. (2017). Urban sprawl, public transport, and increasing CO2 emissions: the case of Metro Manila, Philippines. Environ. Dev. Sustain. 19, 99–123. doi:10.1007/s10668-015-9729-8
Asitha, K. S., and Khoo, H. L. (2020). Incentivised travel and mobile application as multiple policy intervention for mode shift. KSCE J. Civ. Eng. 24, 3074–3091. doi:10.1007/s12205-020-2325-y
Azolin, L. G., Rodrigues da Silva, A. N., and Pinto, N. (2020a). Incorporating public transport in a methodology for assessing resilience in urban mobility. Transp. Res. Part D Transp. Environ. 85, 102386. doi:10.1016/j.trd.2020.102386
Azolin, L. G., Rodrigues da Silva, A. N., and Pinto, N. (2020b). Incorporating public transport in a methodology for assessing resilience in urban mobility. Transp. Res. Part D Transp. Environ. 85, 102386. doi:10.1016/j.trd.2020.102386
Bagheri, M., Mladenovic, M. N., Kosonen, I., and Nurminen, J. K. (2020). Analysis of potential shift to low-carbon urban travel modes: a computational framework based on high-resolution smartphone data. Sustainability 12, 5901. doi:10.3390/su12155901
Bajaj, G., and Singh, P. (2021). Understanding preferences of Delhi metro users using choice-based conjoint analysis. IEEE Trans. Intell. Transp. Syst. 22, 384–393. doi:10.1109/TITS.2019.2958259
Balya, M. I., and Kumar, R. (2019). Commuters’ attitude analysis of feeder public transit service: a case study. J. Sci. Technol.-Trans. Civ. Eng. 43, 313–321. doi:10.1007/s40996-018-0166-4
Barnett, A., Akram, M., Sit, C. H.-P., Mellecker, R., Carver, A., and Cerin, E. (2019). Predictors of healthier and more sustainable school travel mode profiles among Hong Kong adolescents. Int. J. Behav. Nutr. Phys. Act. 16, 48. doi:10.1186/s12966-019-0807-4
Bi, S., Hu, J., Shao, L., Feng, T., and Appolloni, A. (2024). Can public transportation development improve urban air quality? Evidence from China. Urban Clim. 54, 101825. doi:10.1016/j.uclim.2024.101825
Cai, J., Zhao, Z., Zhou, Z., and Wang, Y. (2024). Predicting the carbon emission reduction potential of shared electric bicycle travel. Transp. Res. Part D Transp. Environ. 129, 104107. doi:10.1016/j.trd.2024.104107
Campisi, T., Garau, C., Ignaccolo, M., Coni, M., Canale, A., Inturri, G., et al. (2021). “A new vision on smart and resilient urban mobility in the aftermath of the pandemic: key factors on European transport policies,” in Computational science and its applications – iccsa 2021 O. Gervasi, B. Murgante, S. Misra, C. Garau, I. Blečić, and D. Taniar (Cham: Springer International Publishing), 603–618. doi:10.1007/978-3-030-87016-4_43
Campisi, T., Russo, A., Basbas, S., Politis, I., Bouhouras, E., and Tesoriere, G. (2023). “Assessing the evolution of urban planning and last mile delivery in the era of E-commerce,” in Smart energy for smart transport (Cham: Springer), 1253–1265. doi:10.1007/978-3-031-23721-8_101
Caprì, S., Ignaccolo, M., Inturri, G., and Le Pira, M. (2016). Green walking networks for climate change adaptation. Transp. Res. Part D Transp. Environ. 45, 84–95. doi:10.1016/j.trd.2015.08.005
Chen, E., Zhang, W., Ye, Z., and Yang, M. (2022). Unraveling latent transfer patterns between metro and bus from large-scale smart card data. IEEE Trans. Intell. Transp. Syst. 23, 3351–3365. doi:10.1109/TITS.2020.3035719
Chen, K., Zhang, G., Wu, H., Mao, R., and Chen, X. (2023). Uncovering the carbon emission intensity and reduction potentials of the metro operation phase: a case study in shenzhen megacity. Int. J. Environ. Res. Public Health 20, 206. doi:10.3390/ijerph20010206
Chen, X., Wang, Y., and Zhang, Y. (2021). A trial-and-error toll design method for traffic congestion mitigation on large river-crossing channels in a megacity. Sustainability 13, 2749. doi:10.3390/su13052749
Chia, J., Lee, J., and Han, H. (2020). How does the location of transfer affect travellers and their choice of travel mode? A smart spatial analysis approach. Sensors 20, 4418. doi:10.3390/s20164418
Chien, Y.-H., Hsieh, I.-Y. L., and Chang, T.-H. (2023). Beyond personal vehicles: how electrifying scooters will help achieve climate mitigation goals in Taiwan. Energy Strategy Rev. 45, 101056. doi:10.1016/j.esr.2023.101056
Ciuffini, F., Tengattini, S., and Bigazzi, A. Y. (2021). Mitigating increased driving after the COVID-19 pandemic: an analysis on mode share, travel demand, and public transport capacity. Transp. Res. Rec. 2677, 154–167. doi:10.1177/03611981211037884
CO2 Emissions in 2023 – Analysis (2024). IEA. Available online at: https://www.iea.org/reports/co2-emissions-in-2023 (Accessed February 26, 2025).
Costa, M., Marques, M., and Moura, F. (2021). A circuity temporal analysis of urban street networks using open data: A Lisbon case study. IJGI 10, 453. doi:10.3390/ijgi10070453
Currie, G., Jain, T., and Aston, L. (2021). Evidence of a post-COVID change in travel behaviour - self-reported expectations of commuting in Melbourne. Transp. Res. Pt. A-Policy Pract. 153, 218–234. doi:10.1016/j.tra.2021.09.009
D’Almeida, L., Rye, T., and Pomponi, F. (2021a). Emissions assessment of bike sharing schemes: the case of Just Eat Cycles in Edinburgh, UK. Sustain. Cities Soc. 71, 103012. doi:10.1016/j.scs.2021.103012
D’Almeida, L., Rye, T., and Pomponi, F. (2021b). Emissions assessment of bike sharing schemes: the case of Just Eat Cycles in Edinburgh, UK. Sust. Cities Soc. 71, 103012. doi:10.1016/j.scs.2021.103012
de Bortoli, A., and Christoforou, Z. (2020). Consequential LCA for territorial and multimodal transportation policies: method and application to the free-floating e-scooter disruption in Paris. J. Clean. Prod. 273, 122898. doi:10.1016/j.jclepro.2020.122898
Deng, L., Gao, W., Fu, Y., and Zhou, W. (2013). Optimal design of the feeder-bus network based on the transfer system. Discrete Dyn. Nat. Soc. 2013, 1–10. doi:10.1155/2013/483682
Diana, M., and Ceccato, R. (2022). A multimodal perspective in the study of car sharing switching intentions. Transp. Lett. 14, 317–323. doi:10.1080/19427867.2019.1707351
Di Martino, A., Longo, M., and Foiadelli, F. (2024). Increasing transportation sustainability from scratch: small city context. Energy Conv. Manag. 304, 118211. doi:10.1016/j.enconman.2024.118211
Ding, L., and Zhang, N. (2017). Estimating modal shift by introducing transit priority strategies under congested traffic using the multinomial logit model. KSCE J. Civ. Eng. 21, 2384–2392. doi:10.1007/s12205-016-0640-0
Ehrenberger, S., Dasgupta, I., Brost, M., Gebhardt, L., and Seiffert, R. (2022). Potentials of light electric vehicles for climate protection by substituting passenger car trips. World Electr. Veh. J. 13, 183. doi:10.3390/wevj13100183
Espino, R., and Roman, C. (2020). Valuation of transfer for bus users: the case of Gran Canaria. Transp. Res. Pt. A-Policy Pract. 137, 131–144. doi:10.1016/j.tra.2020.05.003
Faulhaber, A. K., Hegenberg, J., Kahnt, S. E., Lambrecht, F., Leonhaeuser, D., Saake, S., et al. (2022). Development of a passenger assistance system to increase the attractiveness of local public transport. Sustainability 14, 4151. doi:10.3390/su14074151
Fei, S., and Guo-Ping, J. (2011). Optimal traffic routing strategy based on community structure. Acta Phys. Sin. 60, 078902. doi:10.7498/aps.60.078902
Fuller, D., Gauvin, L., Kestens, Y., Morency, P., and Drouin, L. (2013). The potential modal shift and health benefits of implementing a public bicycle share program in Montreal, Canada. Int. J. Behav. Nutr. Phys. Act. 10, 66. doi:10.1186/1479-5868-10-66
Gan, Z., Yang, M., Zeng, Q., and Timmermans, H. J. P. (2021). Associations between built environment, perceived walkability/bikeability and metro transfer patterns. Transp. Res. Pt. A-Policy Pract. 153, 171–187. doi:10.1016/j.tra.2021.09.007
Gao, K., Shao, M., and Sun, L. (2019). Roles of psychological resistance to change factors and heterogeneity in car stickiness and transit loyalty in mode shift behavior: a hybrid choice approach. Sustainability 11, 4813. doi:10.3390/su11174813
Gao, K., and Sun, L. (2018). Incorporating inertia in mode choice and influential factors of car stickiness: implications for shifts to public transit. Promet 30, 293–303. doi:10.7307/ptt.v30i3.2507
Gebhardt, L., Ehrenberger, S., Wolf, C., and Cyganski, R. (2022). Can shared E-scooters reduce CO2 emissions by substituting car trips in Germany? Transp. Res. Part D Transp. Environ. 109, 103328. doi:10.1016/j.trd.2022.103328
Greenhouse gas emissions interactive dashboard (2022). Available online at: https://www.c40knowledgehub.org/s/article/C40-cities-greenhouse-gas-emissions-interactive-dashboard?language=en_US (Accessed November 7, 2022).
Greenhouse gas reporting (2019). Conversion factors 2019. GOV.UK. Available online at: https://www.gov.uk/government/publications/greenhouse-gas-reporting-conversion-factors-2019.
Heinen, E., Harshfield, A., Panter, J., Mackett, R., and Ogilvie, D. (2017). Does exposure to new transport infrastructure result in modal shifts? Patterns of change in commute mode choices in a four-year quasi-experimental cohort study. J. Transp. Health 6, 396–410. doi:10.1016/j.jth.2017.07.009
Hernandez, S., and Monzon, A. (2016). Key factors for defining an efficient urban transport interchange: users’ perceptions. Cities 50, 158–167. doi:10.1016/j.cities.2015.09.009
Hook, H., De Vos, J., Van Acker, V., and Witlox, F. (2021). Does undirected travel compensate for reduced directed travel during lockdown? Transp. Lett. 13, 414–420. doi:10.1080/19427867.2021.1892935
Hou, X., Lv, T., Xu, J., Deng, X., Liu, F., and Lam, J. S. L. (2023). Electrification transition and carbon emission reduction of urban passenger transportation systems—a case study of Shenzhen, China. Sustain. Cities Soc. 93, 104511. doi:10.1016/j.scs.2023.104511
Hsu, C.-I., and Wang, H.-M. (2016a). Strategies for green transportation while preserving mobility and accessibility: a case study of taipei city. J. Urban Plan. Dev. 142, 04015008. doi:10.1061/(ASCE)UP.1943-5444.0000286
Hsu, C.-I., and Wang, H.-M. (2016b). Strategies for green transportation while preserving mobility and accessibility: a case study of taipei city. J. Urban Plan. Dev. 142, 04015008. doi:10.1061/(ASCE)UP.1943-5444.0000286
Hu, L., and Schneider, R. J. (2015). Shifts between automobile, bus, and bicycle commuting in an urban setting. Dev 141, 04014025. doi:10.1061/(ASCE)UP.1943-5444.0000214
Hussain, E., Bhaskar, A., and Chung, E. (2021). Transit OD matrix estimation using smartcard data: recent developments and future research challenges. Transp. Res. Pt. C-Emerg. Technol. 125, 103044. doi:10.1016/j.trc.2021.103044
Ji, S., Cherry, C. R., Bechle, M. J., Wu, Y., and Marshall, J. D. (2012a). Electric vehicles in China: emissions and health impacts. Environ. Sci. Technol. 46, 2018–2024. doi:10.1021/es202347q
Ji, S., Cherry, C. R., J. Bechle, M., Wu, Y., and Marshall, J. D. (2012b). Electric vehicles in China: emissions and health impacts. Environ. Sci. and Technol. 46, 2018–2024. doi:10.1021/es202347q
Jiang, S., Guan, W., Yang, L., and Zhang, W. (2020). Feeder bus accessibility modeling and evaluation. Sustainability 12, 8942. doi:10.3390/su12218942
Kou, Z., Wang, X., Chiu, S. F., and Cai, H. (2020a). Quantifying greenhouse gas emissions reduction from bike share systems: a model considering real-world trips and transportation mode choice patterns. Resour. Conservation Recycl. 153, 104534. doi:10.1016/j.resconrec.2019.104534
Kou, Z., Wang, X., Chiu, S. F., and Cai, H. (2020b). Quantifying greenhouse gas emissions reduction from bike share systems: a model considering real-world trips and transportation mode choice patterns. Resour. Conserv. Recycl. 153, 104534. doi:10.1016/j.resconrec.2019.104534
Krumdieck, S., Page, S., and Dantas, A. (2010). Urban form and long-term fuel supply decline: a method to investigate the peak oil risks to essential activities. Transp. Res. Part A Policy Pract. 44, 306–322. doi:10.1016/j.tra.2010.02.002
Lee, J. M., and Kim, N. S. (2015). A method to evaluate distance efficiency of Seoul metropolitan subway by estimating subway detour factor. J. Korean Soc. Transp. 33, 304–314. doi:10.7470/jkst.2015.33.3.304
Li, H., Strauss, J., and Liu, L. (2019a). A panel investigation of high-speed rail (HSR) and urban transport on China’s carbon footprint. Sustainability 11, 2011. doi:10.3390/su11072011
Li, X., Zhou, L., Jia, T., Peng, R., Fu, X., and Zou, Y. (2020b). Associating COVID-19 severity with urban factors: a case study of wuhan. IJERPH 17, 6712. doi:10.3390/ijerph17186712
Li, Y., Guo, Y., Lu, J., and Peeta, S. (2019b). Impacts of congestion pricing and reward strategies on automobile travelers’ morning commute mode shift decisions. Transp. Res. Pt. A-Policy Pract. 125, 72–88. doi:10.1016/j.tra.2019.05.008
Liu, D., Rong, W., Zhang, J., and Ge, Y.-E. (2022). Exploring the nonlinear effects of built environment on bus-transfer ridership: take Shanghai as an example. Appl. Sci.-Basel 12, 5755. doi:10.3390/app12115755
Liu, K., Cheng, P., Zhang, A., Qin, S., and Zhang, X. (2025). Beyond environmental sustainability: low-carbon land use policies can contribute to the realization of comprehensive sustainable development. Sustain. Dev. 33, 1315–1332. doi:10.1002/sd.3180
Liu, L., Chen, M., Wang, H., and Liu, B. (2023). How does the Chinese pilot policy on information consumption affect carbon emissions? Sustain. Prod. Consum. 41, 88–106. doi:10.1016/j.spc.2023.07.030
Liu, X., Gao, L., Ni, A., and Ye, N. (2020). Understanding better the influential factors of commuters’ multi-day travel behavior: evidence from Shanghai, China. Sustainability 12, 376. doi:10.3390/su12010376
Liu, Z., Fang, C., Li, H., Wu, J., Zhou, L., and Werner, M. (2024). Efficiency and equality of the multimodal travel between public transit and bike-sharing accounting for multiscale. Sustain. Cities Soc. 101, 105096. doi:10.1016/j.scs.2023.105096
Lu, L., Wang, C., Deng, W., and Bing, X. (2015). An optimal allocation model of public transit mode proportion for the low-carbon transportation. Math. Probl. Eng. 2015, 1–8. doi:10.1155/2015/390606
Martins, M. C. da M., Rodrigues da Silva, A. N., and Pinto, N. (2019a). An indicator-based methodology for assessing resilience in urban mobility. Transp. Res. Part D Transp. Environ. 77, 352–363. doi:10.1016/j.trd.2019.01.004
Martins, M. C. da M., Rodrigues da Silva, A. N., and Pinto, N. (2019b). An indicator-based methodology for assessing resilience in urban mobility. Transp. Res. Part D Transp. Environ. 77, 352–363. doi:10.1016/j.trd.2019.01.004
McQueen, M., MacArthur, J., and Cherry, C. (2020a). The E-Bike Potential: estimating regional e-bike impacts on greenhouse gas emissions. Transp. Res. Part D Transp. Environ. 87, 102482. doi:10.1016/j.trd.2020.102482
McQueen, M., MacArthur, J., and Cherry, C. (2020b). The E-Bike Potential: estimating regional e-bike impacts on greenhouse gas emissions. Environ. 87, 102482. doi:10.1016/j.trd.2020.102482
Meeder, M., and Weidmann, U. (2018). Measuring neighborhood walkability using detour factor distributions. Dev 144, 04018017. doi:10.1061/(ASCE)UP.1943-5444.0000453
Mocanu, T., Joshi, J., and Winkler, C. (2021). A data-driven analysis of the potential of public transport for German commuters using accessibility indicators. Eur. Transp. Res. Rev. 13, 54. doi:10.1186/s12544-021-00507-0
Morelli, A. B., and Cunha, A. L. (2021). Measuring urban road network vulnerability to extreme events: an application for urban floods. Transp. Res. Part D Transp. Environ. 93, 102770. doi:10.1016/j.trd.2021.102770
Navarrete, F. J., and Ortúzar, J. de D. (2013). Subjective valuation of the transit transfer experience: The case of Santiago de Chile. Transp. Policy 25, 138–147. doi:10.1016/j.tranpol.2012.10.006
Ni, Y., and Chen, J. (2020). Exploring the effects of the built environment on two transfer modes for metros: dockless bike sharing and taxis. Sustainability 12, 2034. doi:10.3390/su12052034
Nutanong, S., Tanin, E., Shao, J., Zhang, R., and Kotagiri, R. (2012). Continuous detour queries in spatial networks. IEEE Trans. Knowl. Data Eng. 24, 1201–1215. doi:10.1109/TKDE.2011.52
Owais, M., Ahmed, A. S., Moussa, G. S., and Khalil, A. A. (2021a). Design scheme of multiple-subway lines for minimizing passengers transfers in mega-cities transit networks. Int. J. Rail Transp. 9, 540–563. doi:10.1080/23248378.2020.1846632
Owais, M., Ahmed, A. S., Moussa, G. S., and Khalil, A. A. (2021b). Integrating underground line design with existing public transportation systems to increase transit network connectivity: case study in Greater Cairo. Expert Syst. Appl. 167, 114183. doi:10.1016/j.eswa.2020.114183
Pan, S., Yu, J., Yang, X., Liu, Y., and Zou, N. (2015). Designing a flexible feeder transit system serving irregularly shaped and gated communities: determining service area and feeder route planning. J. Urban Plan. Dev. 141, 04014028. doi:10.1061/(ASCE)UP.1943-5444.0000224
Patalas-Maliszewska, J., and Losyk, H. (2020). Analysis of the development and parameters of a public transport system which uses low-carbon energy: the evidence from Poland. Energies 13, 5779. doi:10.3390/en13215779
Pereira, R. P. T., Ribeiro, G. M., and Filimonau, V. (2017a). The carbon footprint appraisal of local visitor travel in Brazil: A case of the Rio de Janeiro-São Paulo itinerary. J. Clean. Prod. 141, 256–266. doi:10.1016/j.jclepro.2016.09.049
Pereira, R. P. T., Ribeiro, G. M., and Filimonau, V. (2017b). The carbon footprint appraisal of local visitor travel in Brazil: A case of the Rio de Janeiro-São Paulo itinerary. J. Clean. Prod. 141, 256–266. doi:10.1016/j.jclepro.2016.09.049
Ramakrishnan, G. A., Srinivasan, K. K., Mondal, A., and Bhat, C. R. (2021). Joint model of sustainable mode choice for commute, shift potential and alternative mode chosen. Transp. Res. Rec. 2675, 377–391. doi:10.1177/03611981211017908
Roquel, K. I. D., Abad, R. P., and Fillone, A. (2021). Proximity indexing of public transport terminals in metro manila. Sustainability 13, 4216. doi:10.3390/su13084216
Saiyad, G., Srivastava, M., and Rathwa, D. (2022). Assessment of transit accessibility through feeder modes and its influence on feeder mode choice behavior. Arab. J. Sci. Eng. 47, 4483–4497. doi:10.1007/s13369-021-06082-9
Stamos, I., Mitsakis, E., Salanova, J. M., and Aifadopoulou, G. (2015). Impact assessment of extreme weather events on transport networks: a data-driven approach. Transp. Res. Part D Transp. Environ. 34, 168–178. doi:10.1016/j.trd.2014.11.002
Stojanovski, T. (2019). Urban form and mobility choices: informing about sustainable travel alternatives, carbon emissions and energy use from transportation in Swedish neighbourhoods. Sustainability 11, 548. doi:10.3390/su11020548
Strategic Basic Information - Yangtze River Economic Belt (2019). Available online at: https://cjjjd.ndrc.gov.cn/zoujinchangjiang/zhanlue/(Accessed February 25, 2025).
Su, H., Li, M., Zhong, X., Zhang, K., and Wang, J. (2023). Estimating public transportation accessibility in metropolitan areas: a case study and comparative analysis. Sustainability 15, 12873. doi:10.3390/su151712873
Takamatsu, M., and Taguchi, A. (2020). Bus timetable design to ensure smooth transfers in areas with low-frequency public transportation services. Transp. Sci. 54, 1238–1250. doi:10.1287/trsc.2019.0918
Tang, Q., and Du, P. (2020). Study on accessibility of feeder lines with different geometric shapes. J. Adv. Transp. 2020, 1–14. doi:10.1155/2020/4040252
The national motor vehicle fleet has reached 453 million vehicles, and the number of drivers has reached 542 million people - Ministry of Public Security website (2025). Available online at: https://www.mps.gov.cn/n2254314/n6409334/c9939035/content.html (Accessed February 25, 2025).
Tiseo, L. (2025). Global transportation sector CO2 emissions 1970-2023. Available online at: https://www.statista.com/statistics/1291615/carbon-dioxide-emissions-transport-sector-worldwide/.
Venkadavarahan, M., and Marisamynathan, S. (2022). Estimation of rider’s shifting intention for electric bike adoption: an integrated choice and latent variable approach. Transp. Lett. 14, 1151–1161. doi:10.1080/19427867.2021.2000815
Wang, C., Ye, Z., and Wang, W. (2020a). A multi-objective optimization and hybrid heuristic approach for urban bus route network design. IEEE Access 8, 12154–12167. doi:10.1109/ACCESS.2020.2966008
Wang, J., Yan, J., Ding, K., Li, Q., Liu, Y., Liu, X., et al. (2022). A reflection on the response to sudden-onset disasters in the post-pandemic era: a graded assessment of urban transportation resilience taking wuhan, China as an example. Sustainability 14, 10957. doi:10.3390/su141710957
Wang, S., Wang, H., Xie, P., and Chen, X. (2021a). Life-cycle assessment of carbon footprint of bike-share and bus systems in campus transit. Sustainability 13, 158. doi:10.3390/su13010158
Wang, X., Liu, M., Ci, Y., and Yang, Y. (2021b). Effectiveness of driver’s bounded rationality and speed guidance on fuel-saving and emissions-reducing at a signalized intersection. J. Clean. Prod. 325, 129343. doi:10.1016/j.jclepro.2021.129343
Wang, Y., Szeto, W. Y., Han, K., and Friesz, T. L. (2018). Dynamic traffic assignment: a review of the methodological advances for environmentally sustainable road transportation applications. Transp. Res. Part B Methodol. 111, 370–394. doi:10.1016/j.trb.2018.03.011
Wang, Y., Wang, Z., Li, Z., Staley, S. R., Moore, A. T., and Gao, Y. (2013). Study of modal shifts to bus rapid transit in Chinese cities. J. Transp. Eng. 139, 515–523. doi:10.1061/(ASCE)TE.1943-5436.0000523
Weschke, J., Oostendorp, R., and Hardinghaus, M. (2022). Mode shift, motivational reasons, and impact on emissions of shared e-scooter usage. Transp. Res. Part D Transp. Environ. 112, 103468. doi:10.1016/j.trd.2022.103468
Winters, M., Teschke, K., Grant, M., Setton, E. M., and Brauer, M. (2010). How far out of the way will we travel? built environment influences on route selection for bicycle and car travel. Transp. Res. Rec. 2190, 1–10. doi:10.3141/2190-01
World Energy Outlook 2022 – Analysis (2022). IEA. Available online at: https://www.iea.org/reports/world-energy-outlook-2022 (Accessed February 26, 2025).
Wu, P., Li, J., Pian, Y., Li, X., Huang, Z., Xu, L., et al. (2022a). How determinants affect transfer ridership between metro and bus systems: a multivariate generalized Poisson regression analysis method. Sustainability 14, 9666. doi:10.3390/su14159666
Wu, P., Xu, L., Li, J., Guo, H., and Huang, Z. (2022b). Recognizing real-time transfer patterns between metro and bus systems based on spatial–temporal constraints. J. Transp. Eng. Part A Syst. 148, 04022065. doi:10.1061/JTEPBS.0000721
Wuhan (2024). Available online at: https://en.wikipedia.org/wiki/Wuhan (Accessed September 18, 2024).
Wuhan Planning Network - Wuhan (2019). Planning research institute. Available online at: https://web.archive.org/web/20190102050955/http://www.whplan.cn/story/story_13.asp (Accessed February 18, 2023).
Yang, H., Ke, J., and Ye, J. (2018). A universal distribution law of network detour ratios. Transp. Res. Part C Emerg. Technol. 96, 22–37. doi:10.1016/j.trc.2018.09.012
Yang, L., Shang, P., Yao, Y., and Zeng, Z. (2022). A dynamic scheduling process and methodology using route deviations and synchronized passenger transfers for flexible feeder transit services. Comput. Oper. Res. 146, 105917. doi:10.1016/j.cor.2022.105917
Yang, Y., Chen, J., and Du, Z. (2020). Analysis of the passenger flow transfer capacity of a bus-subway transfer hub in an urban multi-mode transportation network. Sustainability 12, 2435. doi:10.3390/su12062435
Ye, P., Deng, Y., Yang, H., and Fan, W. (2023). Transfer penalty estimation of bus passengers considering travel frequency in chengdu, China. Transp. Res. Rec. 2677, 999–1012. doi:10.1177/03611981221110229
Yu, X., Miao, H., Bayram, A., Yu, M., and Chen, X. (2021). Optimal routing of multimodal mobility systems with ride-sharing. Intl. Trans. Op. Res. 28, 1164–1189. doi:10.1111/itor.12870
Zafri, N. M., Khan, A., Jamal, S., and Alam, B. M. (2022). Risk perceptions of COVID-19 transmission in different travel modes. Transp. Res. Interdiscip. Perspect. 13, 100548. doi:10.1016/j.trip.2022.100548
Zgheib, N., Abou-Zeid, M., and Kaysi, I. (2020). Modeling demand for ridesourcing as feeder for high capacity mass transit systems with an application to the planned Beirut BRT. Transp. Res. Part A Policy Pract. 138, 70–91. doi:10.1016/j.tra.2020.05.019
Zhang, L., Long, R., Chen, H., and Yang, T. (2018a). Analysis of an optimal public transport structure under a carbon emission constraint: a case study in Shanghai, China. Environ. Sci. Pollut. Res. 25, 3348–3359. doi:10.1007/s11356-017-0660-4
Zhang, W., Chen, F., Wang, Z., Huang, J., and Wang, B. (2017). Evaluation of carbon emission reductions promoted by private driving restrictions based on automatic fare collection data in Beijing, China. J. Air Waste Manage. Assoc. 67, 1249–1257. doi:10.1080/10962247.2017.1320597
Zhang, W., He, R., Ma, C., and Gao, M. (2018b). Research on taxi driver strategy game evolution with carpooling detour. J. Adv. Transp. 2018, 1–8. doi:10.1155/2018/2385936
Zhang, W., He, R., Xiao, Q., and Ma, C. (2016). Research on strategy control of taxi carpooling detour route under uncertain environment. Discrete Dyn. Nat. Soc. 2016, 1–11. doi:10.1155/2016/4702360
Zhang, X., and Li, N. (2022). Characterizing individual mobility perturbations in cities during extreme weather events. Int. J. Disaster Risk Reduct. 72, 102849. doi:10.1016/j.ijdrr.2022.102849
Zhao, L., Yang, R., Dong, A., Deng, L., Zhu, T., and Wang, J. (2023). Measuring modal accessibility gap using gridded population and network map platform data. Ain Shams Eng. J. 14, 101991. doi:10.1016/j.asej.2022.101991
Zhao, P., Yuan, D., and Zhang, Y. (2022). The public bicycle as a feeder mode for metro commuters in the megacity Beijing: travel behavior, route environment, and socioeconomic factors. Dev 148, 04021064. doi:10.1061/(ASCE)UP.1943-5444.0000785
Zhu, Z., Guo, X., Zeng, J., and Zhang, S. (2017). Route design model of feeder bus service for urban rail transit stations. Math. Probl. Eng. 2017, 1090457. doi:10.1155/2017/1090457
Keywords: urban transportation carbon reduction potential, cross-river transportation, policy-driven carbon mitigation, travel behavior transformation, energy-efficient transportation systems
Citation: Peng R, Ding K, Liu X, Yao K, Zhou X and Zhang W (2025) Unlocking urban transportation carbon reduction potential: a dynamic evaluation of public transit adoption in response to carbon-centric policies. Front. Environ. Sci. 13:1540620. doi: 10.3389/fenvs.2025.1540620
Received: 06 December 2024; Accepted: 16 April 2025;
Published: 13 May 2025.
Edited by:
Le Wen, Auckland University of Technology, New ZealandCopyright © 2025 Peng, Ding, Liu, Yao, Zhou and Zhang. This is an open-access article distributed under the terms of the Creative Commons Attribution License (CC BY). The use, distribution or reproduction in other forums is permitted, provided the original author(s) and the copyright owner(s) are credited and that the original publication in this journal is cited, in accordance with accepted academic practice. No use, distribution or reproduction is permitted which does not comply with these terms.
*Correspondence: Keyuan Ding, a2V5dWFuX2RpbmdAMTYzLmNvbQ==; Wei Zhang, SmFubmV0MjAyNUB3aXQuZWR1LmNu