 Orlando Bhungeni
 Michael Gebreslasie
 Ashadevi Ramjatan
- School of Agricultural, Earth and Environmental Sciences, University of KwaZulu-Natal, Durban, South Africa
Water catchment areas are the key strategic water sources with a variety of ecological benefits. However, the trajectory of Land Cover and Land Use Changes (LULC-C change poses a significant threat to water catchment areas, negatively affecting water quality. Thus, the adoption of remote sensing data and Machine Learning Algorithms (MLAs) is a novel approach that provides spatiotemporal data on the environmental changes resulting from LULC dynamics. Hence, this work harnessed Landsat imageries and the Random Forests (RF) classification as well as a hybrid model from the Multi-Layer Perceptron and Markov chain (MLPNN-Markov) to detect changes in LULC and forecast future changes. At every 5 years interval, the RF model generated more accurate maps for 2003–2023. The LULC prediction for 2019 also produced acceptable values for the kappa accuracy matrices, which were 65.50%, 58.4%, 90.90%, and 0.52 for overall accuracy, kappa location, kappa histogram, and kappa overall, respectively. The findings highlighted the decline of forest areas, with a strong negative correlation with built-up and mining areas. The secondary invasion of the abandoned cropland occupied by grassland members was observed. Thus, grassland displayed increasing trends between 2019 and 2023. Wetlands and water, however, exhibited a steady trend with minor variations. On the other hand, each of these trends persisted in the future, with the exception of grassland areas that displayed scaling-down behaviour in 2032. The outcomes of this work will offer a piece of updated information on the LULC-C and hints at the possible future direction for the trends by 2032. This is crucial to local bodies tasked to protect the integrity of the water catchment areas with the aim of improving the water quality.
1 Introduction
The biophysical attributes of river catchments are important for the health of terrestrial and freshwater ecosystems (Jewitt et al., 2015) and for mitigating the effects of climate change (Abbas et al., 2023; Gyamfi-Ampadu et al., 2021; Mugo et al., 2020). In addition, the catchments provide essential social demands, such as water supply, food, settlement, and recreational opportunities (Kaval, 2019; Mugo et al., 2020; Pullanikkatil et al., 2016). The provision of these services relies on the good health of the ecosystem, physical components such as the river network, and other land resources necessary for the supply of these services. Catchment ecosystems such as that of the uMngeni River Catchment are vulnerable to both natural disasters brought on by climate change and human intrusion (Ruppert et al., 2015).
In view of the health status of river catchment ecosystems, the interference of anthropogenic activities and unprecedented natural disasters are considered the driving forces behind the Land Use and Land Cover Changes (LULC-C) in the catchment areas worldwide (Floreano and de Moraes, 2021; Stosch et al., 2017). Specifically, anthropogenic activities, including settlements, cultivation, timber, and mineral extraction, are among the factors that influence the modifications of catchment landscapes (Pullanikkatil et al., 2016). These catchment land cover modifications are linked to various implications such as water quality, groundwater recharge, wildlife habitat, climate change mitigation, soil conservation, and other catchment ecosystem benefits (Floreano and de Moraes, 2021; Indraja et al., 2024; Mararakanye et al., 2022; Mugo et al., 2020; Pullanikkatil et al., 2016; Yao et al., 2016). According to Mugo et al. (2020), the first step in addressing these environmental issues should focus on understanding the land cover trends and configuration. Therefore, research on LULC monitoring and remote sensing-based forecasting is, therefore, considered a viable approach (Schoeman et al., 2013).
Remote sensing technologies with rich data infrastructures have been the main data source for land cover monitoring studies (Schoeman et al., 2013). Remote sensing provides extensive archives with time-stamped spatiotemporal data, which is crucial for detecting land cover changes in the catchments (Campbell and Wynne, 2011). The LULC-C analysis approaches vary as there is no standard rule for selecting a method (Woldemariam et al., 2022). However, method selection can be influenced by the nature of the remote sensing data, the physical properties of the study area, and the objectives of the study. Consequently, a range of methods in the literature have been employed for land cover change detection. Machine learning, deep learning, Multi-Layer Perceptron Neural Networks (MLPNN), Markov chain and Cellular Automata (CA) are among the prominent methods frequently used in the published work on land cover change detection and prediction.
Mashala et al. (2023) used Landsat series data to analyze the historical LULC in the Letaba watershed in South Africa from 1990 to 2021. The study achieved an overall classification accuracy of 93%–99% across the study periods and found a sharp increase in built-up and shrubs by 47% and 41%, respectively. These increases were at the expense of grassland and indigenous forests. In a similar study, Obaid et al. (2023) assessed spatiotemporal LULC-C between 1986 and 2021 in Vaal Dam Catchment, South Africa, based on Thematic Mapper (L5-TM), Enhanced Thematic Mapper (L7-ETM+), and Operational Land Imager (L8-OLI) with a range overall accuracy of 87%–95% and kappa coefficient ranging from 0.79 to 0.92. They observed a steady expansion of built-up areas from 0.87% to 1.43% during the study period at the cost of woody vegetation. Another study carried out by Mugo et al. (2020), assessed the land cover changes in the Lake Victoria Basin from 1985 to 2014 based on Landsat series data. They reported an 800% increase in built-up and a 90% increase in small farm areas. A study by Aghsaei et al. (2020) used L5-TM and L7-ETM + images to assess the dynamics of the LULC-C in the Anzali wetland catchment, Iraq, between 1990 and 2013. The study revealed the complete degradation of the wetlands, which initially accounted for 2.5% of the catchment area. These losses coincided with the rise of the cropland and the built-up areas. Namugize et al. (2018) conducted a time series analysis of LULC in the Upper uMngeni River catchment, South Africa, between 1994 and 2011. The study highlighted the expansion of both built-up and cropland areas by 6% and 4.5%, respectively, which came at the expense of a 17% loss of vegetation cover during the study period.
Research on land use change detection in the catchment areas is of great importance, not only for monitoring the catchment land cover spatial extents but also as a tool for predicting future LULC scenarios. Studies on the LULC prediction have adopted the hybrid algorithms, to model future land use changes. The primary aim of adopting hybrid algorithms is to compensate for the shortfalls of the land cover modelling algorithms, as each model has its advantages and drawbacks (Hafeez et al., 2019; Loukika et al., 2021). For instance, Moodley et al. (2023) used L5-TM and L8-OLI to create historical LULC maps for 1990 and 2018 and simulated the LULC for 2030 in both the uThukela and uMngeni catchment areas in South Africa using a hybrid model of CA and Markov Chain model (CA- Markov). The outcomes of the predicted land use classes showed slight adjustments in built-up, plantation, and cropland areas, which increased at the expense of grassland areas.
Mandal et al. (2023) modelled the decadal future land cover changes from 2030 to 2050 in the Pare River basin, India. They used a hybrid approach of MLP and CA-Markov models. The input classifications based on the Landsat imagery data (L5-TM and OLI-L8) achieved overall accuracies of 0.91%, 0.85%, and 0.91% with kappa coefficient values of 0.88, 0.82, and 0.89. Their projected maps showed a positive linear relationship between cropland and built-up, while forest land cover experienced a decline by 2050. Maviza and Ahmed, (2020) used a combination of (MLPNN-Markov) to project future LULC scenarios from 2023 to 2038 in the Upper Mzingwane sub-catchment, Zimbabwe. The accuracy of input classifications from L5-TM and L8-OLI were 0.9846%, 0.7763%, and 0.9791–0.6633 for overall accuracy and Kappa coefficient, respectively. Their simulation indicated significant land cover changes in 2038 with a loss of 441 km2 of woodland and an increase of 185 km2 for grassland.
Hybrid models for change detection and land cover forecasting have not only been used in the case of the catchment but also experimented in different scenarios. For example, Adam et al. (2023) modelled future urban scenarios in Maseru city, Lesotho, for 2050. The L5-TM and OLI-based thematic maps with an overall accuracy report of 88% and 95% with ANN-CA were used to produce the prediction maps. The study shows a continuous increase in built-up areas, which is expected to cover 5,434.5 ha by 2050, significantly reducing croplands, grasslands, and woody vegetation. Abbas et al. (2023), conducted a study to project future urban status by 2030 in Islamabad City, Pakistan. Sentinel-2 images and MLPNN-Markov were used to produce prediction maps, indicating that 58.84% of Islamabad will be covered by a built-up, while other LULC classes such as forests are expected to decrease with varying rates. In different a landscape, Floreano and de Moraes (2021) employed the CA- Markov hybrid model and the Landsat imagery to prepare data for forest land cover forecasting in Rondônia, Brazil. The results showed that approximately 30% of the forest areas will be encroached by non-forest land use classes by 2030.
Studies examining past and future land cover in different landscapes have been seen crucial for providing valuable information for planning and policy-making to promote sustainable development. According to the evidence gathered from the literature, there are a limited number of studies that have extended historical land use analysis to predict the future land cover state of the catchment area in South Africa. Therefore, knowledge of the past and future land cover scenarios should be generated for watershed areas as they are the key strategic freshwater sources (Indraja et al., 2024). Such knowledge will serve as a critical tool for developing water catchment management strategies. This study aims to examine the spatial and temporal land use status of the uMngeni River Catchment between 2003 and 2023 at half-decade intervals and project plausible future scenarios for 2032. Our study site, the uMngeni River Catchment, is subject to different forms of landscape modifications rising from both anthropogenic and natural factors (Mauck and Warburton, 2014; Moodley et al., 2023; Schoeman et al., 2013). Factors such as urban expansion, mining, cropland, and unprecedented natural factors such as floods are the main threats to the uMngeni River catchment hydrological integrity. The qualitative and statistical information presented in this study will contribute to the knowledge and understanding of change rates and patterns, providing insight into likely future land cover distribution, which will serve as a foundation for the conservation of water resources. Additionally, the findings have the potential to influence national initiatives aimed at improving the water supply and protecting the catchment areas.
2 Methods and material
2.1 Study area
The current study focuses on the uMngeni River catchment as the selected region of interest. The catchment is located between (29.7156, −29.1349 E) and (31.1137, −29.6383 S) in the KwaZulu Natal (KZN), South Africa. Its estimated total surface area is 4,400 km2, separated into three main regions (upper, middle, and lower) (Hughes et al., 2018). Its landscape exhibits the intricate network of rivers with wavy terrain in the upper riches, whereas moderate slopes and hills define the catchment’s lower regions (Figure 1).
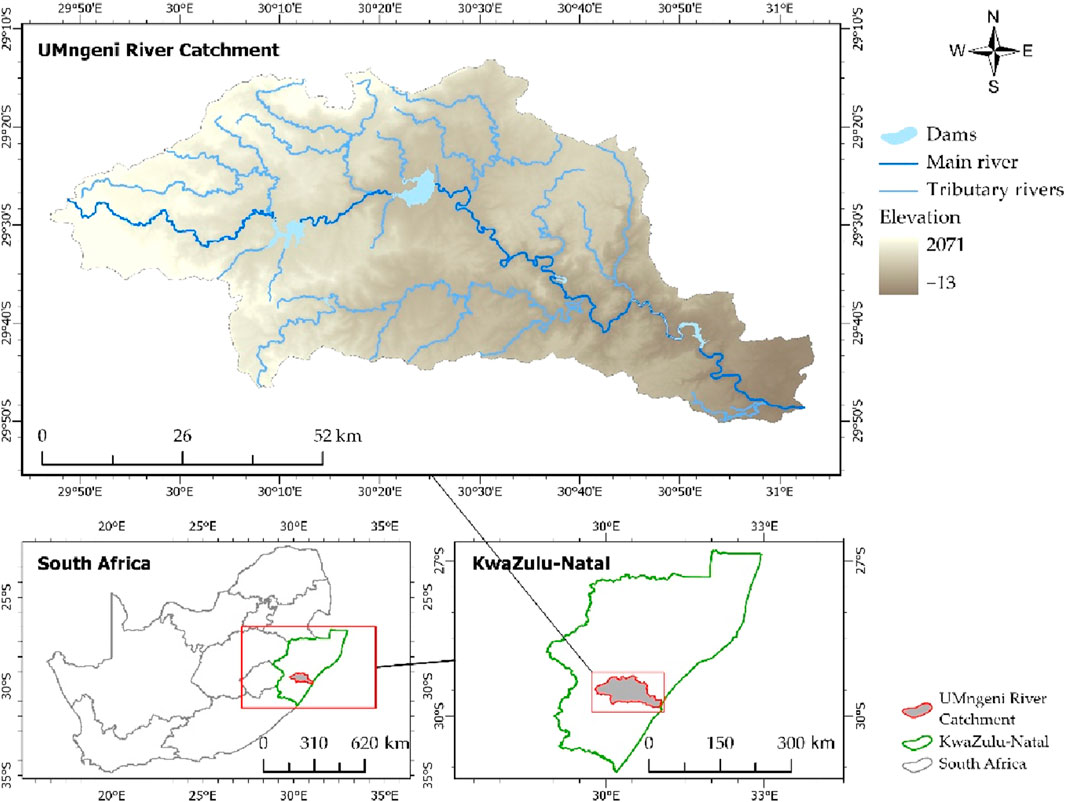
Figure 1. The uMngeni catchment layout with elevation gradients, river network, and dams.
The uMngeni River, the principal river formed by the network of rivers, originates from the Drakensberg and flows through Pietermaritzburg before emptying into the Indian Ocean through the Durban north estuary. This lengthy, meandering river, with major dams (Midmar, Albert Falls, Nagle, and Inanda) along its trail, supplies water for 45% of the people living in the KZN province (Stats, 2011; Namugize et al., 2018). The local climate and watershed topography hold a high stack on the composition of the uMngeni River. The catchment is 1913 m above sea level (Kusangaya et al., 2017), with rainfall occurring during the summer seasons (October to March), ranging from 700 to 1,550 mL and mild temperatures between 12°C and 20°C annually. These features are key factors contributing to the province’s economic growth.
One of South Africa’s major economic centers and main trading port is located in the catchment (Hughes et al., 2018). Accordingly, it contributes up to 65% of KZN’s overall economic output. The province’s Gross Domestic Products also heavily relies on industries such mining, recreation, forestry, and agriculture (Strydom et al., 2020). The catchment is distinguished by a variety of land use types as a result of the previously mentioned industrial and economic activities. Therefore, the consequences of land cover change not only affect economic opportunities but also affect water quality, ecosystems, and climate change. The uMngeni River Catchment was selected as the study area of interest to ensure the continuation of these crucial services.
According to our field observations, the catchment’s land cover categories include but are not limited to, built-up areas, barren ground, wetlands, and water. Green patches, which include forests, plantations, and crops. The uMngeni catchment is dominated by farmland and natural vegetation (Namugize et al., 2018). One of the major land use classes that predominates in the north of the basin is the plantation. Heterogeneous patches of various land use types (plantations and built-up areas) define the middle region. While the lower part is mainly dominated by built-up patches with fragments of green vegetated land cover. It is worth unpacking the information in such diverse land cover areas to provide a piece of updated scientific information.
2.2 Reference data
The geographic reference data for the land use classes was collected in 16 August 2023, randomly using a portable global positioning system (GPS). High-resolution Google Earth Pro archives and historical South African National Land Cover (SANLC) (Department of Forestry, Fisheries and the Environment, 2023) were also used to gain further details on the historical data needed. The following criteria guided the design of the sampling process: sites dispersed across the study site with respect to the area covered by each land use type. Google Earth Engine (GEE) street maps and Google Earth Pro were used to accomplish this. The polygons were digitised based on the land cover type indicated by the point with reference to a time-stamped Google Earth Pro image. The digitised polygons were further imported to the GEE platform and over-traced by locally digitised polygons with unique digital labels for each land use class. Then, the spectral properties of each reference site were extracted from the image using the sampleRegions() function. Two datasets were created from the reference data containing the spectral information: 70% were used for training the models, and 30% were used to interpret the model performances (Table 1). It is also worth noting that the sampling methods were standardized across the six study periods of the uMngeni River catchment.
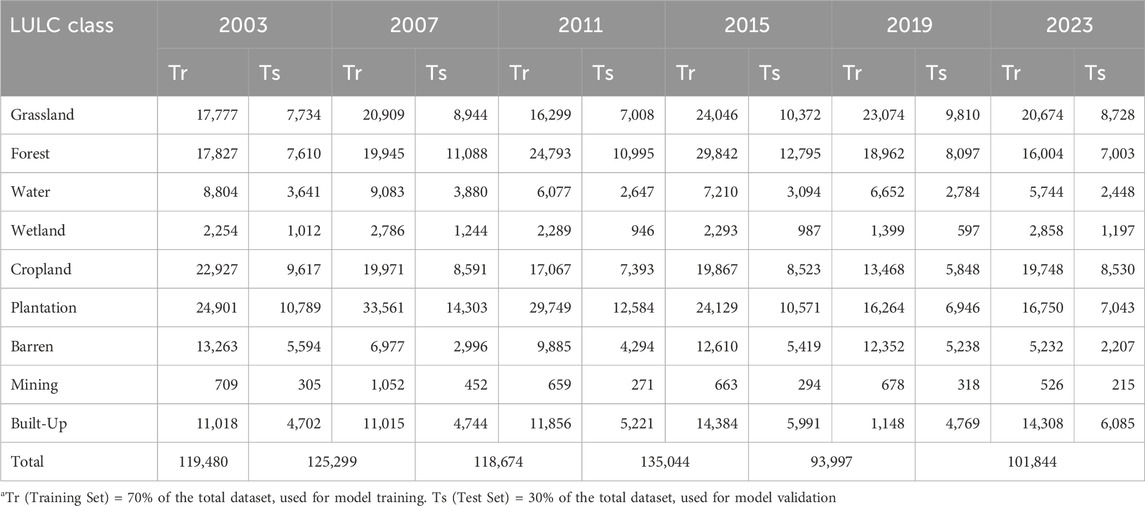
Table 1. Training data distribution for LULC classes across study periodsa.
2.3 Satellite image collection and pre-processing
In the uMngeni River Catchment, LULC-C was examined for six research terms—2003, 2007, 2011, 2015, 2019, and 2023—using Landsat surface reflectance images from the level 2 category. The composite images were collected from the Earth engine cloud data hub (https://developers.google.com/earth-engine/datasets/) accessed on 04 February 2024. A total of 24 scenes were collected during the crop growing season between May and August where the crop fields are distinctive from other Land use classes (Table 2).
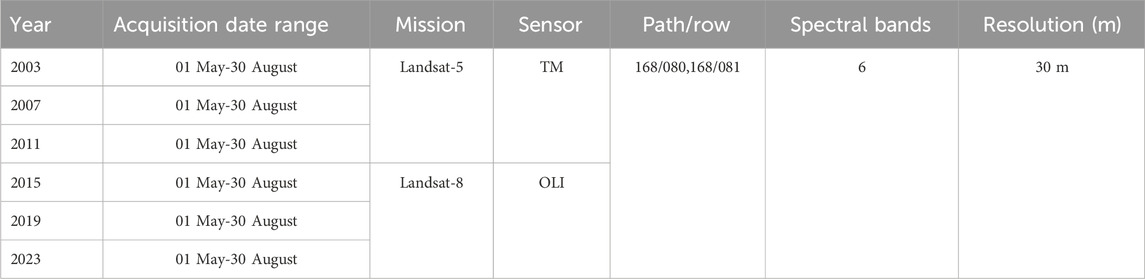
Table 2. Summary of landsat satellite imagery used LULC analysis (2003–2023).
Using a range of GEE functions and filters, the collected datasets underwent several pre-processing steps. The pre-processing of the images was done step-by-step; scenes with less than 10% cloud cover were filtered, and all pixels covered by the cloud and associated cloud shadows were eliminated using the CFmasking function. To restore the halo spaces left by the deleted contaminated pixels, the focal-mean function was applied. Next, a median composite image was created by applying the median() function to the cloud-free dataset tiles using the region of interest (ROI) shapefile as a guide. The subset of the region of interest was then clipped from the median composite image. It is also crucial to mention that the L5-TM image’s horizontal stripes were corrected using the focal-mean method. As explanatory variables, the Normalized difference indexes for vegetation, water, and bare soil were calculated and added to the image.
2.4 Land use classification and accuracy assessment
The GEE cloud computing platform offers a range of supervised Machine Learning algorithms (MLAs) appropriate for land use analysis. Naïve Bayes (NB), Random Forests (RF), Support Vector Machine (SVM), and Artificial Neural Networks (ANN) are some examples of these MLAs. The abilities of these MLAs were attested in mapping the LULC within the uMngeni River catchment (Bhungeni et al., 2024). The RF model performed better than the other algorithms, according to a comparison examination. Numerous MLA comparative research employing RF models in watershed areas have revealed similar outcomes. For instance, Loukika et al. (2021) proved the dominance of the RF model over CART and SVM in their MLA comparative study in the Munneru River Basin, India. Balha et al (2021) reported similar findings in their study conducted in Delhi, India. With this evidence, the RF algorithm was chosen as the suitable MLA to map the historical LULC-C with the uMngeni River catchment.
The RF classifier is a supervised learning algorithm based on the decision tree model, proposed by Breiman in 2001. It constructs an ensemble of decision trees using random subsets of the dataset, created through a process known as bagging (Breiman, 2001). The bagging process generates multiple random sets of samples from the original reference data (also known as bootstrapping). Then multiple decision trees are formed from each set of samples. Each decision tree serves as the electorate, which aids in allocating the unlabelled pixels to the appropriate class (Obaid et al., 2023). The majority results of decision trees is used to determine which class to allocate the pixels to (Mather and Koch, 2011; Zhang et al., 2023). The RF models are known for their capabilities to handle complex datasets, have minimal processing time (Bayas et al., 2022), and are insensitive to outliers and overfitting (Cuypers et al., 2023). The choice of explanatory variables and parameter adjustments is deemed to have a major impact on the model’s performance.
The two primary parameters of the RF models are the number of explanatory variables per split (Mtry) and the number of decision trees to be constructed (Ntree). The “smileRandomForest” classifier from the GEE library was turned as follows: Ntree was equal to 25, Mtry was set to be equal to the square root of variables and each node was adjusted to have two leaves. Six multi-spectral bands (visible, blue, green, and red), NIR, and SWIR (1 and 2) and three additional spectral indices (NDVI, NWDI, and BSI) were among the explanatory features used for the LULC classification for 2003, 2007, 2011, 2015, 2019, and 2023. This combination of predictor variables has been adopted in many studies and proven to provide accurate results (Bhaga et al., 2023; Liu et al., 2022; Zha et al., 2003).
For each research period, we evaluated how well the generated maps corresponded to reality. For the years 2003, 2011, 2015, 2019, and 2023, a subset of 30% of the sample size was used to test the accuracy of the classification results. Using the errorMatrix function in GEE, the test dataset was employed to calculate the confusion matrix and determine the assessment metrics. The assessment metrics used in this study include user’s accuracy (UA), producer accuracy (PA), overall accuracy (OA), and Kappa coefficient (Congalton, 1991).
2.5 Land use change detection
Analysis of land cover changes at five-year intervals from 2003 to 2007, 2007–2011, 2011–2015, 2015–2019, and 2019–2023 was conducted using the Land Change Modeler (LCM), a built-in spatial analysis modeler in TerrSet software, version 2020.
2.6 Predictor variables and transition sub-model development
A given geographic area is not universally suitable for all land use activities. Rather, environmental appropriateness (texture and climate) and social factors (infrastructure developments and legislative limits) dictate the occurrence of land use activity. These indicators are deemed to be effective factors in simulating future land cover scenarios, as they detect the suitability of the different land cover types (Indraja et al., 2024). For these reasons, the Digital Elevation Model (DEM), aspect, slope, and distance from rivers and roads were sourced in the GEE data catalogue and incorporated in Land Change Modeler (LCM) as predictor variables. These predictor variables were imported into ArcGIS Pro 3.0.0 along with time series classifications to ensure the data have similar properties. Once the necessary preprocessing steps were fulfilled, the data was imported to LCM in the TerrSet software to form the part of sub-models. In the transition sub-model tool within LCM, the sub-models were defined based on data from two successive land cover classification periods (t1 and t2) and environmental predictor indicators.
2.7 Transition potential data
The machine learning technique, MLPNN, was leveraged to compute transition potential maps for each of the defined sub-models. The MLPNN is the supervised prominent learning method that proved to effectively handle complex land cover modelling analysis (Pijanowski et at., 2002). The MLPNN model comprises of input layer, a hidden layer, and an output layer. The input layer has neurons that serve as receptor sites for the data from explanatory variables (Clark Labs, 2016). Through channels, they transfer the data to the intermediate phase. Each channel has a numeric value assigned, known as weight, which is a factor of the inputs to be transmitted to the neurons of the intermediate phase (Dahiya et al., 2023). The activation function in the neurons facilitates the non-linearity of the data and identifies the neurons that will contribute to the inputs of the subsequent phase (Wu et al., 2014); all the activated neurons transmit the inputs to the next phase; the process is called forward propagation. The inputs were propagated through the network to the output layer, where the data was classified based on the likelihood of change (Chen, Lin, et al., 2023). The MLPNN model’s optimization for transition potentials was guided by the MLP model, utilizing the default parameters recommended by Clark Labs (2016).
The Model of seven hidden layers driven by the sigmoid activation function was used to generate transition maps for each class in the sub-model based on 50% of 300 random samples and the other half reserved for validation, and 10,000 iterations were set. The produced transition maps are incorporated as the predictor variables in the change prediction phase.
2.8 Transition probability matrix
The Markov Chain Model (Markov) model proposed by Burnham (Burnham, 1973) feeds from the transition potential maps to dictate the likelihood of LULC classi pixel change to classj between two periods (producing two matrices such as transition matrix and transition the probability matrix). The transition areas matrix summarizes pixels of one class to change to all classes, and the probability matrix specifies the transition between two classes (Burnham, 1973). The transition probability matrix is defined in Equation 1
where P represents the transition probability matrix; Pij is the likelihood of one state i to be converted to another state j; Pn represents the state probability term and Pij values range between 0 and 1.
2.9 Land cover prediction
MLPNN, together with the Markov Chain model, have been widely used for predicting future LULC status in the remote sensing field (Indraja et al., 2024; Ozturk, 2015; Soni et al., 2022; Vinayak et al., 2021, Kumar and Agrawal, 2023). These studies proved the efficiency of these algorithms combined in spatial modelling and handling quantitative data. With such evidence, the MLPNN-Markov from the Land Change Modeler (LCM) in the TerrSet 2020 software was used to perform LULC prediction. The LCM requires input data to predict future land use scenarios. GEE and ArcGIS Pro were employed to process historical LULC maps and predictor variables.
The MLPNN-Markov is the integrated model of MLPNN and Markov aiming to improve the modelling results by compensating for the shortfalls of the individual algorithms. In addition, MLPNN-Markov joint operation allows the integration of multiple variables and enhances the scope of the model by including other crucial variables in one model. Making the MLPNN-Markov reliable and efficient in predicting LULC-C changes.
The Markov models exhibit a strong statistical ability to predict probabilities of future land cover, while the MLPNN model learns the historical and land use patterns, which are used as the base information to weigh the transition likelihood among the classes. The main advantages of MLPNN-Markov include its ability to handle the dynamic environment of the complex land use classes and spatial factors, its requirement for less user input, and the ease of setting the parameters and calibration.
2.10 Model validation
Validating the efficiency of the model in LULC prediction is the key aspect to declare the fitness of the model. Hence the MLPNN-Markov model was validated. The prior 2032 LULC prediction, the trial to test the MLPNNN-Markov model was conducted by predicting the 2019 land cover map using 2003 and 2011 classifications. The first step involved series of six trails to select the best predictor variables (Section 2.6) combination. A stepwise approach was used to create a total of six subsets of the predictor variables (Table 5). Then the variable selection was based on the high training accuracy result from the interaction of the model with the subset of the variables. The best combination of the variables was then used to predict 2019 map.
The 2019 prediction was used to validate the efficiency of the model using the Kappa index Agreement (KIA). As the commonly used standard to validate the classification accuracy. KIA feasibility in explaining the agreement between the compared maps has been criticised (Olofsson et al., 2014; Pontius and Millones, 2011). As a result, other researchers recommended the use of the components of agreement and disagreement as part of the validation technique of the results. Hence, this study used 30% of random samples from each LULC class toto compute three unbiased validation kappa indexes, which include correctness (overall accuracy), Kappa histogram, and kappa location, which provide the accuracy of the model in matching the pixel locations. These validation metrics were computed in the MOLUSCE plugin within the QGIS 2.18 environment. The validation module approach is based on the correlation between the input image and the predicted outputmap. The three variants determine the Kappa overall value as shown in Equation 2:
where kappa is the Kappa index agreement, Pa is the actual accuracy, Pe anticipated accuracy, and Pi is the desired accuracy, which is 100%.
3 Results
Historical land cover analysis was undertaken over a 20-year period, with data collected at half-decade laps (2003, 2007, 2011, 2015, 2019, and 2023). Over the last two decades, the interplay among the nine land use classes has been observed within the uMngeni River catchment, as graphically presented in Figures 2, 3.
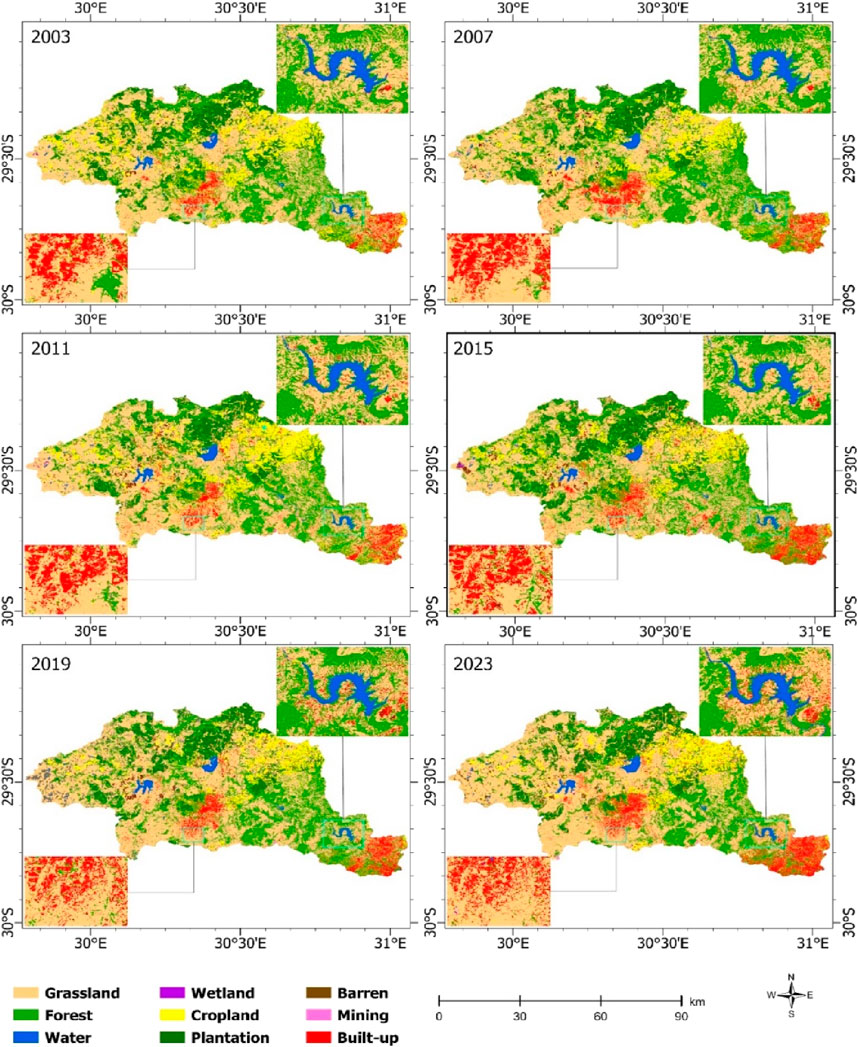
Figure 2. Historical LULC thematic maps from 2003 to 2023.
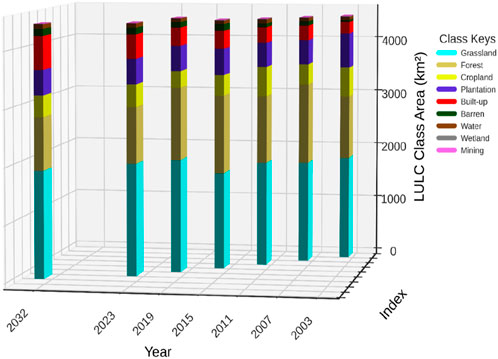
Figure 3. Half-decadal LULC area changes (km2) from 2003 to 2023 and predicted LULC for 2032.
The composition of LULC varied significantly throughout the investigation, according to our findings. In particular, a variety of human activities and natural causes, have transformed native forests, plantations, and farmland. Consequently, native forests experienced a sharp decline (Figure 6) with an estimated loss of 3.18% during the research period, having previously covered 25.60% in 2003 (Table 3).
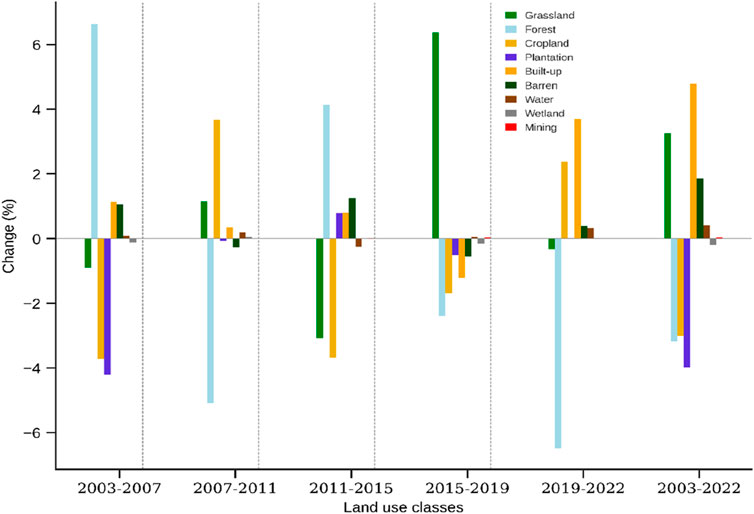
Figure 4. Five-year land use class change (%) from 2003 to 2023.
Throughout the study period, plantation and croplandgradually decreased, from 14% to 10.10% and 12%–8.97%, respectively. In contrast, built-up land has shown notable increases in percentage cover with a strong alarming trend of 0.92 coefficient of determination (R2) (Figure 6). The built-up category showed gradual growth over time, increasing from covering 4.83%–9.6% (Figure 5), which translates to a total of 5.55% gains in 2023 (Table 3).
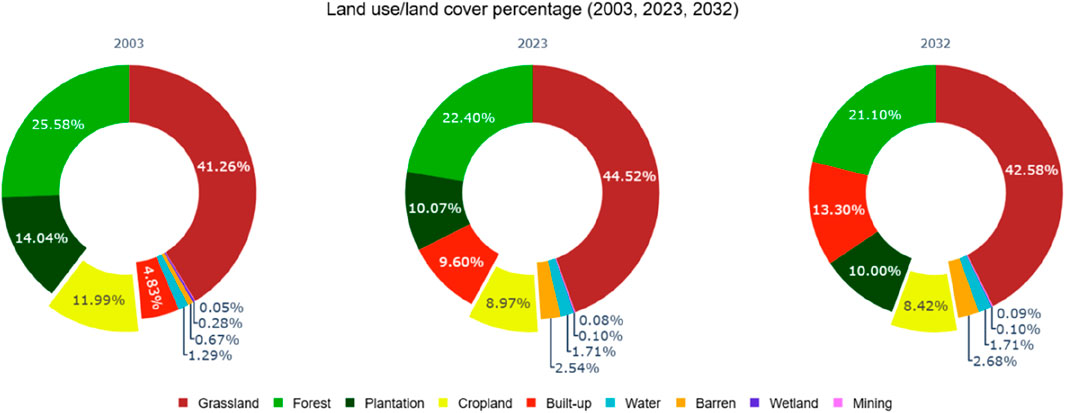
Figure 5. Highlighted percentage change in land use within the uMngeni River catchment for 2003, 2023, and predicted 2032.
Among the primary land use classes in the catchment area, grassland constitutes 44.5% of the catchment. In 2003, it accounted for 41.3% of the total area. Fluctuating patterns were noted between 2003 and 2015 until stability was reached by 2019. A gently increase was noted in bare soil areas, which accounted for 29.71 km2 (0.67%) in 2003 and gradually expanded to 120.17 km2 by 2015, indicating an overall increase of 2.57% by 2023 (Table 3).
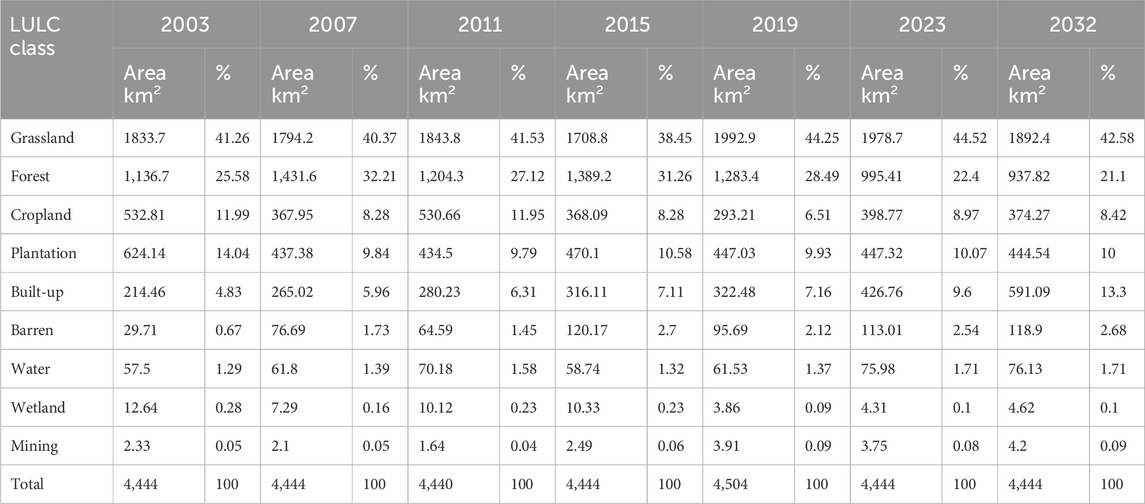
Table 3. Change in land use type coverage (km2 and %) over time (2003–2023).
On the other hand, consistent trends of change with minor variations were recorded for both water and wetland classes, with percentages remaining relatively stable at 0.10% and 1.71% (Table 3), respectively. The mines and quarries class, covering a small portion of the catchment, experienced small area gains over time. It is a constantly positive trend as evidenced in R2 of 0.72 in Figure 6.
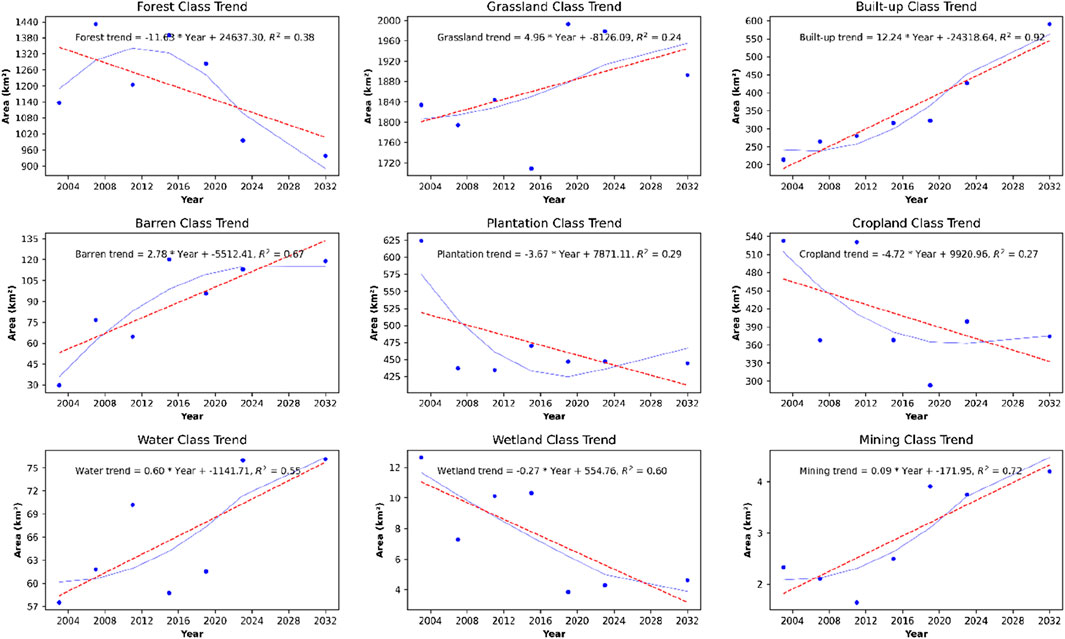
Figure 6. Trend line analysis of LULC changes from 2003 to 2023.
The accuracy of the classified maps was assessed using standard accuracy metrics (Table 4) kappa coefficients recorded were 0.77, 0.78, 0.76, 0.73, 0.75, and 0.76, with corresponding overall accuracies of 80.71%, 82.35%, 80.35%, 77.45%, 80.12%, and 80.33% for the years 2003, 2007, 2011, 2015,2019 and 2023, respectively. The overall accuracy for each map explains closely how the maps produced by the RF model represent the reality on the ground. Achieving an accuracy of 80% or above shows that classifications fall within the classification acceptable standards. Therefore, the six thematic maps produced were deemed suitable for simulating future land use scenarios.
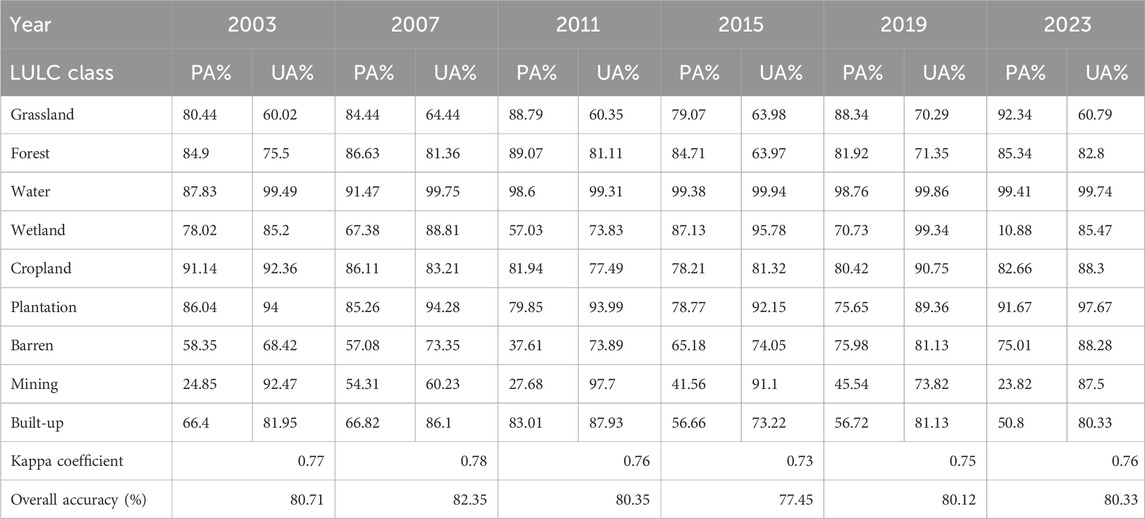
Table 4. Performance metrics for six-period interval LULC maps based on the random forest model.
3.1 Prediction of the LULC scenarios for the year 2032
Trails conducted to determine the best variable combination and prove Trail one as the best variables set at 89.75% training accuracy (Table 5). Integrated with sub-models to produce the transition potential maps later. Based in these results, the MLPNNN-Markov model was adopted to predict future LULC scenarios for 2032.
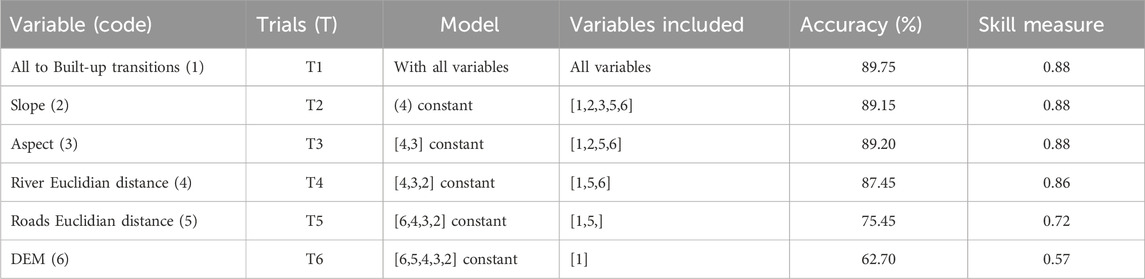
Table 5. Best combination of predictor variables for MLPNN model.
In model all variables were incorporated to produce the transition potential maps and subsequently used to generate a transition probability matrix through the Markov probabilistic approach. Which estimates the probability of one LULC class switching to another, as shown in the probability grid in Table 6.
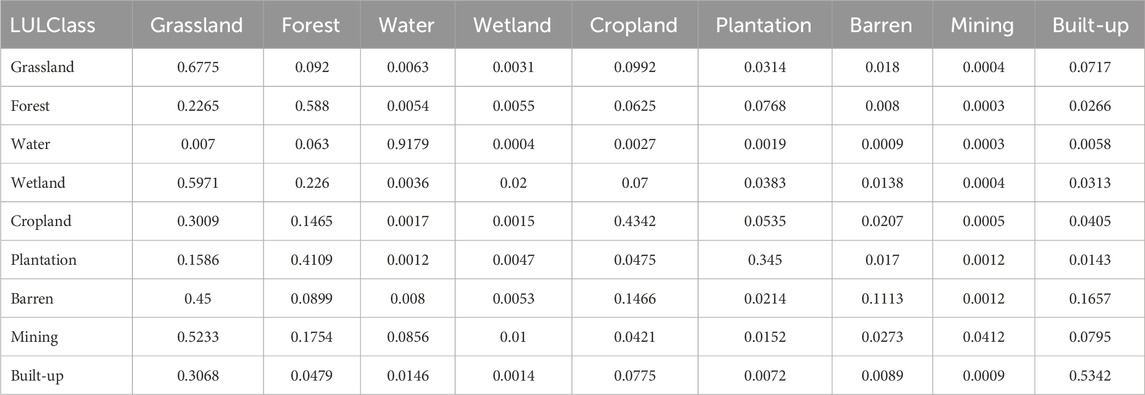
Table 6. Transition probability grid for 2019 LULC prediction based on Trial 1.
The predicted map for 2019 were further validated against the 2019 reference map using the confusion matrix (Table 7). The validation results proved the MLPNN model to be satisfactory for LULC prediction where the overall accuracy: 65.50%, Kappalocation: 58.4%, KappaHistogram: 90.90%., and Kappaoverall and 0.52. The accurate KappaHistogram and overall accuracy for the 2019 prediction were above 90% and 65%, respectively. These are the sufficient scores to declare the model’s fitness for modelling future land cover scenarios (Hua, 2017). This is also supported by the precise pixel weights per LULC class between the 2019 reference and simulated map, as shown in Figure 7, which further reinforces this. These outcomes demonstrated the effectiveness of the MLPNN-Markov hybrid approach in forecasting future LULC.
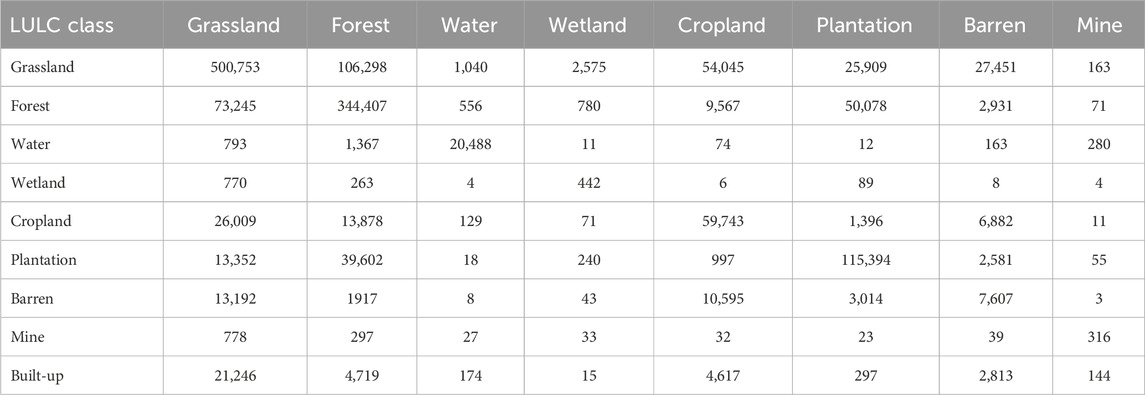
Table 7. Model performance across cross-validation folds for LULC prediction (MLPNN-Markov).
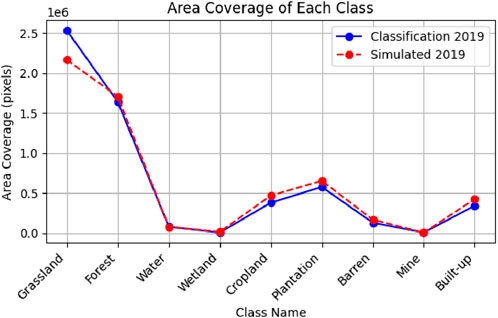
Figure 7. Land use class pixel count for the 2019 reference map and 2019 simulated map.
The predicted LULC map from MLPNN-Markov shows an increase in the built-up arial extent (Figure 8) to 591.09 km2, which accounts for 13.30% of the total catchment area in 2032. These gains explain the declines observed in other projected land use classes, among those classes, forests are expected to decline from 995.41 in 2023 to 937.82 km2 by 2032 (1.30% area cover loss) (Figure 3). On the other hand, grassland will decrease from 1978.7 to 1892.40 km2, which is about 1.94% area cover lost. Other land cover classes showed insignificant area declines, such as cropland covering 8.42 km2, and plantation with a slight decline at 444,54 km2. Water bodies and wetlands show constant trends at 76.13 km2 and 4.62 km2, respectively, while mining and barren show increasing trends with insignificant statistics of 4.20 km2 and 118.90 km2 (Table 3).
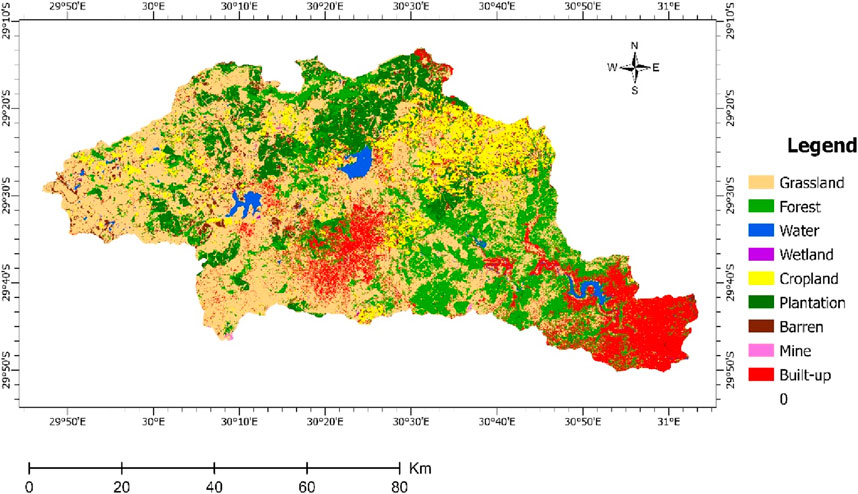
Figure 8. Predicted land use map for 2032.
4 Discussion
Understanding the past, present, and future land use patterns within the catchment area serves as a foundation for decision-making processes. It allows the enactment and implementation of policies aimed at safeguarding the hydrological resources and biodiversity while ensuring the continuous provision of catchment ecological services. The information unpacked is crucial for sustainable management of river catchment resources. It provides detailed information such as trends and interactions among the land use classes. This information helps in the prompt identification and anticipation of threats to the integrity of the catchment areas. Hence, the findings of this research can be used by environmental resource managers to develop effective plans and management strategies for South African river catchments. This was achieved by leveraging rich open remote sensing data alongside advanced statistical algorithms tailored for LULC analysis.
The Landsat series satellites provided useful spatio-temporal data to achieve meaningful results for mapping historical land use activities. The extensive archives of remote sensing data allow researchers to study both past and current conditions, facilitating the generation of knowledge and understanding to better the future. The success of the Landsat series data in mapping temporal LULC-C in different scenarios has been widely observed globally (Mugo et al., 2020). Its contribution to land cover analysis in river catchment biophysical environments is extensively documented. To complement the Landsat imagery, its routine approach for data capturing has facilitated the acquisition of feasible spatial and temporal data for mapping and simulating land use activities within the uMngeni River Catchment. In the mapping process, the multispectral bands (visible, NIR, and SWIR), along with spectral indices such as NDVI, BSI, and NDWI as explanatory variables, were used in the classification. Their respective sensitivity to different land use types enabled the discrimination of land use classes effectively. With such good logistics, it is possible for MLAs like RF to be capable of producing high-quality maps.
The RF model for classification from the GEE library proved its robust performance in accurately delineating and mapping the land use types within the uMngeni River Catchment. This success stems from the RF model’s ability to handle the spectral variations of different land use classes using information contained in the variables (Indraja et al., 2024). In addition, there are several factors that also contributed to the efficiency of the model, which include the inherent design of the classifier and extensive parameter turning, as reported in other studies (Chen, Lin, et al., 2023; Dahiya et al., 2023). Other RF model advantages include proficiency in complex datasets, and its insensitivity to outliers and overfitting, and less sensitivity to different sample sizes (Bhungeni et al., 2024). Due to proficiency results achieved by RF, it was able to unpack the spatiotemporal changes and the interplay among the land use classes at five-year intervals with meaningful results. Such kind of results provided good grounds for the prediction of the future LULC (Soni et al., 2022). Hence, the MLPNN-Markov hybrid yielded reliable results in predicting the future distribution of LULC.
The study found that the uMngeni River catchment has experienced the interplay among the land use classes, leading to observations of spatial changes that occurred at five-year time steps between 2003 and 2023. The changes are distributed across the study area, and significant changes are observed in the middle regions spreading along or from the edges of water bodies, southeast, southwest and southern parts of the catchment. The mobility of change shows the swapping and replacement among the land use classes. These changes have been associated with societal demands and natural factors. In this study, it was also found that both human and natural factors contributed to observed changes within the uMngeni River Catchment.
Human-induced activities such as built-up, growing crops, timber, and mining collectively played a role in land cover dynamics observed in the last 20 years. The built-up class showed a steady increase from period to period and claimed 4.78% of the total catchment by 2023, as Namugize et al. (2018) also reported similar results. It is worth noting that these developments were largely observed in urban outskirts, as Jewitt et al. (2015) made the same observation. This is encouraged by the need for human settlement, industrial facilities (Adam et al., 2023; Mashala et al., 2023), and road construction in rural areas (Abbas et al., 2023; Floreano and de Moraes, 2021; Jewitt et al., 2015; Moodley et al., 2023; Ozturk, 2015) and the sparse traditional layout of rural residences (Adam et al., 2023). Resulting in the modifications of the water catchment landscape (Namugize et al., 2018), which has a critical role in ensuring freshwater availability and mitigating climate change. To address this, focus on containing the urban sprawling should be on the top of the agenda, as suggested by Abbas et al. (2023), Cuypers et al. (2023), and Mugo et al. (2020). Thus, the sparse customary layout of residences in rural areas should be contained by promoting dense settlement, and boundaries for land dedicated to the settlement must be demarcated (National Planning Commission, 2012; Jewitt et al., 2015).
The cropland and barren classes showed haphazard behaviour across the study periods. The unstable tolls of the cropland class are not surprising, as the harvested patches are left bare or undergo pre-planting secondary invasion by herbs and reclaimed later. Similar observations were experienced by the plantation class. As a result, the inversely proportional relationship between these two land cover classes and the barren class is manifested in Figure 3. However, cropland experienced a net loss of 3.02% of its positions between 2003 and 2023. This can be associated with many factors, such as abandoned cropland later reclaimed by grassland and built-up class members (Abbas et al., 2023), as this transition was observed in the southeast of the catchment. On the other hand, plantation areas showed a sharp decline of 4.20% in the period between 2003 and 2007 and were fairly constant from 2007 to 2023. The reduction of the plantation areas by 2007 can be associated with the ceasing of timber plantation licences by the Department of Forestry and Fisheries as per applicable regulations (Jewitt et al., 2015). In addition, cropland made some advancements during this period taking portions covered by plantation patches in the northern part of the catchment. Making them cover 8.97% and 10.10% by 2023, respectively. The balance between these land cover classes, and the integrity of the water quality classes should be maintained. Many studies proved that water quality crisis correlates with the change in land cover (Abdulkareem et al., 2018; Mararakanye et al., 2022; Mugo et al., 2020; Yao et al., 2016).
Among the human-made developments, mines account for a small area cover of the catchment. Taking its total size into account, it made significant expansion between 2003 and 2023, initially covering 2.33 km2 and advancing to 3.75 km by 2023 (0.80%). These results agree with Schoeman et al. (2013), who reported the small Mining area advancement at a national scale. The mines are scattered around the catchment, particularly in the forest banks in the south, and middle regions of the catchment. These are open-cast small sites, starting as a pit and expand both outward and downward concurrently as mining continues. In addition, they are very dynamic environments subject to being filled up with water in the case of heavy rains, with observable bare soil areas resulting from outward advancements. This mobilizes the mine by-products, such as effluents, dust particles and non-point pollutants, which pose a health risk to water biodiversity (Plessis et al., 2014). Its implications on terrestrial and freshwater ecosystems reflect those of the cropland class, as previously discussed. However, mines introduce the residuals of heavy metals, making the environment ill-suitable to sustain life. These human activities are the main drivers behind changes or substitutions of naturally occurring classes like grassland.
The forest has shown a constant decline from period to period with a net loss of 3.18% of area cover by 2023 (Figure 6). These losses coincide with the constant expansion of built-up, these findings are consistent with a number of previous studies (Kang et al., 2021; Jewitt et al., 2015; Mandal et al., 2023; Mashala et al., 2023; Moodley et al., 2023; Namugize et al., 2018; Obaid et al., 2023). The plantation and grassland advancements towards the forest areas observed in the southern regions of the catchment, as illustrated in Figure 2. This also explains the gains of the grassland over the past 20 years, as it initially covered 41.3% and increased to 44.5% by 2023, representing a net increase of 3.26%. Among many contributing factors, grassland is improved by the recovery of previously disturbed land cover, for example, abandoned croplands or pre-planting season herbs invasion, post-built-up vegetation recovery, and deforestation (Jewitt et al., 2015). The relationship between development and forests raise concerns about water security (Abbas et al., 2023; Maviza and Ahmed, 2020) and expose land to harsh climate conditions (Abbas et al., 2023; Gyamfi-Ampadu et al., 2022; Yao et al., 2016). This reduces groundwater recharge and mobilises the non-point pollutants to freshwater bodies. Therefore, the post-development initiative aimed at rehabilitating the disturbed areas should be considered rather than relying on a natural healing method.
Wetlands were constant across the study term, with negligible changes, such findings have been reported in other studies (Mandal et al., 2023; Moodley et al., 2023). While water bodies show a mild increasing trend from 57.5 km2 in 2003 to 75.89 km2, as Moodley et al. (2023) and Namugize et al. (2018) reported similar findings. This can be attributed to the rise in the dam’s water levels, driven by unprecedented annual rainfall linked to climate changeIn addition, the construction of dams and ponds in the west and northeast to retain water for irrigation could have contributed to the area extent of the water bodies.
4.1 LULC projection
The MLPNN-Markov provided insight into the possible future trends of land use changes with acceptable accuracy values. However, it has some limitations, Floreano and de Moraes (2021) highlighted that including only spatial factors in the LULC-C prediction model might lead to the exclusion of other major role players, e.g., socio-economic and political influence in configuration of LULC-C. In addition, the limitation of Landsat data stemming from its 30 m has affected the results obtained by MLPNN-Markov; these findings are in line with (Ozturk, 2015; Soni et al., 2022). Moreover, the inability of the RF model to go beyond the pixel level also played a role in this (Adam et al., 2023).
The half-decadal spatiotemporal analysis has enabled the projection of the future land cover. The results of this work will not only give insight into the possible land cover but also give a heads-up to the water resource managers, enabling them to establish policies to prevent the transpiring water quality issues. Overall, the predicted land cover classes do not vary greatly from the 2023 land cover map. Our results showed that Built-up is expected to increase by 3.7% by 2032. In the southeast, the intensified density in the existing build-up areas, and in the northeast, there is also noticeable scattered built-up, as Moodley et al. (2023) made similar observations. This can stem from a commitment by eThekwini Municipality to build houses for 26% of KZN province dwellers at a rate of 5,000 houses per annum (IDP, 2020). In addition, the South African government aims to upgrade the informal settlement and develop dense townships to reduce urban sprawling by 2030 (National Planning Commission, 2012). Moreover, the scattered developments are encouraged by the construction of road lines in rural areas, as it makes it easy to access the place and resources (Abbas et al., 2023; Jewitt et al., 2015). These projected developments are expected to take place at the cost of natural vegetation and equally affect the water quality, as reported by Plessis et al. (2014).
In 2032, forest and grassland cover classes are expected to surrender 1.30% and 1.94% to other classes, respectively. In particular, these losses are associated with human intrusion. Due to their large area coverage, developments are likely to temper with the natural vegetation. Hence, some patches of these two land cover classes are being replaced by the built-up and mining activities in the middle and the southeast regions. Natural factors like forest encroachment and land degradation stemming from climate change could be the reason for the decline of forest area extent. Other land cover classes showed insignificant area declines, such as cropland covering 8.42 km2, and plantation with a slight decline at 444,54 km2. This decline can be explained by the counter area covered by post-harvest barren soil. However, the bare soil total area cover can also account for partially vegetated areas and fire belts observable in the tip of the western region.
Water bodies and wetlands show constant trends at 76.13 km2 and 4.62 km2, respectively. Notably, water increased about 2 km2 which could be associated with water level variations stemming from climate change as previously discussed. While mining and built-up showed increasing trends with insignificant rates (Table 3). However, the detrimental impact rising from small mining areas is quite concerning. Therefore, an integrated approach should be established to balance the mining development and water quality, as the runoff is more frequent and intensified by climate change.
5 Conclusion
Our study provided insight into the historical land use configurations at half-decade intervals between 2003 and 2023 and elevated the viewpoint for possible future land use cover patterns in the uMngeni River Catchment. The combination of RF and L8-OLI proved to be an effective logistic tool by providing the required data for predicting future land cover. Land cover maps with an overall accuracy of greater than 80%, except in 2007, were produced and subsequently used as the base data for the 2032 prediction using a hybrid MLPNN-Markov model. Prior to the land cover prediction, 2003 and 2011 were used to test the fitness of the MLPNN-Markov model by predicting 2019 land cover classes. The model was approved for the actual simulation as it produced a map that was closely more similar to that of actual 2019, manifested in the Kappahistogram, and overall accuracy, which all were above 65%.
According to the outcomes of RF and MLPNN-Markov, the built-up area cover showed a strong positive trend of 0.92%. These gains occur at the cost of grassland and forest, and this antagonistic relationship is expected to maintain the same pace by 2032. It is also worth highlighting small advancements observed in the mining land use class, as its impact does not match its spatial cover. Plantation and Cropland exhibited mild changes across the study periods. However, holding big stakes of the catchment’s total land coupled with their related environmental impacts.
The findings of this study recommend shifting from the customary layout of rural and township development to overlayed dense buildings with a clear demarcation of urbanized areas. Mining activities should be practiced precisely with the regulations in place aimed at protecting against water contamination. The impact of cultivation and timber industry residuals in the water ecosystems is non-negligible, as spelt out in the literature. Therefore, water resource managers and the agricultural sector must strike a balance between cultivation practices and water sanity. Wetlands and water support life to aquatic species and serve as living systems for natural water purification. Hence, we recommend that their ecological integrity should be prioritised in the planning strategies aimed at the preservation of the catchment natural state.
Overall, our study proved the effectiveness of the RF classification algorithm together with Landsat imagery for unpacking the historical land use scenarios and as a vehicle for meaningful projection results achieved by the MLPNN-Markov Model. The outcomes of this study will not only demonstrate the application of remote sensing and GIS in acquiring the historical LULC underlying data but will also serve as the early detection tool for future LULC scenarios and their accompanying environmental impact. This enables the water resource managers and other local environmental authorities to be on high alert and be able to put preventative measures to change the predicted scenarios. The methods used in the study can also be adapted and implemented in other landscapes to gain a detailed understanding of LULC dimensions and trends. However, it should be noted that 30 m resolution data have reduced the accuracy of the classifications. In addition, the inability of the RF model to go beyond the pixel level also played a role. Therefore, future research should attempt to reproduce the historical satellite data by mimicking the properties (calibration) of high-resolution images such as PlantScope and RapidEye.
5.1 Limitations and recommendations
Two land cover classes with more similar optical properties, for example, mining quarries and tar roads or parking lots, the RF model, struggle to separate and tend to be biased to land use class with the higher training sample allocation.
MLPNN-Markov tends to ignore the scattered customary layout of the rural development and bind the dense development along the provided vector lines (rivers and roads).
MLPNN-Markov has some limitations, as also pointed out by Floreano and de Moraes (2021). The MLPNN-Markov only accommodates spatial factors in the LULC prediction, which might lead to the exclusion of other major role players, e.g., socio-economic and political influence in LULC scenarios.
The secondary invasion of harvested areas by the herbaceous and grass species interferes with the interplay between barren land and cropland, leading to grassland overestimation.
The residential areas with defined tree canopies and green grass open spaces (lawn) partially masked the building structure, causing mixed pixels, making it not guaranteed to award the pixels to the built-up class. The transition zones between the two land parcels tend to possess mixed pixels, as a result of confusing the classifier. Ultimately, impacted the accuracy of the prediction maps.
To enhance the accuracy of the change detection and simulation results, it is recommended the use of high-resolution images in the classification stage. Hence, we propose that future research should attempt to build a model capable of learning the spectral properties of high-resolution images and reproduce the historical satellite data by mimicking those properties of high-resolution imagery data such as PlantScope and RapidEye and comparative work between high-resolution and moderate resolute LULC simulation.
Data availability statement
The raw data supporting the conclusions of this article will be made available by the authors, without undue reservation.
Author contributions
OB: Conceptualization, Data curation, Formal Analysis, Investigation, Methodology, Project administration, Visualization, Writing – original draft, Writing – review and editing. MG: Conceptualization, Funding acquisition Formal Analysis, Methodology, Resources, Supervision, Writing – review and editing. AR: Conceptualization, Methodology, Writing – review and editing.
Funding
The author(s) declare that financial support was received for the research and/or publication of this article. This research was sponsored by the South African National Space Agency (SANSA), postgraduate bursaries 2023, accessed on 3 August 2022 (www.sansa.org.za).
Conflict of interest
The authors declare that the research was conducted in the absence of any commercial or financial relationships that could be construed as a potential conflict of interest.
Generative AI statement
The author(s) declare that no Generative AI was used in the creation of this manuscript.
Publisher’s note
All claims expressed in this article are solely those of the authors and do not necessarily represent those of their affiliated organizations, or those of the publisher, the editors and the reviewers. Any product that may be evaluated in this article, or claim that may be made by its manufacturer, is not guaranteed or endorsed by the publisher.
References
Abbas, H., Tao, W., Khan, G., Alrefaei, A. F., Iqbal, J., Albeshr, M. F., et al. (2023). Multilayer perceptron and Markov chain analysis based hybrid-approach for predicting land use land cover change dynamics with Sentinel-2 imagery. Geocarto Int. 38 (1). doi:10.1080/10106049.2023.2256297
Abdulkareem, J. H., Sulaiman, W. N. A., Pradhan, B., and Jamil, N. R. (2018). Long-term hydrologic impact assessment of non-point source pollution measured through Land Use/Land Cover (LULC) changes in a tropical complex catchment. Earth Syst. Environ. 2 (1), 67–84. doi:10.1007/s41748-018-0042-1
Adam, E., Masupha, N. E., and Xulu, S. (2023). Spatial assessment and prediction of urbanization in Maseru using earth observation data. Appl. Sci. 13 (10), 5854. doi:10.3390/app13105854
Aghsaei, H., Mobarghaee Dinan, N., Moridi, A., Asadolahi, Z., Delavar, M., Fohrer, N., et al. (2020). Effects of dynamic land use/land cover change on water resources and sediment yield in the Anzali wetland catchment, Gilan, Iran. Sci. Total Environ. 712, 136449. doi:10.1016/j.scitotenv.2019.136449
Balha, A., Mallick, J., Pandey, S., Gupta, S., and Singh, C. K. (2021). A comparative analysis of different pixel and object-based classification algorithms using multi-source high spatial resolution satellite data for LULC mapping. Earth Sci. Inform. 14(4), 2231–2247. doi:10.1007/s12145-021-00685-4
Bayas, S., Sawant, S., Dhondge, I., Kankal, P., and Joshi, A. (2022). Land use land cover classification using different ML algorithms on sentinel-2 imagery. Lec. Notes Elec.l Eng., 761–777. doi:10.1007/978-981-19-0840-8_59
Bhaga, T. D., Dube, T., Shekede, M. D., and Shoko, C. (2023). Investigating the effectiveness of Landsat-8 OLI and Sentinel-2 MSI satellite data in monitoring the effects of drought on surface water resources in the Western Cape Province, South Africa. Remote Sens. Appl. Soc. Environ. 32, 101037. doi:10.1016/j.rsase.2023.101037
Bhungeni, O., Ramjatan, A., and Gebreslasie, M. (2024). Evaluating machine-learning algorithms for mapping LULC of the uMngeni catchment area, KwaZulu-natal. Remote Sens. 16 (12), 2219. doi:10.3390/rs16122219
Breiman, L. (2001). Random forests. Mach. Learn. 45, 5–32. Random Forests (springer.com). doi:10.1023/a:1010933404324
Burnham, B. O. (1973). Markov intertemporal land use simulation model. J. Agric. Appl. Econ. 5 (1), 253–258. doi:10.1017/S0081305200011110
Campbell, J. B., and Wynne, R. H. (2011). Introduction to remote sensing. New York, London: Guilford press.
Chen, H., Lin, X., Sun, Y., Wen, J., Wu, X., You, D., et al. (2023). Performance assessment of four data-driven machine learning models: a case to generate sentinel-2 albedo at 10 meters. Remote Sens. 15 (10), 2684. doi:10.3390/rs15102684
Clark Labs (2016). Geospatial and monitoring and modelling system: tutorial. TerrSet Tutorial (clarklabs.org). Available online at: https://www.clarku.edu/centers/geospatial-analytics/terrset/ (Accessed 15 July 2024).
Congalton, R. G. (1991). A review of assessing the accuracy of classifications of remotely sensed data. Remote Sens. Environ. 37 (1), 35–46. doi:10.1016/0034-4257(91)90048-B
Cuypers, S., Nascetti, A., and Vergauwen, M. (2023). Land use and land cover mapping with VHR and multi-temporal sentinel-2 imagery. Remote Sens. 15 (10), 2501. doi:10.3390/rs15102501
Dahiya, N., Gupta, S., and Singh, S. (2023). Qualitative and quantitative analysis of artificial neural network-based post-classification comparison to detect the earth surface variations using hyperspectral and multispectral datasets. J. Appl. Remote Sens. 17 (3). doi:10.1117/1.JRS.17.032403
Department of Forestry, Fisheries and the Environment (2024). South African national land cover datasets. Pretoria Dep. For. Fish. Environ. Available online at: https://egis.environment.gov.za/sa_national_land_cover_datasets (Accessed May 11, 2024).
Floreano, I. X., and de Moraes, L. A. F. (2021). Land use/land cover (LULC) analysis (2009–2019) with Google earth engine and 2030 prediction using markov-CA in the Rondônia state, Brazil. Environ. Monit. Assess. 193 (4), 239. doi:10.1007/s10661-021-09016-y
Gyamfi-Ampadu, E., Gebreslasie, M., and Mendoza-Ponce, A. (2021). Evaluating multi-sensors spectral and spatial resolutions for tree species diversity prediction. Remote Sens. 13 (5), 1033. doi:10.3390/rs13051033
Gyamfi-Ampadu, E., Gebreslasie, M., and Mendoza-Ponce, A. (2022). Multi-decadal spatial and temporal forest cover change analysis of nkandla natural reserve, South Africa. J. Sustain. For. 41 (10), 959–982. doi:10.1080/10549811.2021.1891441
Hafeez, S., Wong, M. S., Ho, H. C., Nazeer, M., Nichol, J., Abbas, S., et al. (2019). Comparison of machine learning algorithms for retrieval of water quality indicators in case-ii waters: a case study of Hong Kong. Remote Sens. 11 (6), 617. doi:10.3390/rs11060617
Hua, A. K. (2017). Land use land cover changes in detection of water quality: a study based on remote sensing and multivariate statistics. J. Environ. Public Health 2017, 1–12. doi:10.1155/2017/7515130
Hughes, C. J., De Winnaar, G., Schulze, R. E., Mander, M., and Jewitt, G. P. W. (2018). Mapping of water-related ecosystem services in the uMngeni catchment using a daily time-step hydrological model for prioritisation of ecological infrastructure investment - part 1: context and modelling approach. Water sa. 44 (4), 577–589. doi:10.4314/wsa.v44i4.07
IDP (2020). eThekwini Integrated Development Plan IDP 2020 - 2021.pdf (durban.gov.za). Available online at: https://durban.gov.za/pages/residents/EThekwini-Integrated-Development-Plan (Accessed 20 July, 2024).
Indraja, G., Aashi, A., and Vema, V. K. (2024). Spatial and temporal classification and prediction of LULC in Brahmani and Baitarni basin using integrated cellular automata models. Environ. Monit. Assess. 196 (2), 117. doi:10.1007/s10661-023-12289-0
Jewitt, D., Goodman, P. S., Erasmus, B. F. N., O’Connor, T. G., and Witkowski, E. T. F. (2015). Systematic land-cover change in KwaZulu-Natal, South Africa: implications for biodiversity. South Afr. J. Sci. 111 (9–10), 9. doi:10.17159/sajs.2015/20150019
Kang, C. S., Kanniah, K. D., and Mohd Najib, N. E. (2021). Google Earth Engine for Landsat image processing and monitoring land use/land cover changes in the Johor River Basin, Malaysia. Int. Geoscience Remote Sens. Symposium (IGARSS), 4236–4239. doi:10.1109/IGARSS47720.2021.9554768
Kaval, P. (2019). Integrated catchment management and ecosystem services: a twenty-five year overview. Ecosyst. Serv. 37, 100912. doi:10.1016/j.ecoser.2019.100912
Kumar, V., and Agrawal, S. (2023). A multi-layer perceptron–Markov chain based LULC change analysis and prediction using remote sensing data in Prayagraj district, India. Environ. Monit. Assess. 195 (5), 619. doi:10.1007/s10661-023-11205-w
Kusangaya, S., Warburton, M., and Archer van Garderen, E. (2017). Use of ACRU, a distributed hydrological model, to evaluate how errors from downscaled rainfall are propagated in simulated runoff in uMngeni catchment, South Africa. Hydrological Sci. J. 62 (12), 1995–2011. doi:10.1080/02626667.2017.1349317
Liu, Y., Meng, Q., Zhang, L., and Wu, C. (2022). NDBSI: a normalized difference bare soil index for remote sensing to improve bare soil mapping accuracy in urban and rural areas. CATENA 214, 106265. doi:10.1016/j.catena.2022.106265
Loukika, K. N., Keesara, V. R., and Sridhar, V. (2021). Analysis of land use and land cover using machine learning algorithms on Google earth engine for Munneru River Basin, India. Sustainability 13 (24), 13758. doi:10.3390/su132413758
Mandal, S., Bandyopadhyay, A., and Bhadra, A. (2023). Dynamics and future prediction of LULC on Pare River basin of Arunachal Pradesh using machine learning techniques. Environ. Monit. Assess. 195 (6), 709. doi:10.1007/s10661-023-11280-z
Mararakanye, N., Le Roux, J. J., and Franke, A. C. (2022). Long-term water quality assessments under changing land use in a large semi-arid catchment in South Africa. Sci. Total Environ. 818, 151670. doi:10.1016/j.scitotenv.2021.151670
Mashala, M. J., Dube, T., Ayisi, K. K., and Ramudzuli, M. R. (2023). Using the Google Earth Engine cloud-computing platform to assess the long-term spatial temporal dynamics of land use and land cover within the Letaba watershed, South Africa. Geocarto Int. 38 (1). doi:10.1080/10106049.2023.2252781
Mather, P. M., and Koch, M. (2011). Computer processing of remotely-sensed images: an introduction. John Wiley and Sons.
Mauck, B. A., and Warburton, M. (2014). Mapping areas of future urban growth in the Mgeni catchment. J. Environ. Plan. Manag. 57 (6), 920–936. doi:10.1080/09640568.2013.775062
Maviza, A., and Ahmed, F. (2020). Analysis of past and future multi-temporal land use and land cover changes in the semi-arid Upper-Mzingwane sub-catchment in the Matabeleland south province of Zimbabwe. Int. J. Remote Sens. 41 (14), 5206–5227. doi:10.1080/01431161.2020.1731001
Moodley, K., Toucher, M. L., and Lottering, R. T. (2023). Simulating future land-use within the uThukela and uMngeni catchments in KwaZulu-Natal. Sci. Afr. 20, e01666. doi:10.1016/j.sciaf.2023.e01666
Mugo, R., Waswa, R., Nyaga, J. W., Ndubi, A., Adams, E. C., and Flores-Anderson, A. I. (2020). Quantifying land use land cover changes in the lake victoria basin using satellite remote sensing: the trends and drivers between 1985 and 2014. Remote Sens. 12 (17), 2829–2917. doi:10.3390/rs12172829
Namugize, J. N., Jewitt, G., and Graham, M. (2018). Effects of land use and land cover changes on water quality in the uMngeni river catchment, South Africa. Phys. Chem. Earth, Parts A/B/C 105, 247–264. doi:10.1016/j.pce.2018.03.013
National Planning Commission (2012). Our future make it work: national development plan 2030. Available online at: https://www.gov.za/sites/default/files/Executive%20Summary-NDP%202030%20-%20Our%20future%20-%20make%20it%20work.pdf (Accessed July 15, 2024).
Obaid, A., Adam, E., and Ali, K. A. (2023). Land use and land cover change in the Vaal Dam catchment, South Africa: a study based on remote sensing and time series analysis. Geomatics 3 (1), 205–220. doi:10.3390/geomatics3010011
Olofsson, P., Foody, G. M., Herold, M., Stehman, S. V., Woodcock, C. E., and Wulder, M. A. (2014). Good practices for estimating area and assessing accuracy of land change. Remote Sens. Environ. 148, 42–57. doi:10.1016/j.rse.2014.02.015
Ozturk, D. (2015). Urban growth simulation of atakum (samsun, Turkey) using cellular automata-Markov chain and multi-layer perceptron-Markov chain models. Remote Sens. 7 (5), 5918–5950. doi:10.3390/rs70505918
Pijanowski, B. C., Brown, D. G., Shellito, B. A., and Manik, G. A. (2002). Using neural networks and GIS to forecast land use changes: a land transformation model. Comput. Environ. Urban Syst. 26(6), 553–575. doi:10.1016/S0198-9715(01)00015-1
Plessis, A. du, Harmse, T., and Ahmed, F. (2014). Quantifying and predicting the water quality associated with land cover change: a case study of the blesbok spruit catchment, South Africa. Electron. J. Theor. Phys. 11 (31), 2946–2968. doi:10.3390/w6102946
Pontius, Jr, R. G., and Millones, M. (2011). Death to Kappa: birth of quantity disagreement and allocation disagreement for accuracy assessment. Int. J. Remote Sens. 32 (15), 4407–4429.
Pullanikkatil, D., Palamuleni, L. G., and Ruhiiga, T. M. (2016). Land use/land cover change and implications for ecosystems services in the Likangala River Catchment, Malawi. Phys. Chem. Earth 93, 96–103. doi:10.1016/j.pce.2016.03.002
Ruppert, J. C., Harmoney, K., Henkin, Z., Snyman, H. A., Sternberg, M., Willms, W., et al. (2015). Quantifying drylands’ drought resistance and recovery: the importance of drought intensity, dominant life history and grazing regime. Glob. Change Biol. 21 (3), 1258–1270. doi:10.1111/gcb.12777
Schoeman, F., Newby, T. S., Thompson, M. W., and Den Berg, V. (2013). South African national land-cover change map. South Afr. J. Geomatics 2 (Issue 2).
Soni, S., Singh, H., Qurashi, J., Shuja, M., Pandey, M., and Arora, A. (2022). Landuse/landcover monitoring and spatiotemporal modelling using multilayer perceptron and ‘multilayer perceptron’-Markov chain ensemble models: a case study of Dausa City, Rajasthan. IOP Conf. Ser. Earth Environ. Sci. 1032 (1), 012028. doi:10.1088/1755-1315/1032/1/012028
Stats, S. A. (2011). Statistics South Africa. Formal. Census 1, 79–106. https//www.statssa.gov.za (accessed April 15, 2025).
Stosch, K. C., Quilliam, R. S., Bunnefeld, N., and Oliver, D. M. (2017). Managing multiple catchment demands for sustainable water use and ecosystem service provision. Water 9 (9), 677. doi:10.3390/w9090677
Strydom, S., Jewitt, G., Savage, M., and Clulow, A. (2020). Long-term trends and variability in the microclimates of the uMngeni Catchment, KwaZulu-Natal, South Africa and potential impacts on water resources. Theor. Appl. Climatol. 140 (3–4), 1171–1184. doi:10.1007/s00704-020-03127-1
Vinayak, B., Lee, H. S., and Gedem, S. (2021). Prediction of land use and land cover changes in Mumbai city, India, using remote sensing data and a multilayer perceptron neural network-based Markov chain model. Sustainability 13 (2), 471. doi:10.3390/su13020471
Woldemariam, G. W., Tibebe, D., Mengesha, T. E., and Gelete, T. B. (2022). Machine-learning algorithms for land use dynamics in Lake Haramaya Watershed, Ethiopia. Model. Earth Syst. Environ. 8 (3), 3719–3736. doi:10.1007/s40808-021-01296-0
Wu, J. L., Ho, C. R., Huang, C. C., Srivastav, A. L., Tzeng, J. H., and Lin, Y. T. (2014). Hyperspectral sensing for turbid water quality monitoring in freshwater rivers: empirical relationship between reflectance and turbidity and total solids. Sensors 14 (12), 22670–22688. doi:10.3390/s141222670
Yao, J., He, X., Chen, W., Ye, Y., Guo, R., and Yu, L. (2016). A local-scale spatial analysis of ecosystem services and ecosystem service bundles in the upper Hun River catchment, China. Ecosyst. Serv. 22, 104–110. doi:10.1016/j.ecoser.2016.09.022
Zha, Y., Gao, J., and Ni, S. (2003). Use of normalized difference built-up index in automatically mapping urban areas from TM imagery. Int. J. Remote Sens. 24 (3), 583–594. doi:10.1080/01431160304987
Keywords: random forest, LULC, landsat, change detection, uMngeni river catchment, South Africa, MLPNN-Markov
Citation: Bhungeni O, Gebreslasie M and Ramjatan A (2025) LULC change detection and future LULC modelling using RF and MLPNN-Markov algorithms in the uMngeni catchment, KwaZulu-Natal, South Africa. Front. Environ. Sci. 13:1543524. doi: 10.3389/fenvs.2025.1543524
Received: 11 December 2024; Accepted: 07 April 2025;
Published: 30 April 2025.
Edited by:
Eduardo Gomes, University of Lisbon, PortugalReviewed by:
Ery Suhartanto, University of Brawijaya, IndonesiaAbijith Devanantham, Indian Institute of Technology Tirupati, India
Obed Fynn, University of Energy and Natural Resources, Ghana
Copyright © 2025 Bhungeni, Gebreslasie and Ramjatan. This is an open-access article distributed under the terms of the Creative Commons Attribution License (CC BY). The use, distribution or reproduction in other forums is permitted, provided the original author(s) and the copyright owner(s) are credited and that the original publication in this journal is cited, in accordance with accepted academic practice. No use, distribution or reproduction is permitted which does not comply with these terms.
*Correspondence: Orlando Bhungeni, b3JsYW5kby5iaHVuZ2Vub0BnbWFpbC5jb20=