 Jingfeng Xu
 Deqin Fan
 Fangzhen Wang
- College of Geoscience and Surveying Engineering, China University of Mining and Technology (Beijing), Beijing, China
Guilin City, located in a typical karst landform area in China, is one of the sustainable development demonstration zones. Evaluating the habitat quality of Guilin City and exploring its driving factors are helpful in formulating effective measures for sustainable development. Based on the Integrated Valuation of Ecosystem Servicesand Tradeoffs (InVEST) model and combined methods such as spatial autocorrelation analysis, Geographical detector model and Geographically weighted regression (GWR) model, this study evaluated the habitat quality of Guilin City from 2001 to 2022. The study also analyzed the spatiotemporal characteristics and their possible driving factors. The results indicate that: (1) The average habitat quality in Guilin City was 0.59, with 47.98% of the area classified as having good or excellent habitat quality; however, habitat quality has shown a downward trend over the past 22 years. (2) Moran’s I values for habitat quality in Guilin City were all greater than 0.8, indicating a significant positive spatial correlation and spatial clustering. Among these, the low–low aggregation regions were the largest, whereas the high–high aggregation regions showed the most significant decrease. (3) Elevation was the most significant factor affecting the spatial differentiation of habitat quality in Guilin. The interactions between various driving factors were stronger than those between any single factor, with most interactions exhibiting a dual-factor enhancement effect. This study highlights the complexity of the comprehensive impact of multiple factors on habitat quality changes and provides a scientific basis and policy recommendations for ecological protection within the national sustainable development agenda’s innovative demonstration zones.
1 Introduction
Against the backdrop of rapid industrialization and urbanization, human activities are compressing ecological spaces such as forests, grasslands, and wetlands, leading to a series of ecological problems such as habitat destruction, sharp declines in biodiversity, ecosystem imbalance, threatening ecosystem vitality, and sustainable economic and social development (Bai et al., 2019; Huo et al., 2023). In 2015, the United Nations proposed 17 Sustainable Development Goals aimed to address social, economic, and environmental development issues. Habitat quality, an important component of the Sustainable Development Goal (SDG15), is the foundation for maintaining regional biological sustainability and has a significant promoting effect on human wellbeing (Hou and Wu, 2024). Therefore, exploring the spatiotemporal characteristics of regional habitat quality and analyzing the impact of various driving factors on the spatial distribution of habitat quality can help relevant departments optimize land use structures and formulate ecological protection policies, which is of great significance for achieving coordinated development between economic growth and ecological protection.
In the context of increasingly important ecological and environmental protection, habitat quality assessment has become a research hotspot for scholars. Currently, there are two main methods for evaluating regional habitat quality: comprehensive evaluation index systems (Li et al., 2024a; Li et al., 2024b) and ecological evaluation models (Zhang et al., 2022). The construction of a comprehensive evaluation system requires extensive data collection, which is time-consuming and challenging, making it suitable for small-scale regional studies. The modeling method has the advantages of low data requirements, visual and intuitive results, and the ability to achieve long-term dynamic monitoring. It can provide more comprehensive and accurate habitat quality evaluation results, such as the Social Values for Ecosystem Services (SolVES) model (Zhang et al., 2021), Habitat Suitability Index (HIS) model (Bhattacharya et al., 2020), and InVEST model (Wei et al., 2024). Among these, the InVEST model achieves a quantitative spatial assessment of habitat quality using land use data. Compared to other models, it has the advantages of high evaluation accuracy, a mature theoretical system, and low data requirements (Wang et al., 2024a). Therefore, it is widely used in ecological environment quality assessment research in different areas, such as urban agglomerations (Han et al., 2024a), provinces (Xiao et al., 2023), cities (Luan et al., 2022), watersheds (Huang et al., 2024a, b), protected areas (Lin et al., 2024), and mountainous areas (Yang, 2021).
Habitat quality is influenced by economic, social, and environmental factors. An in-depth analysis of the interactions and feedback mechanisms among these factors could reveal more complex ecological dynamics. Current research has primarily used geographically weighted regression model (Cao et al., 2024; Chen et al., 2024b), correlation analyses (Mirghaed and Souri, 2021; Yohannes et al., 2021), and geographical detector model (Cui et al., 2022; Li et al., 2023) to explore the impacts of different driving factors on habitat quality. These studies have made significant progress in analyzing the impact of factors such as land use change (Li et al., 2022; Qin et al., 2024), landscape pattern change (Yang et al., 2024; Zhang et al., 2024), urban expansion (Xie and Zhu, 2023; Wu et al., 2024a), and policy interventions (Zheng et al., 2022) on habitat quality. The geographical detector model can detect the interaction of various driving factors, achieve higher accuracy with a small number of samples, and avoid the influence of the multicollinearity of multiple independent variables (Wang and Xu, 2017). GWR model accounts for spatial characteristics when explaining relationships between variables, enabling a more accurate capture of local spatial relationships and spatial heterogeneity (Li et al., 2024a, b). By integrating the Geodetector model and GWR model, the dominant driving factors influencing habitat quality and their spatial heterogeneity can be comprehensively analyzed at both global and local perspectives, further revealing the spatial differentiation patterns of driving mechanisms.
Guilin, an international tourist city and innovative demonstration zone for the national sustainable development agenda (He et al., 2023), offers an environmental evaluation that holds significant guiding value for the sustainable development of Chinese landscape resource cities. Therefore, real-time dynamic monitoring of habitat quality is crucial. However, there is currently limited research on the habitat quality of Guilin City, and the research time interval is long, which may not capture ecological changes and short-term fluctuations in detail. Existing research on the mechanisms of habitat quality change primarily focuses on the impacts of landscape patterns (Wu et al., 2024b) and land use changes (Duan et al., 2024), and the analysis of influencing factors usually focuses on a single aspect of economic, social, and environmental factors (Zhu et al., 2020; Xiang et al., 2023; Han et al., 2024b). There is a lack of analysis on the interactions between these factors and the long-term changes in their impacts. Therefore, based on land use data from 2001 to 2022, this study quantitatively evaluated the habitat quality of Guilin City at 3-year intervals using the InVEST model. By using the spatial autocorrelation analysis, geographical detector model and GWR model, this study analyzed the spatiotemporal characteristics and driving factors of habitat quality in Guilin City over the past 22 years and further revealed the interaction of driving factors to provide a scientific basis for the ecological civilization construction and green development of Guilin City.
2 Study area and data
2.1 Study area
Guilin is located in southern China, in the northeast of Guangxi Zhuang Autonomous Region (109°36′ – 111°29′ E and 24°15′ – 26°23′ N). The city features typical karst landforms and limestone terrain, primarily consisting of mid-mountain or low-mid-mountain landscapes (see Figure 1). Guilin lies within the subtropical monsoon climate zone, with an average annual temperature of approximately 19°C and an average annual precipitation of approximately 1,887.6 mm. The region has abundant forest resources, a wide variety of wildlife species, and a well-preserved ecological environment. In 2022, the permanent population of Guilin was 4.9563 million, with a total GDP of 243.575 billion yuan. Committed to building a world-class tourist city, Guilin attracts a large number of domestic and international visitors with its unique natural landscapes and rich cultural heritage. In 2022, Guilin received 106.9314 million domestic tourists, with a total domestic tourism consumption of 127.739 billion yuan, while international tourism consumption amounted to 7.553 million dollars.
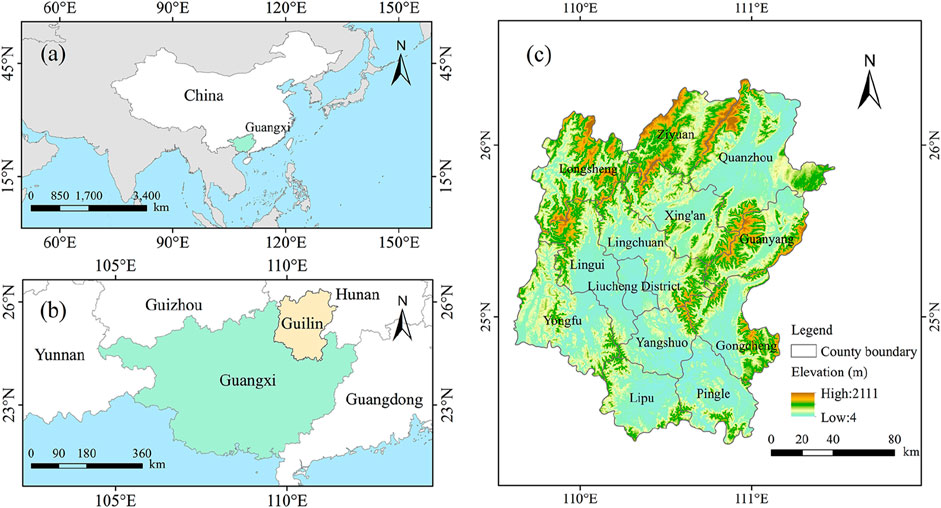
Figure 1. Geographical overview of Guilin City. (a) The location of Guangxi within China; (b) The location of Guilin City within Guangxi; (c) Elevation of Guilin City.
2.2 Study data
2.2.1 Land use data
The land use data used in this study was sourced from the annual China Land Cover Dataset (CLCD), which was published by Professor Yang Jie and Professor Huang Xin from Wuhan University (Yang and Huang, 2021). Compared to MCD12Q1 (Friedl et al., 2010), ESACCI_LC (Bontemps et al., 2015), FROM_GLC (Gong et al., 2013), and GlobeLand30 (Chen et al., 2014), this dataset offers a longer temporal coverage. It has a spatial resolution of 30 m and includes nine land use categories: Cropland, Forest, Shrub, Grassland, Water, Snow/Ice, Barren, Impervious, and Wetland. As of now, the dataset has been updated to 2023. This study selected land use data from eight time points: 2001, 2004, 2007, 2010, 2013, 2016, 2019, and 2022.
2.2.2 Driving factors data
Habitat quality is influenced primarily by a combination of economic, social, and environmental factors. Based on previous studies (Guo et al., 2023; Zhang et al., 2023; Lan et al., 2024; Zhao et al., 2024; Gu et al., 2024) and the representativeness and availability of the driving factor data, 13 driving factors were selected for analysis. Economic factors include gross domestic product, the proportion of primary industry, the proportion of secondary industry, and the proportion of tertiary industry. Social factors included population density, nighttime lights, and the land use degree comprehensive index. The environmental factors included slope, elevation, annual average temperature, annual average precipitation, distance from the river, and soil type (Table 1; Figure 2).
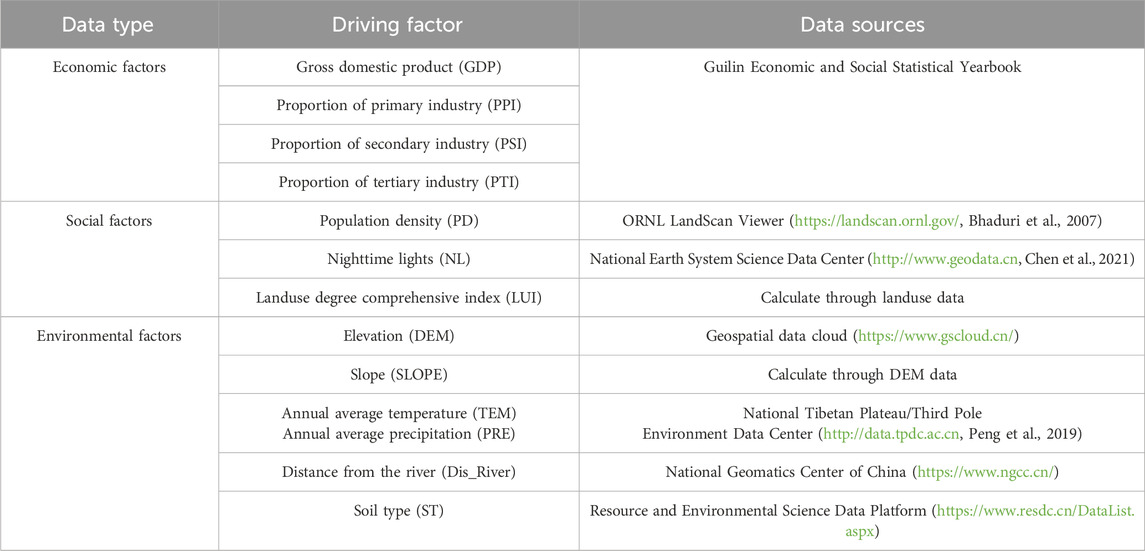
Table 1. Selection of driving factors for habitat quality.
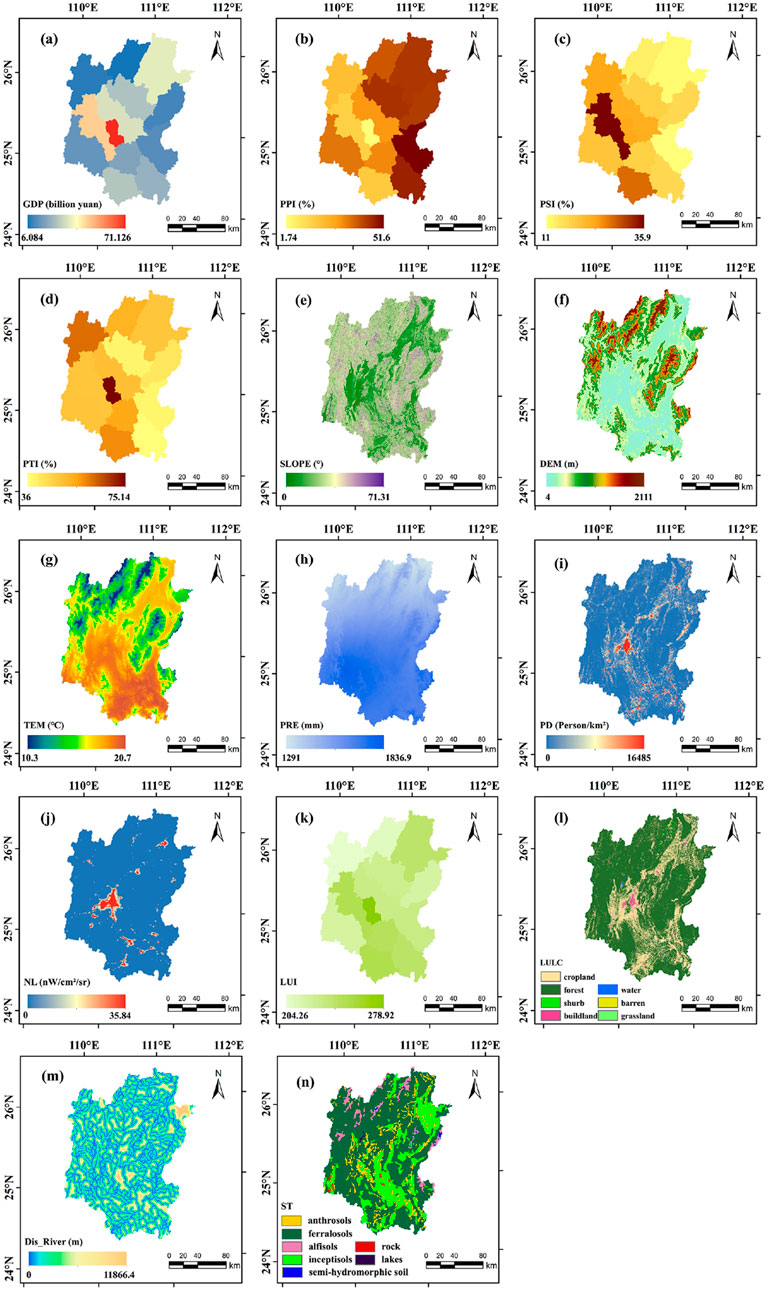
Figure 2. Spatial distribution of land use types and driving factors. (a) Gross domestic product, (b) Proportion of primary industry, (c) Proportion of secondary industry, (d) Proportion of tertiary industry, (e) Slope, (f) Elevation, (g) Annual average temperature, (h) Annual average precipitation,(i) Population density, (j) Nighttime lights, (k) Land use degree comprehensive index, (l) Land cover, (m) Distance from the river, (n) Soil type.
3 Materials and methods
The framework of this study is shown in Figure 3. Based on land use data, sensitivity data, and threat factor data, this study evaluated the spatiotemporal characteristics of habitat quality using the InVEST model and further revealed the relationships between habitat quality and economic, social, and environmental factors using the geographical detector model and GWR model.
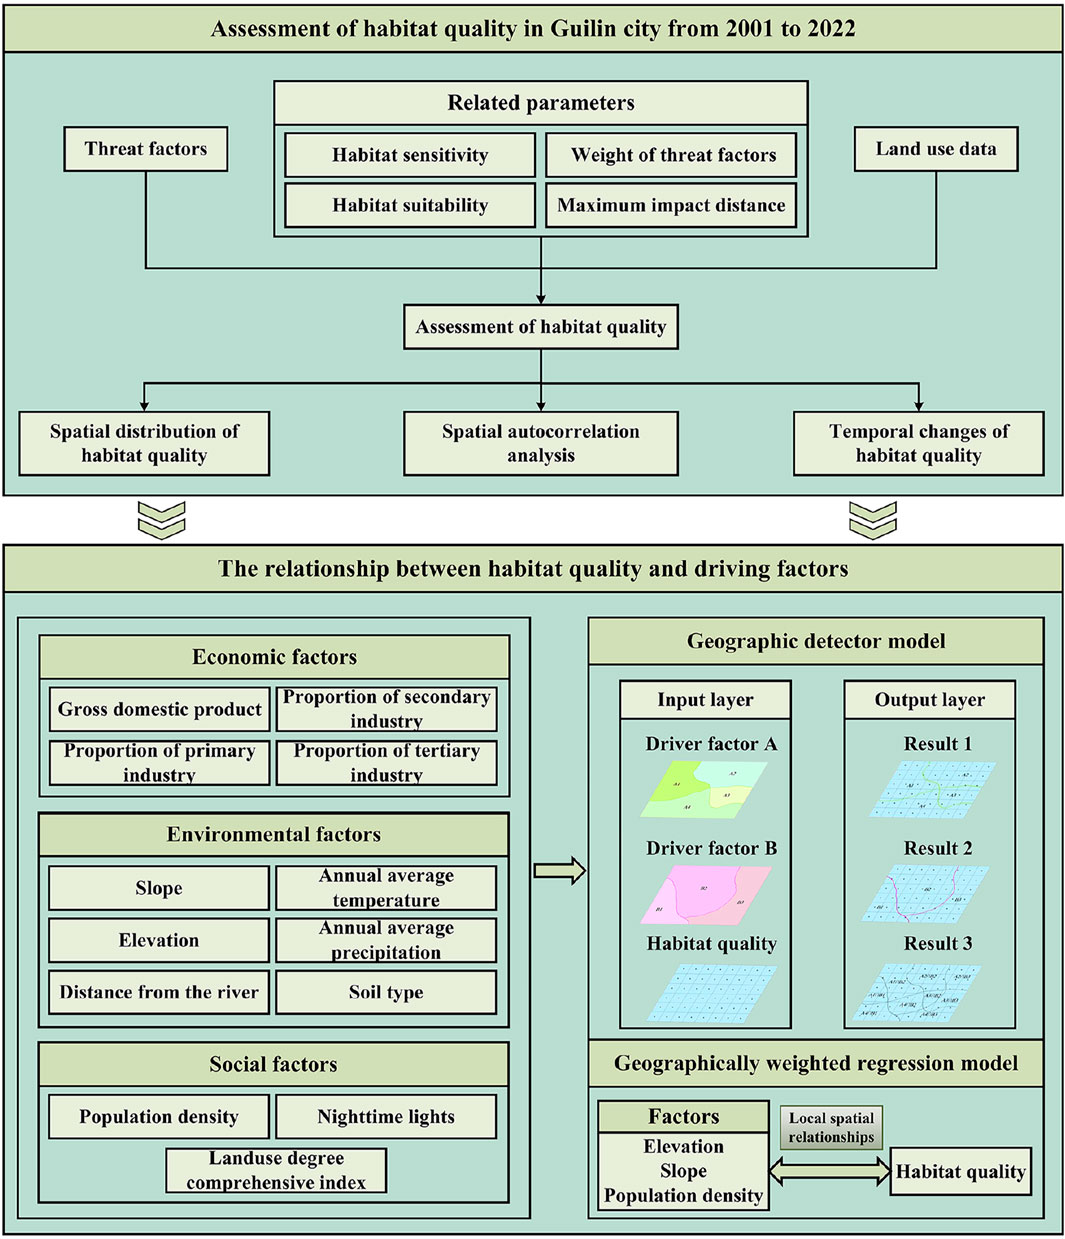
Figure 3. Flowchart of this study.
3.1 Sensitivity analysis
Morris (1991) proposed the one-at-a-time (OAT) method, which is commonly used for local sensitivity analysis. In this study, it was applied to assess the influence of different input parameters on the model’s output. Each parameter is individually perturbed within a range of −15%–15%, using a fixed step size of 5%. as shown in Equations 1:
where Si represents the sensitivity of parameter Xi, X = [ X1, X2 ,…, Xn] denotes the input parameters. Δi represents the variation of parameter Xi. f (X1, X2,…, Xi+Δi,…, Xn) denotes the model output when Xi varies by Δi, while f (X1, X2,…, Xi,…, Xn) represents the model output without any variation in Xi.
3.2 Habitat quality
This study used the habitat quality module in the InVEST model to evaluate the habitat quality in Guilin City. This model assumes that the degree of habitat degradation is influenced by the cumulative effects of multiple threats when analyzing habitat quality. Different threat factors have varying degrees of impact on the habitat, and under the same conditions, certain threats may cause more severe effects. The impact of threats weakens as the distance from the threat source increases, with areas closer to the threat source being more affected. Each habitat type responds differently to threats, and the stronger the sensitivity to the threat source, the more susceptible it is to the impact of threats leading to degradation. Based on the actual land cover situation in Guilin City and referring to the InVEST software manual and related research (Huang et al., 2023; Yang et al., 2023; Wang et al., 2024b; Qiu and Wang, 2022), impermeable surfaces, farmlands, and roads were selected as threat factors in this study. The parameter settings for the threat factors and sensitivity of each habitat type to these threat sources are detailed in Tables 2, 3, respectively.
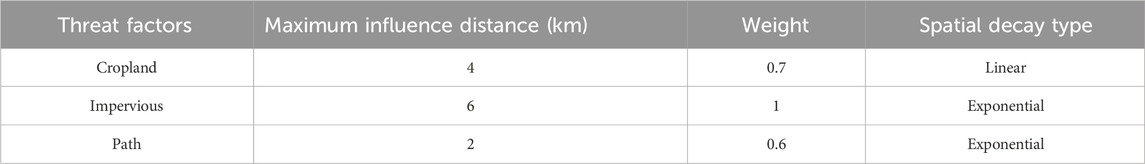
Table 2. Maximum impact distance, weight, and attenuation type of threat factors.
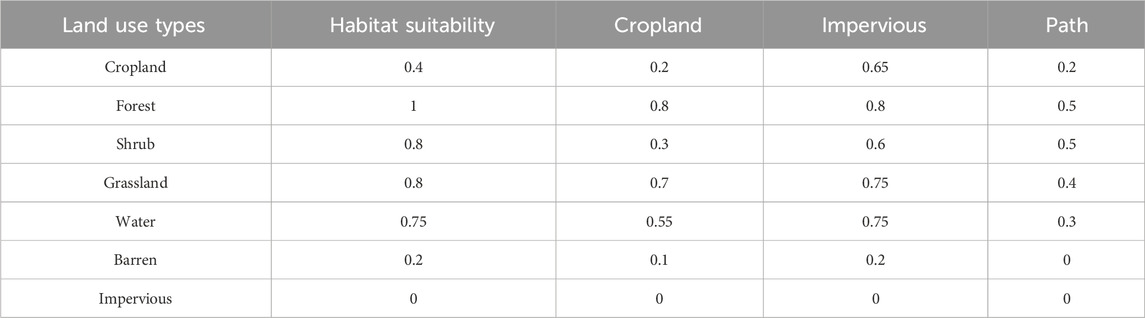
Table 3. Habitat suitability and sensitivity to threat sources for different land use types.
The impact of threat sources on habitat grids decreased with increasing distance, and this change in impact was described by a linear or exponential distance decay function (Wang et al., 2024b), as shown in Equations 2, 3:
where irxy is the degree of impact of a threat source on the habitat, dxy is the distance between the habitat grid and the threat source, and drmax is the maximum impact distance from the threat source.
The degree of habitat degradation was calculated based on the impacts of threat sources on habitat type, as shown in Equation 4:
where Dxj is the degree of habitat degradation of habitat type j, R is the number of threat factors, ωr is the weight of threat factor r, Yr is the number of grid units of threat factors, and βx is the statutory protection level, the value of which is in the range of 0–1. The larger the value is, the higher the accessibility of the threat source to the habitat grid is. Sjr is the sensitivity of land use type j to threat factor r.
Habitat quality was evaluated based on the degree of habitat degradation, as shown in Equation 5:
where Qxj is the habitat quality of position x in land use type j, Hj is the habitat suitability of land use type j, constant k is a semi-saturation constant usually taken as 0.5, and z is a normalization constant usually taken as 2.5. In order to further analyze the spatiotemporal characteristics of habitat quality in Guilin City, this study divided habitat quality into five levels: Poor (0–0.2), Fair (0.2–0.4), Moderate (0.4–0.6), Good (0.6-0.8), and Excellent (0.8–1). Additionally, habitat quality change levels were categorized into five levels: Significantly reduced (<−0.16), Slightly reduced (−0.16 - 0), Unchanged (0), Slightly increased (0–0.16), and Significantly increased (>0.16).
3.3 Spatial autocorrelation analysis
Spatial autocorrelation includes two types: global spatial autocorrelation and local spatial autocorrelation, which are used to measure whether spatial variables have spatial clustering, describe the spatial distribution pattern of spatial variables within the entire study area, and describe the spatial heterogeneity of local regions (Cai et al., 2023). The formulas for global and local spatial autocorrelation analyses are as follows:
where n is the total number of spatial units; xi and xj are the attribute values of the ith and jth spatial units, respectively; ¯ x is the average attribute value of all spatial units; and Wij is the spatial weight. The value of Moran’s I is between −1 and 1. A value of Moran’s I greater than 0 indicates positive spatial correlation among spatial units, manifested as “high–high” or “low–low” clustering. A value of Moran’s I less than 0 indicates negative spatial correlation among spatial units, manifested as “high–low” or “low–high” clustering.
3.4 Geographical detector model
Geographical detector is a statistical method used to detect spatial heterogeneity and analyze the explanatory power of driving factors (Yin and Lin, 2024). This model can evaluate the impact of a single factor and the interaction of two factors on the target variable and includes factor detectors, interaction detectors, risk area detectors, and ecological detectors (Wang and Xu, 2017). This study employs factor and interaction detectors to analyze the explanatory power of 13 driving factors on habitat quality in Guilin City. Socioeconomic data were first spatialized and rasterized, and the 13 factors were discretized using the natural break method. A total of 7,220 sample points were then generated by creating a fishnet. Finally, factor and interaction detectors were used to compute q-values, evaluating the influence of each driving factor on habitat quality. The calculation method for q is shown in Formula 8.
Where q is the explanatory power of the driving factor, h is the stratification of the driving factor and habitat quality, σh and σ are the variances of layer h and the entire region, and Nh and N are the number of units in layer h and the entire region, respectively.
Interaction detection evaluates whether the impact of two driving factors on habitat quality is enhanced or weakened when they act together by comparing their q-values when they act together with their q-values when they act alone. The interactive relationships between these two factors are presented in Table 4.

Table 4. Types of interaction.
3.5 Geographically weighted regression model
GWR is a local linear regression method that constructs a local regression model at each spatial location to more accurately capture the local spatial impact characteristics of various driving factors on habitat quality (Kang et al., 2024). The model is expressed as follows:
Where yi represents the dependent variable value at sampling point i, (ui,vi) represents the coordinates of sampling point i, β0(ui,vi) denotes the intercept term, βj(ui,vi) denotes the regression coefficient of the j-th independent variable at sampling point i, xij represents the value of the j-th independent variable at sampling point i, and εi represents the error term.
4 Result
4.1 Sensitivity analysis results
Figure 4 presents the sensitivity analysis results of the InVEST model’s input parameters. Among all parameters, Sensitivity to Threat Sources has the highest sensitivity index (S = 0.409), indicating its most significant impact on the InVEST model results. Habitat Suitability follows with a sensitivity index of 0.319, making it the second most influential parameter, while Weight has the least impact on the model results. Within the −15%–15% perturbation range, the result of average habitat quality increases with Habitat Suitability, while an increase in the other three parameters presents a downward trend.
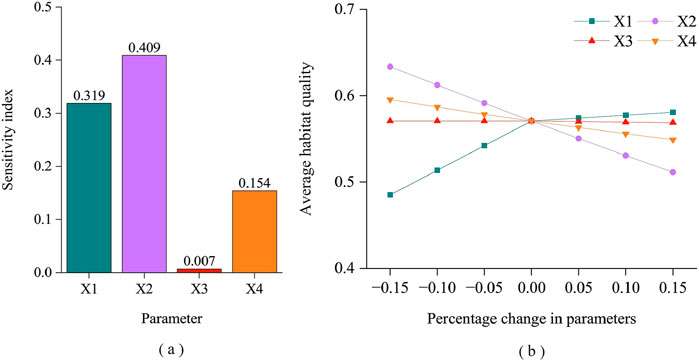
Figure 4. (a) Sensitivity index of model input parameters; (b) Perturbation results of model input parameters. (X1 represents habitat suitability, X2 denotes sensitivity to threat sources, X3 refers to the weight of threats, and X4 indicates the maximum influence distance).
4.2 Spatiotemporal characteristics of habitat quality
Figure 5 shows the proportions of different levels of habitat quality in Guilin City from 2001 to 2022. Over the past 22 years, the average habitat quality in Guilin City has shown an overall downward trend, with the HQ value decreasing from 0.606 to 0.571, a decrease of 5.78%. From 2001 to 2022, the proportion of excellent habitat quality level in Guilin City decreased from 27.92% to 21.02%, a decrease of 24.29%; the proportion with a habitat quality level of fair increased from 25.55% to 28.28%, with a growth rate of 10.69%. Table 5 show the transfer of different habitat quality levels in Guilin from 2001 to 2022. In the past 22 years, areas with excellent habitat quality were primarily transformed into good habitat, with a transformation area ratio of 6.74%; the areas with good habitat quality levels were primarily transformed into moderate habitat, with a transformation area ratio of 4.04%; and the areas with moderate habitat quality levels were primarily transformed into fair habitat, with a transformation area ratio of 4.24%. These data indicated that the proportion of areas with good habitat quality in Guilin gradually decreased, whereas the proportion of areas with poor habitat quality gradually increased. The ecological environmental quality showed a deteriorating trend.
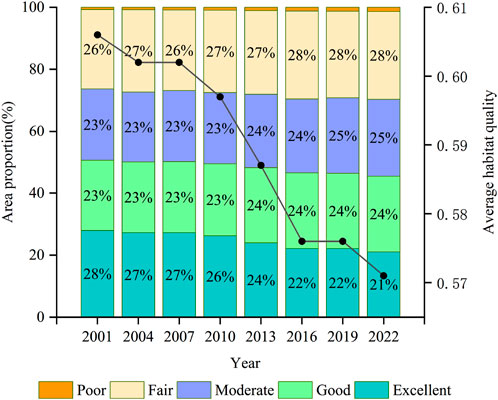
Figure 5. 2001–2022 Proportions of each habitat quality grade in Guilin.
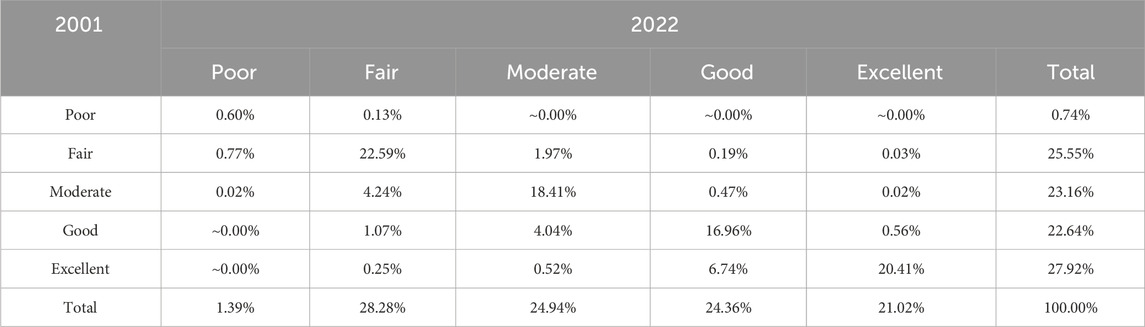
Table 5. Transfer matrix of habitat quality at different levels in guilin city from 2001 to 2022.
According to the results shown in Figures 6, the overall habitat quality in Guilin City was moderate from 2001 to 2022. The habitat quality in the northwestern and eastern regions was relatively high, with quality levels mainly classified as excellent and good. In contrast, the habitat quality in the central, northeastern, and southern regions was relatively low, primarily rated as fair and poor. Areas with high habitat quality were primarily composed of land types such as forests, grasslands, and shrubs, which were less affected by human activities. Areas with low habitat quality primarily comprised impermeable surfaces and cultivated land, which serve as concentrated areas for human life and production activities. Areas with degraded and improved habitat qualities exhibited spatial clustering characteristics (Figure 7). The areas of habitat quality degradation were primarily concentrated in the western and northwestern parts of Guilin City, such as in Ziyuan County, Lingui County, and Yongfu County. The areas with improved habitat quality were primarily concentrated in the northeast of Guilin City, such as Quanzhou County, Guanyang County, and Xing’an County.
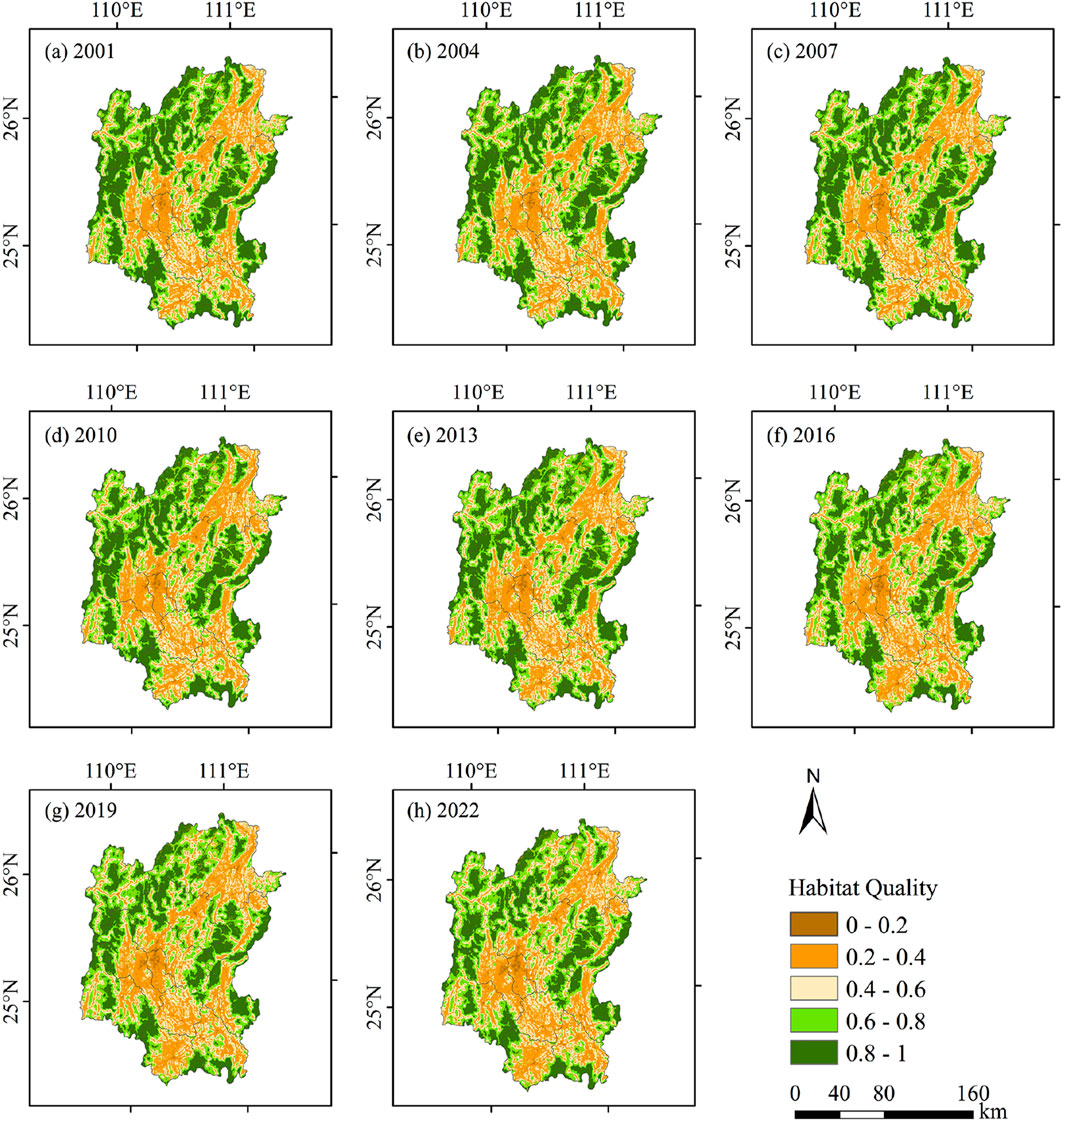
Figure 6. Spatial distribution of habitat quality in Guilin City from 2001 to 2022. (a–h) represent the years 2001, 2004, 2007, 2010, 2013, 2016, 2019, and 2022, respectively.
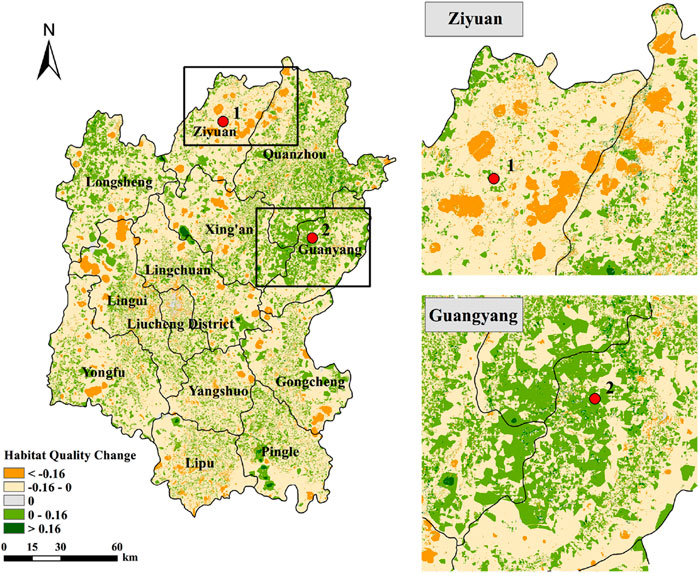
Figure 7. Spatial distribution of habitat quality changes in Guilin City.
4.3 Spatial autocorrelation analysis of habitat quality
To explore the spatial clustering of habitat quality in Guilin City, this study conducted global and local Moran’s index analyses of habitat quality. The analysis results showed that from 2001 to 2022, the global Moran’s index of habitat quality in Guilin City was 0.848, 0.847, 0.824, 0.845, 0.837, 0.830, 0.807, and 0.826, with P-values of 0, indicating a significant positive spatial correlation in habitat quality in the region. The declining trend of Moran’s I indicates a gradual weakening of the spatial clustering of habitat quality. This is mainly influenced by urban expansion, agricultural land conversion, and infrastructure development, leading to the degradation of high-quality habitat areas and exacerbating the degree of habitat fragmentation.
Figure 8 presents the results of the local spatial autocorrelation analysis of habitat quality. The spatial distribution of habitat quality in Guilin City showed evident characteristics of high–high aggregation and low–low aggregation. The high–high clustering areas were primarily concentrated in the western, northwestern, and eastern parts of Guilin City and were primarily composed of forests and shrubs with dense vegetation growth. The low–low clustering areas were primarily distributed in the central, northeastern, and southern regions, with impermeable surfaces and cultivated land as the main land types and where human activities were more frequent. There were relatively few areas of high–low aggregation and low–high aggregation, presenting a scattered distribution. Table 6 lists the patch areas and their proportions in each type of aggregation. From 2001 to 2022, the habitat quality of Guilin City primarily showed high–high aggregation and low–low aggregation spatial characteristics, accounting for an average of 31.55% and 33.85% of the study area, respectively. Compared with 2001, the high–high and low–low clustering areas in Guilin City will decrease in 2022, with reductions accounting for 2.59% and 0.73% of the study area, respectively, with the largest decrease in high-value clustering areas.
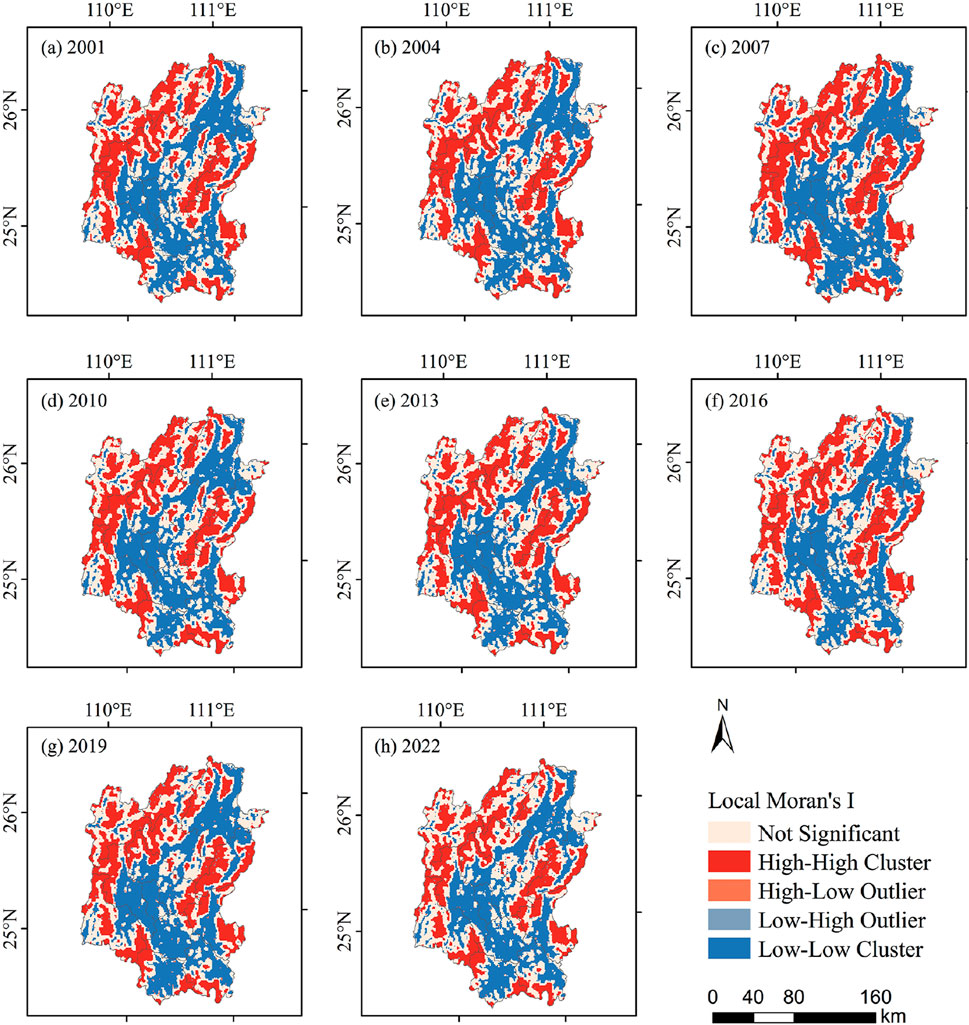
Figure 8. Spatial differentiation of habitat quality in Guilin City from 2001 to 2022. (a -h) represent the years 2001, 2004, 2007, 2010, 2013, 2016, 2019, and 2022, respectively.
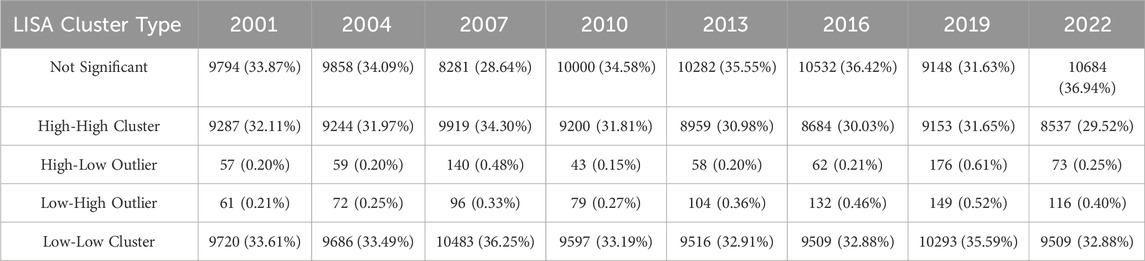
Table 6. Local spatial autocorrelation classification statistics of habitat quality in guilin city (km2).
4.4 Factor detection analysis
The impact of each driving factor on habitat quality in Guilin City was evaluated by calculating the q-value, and all variables passed the significance test at the 0.01 level (Table 7). According to the average explanatory power of each factor, the rankings were as follows: DEM > TEM > PD > SLOPE >ST > LUI > GDP > PRE > Dis_River > NL > PTI > PPI > PSI. This indicated that natural and social factors had a significant impact on the habitat quality of Guilin City, whereas the influence of economic factors was relatively small. Throughout the study period, the main factors affecting the spatial differentiation of habitat quality were DEM, TEM, PD, and SLOPE, all of which had explanatory powers greater than 0.29. DEM and TEM were the two strongest explanatory factors. In 2001, the explanatory power of each driving factor was in the order DEM > TEM > PD > SLOPE > ST > GDP > LUI > Dis_River > PPI > PSI > PRE > PTI > NL. By 2022, the explanatory power of each driving factor is ranked as follows: DEM > TEM > PD > SLOPE > ST > NL > LUI > GDP > Dis_River > PRE > PTI > PPI > PSI. The explanatory powers of NL, PD, and PTI generally increased, whereas those of DEM, PPI, PSI,and GDP decreased. The explanatory power changes of the other driving factors were not significant. Among them, the explanatory power of NL increased the most significantly, indicating that with the advancement of urbanization, the impact of human activities on habitat quality was increasingly significant.
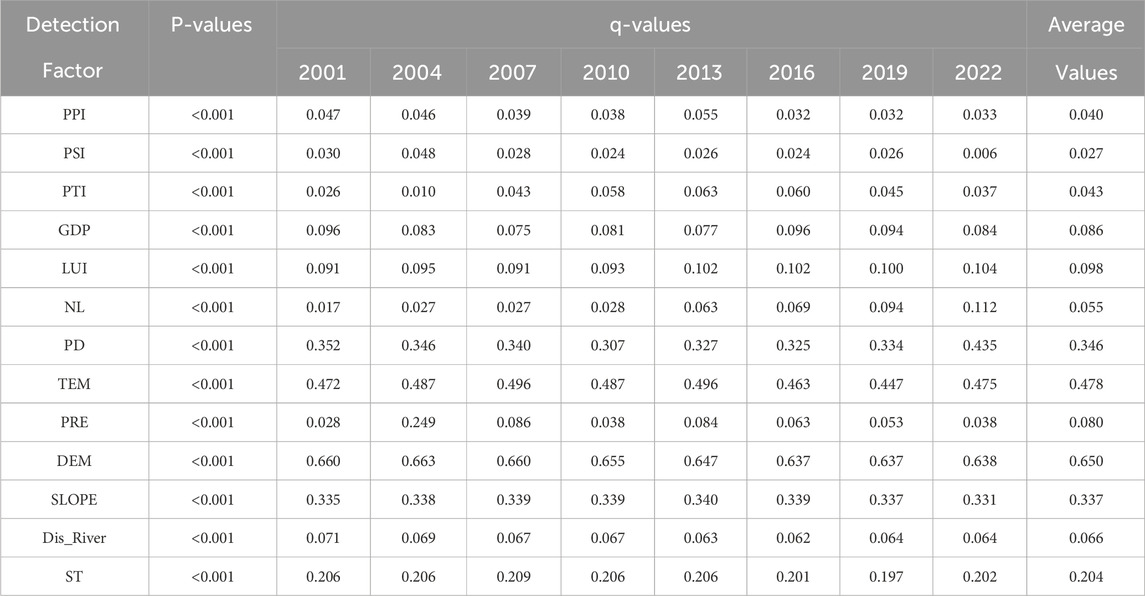
Table 7. Results of factor detection of habitat quality driving factors in guilin city.
4.5 Interaction detection analysis
Figure 9 shows the interaction results for the 13 driving factors from 2001 to 2022. The q-value of the interaction between each pair of factors was higher than that of a single factor, indicating a dual-factor enhancement or nonlinear enhancement. This indicates that the combined effect of these 13 driving factors had a greater impact on the spatial differentiation of habitat quality in Guilin City. The interaction between the DEM and other driving factors had the strongest explanatory power, exceeding 0.64; however, the enhancement effect was not significant. From 2001 to 2022, most driving factor interactions exhibited dual-factor enhancement, while a smaller proportion showed nonlinear enhancement. In 2001, the interaction between DEM and PSI was the strongest (q = 0.706). In 2004 and 2022, the interaction between DEM and PD was the strongest, with q-values of 0.707 and 0.702, respectively. From 2007 to 2016, the interaction between DEM and PRE was the strongest, with q-values of 0.724, 0.698, 0.695, and 0.680, respectively. Over the past 22 years, the interactions of nighttime light and population with other driving factors exhibited a noticeable increase in explanatory power, whereas no significant changes were observed in the interactions among the other driving factors. The interaction between DEM, TEM, PD, SLOPE and PRE was the main reason for the spatial variability in habitat quality in Guilin City.
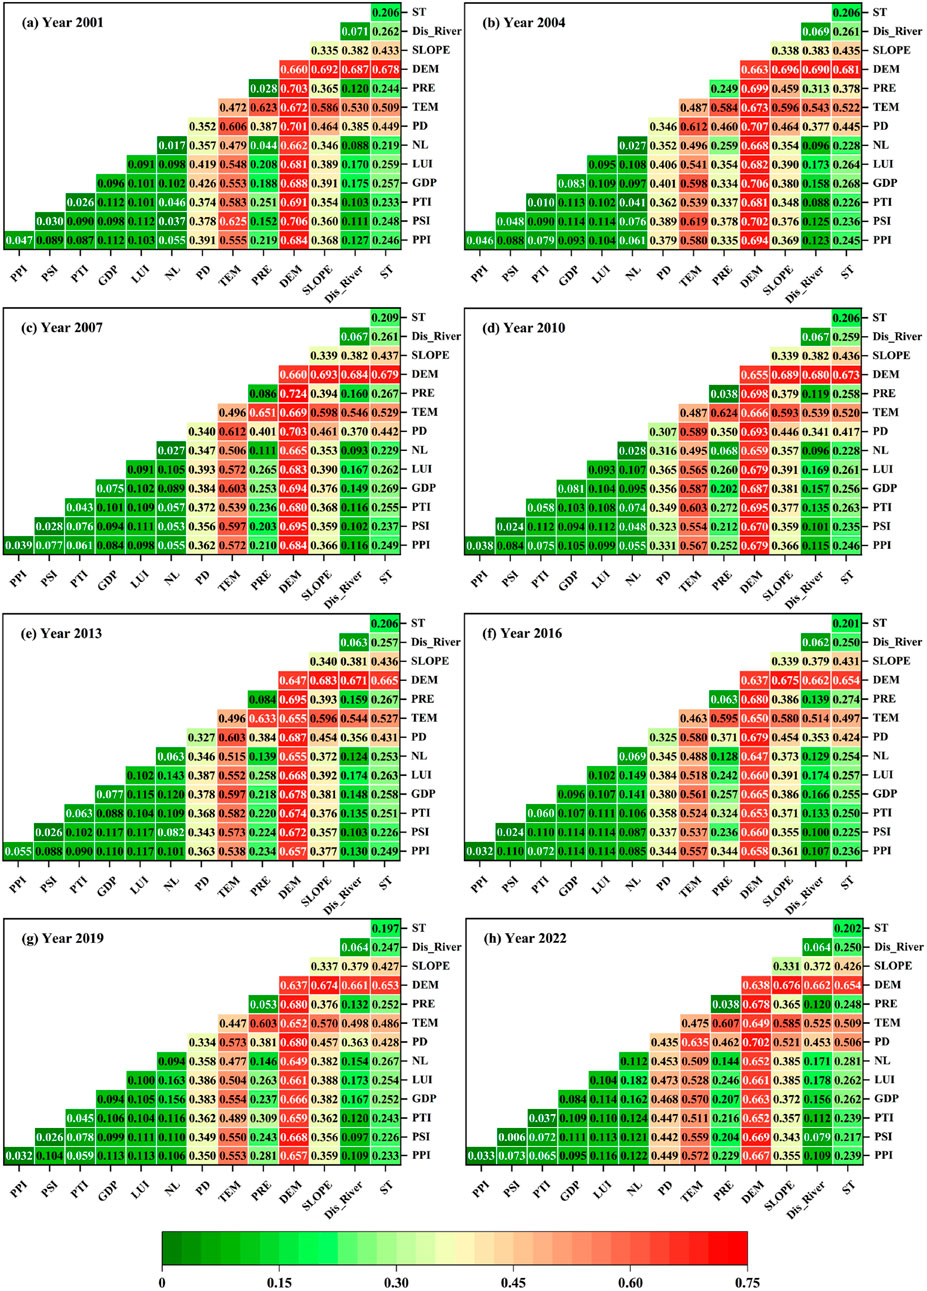
Figure 9. Interactive detection results of driving factors of habitat quality in Guilin City from 2001 to 2022. (a -h) represent the years 2001, 2004, 2007, 2010, 2013, 2016, 2019, and 2022, respectively.
4.6 GWR analysis
The geographical detector can only identify the influence strength of driving factors on habitat quality from a global perspective. Therefore, this study introduces the GWR model to further analyze the local spatial effects of these driving factors on habitat quality. According to the factor detection and VIF test results (Table 8), DEM, SLOPE, and PD were finally selected as the main driving factors for inclusion in the GWR model. The results showed that all selected factors had low VIF values (Table 9), indicating no multicollinearity issues.
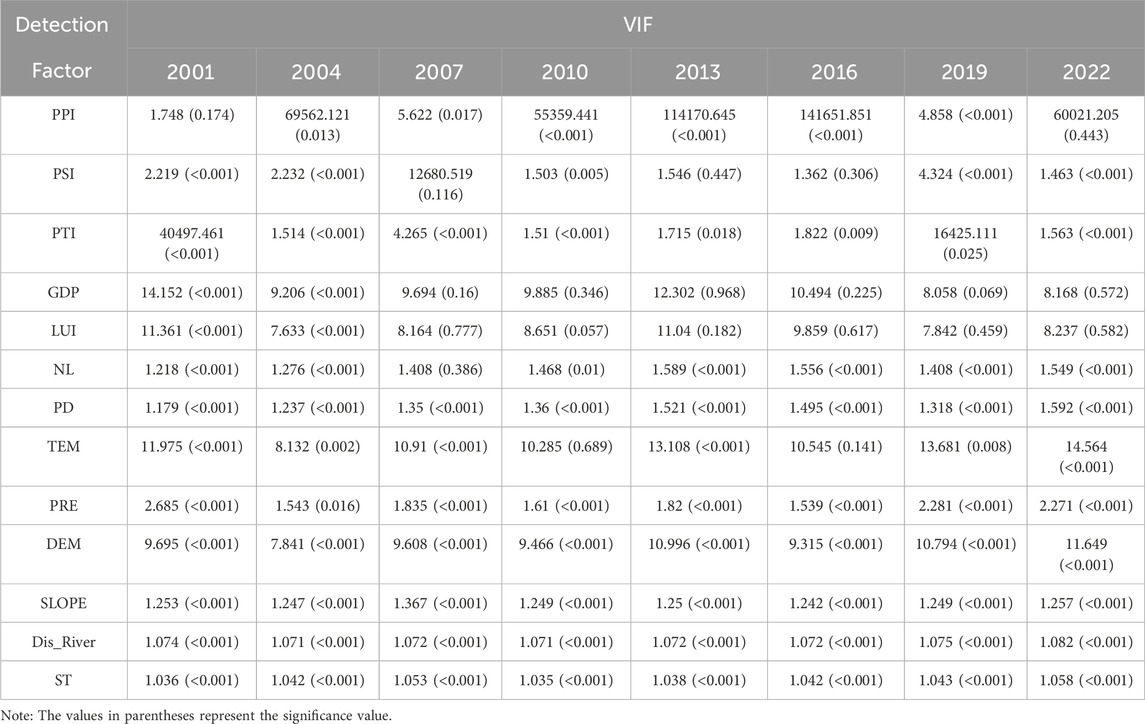
Table 8. VIF detection results of 13 driving factors.
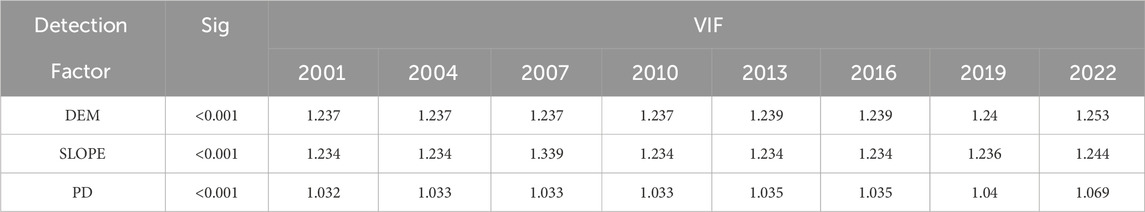
Table 9. VIF detection results of selected driving factors.
Figures 10–12 show the spatial distribution of the local regression coefficients between PD, DEM, SLOPE, and habitat quality. The adjusted R2 values for all results exceed 0.77, indicating excellent model fit and that PD, DEM, and SLOPE effectively explain the spatial variation of habitat quality.The local regression coefficients of PD show a trend of increasing first and then decreasing from 2001 to 2022, suggesting that the impact of population density on habitat quality varies across different periods. In contrast, the local regression coefficients of DEM and SLOPE exhibit no significant changes over time.
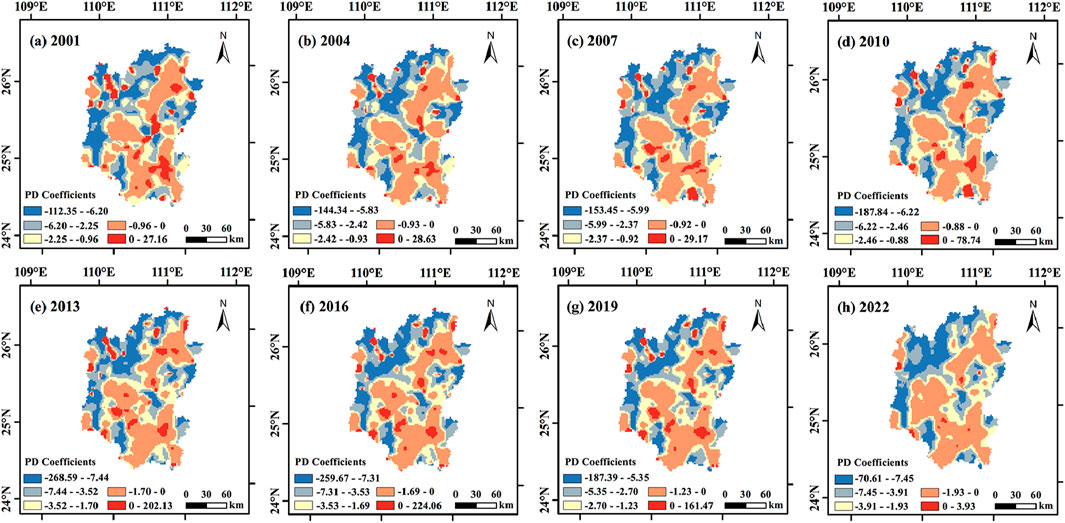
Figure 10. The local coefficients for PD from 2001 to 2022. (a -h) represent the years 2001, 2004, 2007, 2010, 2013, 2016, 2019, and 2022, respectively.
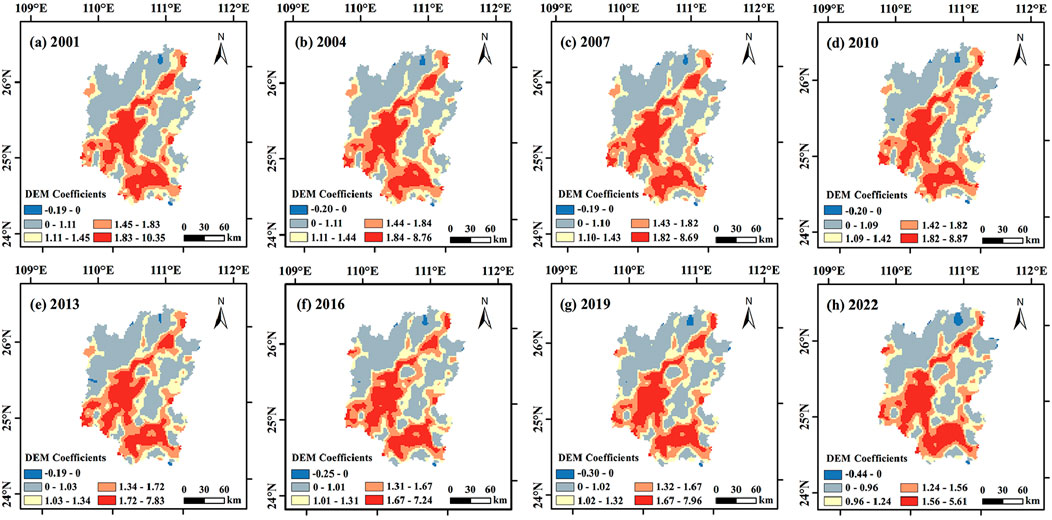
Figure 11. The local coefficients for DEM from 2001 to 2022. (a -h) represent the years 2001, 2004, 2007, 2010, 2013, 2016, 2019, and 2022, respectively.
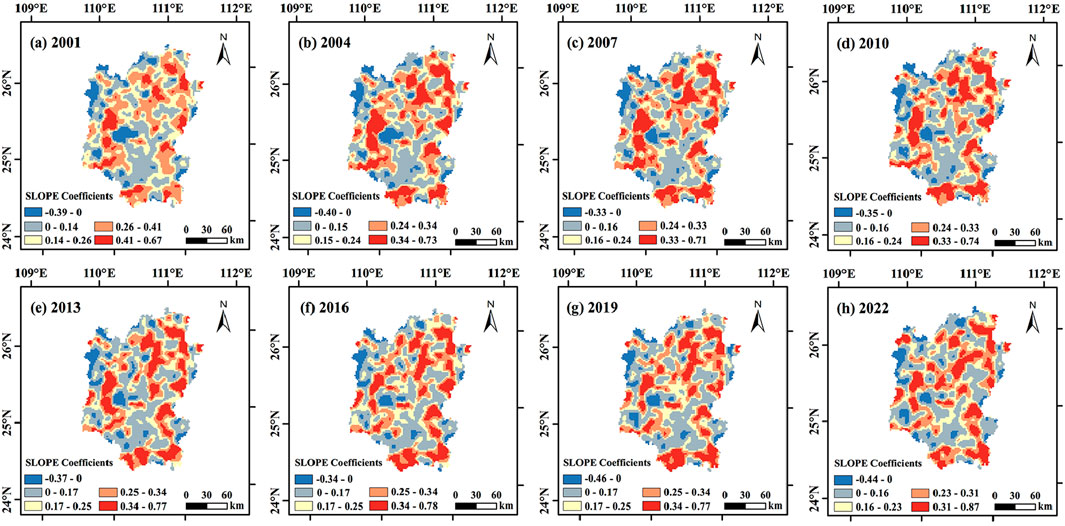
Figure 12. The local coefficients for SLOPE from 2001 to 2022. (a-h) represent the years 2001, 2004, 2007, 2010, 2013, 2016, 2019, and 2022, respectively.
The spatial pattern reveals that areas with negative local regression coefficients for population density account for more than 91% of the total area, indicating that population density exerts a negative impact on habitat quality. Moreover, the local regression coefficients gradually increase from the urban center towards the periphery. This pattern can be attributed to the severely degraded habitat quality in the city center, where changes in population density have limited effects. Conversely, habitat quality is relatively high in the peripheral areas, making these regions more sensitive to changes in population density.
For elevation, regions with positive local regression coefficients cover more than 98% of the area, indicating that elevation positively contributes to habitat quality. The most significant positive impact is observed in the central and southern parts of Guilin, while the effects in the northwest and eastern regions are relatively weaker. Areas with positive local regression coefficients for slope account for over 90% of the total area, suggesting a positive correlation between slope and habitat quality. Regions with higher coefficients are mainly concentrated in the northeast, west, and south of Guilin, where the dominant land use is cultivated land, indicating that slope affects habitat quality primarily through its influence on the spatial distribution of cultivated land in these regions.
5 Discussion
5.1 The impact of land use change on habitat quality
The overall ecological environmental quality of Guilin City was moderate, with an average habitat quality of 0.59. This higher habitat quality is primarily because of the extensive vegetation coverage and sufficient ecological space in Guilin City (Wang et al., 2023a; Wang et al., 2023b), with the ecological space area accounting for more than 77%. Habitat quality in the northwest and eastern regions of Guilin City was relatively high. These areas had large areas of forest land and a small amount of arable land with high vegetation coverage, which helped improve the quality of the ecological environment. Habitat quality in the central, northeastern, and southeastern regions was relatively low. These areas are technological development and industrial concentration zones with high development intensity and significant ecological pressure. These results are consistent with those of previous studies (Yang, 2021; Liu et al., 2023).
Over the past 22 years, the habitat quality in Guilin City has continued to decline. The specific manifestation was that areas with good habitat quality levels were primarily transformed into Moderate quality levels, whereas areas with medium habitat quality levels were primarily transformed into poor quality levels, and the overall habitat quality showed a gradually decreasing trend. According to the Guilin Economic and Social Statistical Yearbook, the gross domestic product of Guilin City has grown by 632.48% over the past 22 years. Rapid economic development has resulted in a large amount of infrastructure construction and the development of new residential areas, and urban areas have continued to expand. The results showed that from 2001 to 2022, the ecological land area decreased by 754.96 km2, the cropland and impervious surface area increased by 754.78 km2, and the bare land area increased by 0.18 km2. According to the land use transfer results from 2001 to 2022 (Figure 13), a large amount of forest land, shrubs, grasslands, and water bodies will be converted into cropland and impervious surfaces, seriously damaging the original natural ecology and leading to an overall decline in habitat quality. Wang et al. (2024a); Wang et al. (2024b) found in their research that purposeful construction and development activities by humans can lead to land conversion and accelerate the loss and quality decline of biological habitats.
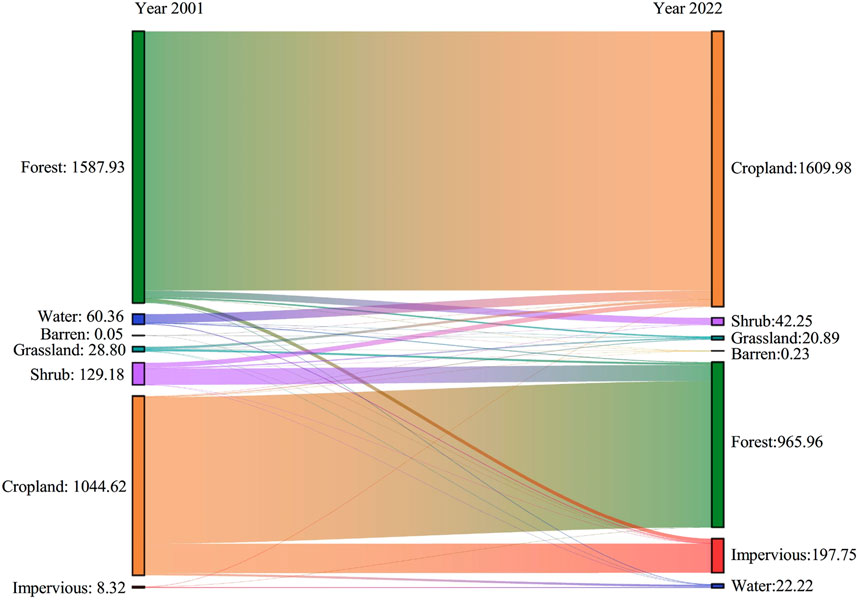
Figure 13. Mulberry plot of land use change in Guilin City from 2001 to 2022 (km2).
During the period 2016–2022, the rate of decline in habitat quality in Guilin City significantly slowed down. This change is primarily attributable to the implementation of the “13th Five-Year Plan for Environmental Protection in Guilin,” which strengthened ecological restoration and supervision; actively promoted multiple ecological restoration projects, such as karst heritage areas, abandoned mines, island wetlands, and shoreline slopes; and gradually improved the fragile ecological situation. The Sustainable Development Goals (SDG15) emphasize the need to protect, restore, and promote the sustainable use of terrestrial ecosystems, sustainably manage forests, combat desertification, halt and reverse land degradation, and curb biodiversity loss. Therefore, while promoting economic development, Guilin City needs to continue strengthening ecological restoration and urban greening policies, enhance the protection of ecological spaces, and mitigate the risk of continuous deterioration of habitat quality.
5.2 Analysis of spatial heterogeneity and driving factors of habitat quality
The habitat quality of Guilin City was influenced by a combination of economic, social, and environmental factors, and different driving factors had significantly different impacts on the spatial heterogeneity of habitat quality. The results showed that environmental factors had the greatest impact on habitat quality, followed by social factors, whereas economic factors had the smallest impact.
Among the 13 driving factors, DEM had the greatest impact on habitat quality, followed by TEM and SLOPE. The average single-factor explanatory powers of these factors were all greater than 0.2, indicating that the suitability of the region significantly affected habitat quality distribution (Chen and Liu, 2024a). DEM is positively correlated with habitat quality in spatial distribution, as the complex terrain in high-altitude areas greatly limits human activities and development, while low altitude areas have natural conditions such as flat terrain and suitable climate, which are conducive to large-scale agricultural development and urban infrastructure construction, and have a negative impact on habitat quality (Aneseeye et al., 2020). TEM affects the distribution of vegetation, and suitable temperatures promote vegetation growth and enhance ecosystem diversity, thereby ensuring stable habitat quality. This is consistent with the conclusions of previous studies (Hu et al., 2021; Wang et al., 2023a) that temperature has a significant impact on habitat quality. SLOPE has a positive impact on habitat quality. This is because it significantly influences the spatial distribution pattern of construction land and farmland. Steep terrain is not conducive to human life and production, thereby playing a protective role in the ecosystem. ST play a role in habitat quality, with differences in water-holding capacity, permeability, and organic matter content influencing vegetation growth and development.
Socioeconomic factors had a relatively small impact on the habitat quality of Guilin City. PD had the strongest explanatory power, followed by LUI, while the explanatory power of other driving factors, including PPI, PSI, PTI, and GDP, was less than 0.1. The local spatial relationship between population density and habitat quality showed a significant negative correlation. According to the Guilin Economic and Social Statistical Yearbook, the city’s total population increased by approximately 11.65% from 2001 to 2022. Population growth has driven higher demand for residential land and public infrastructure, leading to intensified land development and utilization, which poses greater challenges to ecological and resource management. As a famous tourist city, Guilin’s tourism industry has become the main driver of steady economic growth. In recent years, Guilin has focused on ecological protection and restoration of natural resources, with a cumulative mining ecological restoration area of over 2.8 km2. Effective ecological restoration and protection measures have offset some negative impacts of social and economic activities (Yuan et al., 2023).
The interactions between different factors significantly affected the changes in habitat quality. The interaction detection results indicated that the explanatory power of the interactions of the 13 driving factors on habitat quality was greater than that of a single factor, showing dual-factor and nonlinear enhancement effects. This suggests that the combined effects of these factors have a greater impact on habitat quality. The interaction between DEM, TEM, PD, SLOPE and PRE had a significant impact on changes in habitat quality in Guilin City. These factors collectively affect the environmental conditions for vegetation growth and the intensity of human activity, thereby influencing the habitat quality of the region. PPI, PSI, PTI, and NL had relatively small impacts on habitat quality; however, their interactions with other driving factors remained significant. The interactive detection results showed that changes in habitat quality were driven by the combined influence of multiple factors, with no single factor fully explaining its variation. Therefore, when addressing ecological and environmental issues, multiple factors should be considered, and more effective governance measures should be developed via scientific monitoring to achieve more comprehensive and effective ecological protection.
5.3 Policy recommendations
The karst ecosystem in Guilin is highly fragile and sensitive, with limited restoration capacity, making it particularly prone to rocky desertification. Thus, preserving the region’s ecological integrity is crucial. The study findings indicate that low-quality habitat areas are expanding outward from the city center, while high-quality habitat areas are shrinking, and the average habitat quality in Guilin has shown an overall downward trend. This trend reflects the continuous impact of urban expansion and infrastructure development on the surrounding ecological environment, underscoring the urgent need for ecological restoration. Based on the findings of this study, the following policy recommendations are proposed:
The northeastern, central, and southern regions of Guilin city have a high degree of land use and development, high population density, and long-term low habitat quality. These areas need to improve the construction of green infrastructure such as parks, green spaces, and ecological corridors to enhance the ecological carrying capacity of the city and alleviate the environmental pressure brought about by high-density urbanization. The local government needs to strictly control urban infrastructure such as industrial parks, residential land, and roads to prevent habitat fragmentation. The cultivated land around Guilin city can be combined with ecotourism to develop sustainable industries such as leisure and ecology, and improve the production and ecological service functions of cultivated land through the construction of high standard farmland.
The habitat quality in the northwest and eastern regions of Guilin is relatively high, but it is sensitive to human activities and requires the development of sound ecological protection policies. These areas should focus on afforestation and grassland restoration, and regularly conduct environmental monitoring and evaluation to improve vegetation coverage and ecosystem stability. As a famous tourist city, Guilin can fully utilize the advantages of karst landforms, biological landscapes, and cultural resources, encourage the development of green industries such as ecotourism and characteristic orchards, and promote the coordinated development of economic growth and environmental protection.
5.4 Limitations and future research directions
The current research aimed to analyze the spatiotemporal characteristics of habitat quality and the influence of various driving factors on the spatial heterogeneity of habitat quality; however, there are still some limitations: (1) This study spans a 21-year period but analyzes data from only eight time points. Future research will incorporate more time points to enhance the continuity of the analysis, enabling a more detailed analysis of habitat quality dynamics. (2) This study primarily focuses on past changes in habitat quality. In the future, the PLUS model or deep learning models will be used to explore how habitat quality evolves under different policy or development conditions. (3) Although geodetectors perform well in single-factor detection and interaction detection, they have not been able to reveal the complex interactions between two or more driving factors that affect changes in habitat quality. Future research will consider coupling machine learning algorithms to more deeply analyze the impact mechanisms of these factors (Xiang et al., 2024). (4) This study focused on analyzing the impact of major driving factors on habitat quality without considering factors such as sunshine duration, hydrological processes, climate change, and energy consumption. Therefore, the current research may not fully consider the driving factors that affect habitat quality, and future research should expand to include these factors to obtain a more comprehensive understanding.
6 Conclusion
This study evaluated the habitat quality of Guilin City from 2001 to 2022 based on the InVEST model and used spatial autocorrelation analysis methods to analyze the spatiotemporal characteristics of habitat quality. The impact of the driving factors on the spatial differentiation of habitat quality was analyzed using a geographical detector model and the GWR model. The main conclusions are as follows.
(1) The overall habitat quality in Guilin was moderate, with an average proportion of 47.98% of the areas having habitat quality greater than 0.6. Habitat quality in the northwest and eastern regions was relatively high, whereas that in the central, northeast, and southern regions was relatively low. During the research period, the overall habitat quality in Guilin City showed a downward trend, with areas with good habitat quality levels primarily turning toward moderate levels and areas with moderate habitat quality levels primarily turning toward fair levels. The habitat quality level gradually declined.
(2) Habitat quality in Guilin City had a significant positive spatial correlation and spatial clustering. During the research period, the average areas of low and low aggregation accounted for the largest proportion, whereas the areas of high and high aggregation decreased the most significantly, indicating that the ecological environment of Guilin City faced significant pressure.
(3) From 2001 to 2022, there was no significant change in the explanatory power of habitat quality driving factors in Guilin. DEM, TEM, PD, and SLOPE were the main driving factors with a significant impact on the spatial differentiation of habitat quality. DEM and SLOPE showed a positive correlation with habitat quality, while PD exhibited a negative correlation. Compared with the effect of a single factor, the interaction of multiple factors exhibited a stronger comprehensive effect, showing dual-factor enhancement and nonlinear enhancement, among which the interaction between DEM and PRE was the most significant.
Data availability statement
The original contributions presented in the study are included in the article/supplementary material, further inquiries can be directed to the corresponding author.
Author contributions
JX: Writing – original draft, Conceptualization, Methodology. DF: Writing – review and editing, Conceptualization, Methodology. FW: Software, Writing – review and editing. XZ: Supervision, Writing – review and editing. WM: Visualization, Writing – review and editing. JD: Data curation, Writing – review and editing.
Funding
The author(s) declare that financial support was received for the research and/or publication of this article. The authors thank the financial support of the National Key Research and Development Program of China (No. 2023YFB3907600) and the National Natural Science Foundation of China (No. 41930650).
Acknowledgments
We also thank the National Meteorological Information Center (http://data.cma.cn/) for data support, and the editors and reviewers for their valuable comments and suggestions regarding the manuscript.
Conflict of interest
The authors declare that the research was conducted in the absence of any commercial or financial relationships that could be construed as a potential conflict of interest.
Generative AI statement
The author(s) declare that no Generative AI was used in the creation of this manuscript.
Publisher’s note
All claims expressed in this article are solely those of the authors and do not necessarily represent those of their affiliated organizations, or those of the publisher, the editors and the reviewers. Any product that may be evaluated in this article, or claim that may be made by its manufacturer, is not guaranteed or endorsed by the publisher.
References
Aneseyee, A. B., Noszczyk, T., Soromessa, T., and Elias, E. (2020). The InVEST habitat quality model associated with land use/cover changes: a qualitative case study of the winike watershed in the omo-gibe basin. Southwest Ethiopia. Remote Sens. 12 (7), 1103. doi:10.3390/rs12071103
Bai, L. M., Xiu, C. L., Feng, X. H., and Liu, D. Q. (2019). Influence of urbanization on regional habitat quality:a case study of Changchun City. Habitat Int. 93, 102042. doi:10.1016/j.habitatint.2019.102042
Bhaduri, B., Bright, E., Coleman, P., and Urban, M. L. (2007). LandScan USA: A high-resolution geospatial and temporal modeling approach for population distribution and dynamics. GeoJournal 69 1–2, 103–117. doi:10.1007/s10708-007-9105-9
Bontemps, S., Boettcher, M., Brockmann, C., Kirches, G., Lamarche, C., Radoux, J., et al. (2015). Multi-year global land cover mapping at 300 m and characterization for climate modelling: achievements of the Land Cover component of the ESA Climate Change Initiative. International Archives of the Photogrammetry, Remote Sensing and Spatial Information Sciences XL-7/W3 (1), 323–328. doi:10.5194/isprsarchives-XL-7-W3-323-2015
Bhattacharya, R. K., Chatterjee, N. D., and Das, K. (2020). Impact of instream sand mining on habitat destruction or transformation using coupling models of HSI and MLR. Spatial Inf. Res. 28 (1), 67–85. doi:10.1007/s41324-019-00271-3
Cai, Z. C., Zhang, Z., Zhao, F., Guo, X. H., Zhao, J. B., Xu, Y. Y., et al. (2023). Assessment of eco-environmental quality changes and spatial heterogeneity in the Yellow River Delta based on the remote sensing ecological index and geo-detector model. Ecol. Inf. 77, 102203. doi:10.1016/J.ECOINF.2023.102203
Cao, H. L., Wu, Z. J., and Zheng, W. J. (2024). Impact of touristification and landscape pattern on habitat quality in the Longji Rice Terrace Ecosystem, southern China, based on geographically weighted regression models. Ecol. Indic. 166, 112259. doi:10.1016/J.ECOLIND.2024.112259
Chen, J., Ban, Y. F., and Li, S. N. (2014). China: open access to Earth land-cover map. Nature 514 (7523), 434. doi:10.1038/514434c
Chen, S. L., and Liu, X. T. (2024a). Spatio-temporal variations of habitat quality and its driving factors in the Yangtze River Delta region of China. Glob. Ecol. Conservation 52, e02978. doi:10.1016/J.GECCO.2024.E02978
Chen, Y. D., Chang, J., Li, Z. X., Ming, L., and Li, C. K. (2024b). Influence of land use change on habitat quality: a case study of coal mining subsidence areas. Environ. Monit. Assess. 196 (6), 535. doi:10.1007/S10661-024-12702-2
Chen, Z. Q., Yu, B. L., Yang, C. S., Zhou, Y. Y., Yao, S. J., Qian, X. J., et al. (2021). An extended time series (2000–2018) of global NPP-VIIRS-Like nighttime light data from a cross-sensor calibration. Earth Syst. Sci. Data 13 (3), 889–906. doi:10.5194/ESSD-13-889-2021
Cui, G. Y., Zhang, Y., Shi, F. H., Jia, W. X., Pan, B. H., Han, C. K., et al. (2022). Study of spatiotemporal changes and driving factors of habitat quality: a case study of the agro-pastoral ecotone in northern shaanxi, China. Sustainability 14 (9), 5141. doi:10.3390/SU14095141
Duan, X., Chen, B., Zhang, T. X., Guan, Y. Q., and Zeng, K. (2024). Habitat quality evolution and multi-scenario simulation based on land use change in the jialing river basin. Sustainability 16 (16), 6968. doi:10.3390/SU16166968
Friedl, M. A., Sulla-Menashe, D., Tan, B., Schneider, A., Ramankutty, N., Sibley, A., et al. (2010). MODIS Collection 5 global land cover: algorithm refinements and characterization of new datasets. Remote Sens. Environ. 114 (1), 168–182. doi:10.1016/j.rse.2009.08.016
Gong, P., Wang, J., Yu, L., Zhao, Y. C., Zhao, Y. Y., Liang, L., et al. (2013). Finer resolution observation and monitoring of global land cover: first mapping results with Landsat TM and ETM+ data. Int. J. Remote Sens. 34 (7), 2607–2654. doi:10.1080/01431161.2012.748992
Gu, T. C., Luo, T., Ying, Z., Wu, X. D., Wang, Z. G., Zhang, G. X., et al. (2024). Coupled relationships between landscape pattern and ecosystem health in response to urbanization. J. Environ. Manag. 367, 122076. doi:10.1016/J.JENVMAN.2024.122076
Guo, Q. R., Lai, X. T., Jia, Y. H., and Wei, F. L. (2023). Spatiotemporal pattern and driving factors of carbon emissions in Guangxi based on geographic detectors. Sustainability 15 (21), 15477. doi:10.3390/SU152115477
Han, C. Q., Zheng, J. H., Han, W. Q., Lu, B. B., Yu, W. J., Wang, Z., et al. (2024a). Research on habitat quality in arid urban agglomerations: influencing mechanisms and multi-scenario simulations. Land Degrad. Dev. 35 (6), 2256–2273. doi:10.1002/LDR.5058
Han, N. L., Yu, M., Jia, P. H., Zhang, Y. C., and Hu, K. (2024b). Influence of human activity intensity on habitat quality in hainan tropical rainforest national park, China. Chin. Geogr. Sci. 34 (3), 519–532. doi:10.1007/S11769-024-1423-Z
He, Y. L., Ma, J. M., Zhang, C. S., and Yang, H. (2023). Spatio-temporal evolution and prediction of carbon storage in Guilin based on FLUS and InVEST models. Remote Sens. 15 (5), 1445. doi:10.3390/RS15051445
Hou, Y. J., and Wu, J. M. (2024). Land-use and habitat quality prediction in the Fen River Basin based on PLUS and InVEST models. Front. Environ. Sci. 12, 1386549. doi:10.3389/FENVS.2024.1386549
Hu, Y. G., Xu, E. K., Kim, G., Liu, C., and Tian, G. H. (2021). Response of spatio-temporal differentiation characteristics of habitat quality to land surface temperature in a fast urbanized city. Forests 12 (12), 1668. doi:10.3390/F12121668
Huang, C. B., Cheng, X. J., and Zhang, Z. M. (2024a). Future land use and habitat quality dynamics: spatio-temporal analysis and simulation in the taihu lake basin. Sustainability 16 (17), 7793. doi:10.3390/SU16177793
Huang, H., Xiao, Y. Z., Ding, G. C., Liao, L. Y., Yan, C., Liu, Q. Y., et al. (2023). Comprehensive evaluation of island habitat quality based on the invest model and terrain diversity: a case study of haitan island, China. Sustainability 15 (14), 11293. doi:10.3390/SU151411293
Huang, J. T., Zhang, Y. C., Zhang, J. Q., Qi, J. W., and Liu, P. (2024b). Study on the ecological environment quality and its driving factors of the spatial transformation of production-living-ecological space in Baishan City. Sci. Rep. 14 (1), 18709. doi:10.1038/S41598-024-69428-X
Huo, A. D., Liu, Q., Zhao, Z. X., Elbeltagi, A., Abuarab, M. E., and Ganjidoust, H. (2023). Habitat quality assessment and driving factor analysis of xiangyu in feng river basin based on InVEST model. Water 15 (23), 4046. doi:10.3390/W15234046
Kang, S. Z., Jia, X., Zhao, Y. H., Han, L., Ma, C. Q., and Bai, Y. (2024). Spatiotemporal variation and driving factors of ecological environment quality on the loess plateau in China from 2000 to 2020. Remote Sens. 16 (24), 4778. doi:10.3390/RS16244778
Lan, G., Xiao, Y., Ci, X. H., Zhang, Y. J., and Xia, J. (2024). Spatial and temporal differentiation characteristics of green development levels in urban agglomerations within the Yangtze River economic Belt and analysis of influencing factors. Ecol. Indic. 166, 112552. doi:10.1016/J.ECOLIND.2024.112552
Li, C. X., Liu, Q., Zong, Z. H., and Fang, Y. Y. (2024a). Rural environmental quality evaluation indicator system: application in shangluo city, shaanxi province. Sustainability 16 (8), 3198. doi:10.3390/SU16083198
Li, S., Dong, B., Gao, X., Xu, H. F., Ren, C. Q., Liu, Y. R., et al. (2022). Study on spatio-temporal evolution of habitat quality based on land-use change in Chongming Dongtan, China. Environ. Earth Sci. 81 (7), 220. doi:10.1007/S12665-022-10324-W
Li, T., Bao, R., Li, L., Tang, M. F., and Deng, H. B. (2023). Temporal and spatial changes of habitat quality and their potential driving factors in southwest China. Land 12 (2), 346. doi:10.3390/LAND12020346
Li, Y., Zhen, W. N., Shi, D. H., Tang, Y. H., and Xia, B. (2024b). Coupling coordination and influencing mechanism of ecosystem services using remote sensing: a case study of food provision and soil conservation. Remote Sens. 16 (23), 4598. doi:10.3390/RS16234598
Lin, Y., Zhang, X., Zhu, H., and Li, R. T. (2024). Spatiotemporal evolution and mechanisms of habitat quality in nature reserve land: a case study of 18 nature reserves in hubei province. Land 13 (3), 363. doi:10.3390/LAND13030363
Liu, Y. X., Wang, Y. T., Lin, Y. W., Ma, X. Q., Guo, S. F., Ouyang, Q. R., et al. (2023). Habitat quality assessment and driving factors analysis of guangdong province, China. Sustainability 15 (15), 11615. doi:10.3390/SU151511615
Luan, Y. F., Huang, G. H., Zheng, G. H., and Wang, Y. E. (2022). Correlation between spatio-temporal evolution of habitat quality and human activity intensity in typical mountain cities: a case study of guiyang city, China. Int. J. Environ. Res. Public Health 19 (21), 14294. doi:10.3390/IJERPH192114294
Mirghaed, F. A., and Souri, B. (2021). Relationships between habitat quality and ecological properties across Ziarat Basin in northern Iran. Environ. Dev. Sustain. 23 (11), 16192–16207. doi:10.1007/S10668-021-01343-X
Morris, M. D. (1991). Factorial sampling plans for preliminary computational experiments. Technometrics 33 (2), 161–174. doi:10.2307/1269043
Peng, S. Z., Ding, Y. X., Liu, W. Z., and Li, Z. (2019). 1 km monthly temperature and precipitation dataset for China from 1901 to 2017. Earth Syst. Sci. Data 11 (4), 1931–1946. doi:10.5194/essd-11-1931-2019
Qin, X. H., Yang, Q. K., and Wang, L. (2024). The evolution of habitat quality and its response to land use change in the coastal China, 1985-2020. Sci. Total Environ. 952, 175930. doi:10.1016/J.SCITOTENV.2024.175930
Qiu, T. Q., and Wang, X. R. (2022). Research on the temporal and spatial evolution of habitat quality in changsha-zhuzhou-xiangtan urban agglomeration based on InVEST model. For. Grassl. Resour. Res. 51 (5), 99–106. doi:10.13466/j.cnki.lyzygl.2022.05.013
Wang, D., Hao, H. G., Liu, H., Sun, L. H., and Li, Y. Y. (2024a). Spatial-temporal changes of landscape and habitat quality in typical ecologically fragile areas of western China over the past 40 years: a case study of the Ningxia Hui Autonomous Region. Ecol. Evol. 14 (1), e10847. doi:10.1002/ECE3.10847
Wang, J. F., and Xu, C. D. (2017). Geodetector: principle and prospective. Acta Geogr. Sin. 72 (1), 116–134. doi:10.11821/dlxb201701010
Wang, J. Y., Chen, G., Yuan, Y. R., Fei, Y., Xiong, J. N., Yang, J. W., et al. (2023a). Spatiotemporal changes of ecological environment quality and climate drivers in Zoige Plateau. Environ. Monit. Assess. 195 (7), 912. doi:10.1007/S10661-023-11506-0
Wang, Y., Quan, D. H., Zhu, W. H., Lin, Z. H., and Jin, R. (2023b). Habitat quality assessment under the change of vegetation coverage in the tumen river cross-border basin. Sustainability 15 (12), 9269. doi:10.3390/SU15129269
Wang, Y., Sheng, Z. Y., Wang, H. W., Xue, X., Hu, J. X., and Yang, Y. H. (2024b). Characterization and multi-scenario prediction of habitat quality evolution in the bosten lake watershed based on the InVEST and PLUS models. Sustainability 16 (10), 4202. doi:10.3390/SU16104202
Wei, J. M., Jin, Y., Tan, Q. L., Liu, F., Ding, C., Li, T. T., et al. (2024). Trend analysis of long-time series habitat quality in Beijing based on multiple models. Front. Environ. Sci. 12, 1428197. doi:10.3389/FENVS.2024.1428197
Wu, J. F., Guo, Z. Y., Luo, G. J., Zhang, F. T., Chen, J. P., Li, W., et al. (2024a). Exploring the spatiotemporal dynamics and coupling coordination of urbanization and habitat quality in the Yangtze river basin, China. Front. Environ. Sci. 12, 1435293. doi:10.3389/FENVS.2024.1435293
Wu, J. M., Hou, Y. J., and Cui, Z. (2024b). Coupled InVEST-MGWR modeling to analyze the impacts of changing landscape patterns on habitat quality in the Fen River basin. Sci. Rep. 14 (1), 13084. doi:10.1038/S41598-024-64012-9
Xiang, K., Shi, D. X., and Xiang, X. Y. (2024). Machine learning analysis of socioeconomic drivers in urban ozone pollution in Chinese cities. Environ. Monit. Assess. 196 (3), 314. doi:10.1007/S10661-024-12489-2
Xiang, Q., Kan, A. K., Yu, X. X., Liu, F., Huang, H., Li, W., et al. (2023). Assessment of topographic effect on habitat quality in mountainous area using InVEST model. Land 12 (1), 186. doi:10.3390/LAND12010186
Xiao, P. N., Zhou, Y., Li, M. Y., and Xu, J. (2023). Spatiotemporal patterns of habitat quality and its topographic gradient effects of Hubei Province based on the InVEST model. Environ. Dev. Sustain. 25 (7), 6419–6448. doi:10.1007/S10668-022-02310-W
Xie, X. L., and Zhu, Q. (2023). Research on the impact of urban expansion on habitat quality in Chengdu. Sustainability 15 (7), 6271. doi:10.3390/SU15076271
Yang, F., Yang, L. Y., Fang, Q. Y., and Yao, X. W. (2024). Impact of landscape pattern on habitat quality in the yangtze river economic belt from 2000 to 2030. Ecol. Indic. 166, 112480. doi:10.1016/J.ECOLIND.2024.112480
Yang, J., and Huang, X. (2021). The 30 m annual land cover dataset and its dynamics in China from 1990 to 2019. Earth Syst. Sci. Data 13 (8), 3907–3925. doi:10.5194/ESSD-13-3907-2021
Yang, L. Y., Pan, S. P., Chen, W. X., Zeng, J., Xu, H., and Gu, T. C. (2023). Spatially non-stationary response of habitat quality to land use activities in World's protected areas over 20 years. J. Clean. Prod. 419, 138245. doi:10.1016/J.JCLEPRO.2023.138245
Yang, Y. Y. (2021). Evolution of habitat quality and association with land-use changes in mountainous areas: a case study of the Taihang Mountains in Hebei Province, China. Ecol. Indic. 129, 107967. doi:10.1016/J.ECOLIND.2021.107967
Yin, X. Q., and Lin, K. (2024). Spatial-temporal characteristics and driving factors of carbon emissions from the construction industry in the Belt and Road region of China. Front. Environ. Sci. 12, 1398328. doi:10.3389/FENVS.2024.1398328
Yohannes, H., Soromessa, T., Argaw, M., and Dewan, A. (2021). Spatio-temporal changes in habitat quality and linkage with landscape characteristics in the Beressa watershed, Blue Nile basin of Ethiopian highlands. J. Environ. Manag. 281, 111885. doi:10.1016/J.JENVMAN.2020.111885
Yuan, B., Jia, K., Xia, M., and Zhao, W. W. (2023). Using remote sensing data to evaluate the ecological restoration in Taiyuan from the SDGs perspective. Int. J. Digit. Earth 16 (2), 4621–4645. doi:10.1080/17538947.2023.2279684
Zhang, H. L., Wang, F. Q., Zhao, H., Kang, P. P., and Tang, L. (2022). Evolution of habitat quality and analysis of influencing factors in the Yellow River Delta Wetland from 1986 to 2020. Front. Ecol. Evol. 10, 1075914. doi:10.3389/FEVO.2022.1075914
Zhang, X. M., Wan, W. Q., Fan, H. B., Dong, X. T., and Lv, T. G. (2024). Temporal and spatial responses of landscape patterns to habitat quality changes in the Poyang Lake region, China. J. Nat. Conservation 77, 126546. doi:10.1016/J.JNC.2023.126546
Zhang, Y., Zhang, L. Q., Wang, J. Y., Dong, G. C., and Wei, Y. L. (2023). Quantitative analysis of NDVI driving factors based on the geographical detector model in the Chengdu-Chongqing region, China. Ecol. Indic. 155, 110978. doi:10.1016/J.ECOLIND.2023.110978
Zhang, Z. C., Zhang, H. J., Feng, J., Wang, Y. R., and Liu, K. (2021). Evaluation of social values for ecosystem services in urban riverfront space based on the SolVES model: a case study of the fenghe river, xi'an, China. Int. J. Environ. Res. Public Health 18 (5), 2765. doi:10.3390/IJERPH18052765
Zhao, X. Y., Tan, S. C., Li, Y. P., Wu, H., and Wu, R. J. (2024). Quantitative analysis of fractional vegetation cover in southern Sichuan urban agglomeration using optimal parameter geographic detector model, China. Ecol. Indic. 158, 111529. doi:10.1016/J.ECOLIND.2023.111529
Zheng, W. W., Li, S. M., Ke, X. L., Li, X. Y., and Zhang, B. B. (2022). The impacts of cropland balance policy on habitat quality in China: a multiscale administrative perspective. J. Environ. Manag. 323, 116182. doi:10.1016/J.JENVMAN.2022.116182
Keywords: habitat quality, spatiotemporal characteristics, driving factors, geographic detector, Guilin City
Citation: Xu J, Fan D, Wang F, Zhao X, Ma W and Duan J (2025) Assessing the spatiotemporal characteristics and driving factors of habitat quality in sustainable development demonstration zones: a case study of Guilin City, China. Front. Environ. Sci. 13:1545221. doi: 10.3389/fenvs.2025.1545221
Received: 14 December 2024; Accepted: 07 April 2025;
Published: 24 April 2025.
Edited by:
Manish Pandey, Marwadi University Research Center (MURC), Marwadi University, Rajkot, IndiaReviewed by:
Shyam Ranjan, Jawaharlal Nehru University, IndiaMingxing Zhong, Xinyang Normal University, China
Yunfeng Shan, Chengdu University of Technology, China
Copyright © 2025 Xu, Fan, Wang, Zhao, Ma and Duan. This is an open-access article distributed under the terms of the Creative Commons Attribution License (CC BY). The use, distribution or reproduction in other forums is permitted, provided the original author(s) and the copyright owner(s) are credited and that the original publication in this journal is cited, in accordance with accepted academic practice. No use, distribution or reproduction is permitted which does not comply with these terms.
*Correspondence: Deqin Fan, a2lubHkxMjlAMTYzLmNvbQ==