 Meng Wang
 Yuanyuan Ding
 Yong Wang
 Miao Liu1
- 1School of Ecology and Applied Meteorology, Nanjing University of Information Science and Technology, Nanjing, China
- 2School of Geographical Sciences, Nanjing University of Information Science and Technology, Nanjing, Jiangsu, China
Soil erosion has been significantly exacerbated by climate change and urbanization, posing serious threats to environmental protection and sustainable development. In this study, soil erosion in the Daqing River Basin from 2000 to 2022 was assessed using the revised universal soil loss equation (RUSLE) model, which incorporates data from digital elevation model (DEM), normalized vegetation index (NDVI), and land-use sources, and the spatiotemporal evolution of soil erosion was subsequently analyzed. The impacts of natural and anthropogenic factors on erosion and their interactions with soil erosion were analyzed via random forest and partial least squares-structural equation modeling (PLS-SEM). The results revealed that soil erosion in the Daqing River Basin averaged 159 t/(km2·a) from 2000 to 2022, with averages of 386 t/(km2·a) in the mountains and 1.1 t/(km2·a) in the plains. The erosion intensity increased from southeast to northwest, with higher levels in mountains than in plains. The soil erosion level initially improved but then deteriorated sharply after a significant turning point in 2015. Natural factors, particularly precipitation, were the largest drivers of soil erosion throughout the Daqing River Basin, whereas anthropogenic factors had the greater impact on erosion in plains than in mountains. There was strong synergy among various anthropogenic factors throughout the basin. In the mountains, anthropogenic factors were antagonistic to vegetation coverage, whereas in the plains, they were synergistic with vegetation coverage and meteorological factors.
1 Introduction
Soil erosion is a global environmental challenge that poses a serious threat to natural resources, agriculture, and ecosystems (Owens and Collins, 2007; Pimentel, 2006). Its occurrence and development are not only directly influenced by natural factors such as precipitation and vegetation coverage but also significantly influenced by anthropogenic factors such as population growth and economic development. Moreover, the frequent occurrence of extreme weather events contributes to uncertainty in the soil erosion process (Borrelli et al., 2017). Additionally, notable differences in soil erosion exist under various topographic conditions, particularly between mountains and plains (Farhan and Nawaiseh, 2015; Feng et al., 2014). A 2015 report on the Global Status of Soil Resources published by the United Nations (UN) stated that “the quality of the majority of the world’s soil resources is merely moderate, poor or very poor” and emphasized that soil erosion continues to be a major global environmental and agricultural threat (Montanarella et al., 2015). To address this issue effectively, the utilization of modeling and statistical approaches to analyze the soil erosion process and its key influencing factors has emerged as a research focus. Nevertheless, further comparative analysis of soil erosion characteristics under diverse terrain conditions can not only facilitate an improved understanding of erosion mechanisms but also provide a systematic basis for formulating precise prevention and control measures, which holds considerable research value and should be investigated in depth.
Currently, the issue of soil erosion is attracting increasing attention in several major countries in Asia and Latin America (such as China and Brazil, respectively) (Wuepper et al., 2020). The relatively high rate of soil erosion in these regions has emerged as an urgent environmental problem. China is among the countries with the most severe soil erosion problems worldwide. Its extensive erosion area and substantial erosion volume top the list of the 10 countries with the highest average annual soil erosion worldwide (Xiong and Leng, 2024; Zheng et al., 2008). On the basis of data from the second national remote sensing survey of soil erosion in China, the total area affected by water and wind erosion is 3,569,000 km2, accounting for 37.6% of the country’s total area (Xu et al., 2002). Soil erosion is a particularly acute problem in the northern part of China and poses a serious challenge to the regional ecosystem. Notably, soil erosion in the North China Plain, which is an important agricultural production area in China, not only poses a threat to agricultural production but also directly impacts the regional ecological balance. Furthermore, the multiyear average soil erosion modulus in this area is 2674.26 t/(km2·a), and the erosion modulus in some areas can reach as high as 8302.11 t/(km2·a) (Xu et al., 2012; Yang et al., 2017). In comparison, the soil erosion issue is more severe in the Taihang Mountain area, where the average erosion modulus reaches 3,000 t/(km2.a), and locally, the erosion modulus can reach as high as 9,000 t/(km2·a) (Wang et al., 2022). In addition, studies conducted in the Beijing‒Tianjin–Hebei region have demonstrated that there are considerable differences in the degree of soil erosion among different regions and that the erosion severity in some regions exhibits an increasing trend (Li et al., 2024). This phenomenon has been substantiated via in-depth exploration in northern China, where the considerable spatial variability in topographic features has been identified as a crucial factor influencing the distribution and intensity of soil erosion (Wang et al., 2021). The results of these studies have not only revealed the urgency of soil erosion control but also emphasized the importance of fully accounting for topographical conditions and adopting targeted measures in the prevention and control process. These measure are also important for maintaining the regional ecological balance, improving environmental quality, and promoting sustainable development.
Soil erosion prediction models are essential tools for evaluating and forecasting soil erosion. They play crucial roles in soil and water conservation as well as in environmental protection (Boardman et al., 2023). Since the mid-20th century, a range of soil erosion models have been developed by researchers worldwide. Notable examples include the universal soil loss equation (USLE), the revised universal soil loss equation (RUSLE), the water erosion prediction project (WEPP), the European soil erosion model (EUROSEM), and the Limburg soil erosion model (LISEM) (De Roo et al., 1996; Liu and Shi, 1992; Morgan et al., 1998). The USLE model was first proposed by Wischmeier and Smith in 1965, followed by the more accurate RUSLE model introduced by the United States Department of Agriculture in 1993. These models have become the theoretical cornerstone of soil erosion studies and are widely employed worldwide (Renard et al., 1997; Renard et al., 1991; Wischmeier and Smith, 1965). In China, researchers have developed soil erosion models tailored to the local environment on the basis of the USLE model, such as the soil erosion prediction model by Jiang, Z.S. and the Chinese soil loss equation (CSLE) model. These models have been optimized for complex and diverse geographical and environmental conditions in China and have significantly enhanced the applicability and accuracy of soil erosion predictions (Jiang, 1996; Zheng et al., 2001). In recent years, the drivers of soil erosion and risk analysis based on the RUSLE model have become popular research topics, providing a sound basis for soil erosion management (Liao et al., 2024; Mu et al., 2022). The RUSLE model has been adopted worldwide because of its adaptability to different topographic and climatic conditions. For example, in the Cantao region of Brazil, researchers have applied the RUSLE model to assess the impacts of land-use change and agricultural activities on soil erosion, revealing the important role of human activities in the soil erosion process (Lu et al., 2004). In Bangladesh, soil erosion in the tertiary hilly regions was evaluated from 2017 to 2021 using the RUSLE model integrated with GIS and remote sensing techniques. The results indicated that erosion predominantly occurred in steeper areas and was significantly influenced by land-use changes (Shoumik et al., 2023). Similarly, in the Mellegue Basin spanning Tunisia and Algeria, researchers utilized the RUSLE model combined with GIS technology to demonstrate that the average erosion risk increased from 1.58 t/(km2·a) in 2002 to 1.78 t/(km2·a) in 2018, reflecting a substantial rise in total soil loss (Jien et al., 2023). In the Esfandari Basin of Iran, the RUSLE model was coupled with the DPSIR framework, Landsat data, and Markov chain predictions to assess the soil erosion trend from 2011 to 2031. The analysis revealed an increase in erosion rates from 4.49 t/(km2·a) in 2011 to a projected 11.44 t/(km2·a) in 2031, primarily driven by agricultural expansion (Talebi and Karimi, 2024). In Asia, especially China, the application of the RUSLE model has also achieved remarkable results. For example, in the Sanjiangyuan region, the implementation of ecological projects significantly altered the soil erosion trend, where precipitation and vegetation restoration were identified as the key drivers affecting soil erosion (Cao et al., 2018). Furthermore, in North China, a study based on the RUSLE model provided an in-depth analysis of the effects of precipitation, land-use, and land management on the risk of soil erosion in the Hai River Basin, which provided systematic support for regional soil erosion control (Li et al., 2011).
However, most existing studies have concentrated on large-scale areas, frequently disregarding key erosion-contributing areas, and the low resolution of the employed data, typically 1 km, has constrained the capacity to analyze soil erosion variability on a fine scale. In addition, current research on the variability in soil erosion under diverse topographic conditions remains insufficient, particularly in identifying and comparatively analyzing the main drivers of soil erosion, where obvious research gaps exist. The Daqing River Basin traverses the Taihang Mountains and North China Plain and flows through Beijing, Tianjin, parts of Hebei Province, and parts of Shanxi Province. The basin encompasses ecologically sensitive and key economic development areas, such as the Xiong’an New Area, and constitutes a major source of soil erosion in North China. However, the risk of soil erosion has increased in recent years as a result of the high frequency of soil erosion events in the region and an increase in the occurrence of extreme weather events. Notably, the catchment experienced more than 30 extreme precipitation events between 2004 and 2020 and three exceptionally heavy precipitation events between 2012 and 2023, including the heavy precipitation event in July 2023 that caused severe flooding (Xu et al., 2024). To comprehensively understand the differences in soil erosion across different terrain regions, the Daqing River Basin was divided into two subregions, namely, mountains and plains, and the data resolution was increased to 250 m. The RUSLE model was applied to analyze the spatial and temporal evolution characteristics of soil erosion and its influencing factors in the basin from 2000 to 2022. Additionally, a combination of a random forest model and partial least squares-structural equation modeling (PLS-SEM) was employed to explore the impacts of natural and anthropogenic factors and their interactions on soil erosion throughout the basin, as well as within the mountains and plains. By integrating these models, this study aimed to compare the differences in soil erosion and its dominant influencing factors between mountains and plains. Consequently, preventive and remedial measures tailored to each subregion were formulated with the objective of effectively mitigating soil erosion in the Daqing River Basin.
2 Data and methods
2.1 Study area
The Daqing River Basin constitutes an indispensable part of the Hai River Basin in North China (Figure 1). Originating from the Taihang Mountains, the river flows from west to east and eventually discharges into Bohai Bay. It encompasses two main sources, namely, the Baigou River and the Zhaowang River. The river traverses the provinces of Shanxi and Hebei, as well as the municipalities of Beijing and Tianjin, covering a total drainage area of 45,131 km2. This area accounts for approximately 15% of the entire Hai River Basin. In terms of topography, the Daqing River Basin is characterized by high elevations in the northwest and low elevations in the southeast. The upper reaches are mainly mountainous, whereas the lower reaches encompass lakes and wetlands, among which the renowned Baiyang Lake is included. The region is subject to a temperate monsoon climate, distinguished by four distinct seasons. It receives an annual average precipitation of 583 mm, with both intense and seasonal precipitation, characterized by a short duration and high intensity, especially during the flood season (Tong et al., 2021). With respect to soil and vegetation, the upper mountains are occupied primarily by woodlands and grasslands, whereas the lower reaches are dominated by cultivated and construction land. In this paper, we categorize the Daqing River Basin with a slope exceeding 2° as mountainous areas and those with a slope of 2° or less as plains. The boundary between these two types of terrain is clearly delineated in the figure of the study area.
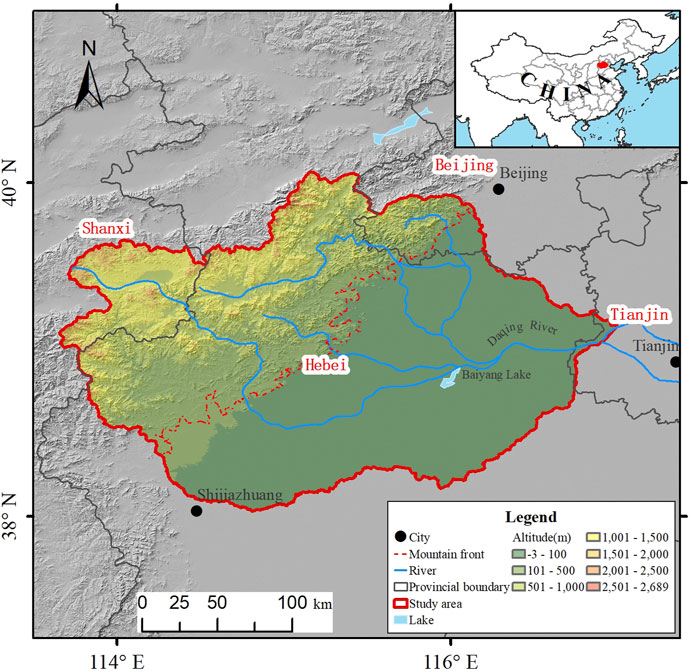
Figure 1. Study area (the mountain front is where mountains meet plains).
The Daqing River Basin, located in the southern part of Beijing, plays a crucial role in supplying water resources to the Beijing–Tianjin–Hebei urban agglomeration, contributing significantly to water conservation and production capacity for the development of the Xiong’an New Area. Its strategic importance cannot be overemphasized. However, the basin faces a serious environmental challenge, namely, soil erosion. An assessment of the soil erosion risk in the Hai River Basin indicated that the mountainous area of the Daqing River presented the highest risk level in the entire basin, accounting for 21.45% of the total risk (Li et al., 2011). Consequently, addressing and controlling soil erosion in the Daqing River Basin is extremely urgent.
2.2 Basic data
This study utilized a variety of data from 2000 to 2022. It includes topographic data (NASA global 30-m Shuttle Radar Topography Mission (SRTM) DEM data), precipitation data (China monthly rainfall dataset with a 1-km resolution), soil data (Chinese soil dataset based on the World Soil Database (HWSD)), vegetation data (Moderate Resolution Imaging Spectroradiometer (MODIS) NDVI data), land-use data (GlobeLand30 dataset), temperature data (China monthly mean temperature dataset with a 1-km resolution), population density data (Bureau of Statistics of Hebei Province), and GDP data (China National Bureau of Statistics (NBS)). To ensure high-precision analysis and maintain data consistency and accuracy, all datasets were uniformly resampled to a spatial resolution of 250-m using ArcGIS raster resampling tools. These data were processed by resampling, slope analysis, splicing and projection, digitization, and other processing methods to calculate the relevant factors. Table 1 provides detailed information on the specific data types and sources.
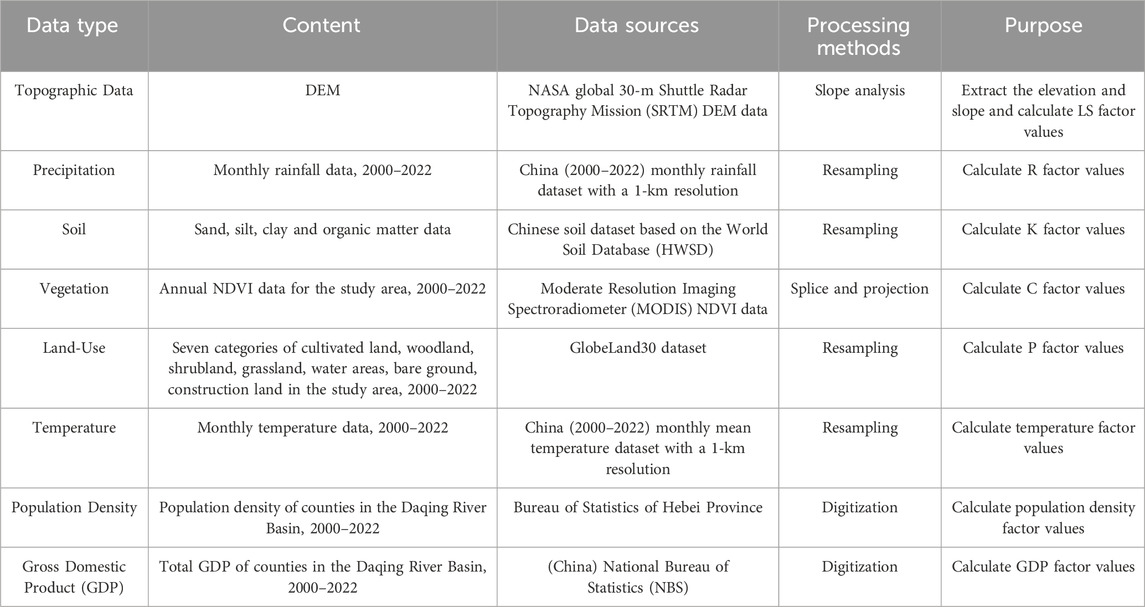
Table 1. Data sources.
2.3 Soil erosion model
In soil erosion research, the RUSLE model comprehensively accounts for factors such as the rainfall erosivity factor (R), the soil erodibility factor (K), the slope length and steepness factor (LS), the cropping and management factor (C), and the conservation practices factor (P). This model is an effective method for studying soil erosion and is also the most extensively employed model for quantifying soil erosion. The RUSLE model can be expressed as Equation 1:
where A is the soil erosion modulus [t/(km2·a)]; R is the rainfall erosivity factor [(MJ mm)/(km2·ha)]; K is the soil erodibility factor [(t km2·h)/(km2·MJ mm)]; LS is the slope length and steepness factor, dimensionless; C is the cropping and management factor, dimensionless; and P is the conservation practices factor, dimensionless.
2.4 RUSLE factor calculation
2.4.1 Rainfall erosivity factor (R)
Rainfall is the main driver of soil erosion. The rainfall erosivity factor (R) is a dynamic indicator that reflects rainfall-induced soil segregation and transport and reflects the potential capacity of rainfall to contribute to soil erosion (Wang and Jiao, 1996). In this work, the rainfall erosivity was calculated for each year from 2000 to 2022 using a simple algorithm proposed by Wischmeier to derive the R value via the multiyear average monthly rainfall (Wischmeier and Smith, 1978) Equation 2:
where Pi is the monthly rainfall (mm), P is the annual rainfall (mm), and the unit of rainfall erosivity is [(MJ mm)/(km2·ha)].
2.4.2 Soil erodibility factor (K)
The soil erodibility factor (K) serves as an indicator of the sensitivity of soil properties to erosion. The magnitude of K reflects the degree to which the soil can be detached, eroded, and transported under the influence of the erosive forces of rainfall. Generally, the higher the soil K value is, the lower the capacity of the soil to resist water erosion and the greater its susceptibility to erosion (Lu and Shen, 1992). Numerous methods exist for estimating the soil erodibility factor, among which the widely adopted methods are the nomogram method proposed by Wischmeier et al. and the erosion productivity impact calculation (EPIC) model proposed by Williams et al. In this paper, the K value was calculated on the basis of the EPIC model, and the results were corrected in accordance with the study of Zhang et al. (2008). The soil erodibility factor is determined by the presence of chalk, sand, clay, and organic matter in the soil and can be obtained as Equation 3-5:
where K is the soil erodibility factor, SAN is the sand content, SIL is the silt content, CLA is the clay content, SAN1 is the non-sand content and OM is the organic matter content. The unit of the latter four variables is %.
2.4.3 Slope length and steepness factor (LS)
Soil erosion is influenced by topography, specifically slope length and steepness. Slope length refers to the distance along the slope from where surface runoff starts to where it converges into a gully. Longer slopes increase runoff velocity, flow volume, and erosive force (Zhang et al., 2008). Steepness, or the degree of inclination, affects water flow speed, influencing infiltration rates and runoff volumes (Zhang et al., 2018). In this study, the slope length and slope were extracted from the DEM of the Daqing River Basin. The method proposed by Wischmeier et al. was utilized to calculate the slope length factor (L), and the steepness factor (S) was considered in segments. For gentle slopes, McCool’s slope model was employed (Mccool et al., 1987), and for steep slopes, Liu’s slope model was adopted (Liu et al., 2000), which can be expressed as Equation 6-8:
where L is the slope length factor, λ is the projected length of the raster cell, m is the slope length effect index, θ is the slope (%) extracted from the DEM, and S is the steepness factor.
2.4.4 Cropping and management factor (C)
In the RUSLE model, the C factor represents the ratio of the soil loss from vegetated or managed land to that from bare cropland under identical conditions. This factor reflects the impact of vegetation coverage and management on soil erosion, with values ranging from 0 to 1. The normalized difference vegetation index (NDVI) is the most commonly employed index for calculating the C factor (Asis and Omasa, 2007), and in this paper, MODIS NDVI data were used to calculate the C factor. The C factor can be obtained as Equation 9, 10 (Cai and Ding, 2000):
where f is the vegetation coverage (%); C is the cropping and management factor; NDVI is the normalized difference vegetation index, for which the multiyear monthly average was adopted in this study; and NDVImax and NDVImin are the maximum and minimum NDVI values, respectively.
2.4.5 Conservation practices factor (P)
The conservation practices factor P is the ratio of soil loss after applying water conservation measures to soil loss with downhill planting. Its value ranges from 0 to 1, where 0 indicates no soil erosion and 1 indicates no conservation measures applied. In this study, ArcGIS 10.2 was used to reclassify land-use data and assign P values based on relevant studies and local agricultural activities (Ma et al., 2023; Table 2).

Table 2. P values of the different land-uses.
2.5 Evaluation of soil erosion classes
According to the soil erosion classification and grading criteria SL190-2007 issued by the State Ministry of Water Resources (Ministry of Water Resources of the People’s Republic of China and National Bureau of Statistics of the People’s Republic of China, 2013), soil erosion in the Daqing River Basin can be classified into six erosion classes (Table 3).
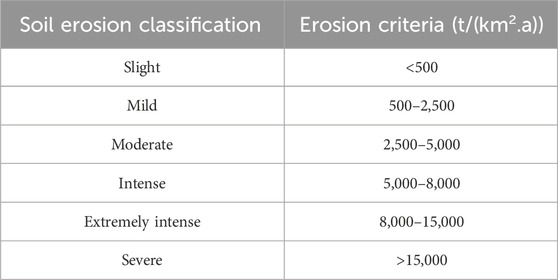
Table 3. Soil erosion intensity classification criteria.
2.6 Random forest
To compare and analyze the causes of the differences in soil erosion between the mountains and plains, random forest was employed to quantify the significance of each influencing factor across different terrain conditions. The random forest algorithm is a machine learning algorithm based on statistics that avoids the problem of multivariate covariance and has been applied in soil erosion driver analysis in recent years. Rigatti provided a comprehensive account of the random forest principle and its application methodology (Rigatti, 2017). This approach allows for the precise identification of the key factors influencing soil erosion and increases the understanding of the contributions of these factors.
2.7 PLS‒SEM analysis
In this work, the PLS‒SEM technique was adopted to determine the strength of each driver in different areas. The PLS‒SEM technique is a statistical analysis method in which partial least squares regression and SEM are combined, which is particularly suitable for analyzing small samples and non-normally distributed data. Structural equations encompass measurement equations and structural equations. Measurement equations refer to the relationships between the observed and latent variables, whereas structural equations refer to the relationships between the latent variables. The measurement equations can be expressed as follows Equation 11, 12:
where X and Y are vectors of the observed variables, ξ and η are vectors of the latent variables, ΛX and ΛY are factor loading matrices, and δ and ε are disturbance terms. The structural equation can be expressed as Equation 13:
where B is the relationship between the endogenous latent variables, Γ is the effect of the exogenous latent variables on the endogenous latent variables, and ζ is the error term.
3 Results and analysis
3.1 Spatiotemporal evolution of soil erosion in the Daqing river basin
3.1.1 Spatial distribution of the soil erosion intensity
The results of overlapping multiplication of each influencing factor of soil erosion indicated that the average total soil erosion area in the Daqing River Basin from 2000 to 2022 was stable at 40219.5 km2, with no significant change. However, the soil erosion level increased annually. The statistics of the average annual soil erosion modulus in the Daqing River Basin (including the entire basin, mountains and plains) between 2000 and 2022 are shown in Figure 2. The average annual soil erosion modulus in the Daqing River Basin (including the entire basin, its mountains and its plains) has increased over the past 23 years, suggesting that the soil erosion issue in this basin has intensified. The average annual soil erosion modulus was 159 t/(km2·a) throughout the basin, 386 t/(km2·a) in the mountains, and 1.1 t/(km2·a) in the plains. The soil erosion modulus in the mountain areas was significantly greater than that in the plain areas, accounting for most of the average annual soil erosion modulus across the entire basin. Furthermore, the soil erosion modulus in the entire Daqing River Basin and its mountains exhibited significant fluctuations from 2015 to 2020, a phenomenon largely attributed to the frequent occurrence of extreme weather events and accelerated urbanization. Extreme weather events, particularly successive periods of exceptionally high rainfall, have considerably increased the extent of soil erosion. Simultaneously, urbanization processes, such as the rapid expansion of the Xiong’an New Area, have initiated long-term changes in land-use patterns and vegetation coverage. There was a time lag in the impact of these changes on soil erosion, and the cumulative effect increased over time.
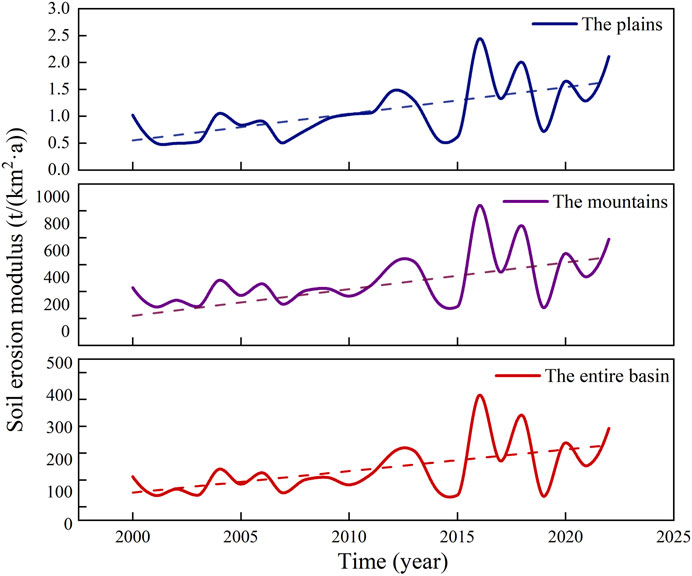
Figure 2. Soil erosion modulus curves for the Daqing River watershed, 2000–2022 (where the dotted line is the trend line).
To better understand the spatial and temporal evolution features of soil erosion, five key years, i.e., 2000, 2005, 2010, 2015, and 2022, were selected to classify the soil erosion intensity according to Table 3, and the area and proportion occupied by the different classes of soil erosion in the study area were calculated (Table 4). The results revealed that in terms of the soil erosion intensity across the entire Daqing River Basin, slight erosion accounted for the highest proportion, which mostly remained above 90% and reached as high as 96% in 2015. However, it dropped sharply to 84.6% in 2022, and the proportion of slight erosion in 2022 decreased by approximately 11.5% compared with that in 2015. Overall, slight erosion in the basin gradually increased, followed by stabilization and then a sharp decline. In contrast, mild erosion showed the opposite trend, initially decreasing, stabilizing, and finally increasing. Moreover, soil erosion in some areas was moderate or intense, whereas moderate soil erosion increased by 8 times from 2000 to 2022. Although the area of intense erosion was relatively small, its increase in recent years has been significant, with the area of intense erosion in 2022 expanding by 100 times compared with that in 2000. The areas and proportions of extremely intense erosion and severe erosion were the smallest. In 2000, 2005, 2010, and 2015, the area of extremely intense and severe erosion was 0 km2. By 2022, the area of extremely intense erosion had increased to 32.1 km2, accounting for approximately 0.08%, whereas the area of severe erosion had increased to 0.4 km2, representing approximately 0.001%.
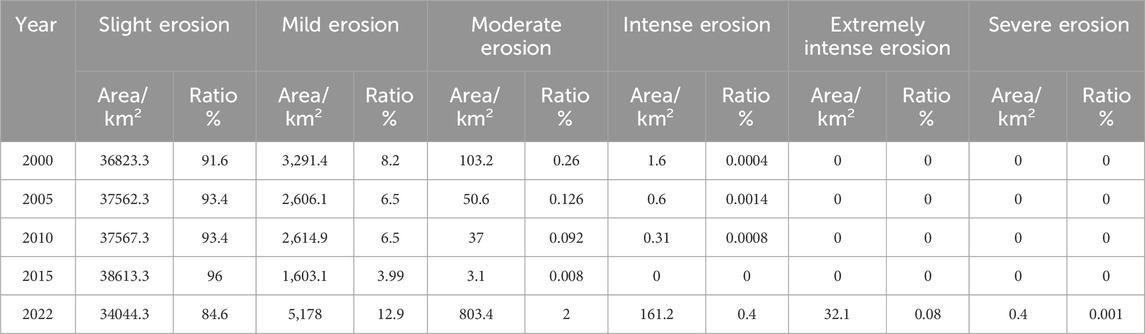
Table 4. Areas of soil erosion in the Daqing River Basin in 2000, 2011 and 2022.
Furthermore, a hierarchical map of the soil erosion modulus (Figure 3) and a distribution map of the changes in each influencing factor (Figure 5) were created to visualize the spatial and temporal evolution characteristics of soil erosion in the Daqing River Basin. A comparison of the data from 2000, 2005, 2010, 2015, and 2022 revealed that the distribution of the soil erosion intensity in the study area was low in the southeast and high in the northwest and that there was a notable difference in the erosion intensity between the plains and mountains. In 2000, plains experienced slight erosion, while the mountains predominantly experienced mild erosion. By 2005, slight erosion continued to prevail in the plains; however, the extent of slight erosion diminished as mild erosion expanded. This trend continued until 2010, when the erosion patterns in the mountains began to diverge: mild erosion lessened in the northeast but intensified in the southwest, maintaining a relatively stable overall erosion level. A significant shift occurred in 2015, marking a pivotal turning point. During this year, there was a marked reduction in mild erosion within the mountains, resulting in a notable decline in overall erosion across the entire basin. This change indicated a temporary improvement in soil erosion conditions. Nevertheless, by 2022, soil erosion in mountains had sharply worsened, with the area affected by mild erosion increasing substantially, surpassing previous levels.

Figure 3. Classification map of soil erosion in the Daqing River Basin in 2000, 2005, 2010, 2015, and 2022.
3.1.2 Dynamic changes in soil erosion classes
To better understand the dynamic changes in soil erosion in the Daqing River Basin, soil erosion was classified into six distinct intensity classes, and special attention was paid to the evolution of soil erosion intensity from 2000 to 2005, 2005 to 2010, 2010 to 2015, and 2015 to 2022.
The results presented in Figure 4 and Table 5 indicate the following trends. Between 2000 and 2005, slight erosion predominantly shifted to mild and moderate levels, whereas intense, extremely intense, and severe erosion transformed into lower levels. However, the extent of mild and moderate erosion increased significantly during this period. From 2005 to 2010, there was a degree of mutual transformation between different erosion classes, but the overall soil erosion situation remained relatively stable without drastic changes. During the period from 2010 to 2015, the overall erosion situation improved, with slight, mild, and moderate erosion becoming predominant. Different classes of erosion were more frequently transformed into mild erosion, with an increase of 2,962 km2 in mild erosion. Unfortunately, during the period from 2015 to 2022, the degree of erosion worsened significantly. Slight and mild erosion decreased markedly, whereas moderate, intense, extremely intense, and severe erosion increased substantially. Specifically, moderate erosion increased by 50 km2 and intense erosion increased by 10 km2; although extremely intense and severe erosion did not account for a large percentage of the area, their increase during this period was noteworthy.
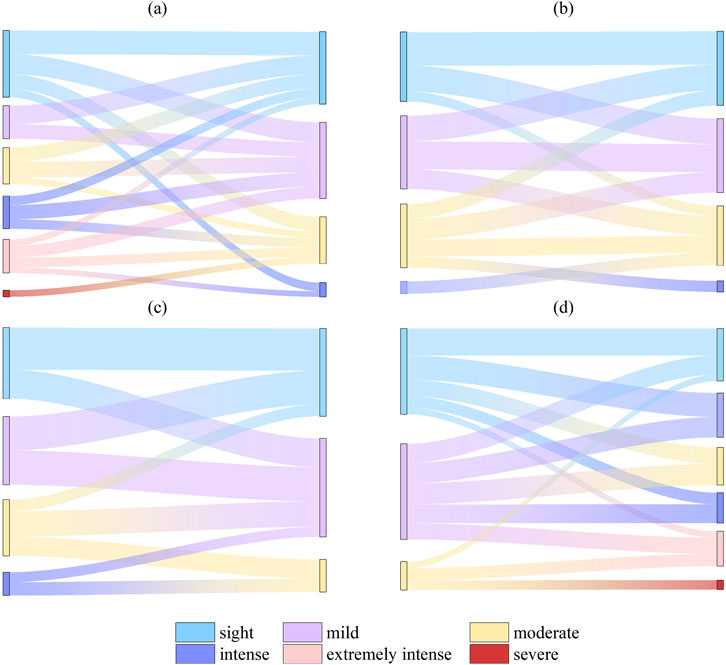
Figure 4. Soil erosion transfer at different levels in the Daqing River Basin from (a) 2000 to 2005, (b) 2005–2010, (c) 2010–2015, and (d) 2015–2022.

Table 5. Soil erosion intensity transfer matrix for the Daqing River Basin, 2000–2022 (km2).
In summary, the soil erosion trends in the Daqing River Basin from 2000 to 2022 were complex and characterized by initial improvements and subsequent deterioration. In the initial phase, there was an increase in the area of mild and moderate erosion and a decrease in the area of high erosion. The middle phase experienced a stabilization of erosion levels, followed by an improvement from 2010 to 2015. However, the period from 2015 to 2022 was characterized by a significant increase in high-level erosion, indicating a marked deterioration in soil conditions. This trend is closely linked to regional climate changes and shifts in land-use patterns, highlighting the urgent need to improve soil erosion control measures in the basin.
3.2 Attribution analysis of the differences in soil erosion between the mountain and plain areas
3.2.1 Spatiotemporal characteristics of the factors influencing soil erosion based on the RUSLE
Focusing on the period from 2000 to 2022, the change trends of the main influencing factors, namely, the rainfall erosivity factor (R), conservation practices factor (P), and cropping and management factor (C), were analyzed using the RUSLE model. However, considering that the soil erodibility factor (K) and the slope length and steepness factor (LS) typically exhibit a long period of change and that they remained relatively stable during the study period, their changes were not examined in this study.
As shown in Figure 5 spatially, the rainfall erosivity factor (R) was significantly greater in plains than in mountains. The greater rainfall intensity and flat topography of the plains facilitated the formation of surface runoff, thereby exacerbating soil erosion. In contrast, the cropping and management factor (C) was relatively high in the mountains because of the abundant natural vegetation, which provided a degree of protection for the soil and mitigated the erosion process. However, in recent years, the C factor in mountains has shown a decreasing trend, thus exacerbating the erosion problem. Furthermore, the P factor was significantly greater in the mountains than in the plains, indicating that there were deficiencies in the soil and water conservation measures in the mountains, thereby increasing the risk of soil erosion.
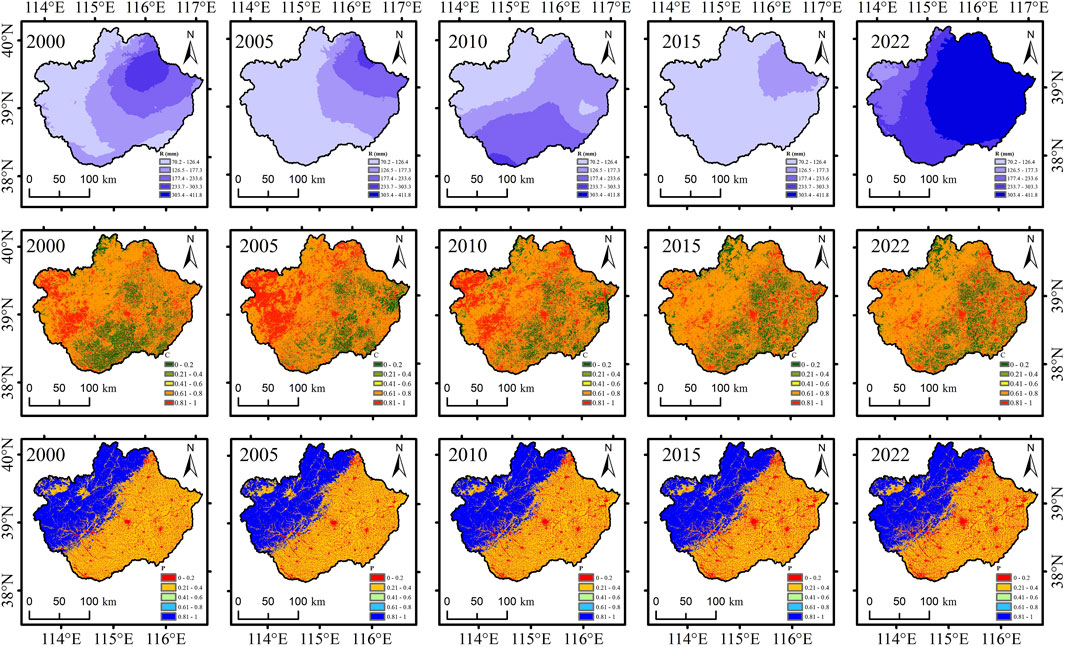
Figure 5. Distribution of the influencing factors in the Daqing River Basin in 2000, 2005, 2010, 2015, and 2022.
Figure 6 shows the changes in the soil erosion impact factors in the Daqing River Basin from 2000 to 2022. Over time, the P factor in the Daqing River Basin decreased from 2000 to 2022. The P value was related to land-use change. In this paper, we calculated the areas of cultivated land and woodland in the Daqing River Basin from 2000 to 2022. As shown in Figure 7, the cultivated land in the Daqing River Basin decreased annually, whereas the woodland area continuously increased. Specifically, the area of cultivated land decreased from 21,215 km2 in 2000 to 19,201 km2 in 2022, a decrease of 2014 km2, whereas the area of forested land continued to increase, from 7,299 km2 in 2000 to 8,282 km2 in 2022, an increase of approximately 13.5%. This shift shows that the soil and water conservation measures implemented in the region in recent years have achieved positive results. A reduction in cultivated land and increase in woodlands can help effectively control soil erosion by increasing vegetation coverage, improving soil structure, and reducing surface runoff. In contrast, the C factor in the mountainous region showed a decreasing trend, resulting in more severe soil erosion in the mountains, whereas the vegetation coverage in the plains increased. In addition, the maximum value of the R factor constantly exceeded the previous value, reflecting the frequent occurrence of extreme weather events. Moreover, extremely high temperatures and extreme precipitation events under global climate change significantly exacerbated soil erosion in the Daqing River Basin, especially in plains where the R factor was relatively high.
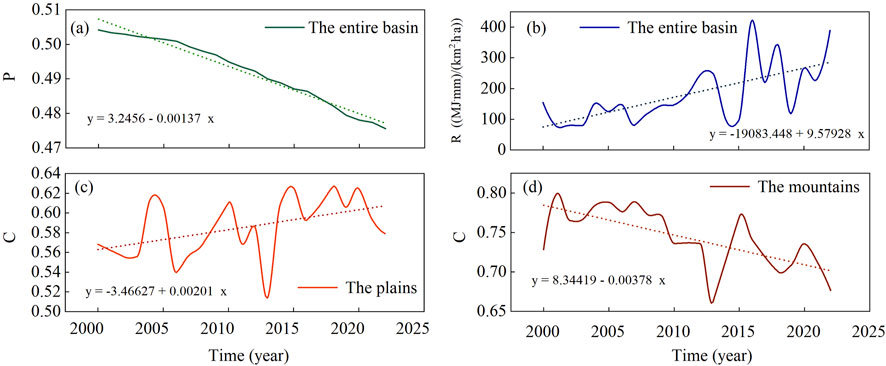
Figure 6. Changes in the influencing factors(a-d) in the Daqing River Basin, 2000-2022 (where the dotted line is the trend line).
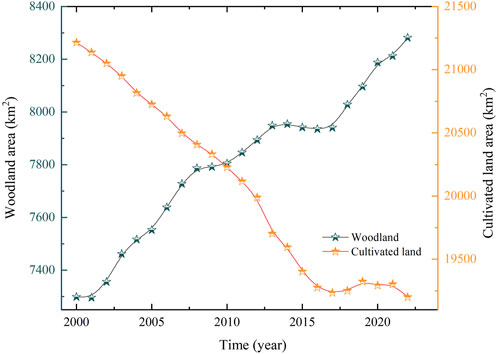
Figure 7. Changes in cultivated land and woodland areas in the Daqing River Basin, 2000–2022.
3.2.2 Analysis of soil erosion divergence drivers via random forest
Soil erosion is a complex process that is influenced by a multitude of factors, including natural elements such as precipitation, temperature, and vegetation coverage, as well as anthropogenic factors such as urbanized areas, population density, and GDP. This study offers a comprehensive analysis of soil erosion within the Daqing River Basin from 2000 to 2022 and a summary of the significance of the influence of natural and anthropogenic factors on soil erosion via random forest (Figure 8). This study collected GDP and population density data from counties in the Daqing River Basin’s mountainous and plain areas. The data provide a detailed picture of each region’s population and economic conditions.
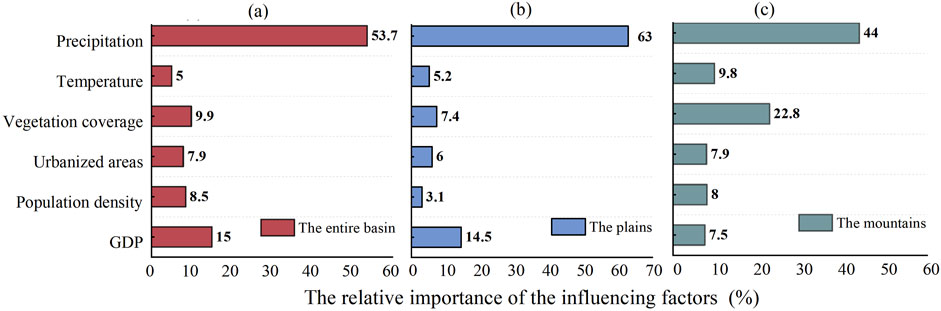
Figure 8. Random forest calculation results for the relative importance of the influencing factors. (a) The entire basin (b) The Plains (c) The mountains.
As illustrated in Figure 8, precipitation was the largest driver of soil erosion throughout the Daqing River Basin, accounting for 53.7% of the total erosion. In contrast, the impacts of GDP and vegetation coverage on soil erosion stood at 15% and 9.9%, respectively. This finding suggests that both economic activities and vegetation conditions play significant roles in soil erosion processes. In mountain areas, vegetation coverage (22.8%) played a crucial role, ranking second only to precipitation (44%) in its impact on soil erosion. The influence of temperature (9.8%) was also notable, suggesting that soil erosion on plains was driven primarily by climatic and vegetation factors. In contrast, on plains, precipitation had a more pronounced effect, accounting for 63% of soil erosion, while GDP (14.5%) surpassed both vegetation cover (7.4%) and temperature (5.2%). This result indicates that soil erosion on plains was closely linked to economic activities and changes in land-use.
In summary, precipitation was the largest driver of soil erosion across the entire Daqing River Basin. In mountains, vegetation coverage and temperature were secondary to precipitation in terms of their impact on soil erosion, whereas anthropogenic factors played a relatively minor role. In contrast, in plains, in addition to precipitation, GDP had a prominent effect on soil erosion, surpassing the effects of natural factors such as vegetation coverage and temperature.
3.2.3 Analysis of the intensity and direction of each driver via PLS‒SEM
PLS‒SEM analysis further revealed the effects of natural and anthropogenic factors on soil erosion in the mountains and plains of the Daqing River Basin. This method not only quantified the influence intensity of each factor but also clarified whether these factors had a positive or negative effect on soil erosion. In PLS-SEM, natural and anthropogenic factors were considered potential variables, whereas precipitation, vegetation coverage, temperature, urbanized areas, population density, and GDP were observed variables. The coefficients of the observed variables reflected the degree of their contributions to the potential variables and could not be directly equated with the importance of each factor to soil erosion (Sarstedt et al., 2021).
As shown in Figure 9, the contribution of the erosion modulus in the mountains (0.996) to the overall average erosion modulus for the entire basin was substantially greater than that in the plains (0.05). This indicates that mountainous areas dominated the soil erosion throughout the basin. In the mountains, natural factors significantly influenced soil erosion (0.677), far exceeding the impact of anthropogenic factors (0.005). Specifically, meteorological factors, including precipitation and temperature, played positive roles in promoting soil erosion and were closely associated with extreme weather events due to global climate change. Extreme weather events, such as heavy precipitation and drought, distinctly exacerbated soil erosion. Furthermore, the influence coefficient of vegetation coverage on soil erosion in mountains was −0.835, indicating that increased vegetation coverage led to a reduction in the degree of soil erosion. However, in combination with Figure 6D, it is evident that from 2000 to 2022, the cropping and management factor (C) in the mountains exhibited a declining trend. The loss of vegetation coverage weakened its ability to protect the soil, increasing its vulnerability to precipitation, thus increasing soil erosion in mountains. The decline in vegetation coverage was related mainly to climate change but was also indirectly affected by local human activities. Despite the relatively low level of human activity in mountains, occasional overgrazing or local deforestation can still adversely impact vegetation coverage, thereby increasing soil erosion.
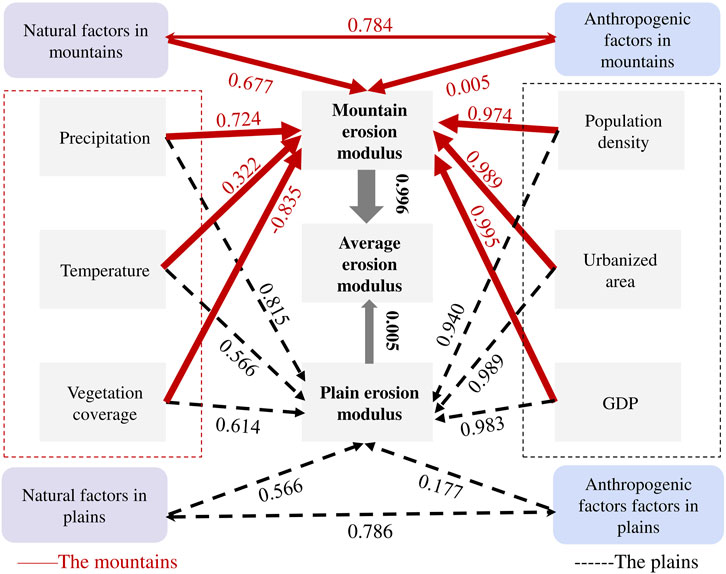
Figure 9. PLS-SEM results for the intensity and direction of each influencing factors.
In plains, the intensity of the influence of natural factors on soil erosion (0.566) was greater than that of anthropogenic factors (0.177). However, the impact of anthropogenic factors on plains (0.177) was significantly greater than that on mountains (0.005). Meteorological factors, such as precipitation and temperature, played relatively strong roles in plains. The flat terrain and low vegetation buffer in plains make it easy for precipitation to form runoff, whereas temperature changes directly affect soil properties, weakening soil erosion resistance and thereby exacerbating soil erosion. In contrast to mountains, the influence of vegetation coverage on soil erosion on plains had a coefficient of 0.614, indicating that greater vegetation coverage was associated with increased soil erosion. This phenomenon occurs because soil erosion in plains areas is generally low, and agricultural activities are predominant. The vegetation in plains primarily consists of crops, so an increase in vegetation coverage does not represent an increase in soil protection. In contrast, as crop coverage increases, both the intensity of agricultural soil development and use also tend to increase. As illustrated in Figure 6C, the cropping and management factor (C) in plains showed an increasing trend from 2000 to 2022. This increase in vegetation coverage was attributed primarily to the expansion of agricultural production rather than the restoration of natural vegetation. The persistent practice of monoculture and excessive cultivation resulted in the degradation of the soil structure and a decline in soil fertility. As a consequence, the inherent resistance of the soil to erosion significantly weakened, thereby exacerbating the problem of soil erosion (Abaci and Papanicolaou, 2009). Moreover, the urbanization process in plains led to the destruction of natural vegetation and the hardening of the soil surface. These changes led to increased surface runoff, reduced rainwater infiltration, compromised soil structure, diminished erosion resistance, and ultimately intensified soil erosion.
3.2.4 Analysis of interactions among various drivers via PLS‒SEM
Considering that natural and anthropogenic factors do not affect soil erosion in isolation but may interact with each other, this paper used PLS‒SEM analysis to explore the interactions between various influencing factors in mountains and plains. This approach helps to more comprehensively reveal how different factors work together in the soil erosion process.
As shown in Figure 10, there are strong synergistic effects between GDP and population density (0.953), GDP and urbanized area (0.998), and population density and urbanized area (0.934) in mountainous areas. However, vegetation coverage has antagonistic effects on urbanized areas (−0.720), population density (−0.626), and GDP (−0.732). This suggests that economic development, urbanization, and population growth are closely interlinked and may collectively exacerbate soil erosion. Economic growth in mountainous areas may rely on resource development, such as mining. These activities disrupt the natural surface and, combined with urbanization, destroy vegetation coverage, thereby exacerbating soil erosion. Additionally, there is an antagonistic effect between precipitation and vegetation coverage (−0.357), likely due to the impact of extreme climate events causing frequent heavy rainfall, which damages vegetation coverage and thus intensifies soil erosion.

Figure 10. Interaction of natural and anthropogenic factors in mountains and plains. (where X1 represents precipitation, X2 represents temperature, X3 represents vegetation coverage, X4 represents urbanized areas, X5 represents population density, and X6 represents GDP.)
In plains, there are also significant synergistic effects between GDP and population density (0.850), urbanized area and population density (0.820), and GDP and urbanized area (0.880). However, unlike mountains, anthropogenic factors such as GDP, population density, and urbanized areas exhibit a degree of synergistic action with vegetation coverage (0.450) in plains. This finding indicates that urbanization in plains may have advanced beyond the initial phase of vegetation destruction and has entered a stage of recovery. The observed enhancement in vegetation coverage can likely be attributed to the implementation of effective ecological protection measures, which have optimized land-use patterns and supported the restoration of vegetation. Additionally, meteorological factors (precipitation and temperature) and anthropogenic factors interact synergistically on plains, which demonstrates that urbanization on plains alters land-use (Chen et al., 2021), increases the frequency and intensity of extreme weather events, and ultimately accelerates soil erosion.
4 Discussion
4.1 Verification of the accuracy of the RUSLE model
This study systematically investigated the spatiotemporal characteristics of soil erosion in the Daqing River Basin from 2000 to 2022 via the RUSLE model. The research highlighted the different soil erosion patterns observed in mountains and plains. To validate the RUSLE model’s accuracy and reliability of the findings, the results of the current study were compared with research conducted in the Hai River Basin, North China Plain, and Taihang Mountain area. The comparison focused on three key aspects: spatial distribution characteristics, driving factors, and modulus comparisons. The details are presented below.
4.1.1 Spatial distribution characteristics
The distinct spatial distribution characteristics of soil erosion intensity in the Daqing River Basin were revealed in this study. Specifically, erosion intensity was lower in the southeast and higher in the northwest. A clear dividing line separated mountains from plains, with erosion intensity generally more distinct in mountains than in plains. This pattern closely aligned with the conclusions drawn by Li X.S. et al. in their research on the Hai River Basin, which also identified a similar boundary between mountains and plains, indicating a significantly greater risk of soil erosion in mountainous areas (Li et al., 2011). As a significant tributary of the Hai River Basin, the erosion characteristics observed in the Daqing River Basin further corroborate the overarching trends identified in the Hai River Basin, thereby reinforcing the validity and reliability of the results presented in this paper.
4.1.2 Driving factors
In this work, an analysis of the factors contributing to soil erosion in the Daqing River Basin from 2000 to 2022 revealed that precipitation was the largest driver of soil erosion intensity and its spatiotemporal distribution. This finding aligns closely with the research conducted by Wang H.Q. et al., who identified rainfall erosivity (R) as the primary factor influencing soil erosion in the North China Plain (Wang et al., 2021). Furthermore, a study by Li et al. (2020) confirmed that rainfall erosivity (R) was crucial to understanding the spatiotemporal variations in soil erosion across China. The consistency of these findings further reinforced the reliability of the conclusions presented in this paper and underscored the essential role of precipitation in the soil erosion process.
4.1.3 Modulus comparison
On the basis of the RUSLE model, the average annual soil erosion modulus in the mountains of the Daqing River Basin from 2000 to 2022 was calculated to be 386 t/(km2·a) in this paper. As a critical component of the Taihang Mountain area, the Daqing River Basin covers approximately one-tenth of the total area of the Taihang Mountain area. Drawing on the research by Wang F. et al., we scaled down the equivalent soil erosion modulus of the Taihang Mountain area to the Daqing River Basin. The results indicated that the soil erosion modulus for 2000, 2005, 2010, and 2015 were 443, 298, 176, and 183 t/(km2·a), respectively (Wang et al., 2022). These values exhibited high consistency in magnitude with the calculation results of this study, confirming the high level of reasonableness of our estimation. Furthermore, studies in the Taihang Mountain area have demonstrated that soil erosion in the area showed a significant improvement trend between 2000 and 2015. In this study, we found that 2015 emerged as a pivotal turning point in the spatiotemporal evolution of soil erosion in the Daqing River Basin, where the degree of soil erosion was markedly reduced. This finding aligns well with previous trends, further validating the reliability of the results presented in this study.
In conclusion, the soil erosion analysis results for the Daqing River Basin in this study demonstrated high reliability and could serve as scientific support for forthcoming related research and regional soil and water conservation efforts.
4.2 Management measures
In this study, random forest analysis (Figure 8) revealed the main drivers of soil erosion in the Daqing River Basin. The results revealed that precipitation was the largest driver of soil erosion throughout the basin. In the mountains, vegetation coverage and temperature were second only to precipitation in terms of the impact of soil erosion, whereas anthropogenic factors were relatively minor. In contrast, in plains, in addition to precipitation, the influence of GDP on soil erosion was prominent, exceeding the impacts of vegetation coverage and temperature on plain soil erosion. The PLS‒SEM analysis (Figure 9) indicated that natural factors generally exerted a greater influence on soil erosion than did anthropogenic factors throughout the basin. However, the impact of anthropogenic factors on soil erosion was more pronounced in plains than in mountains. Furthermore, the PLS‒SEM interaction analysis (Figure 10) demonstrated that there was strong synergy among various anthropogenic factors (urbanized areas, population density, and GDP) in the enclosed basin. In the mountains, anthropogenic factors were antagonistic to vegetation coverage, whereas in the plains, they were synergistic with vegetation coverage and meteorological factors.
To address the issue of soil erosion effectively in the Daqing River Basin, specific measures were proposed for mountains and plains in this study, focusing on three key aspects: ecological protection, land management, and sustainable development.
For ecological protection, mountains should prioritize enhancing vegetation coverage through initiatives such as afforestation and grassland restoration. These efforts will help mitigate soil erosion and preserve ecosystem integrity. Conversely, plains should aim to optimize land-use, manage urbanization rates, and plan land development to alleviate direct pressure on the soil and diminish the risk of soil erosion.
Regarding land management, it is crucial to address overexploitation and mitigate irresponsible human activities, such as overgrazing and deforestation, particularly in mountains. This strategy is essential for protecting natural vegetation and maintaining soil integrity. In contrast, on plains, promoting sustainable agricultural practices such as crop rotation, intercropping, and conservation tillage is essential to prevent overcultivation and reduce soil degradation and erosion.
To promote sustainable development, implementing ecological restoration initiatives in mountains, such as converting farmland back into forests, is vital. These efforts will enhance vegetation coverage in basins and improve the ecological environment. Furthermore, in plains, the construction of green infrastructure—including permeable paving, rain gardens, and green roofs—should be adopted to minimize surface runoff, reduce the risk of soil erosion, and increase the region’s capacity for sustainable development.
4.3 Limitations and future work
In this study, the R factor was calculated using only monthly precipitation data. Future research could incorporate climate models such as the Coupled Model Intercomparison Project Phase 6 (CMIP6) to include future precipitation projections and more comprehensively assess the impacts of climate change. The P factor was derived using traditional land-use classification methods without accounting for specific conservation practices like contour farming and terracing. High-resolution remote sensing could be employed in future studies to identify these practices and enhance accuracy. Due to data limitations, average county-level GDP and population density data were used for the Daqing River Basin. Future research could leverage more precise remote sensing data. Validation relied on literature from regions such as the Taihang Mountain area and North China Plain due to the absence of specific soil erosion studies for the Daqing River Basin, which constrains validation accuracy. Future work should prioritize collecting field data within the Daqing River Basin.
5 Conclusion
On the basis of the RUSLE model, this study focused on exploring the spatial and temporal evolution characteristics of soil erosion and its influencing factors in the Daqing River Basin from 2000 to 2022. To examine the impacts of both natural and anthropogenic factors and their interactions on soil erosion, the random forest and PLS-SEM methods were used. Furthermore, a comparative analysis of soil erosion between the mountains and plains was conducted, and the dominant influencing factors were identified. The conclusions are as follows:
(1) From 2000 to 2022, the total soil erosion area in the Daqing River Basin remained stable at 40219.5 km2, but the erosion intensity increased annually. The average annual erosion modulus was 159 t/(km2·a) for the entire basin, 386 t/(km2·a) in the mountains, and 1.1 t/(km2·a) in the plains, with the mountains contributing the majority of the total erosion. Erosion intensity increased from southeast to northwest, with mild to intense erosion in the mountains and slight erosion in the plains. Erosion first decreased and then sharply increased from 2000 to 2022, reaching its lowest level in 2015, which was a critical turning point.
(2) The spatial and temporal distributions of the soil erosion drivers varied markedly. Spatially, the value of the R factor was significantly greater in the plains than in the mountains. However, the values of the C factor and the P factor in the plains were lower than those in the mountains. Temporally, the entire basin exhibited a decreasing trend in the P factor from 2000 to 2022. Natural factors, especially precipitation, were the largest drivers of soil erosion in the Daqing River Basin. Anthropogenic factors had a stronger impact on soil erosion in the plains than in the mountains. There was strong synergy among various anthropogenic factors throughout the basin. In the mountains, anthropogenic factors were antagonistic to vegetation coverage, whereas in the plains, they were synergistic with vegetation coverage and meteorological factors.
(3) The RUSLE model results obtained in this paper are highly reliable. The management of the Daqing River Basin should prioritize ecological restoration and sustainable development. In the mountains, afforestation and reforestation should be prioritized to increase vegetation coverage. In the plains, land-use should be optimized and sustainable agriculture should be promoted.
Data availability statement
The original contributions presented in the study are included in the article/Supplementary Material, further inquiries can be directed to the corresponding authors.
Author contributions
MW: Conceptualization, Data curation, Investigation, Methodology, Software, Validation, Visualization, Writing – original draft, Writing – review and editing. YD: Conceptualization, Funding acquisition, Project administration, Resources, Writing – review and editing. YW: Conceptualization, Data curation, Formal Analysis, Methodology, Resources, Supervision, Validation, Writing – review and editing. ML: Validation, Writing – review and editing. XH: Visualization, Writing – review and editing. ZL: Investigation, Writing – review and editing.
Funding
The author(s) declare that financial support was received for the research and/or publication of this article. This research was funded by the National Key R&D Program of China (Grant no. 2019YFB2102003).
Conflict of interest
The authors declare that the research was conducted in the absence of any commercial or financial relationships that could be construed as potential conflicts of interest.
Generative AI statement
The author(s) declare that no Generative AI was used in the creation of this manuscript.
Publisher’s note
All claims expressed in this article are solely those of the authors and do not necessarily represent those of their affiliated organizations, or those of the publisher, the editors and the reviewers. Any product that may be evaluated in this article, or claim that may be made by its manufacturer, is not guaranteed or endorsed by the publisher.
Supplementary material
The Supplementary Material for this article can be found online at: https://www.frontiersin.org/articles/10.3389/fenvs.2025.1551743/full#supplementary-material
References
Abaci, O., and Papanicolaou, A. N. T. (2009). Long-term effects of management practices on water-driven soil erosion in an intense agricultural sub-watershed: monitoring and modelling. Hydrol. Process 23, 2818–2837. doi:10.1002/hyp.7380
Asis, A. M. D., and Omasa, K. (2007). Estimation of vegetation parameter for modeling soil erosion using linear spectral mixture analysis of landsat etm data. Isprs Photogramm. 62, 309–324. doi:10.1016/J.ISPRSJPRS.2007.05.013
Boardman, J., Evans, B., Favis-Mortlock, D., Foster, I., and Vandaele, K. (2023). Progress in soil erosion research: a european perspective. J. Soil Water Conserv. 78, 69–74. doi:10.2489/jswc.2023.0223a
Borrelli, P., Robinson, D. A., Fleischer, L. R., Lugato, E., Ballabio, C., Alewell, C., et al. (2017). An assessment of the global impact of 21st century land use change on soil erosion. Nat. Commun. 8, 2013. doi:10.1038/s41467-017-02142-7
Cai, C. F., and Ding, S. W. (2000). Study of applying usle and geographical information system idrisi to predict soil erosion in small watershed. J. Soil Water Conserv. 14, 19–24.
Cao, W., Liu, L., and Wu, D. (2018). Soil erosion changes and driving factors in the three-river headwaters region. Acta Prataculturae Sin. 27, 10–22. doi:10.11686/cyxb2017359
Chen, W. X., Zeng, J., and Li, N. (2021). Change in land-use structure due to urbanisation in China. J. Clena Prod. 321, 128986. doi:10.1016/j.jclepro.2021.128986
De Roo, A., Wesseling, C. G., and Ritsema, C. J. (1996). Lisem: a single-event physically based hydrological and soil erosion model for drainage basins. I: theory, input and output. Hydrol. Process 10, 1107–1117. doi:10.1002/(sici)1099-1085(199608)10:8<1107::aid-hyp415>3.3.co;2-w
Farhan, Y., and Nawaiseh, S. (2015). Spatial assessment of soil erosion risk using rusle and gis techniques. Environ. Earth Sci. 74, 4649–4669. doi:10.1007/s12665-015-4430-7
Feng, G., Cui, H., Yuan, L. U., Yan-Cheng, T., and Wei-Ning, L. I. (2014). Research on spatial distribution characteristics of soil erosion intensity based on terrain gradient—a case study in Qinjiang watershed. Res. Soil Water Conservation 21, 22–26.
Jiang, Z. (1996). Quantitative study on spatial variation of soil erosion in a small watershed in the loess hilly region. J Soil and Water Conservation 2, 1–9.
Jien, S. H., Chen, C. N., Dabo, L. M., Tfwala, S. S., and Kunene, N. H. (2023). Impact assessment of land use and land cover change on soil erosion at Laonung watershed in Taiwan. Environ. Earth Sci. 82, 593. doi:10.1007/s12665-023-11287-2
Li, J., Cao, Y. Q., Yao, J. Q., Jia, G. D., Quan, X. F., and Zhai, H. R. (2024). Temporal and spatial variation analysis of soil erosion in Beijing-Tianjin-Hebei region based on RUSLE model. Water Resour. Hydropower Eng. 55, 186–199. doi:10.13928/j.cnki.wrahe.2024.04.017
Li, J. L., Sun, R., Xiong, M. Q., and Yang, G. (2020). Estimation of soil erosion based on the RUSLE model in China. Acta Ecol. Sin. 40, 3473–3485. doi:10.5846/stxb201903290610
Li, X., Wu, B., Wang, H., and Zhang, J. (2011). Regional soil erosion risk assessment in Hai Basin. Yaogan Xuebao- J. Remote Sens. 15, 372–387. doi:10.11834/jrs.20110289
Liao, R. E., Qi, S., Lai, J. L., Tang, Y., and Li, P. (2024). Spatial-temporal variation and driving mechanism of water erosion in southwest alpine-canyon area of China. J Soil and Water Conservation 31, 139–147. doi:10.13869/j.cnki.rswc.2024.05.002
Liu, B. Y., Nearing, M. A., and Risse, L. M. (2000). Slope length effects on soil loss for steep slopes. Soil Sci. Soc. Am. J. 64, 1759–1763. doi:10.2136/sssaj2000.6451759x
Liu, B. Y., and Shi, P. J. (1992). Water erosion prediction project (wepp) model for watershed scale. Bull. Soil Water Conserv. 12, 1–9.
Lu, D., Li, G., Valladares, G. S., and Batistella, M. (2004). Mapping soil erosion risk in Rondônia, Brazilian Amazonia: using RUSLE, remote sensing and GIS. Land Degrad. Dev. 15, 499–512. doi:10.1002/ldr.634
Lu, X. X., and Shen, R. M. (1992). A preliminary study on the values k of soil erosibility factor. J. Soil Water Conserv. 6, 63–70.
Ma, C., Jiao, F., Wang, F., Ge, W., Ding, W., Liu, Y., et al. (2023). Review of studies on factors of USLE/RUSLE in China. Res. Soil Water Conservation 30, 430–436. doi:10.13869/j.cnki.rswc.20220601.001
Mccool, D. K., Brown, L. C., Foster, G. R., Mutchler, C. K., and Meyer, L. D. (1987). Revised slope steepness factor for the universal soil loss equation. Trans. Asae - Am. Soc. Agric. Eng. (Usa) 30, 1387–1396.
Ministry of Water Resources of the People's Republic of China and National Bureau of Statistics of the People's Republic of China (2013). The first national water resources census bulletin. China Water Conserv. doi:10.3969/j.iSSN.1000-1123.2013.07.002
Montanarella, L., Chude, V., Yagi, K., Krasilnikov, P., and Others, G. B. A. A. (2015). Status of the world's soil resources (SWSR) - main report. Status World's Soil Resour. (SWSR) - Main Rep.
Morgan, R. P. C., Quinton, J. N., Smith, R. E., Govers, G., Styczen, M. E., Auerswald, K., et al. (1998). The European soil erosion model (eurosem): a dynamic approach for predicting sediment transport from fields and small catchments. Earth Surf. Process Landf. 23, 527–544. doi:10.1002/(sici)1096-9837(199806)23:6<527::aid-esp868>3.0.co;2-5
Mu, X., Li, P., Liu, B., Zhao, G., Gao, P., and Sun, W. (2022). Spatial-temporal development and driving mechanisms of erosion on the Chinese loess plateau between 1901 and 2016. Yellow River 44, 36–45. doi:10.3969/j.issn.1000-1379.2022.09.007
Owens, P. N., and Collins, A. J. (2007). Soil erosion and sediment redistribution in river catchments: measurement, modelling and management. Soil Sci. 172, 941. doi:10.1097/ss.0b013e318158a028
Pimentel, D. (2006). Soil erosion: a food and environmental threat. Environ. Dev. Sustain. 8, 119–137. doi:10.1007/s10668-005-1262-8
Renard, K. G., Foster, G. R., Weesies, G. A., Mccool, D. K., and Yoder, D. C. (1997). “Predicting soil erosion by water: a guide to conservation planning with the revised universal soil loss equation (rusle),” in Agricultural handbook.
Renard, K. G., Foster, G. R., Weesies, G. A., and Porter, J. P. (1991). RUSLE: revised universal soil loss equation. J Soil and Water Conservation 46, 30–33.
Sarstedt, M., Ringle, C., and Hair, J. F. (2021). Partial least squares structural equation modeling. 1, 47, doi:10.1007/978-3-319-05542-8_15-2
Shoumik, B. A. A., Khan, M. Z., and Islam, M. S. (2023). Soil erosion estimation by RUSLE model using GIS and remote sensing techniques: a case study of the tertiary hilly regions in Bangladesh from 2017 to 2021. Environ. Monit. Assess. 195, 1096. doi:10.1007/s10661-023-11699-4
Talebi, A., and Karimi, Z. (2024). Incorporation of management responses in the direction of soil erosion changes from the past to the future based on the RUSLE and DPSIR model. Environ. Sustain Ind. 23, 100412. doi:10.1016/j.indic.2024.100412
Tong, S., Wu-Qun, C., Qiu-Yu, B., Xiao, M., and Dong, L. (2021). Analysis on historical flood and countermeasures in prevention and control of flood in Daqing river basin. Environ. Res. 196, 110895. doi:10.1016/j.envres.2021.110895
Wang, F., Liu, J., Fu, T., Gao, H., and Qi, F. (2022). Spatio-temporal variations in soil erosion and its influence factors in taihang mountain area based on rusle modeling. Chin. J. Eco-Agriculture 30, 1064–1076. doi:10.12357/cjea.20220043
Wang, H. Q., Song, B. P., Yu, X. X., Xin, Z. B., and Jia, G. D. (2021). Spatio-temporal variations of soil erosion and its drivers in the northern region of north China. Sci. Soil Water Conservation 19, 8–18. doi:10.16843/j.sswc.2021.03.002
Wang, W. Z., and Jiao, J. Y. (1996). Quantitative evaluation on factors influencing soil erosion in China. Bull. Soil Water Conserv. 16, 1–20.
Wischmeier, W. H., and Smith, D. D. (1965). “Predicting rainfall-erosion losses from cropland east of the rocky mountains,” in Agricultural handbook 282.
Wuepper, D., Borrelli, P., and Finger, R. (2020). Countries and the global rate of soil erosion. Nat. Sustain 3, 51–55. doi:10.1038/s41893-019-0438-4
Xiong, M., and Leng, G. (2024). Global soil water erosion responses to climate and land use changes. Catena 241, 108043. doi:10.1016/j.catena.2024.108043
Xu, F., Guo, S. Y., and Zhang, Z. X. (2002). Soil erosion in China based on the 2000 national remote sensing survey. J. Geogr. Sci. 12, 435–442. doi:10.1007/bf02844601
Xu, X., Liu, J. M., Zhang, J. T., Ji, M. F., Zhang, K., and Shi, S. L. (2024). Spatial and temporal distribution characteristics of rainfall in Daqing river basin in the haihe “23·7” basin-wide extreme flood. China Flood and Drought Manag. 34, 45–51. doi:10.16867/j.issn.1673-9264.2023428
Xu, Y. J., Yao, Z. H., and Zhao, D. B. (2012). Estimating soil erosion in north China plain based on Rs/Gis and RUSLE. Bull. Soil Water Conserv. 32, 217–221.
Yang, Y., Deng, X., Li, Z., Wu, F., and Li, X. (2017). Impact of land use change on grain production efficiency in north China plain during 2000–2015. Geogr. Res. 36, 2171–2183. doi:10.11821/dlyj201711011
Zhang, K. L., Shu, A. P., Xu, X. L., Yang, Q. K., and Yu, B. (2008). Soil erodibility and its estimation for agricultural soils in China. J. Arid. Environ. 72, 1002–1011. doi:10.1016/j.jaridenv.2007.11.018
Zhang, X., Hu, M., Guo, X., Yang, H., Zhang, Z., and Zhang, K. (2018). Effects of topographic factors on runoff and soil loss in southwest China. Catena (Amst) 160, 394–402. doi:10.1016/j.catena.2017.10.013
Zheng, F., Liu, F., Yang, Q., and Jiang, Z. S. (2001). Review of research progress in soil erosion prediction model. Bull. Soil Water Conserv. 21, 16–18.
Keywords: soil erosion, RUSLE model, spatiotemporal evolution, mountain-plain comparison, PLS-SEM, Daqing river basin
Citation: Wang M, Ding Y, Wang Y, Liu M, Han X and Luan Z (2025) Spatiotemporal dynamics of soil erosion in the Daqing river basin: a comparative analysis of mountains and plains. Front. Environ. Sci. 13:1551743. doi: 10.3389/fenvs.2025.1551743
Received: 26 December 2024; Accepted: 21 April 2025;
Published: 09 May 2025.
Edited by:
Junfeng Xiong, Chinese Academy of Sciences (CAS), ChinaReviewed by:
Haimanot B. Atinkut, Bahir Dar University, EthiopiaJianwei Geng, Chinese Academy of Sciences (CAS), China
Delin Xu, Ministry of Ecology and Environment, China
Copyright © 2025 Wang, Ding, Wang, Liu, Han and Luan. This is an open-access article distributed under the terms of the Creative Commons Attribution License (CC BY). The use, distribution or reproduction in other forums is permitted, provided the original author(s) and the copyright owner(s) are credited and that the original publication in this journal is cited, in accordance with accepted academic practice. No use, distribution or reproduction is permitted which does not comply with these terms.
*Correspondence: Yuanyuan Ding, eXVhbnl1YW5kaW5nQG51aXN0LmVkdS5jbg==