 Feiyan Zhao1
 Zhongju Meng
 Guodong Tang
- 1College of Desert Control Science and Engineering, Inner Mongolia Agricultural University, Hohhot, China
- 2Inner Mongolia Water Conservancy Research Institute, Hohhot, China
- 3The Comprehensive Support Center of Audit Bureau of Ulanqab City, Ulanqab, China
- 4Institute of Water Resources for Pastoral Area Ministry of Water Resources, Hohhot, China
There is an inevitable relationship between the size of soil particles and the distribution of organic matter. The soil texture in desert photovoltaic areas is poor, with variations in soil particle size and organic matter. This study explores the heterogeneity of soil particle size and organic matter distribution at different zonal scales, aiming to clarify the impact of photovoltaic array construction on microtopography and, consequently, on these indicators. This will facilitate precise vegetation restoration based on the distribution of nutrients within the region. Baced on the Kubuqi Desert photovoltaic area as the research area, the soil particle size in the 0–30 cm soil layer and the distribution of soil organic matter in the main particle size range (<250 μm, <500 μm) in this area were analyzed. Fine sand (particle size 100–250 μm) was the main component of the soil; the carbon and nitrogen stocks in the upper 0–30 cm of soil diminished linearly with escalating wind speed gradient, from 70.76 Mg C ha−1 to 53.82 Mg C ha−1 and from 13.96 Mg N ha−1 to 8.12 Mg N ha−1. The total carbon and nitrogen levels in the two soil particle sizes, together with their contribution to total soil organic carbon, diminished as the wind speed gradient intensified, with the reduction in organic carbon content becoming stronger. The organic carbon content of soil particles <250 μm accounted for 63.7%–98.6% of the total soil organic carbon, while that of particles 250μm–500 μm only accounted for 3.32%–33.34%. SOC was significantly higher in the 0–5 cm layer than in the 5–30 cm layer in all areas of the photovoltaic array. Wind causes changes in sand particle transport in PV arrays, and may also alter the microclimate environment leading to differences in soil decomposition cycling processes, which can exhibit uneven organic carbon and nitrogen distribution between particles. Our research demonstrates the internal distribution of soil carbon and nitrogen reserves in each region of the photovoltaic array, establishing a robust foundation for subsequent vegetation restoration and plant species selection in each region, thereby implementing the “photovoltaic + ecological” governance model.
1 Introduction
Soil constitutes the most extensive carbon storage within terrestrial ecosystems. The organic carbon content in the soil to a depth of 1 m is approximately three fold the total carbon reservoir in the biosphere and double that of the total carbon reservoir in the atmosphere. (Li et al., 2024). Particles of different sizes store soil organic carbon, and the physicochemical properties of silt and even clay positively correlate with more than half of the organic carbon (Lavallee et al., 2020; Sokol et al., 2022). The distribution of particle sizes in various soils significantly influences the concentration of soil organic carbon, form of existence, migration process, decomposition rate, and stability of the organic carbon pool (Zhang et al., 2023). In the degradation of soil organic carbon, active organic carbon is predominantly found in soil particles sized >50 μm and <2 μm. (Lützow et al., 2006). Coarse–free particles of organic carbon constitute 70.63%–76.53% of the total amount of organic carbon in the soil, representing the primary type of soil organic carbon sequestration. It is also unprotected, highly active organic carbon, which is more likely to be released due to the influence of the environment and human activities (He et al., 2023). It typically interacts with a mineral surface that contains a lower amount of organic carbon. Contact with microorganisms reduces the rate of decomposition (Heckman et al., 2022). Enhancing plant diversity and productivity gradually alters the process of soil organic carbon input through vegetation restoration. (Deng et al., 2014; Qu et al., 2024; Liu et al., 2020b; Qu et al., 2022). This alters the rate of soil organic carbon turnover. (Liu et al., 2020a; Li et al., 2020; Qu et al., 2022). The accumulation of organic carbon in soil results from the equilibrium between carbon input and output. (Srivastava et al., 2020). The quantity, distribution, and dynamics of clay and silt associated organic carbon are reliably observed throughout a wide range of ecosystems and climate zones (Cotrufo et al., 2019; Georgiou et al., 2022). Organic carbon and total nitrogen in sand grains are generally thought to be the primary active organic carbon and nitrogen components. On the other hand, organic carbon and total nitrogen in clay and silt grains are considered to be inactive carbon and nitrogen components. (Christensen, 1992). Desertified land accounts for about 25% of the global land area, and soil carbon reserves in desert areas account for 9.5% of the total soil carbon reserves (Poulter et al., 2014). Despite the fact that desert ecosystems are a substantial portion of terrestrial ecosystems, they display distinctive traits that are associated with the presence of soil organic carbon in the soil particle size fraction. In desert areas, we may observe the following phenomena: extremely low land productivity; coarse particles dominate the soil’s mechanical composition; natural climate influences reduce the intensity of microbial activity; and the accumulation of organic carbon in coarse particles (Sokol and Bradford, 2019). The minimal intake of organic matter renders the organic carbon in clay and silt independent of their respective contents (Hassink, 1997). Wind erosion is the main factor controlling the particle size composition. High wind erosion intensity results in a large proportion of coarse particles. The arrangement of soil particles, encompassing their clay and silt proportions, affects wind erosion and dictates the role of soil particle–bound carbon in soil organic carbon. (Liu J. et al., 2021; Lei et al., 2019; Zhao et al., 2019). However, wind erosion accumulation affects the desert photovoltaic area, where the landform primarily consists of undulating sand dunes. Less agglomeration disperses the particles, and their resistance to wind erosion is low. The soil nutrients are poor, which is not conducive to plant growth. The vegetation is extremely sparse, the psammophytes are scattered, and the economic value utilization rate is small. The primary reason for this is that sandy land has a single mineral particle composition, with a concentration of particles between 0.05 and 1 mm. Vegetation restoration can be carried out on this basis, and the particle size composition and mineral composition can be changed to completely change its nutrient coordination and supply, water holding capacity, and sand fixation resistance. It is the fundamental measure to improve the productivity and ecosystem service value of sandy land (Ni et al., 2018). In recent years, some researchers have linked SOC grouping with soil particle classification and systematically classified the status quo by combining SOC with soil particles of different particle sizes, such as sand (>53 μm), silt (2–53 μm), and clay (<2 μm). Vegetation construction within the environmental tolerance threshold is the key to reversing the trend of land desertification, promoting sand and soil formation, and creating productivity (Zhang et al., 2014).
The Kubuqi Desert is surrounded by the Yellow River on the north-west, north-east, east sides, and a large amount of sand and dust from the Yellow River is deposited here. The large-scale development of the photovoltaic industry based on sufficient sunshine has not only changed the microenvironment of the surface but also affected the structure of the sand and dust flow. The spatial distribution of particles dictates the composition of soil particles (Lopez and Bacilio, 2020; Slessarev et al., 2022). The desert area has changed the original radiation balance through the construction of photovoltaic power stations. At the same time, the physical existence of photovoltaic panels has a shading effect on the surface and also affects the air flow on the surface, thus affecting the air temperature and relative humidity pattern. Barron-Gafford’s on-site observation of the Tucson photovoltaic electric field in the United States found that the photovoltaic electric field has a heat island effect, with an average annual temperature increase of 2.4°C at a height of 2.5 m and a nighttime temperature increase of 3°C–4°C (Barron-Gafford et al., 2016). Parrat’s wind tunnel test shows that the photovoltaic panel only reduces the turbulence intensity above and around it but has no significant effect on the average wind speed and wind direction. The photovoltaic field primarily influences air turbulence in the wind field (Pratt and Kopp, 2013). At the same time, during the operation period of the photovoltaic electric field, the layout of the photovoltaic array will increase the surface roughness and change the law of surface sediment transport and sedimentation. Our research team has concluded that the average particle size in the windward direction of the photovoltaic electric field is larger than that in the leeward direction. The soil particles in the leeward direction show a trend of refinement, while the soil particles in the main wind direction show a trend of coarsening. The accumulation degree of very fine sand and fine sand particles in the soil particle size from the outer edge of the photovoltaic electric field to the center of the photovoltaic electric field gradually increases. Studies have shown that the construction of photovoltaic power plants significantly increased soil organic matter, total nitrogen, and ammonium nitrogen content (Ding and Liu, 2021). The construction of a photovoltaic power station in a desert area can realize the ecological value of windbreak and sand fixation, improving microclimate, carbon fixation, and efficiency enhancement. Therefore, the construction of this project in a desert area considers the mutual benefits of energy supply and ecological enhancement. Thus far, limited research has examined the correlation between soil particle size and organic carbon in desert photovoltaic regions. This gap in knowledge hinders our understanding of the influence of soil texture on the accumulation and storage of organic carbon and nitrogen in this area, as well as soil management measures and vegetation restoration.
In general, the construction of photovoltaic power stations in desert areas has the potential to reduce the harm caused by strong winds and sand. However, the current research mostly focuses on changes in wind speed and soil texture between different positions of photovoltaic panels. There are few studies on organic reserves in photovoltaic array space. It is necessary to systematically carry out this evaluation study to clarify the direction of vegetation restoration and the photovoltaic industry in the later stage. Therefore, this study takes the photovoltaic array in the middle of the Kubuqi Desert as an example to evaluate the soil particle size distribution and the content of organic matter in the particle size range of each level in the region in order to provide a reference for the efficient use of the existing resources within the array to develop a sustainable new energy industry.
2 Materials and methods
2.1 Study site description
The research region exhibits characteristic climatic characteristics (arid and semi-arid) and soil types (calcium-rich grey soil, grey desert soil, and loess) prevalent in the deserts of northern China. The latitude ranges from 37.2°N to 39.5°N, and the longitude is from 107.1°E ∼ 111.5°E. The mean annual precipitation (MAP) is between 150 mm and 400 mm, while the mean annual temperature (MAT) varies between 5°C and 8°C. The mean evapotranspiration (ET) ranges from 2,100 mm to 2,700 mm, the aridity index (1-AI) varies between 0.85 and 0.93, and the predominant flora in this region consists of sand willow (Salix psammophila), sand whip (Psammochloa villosa), small-leaved golden chicken (Caragana microphylla), and sand wormwood (Artemisia desertorum) (Figure 1).
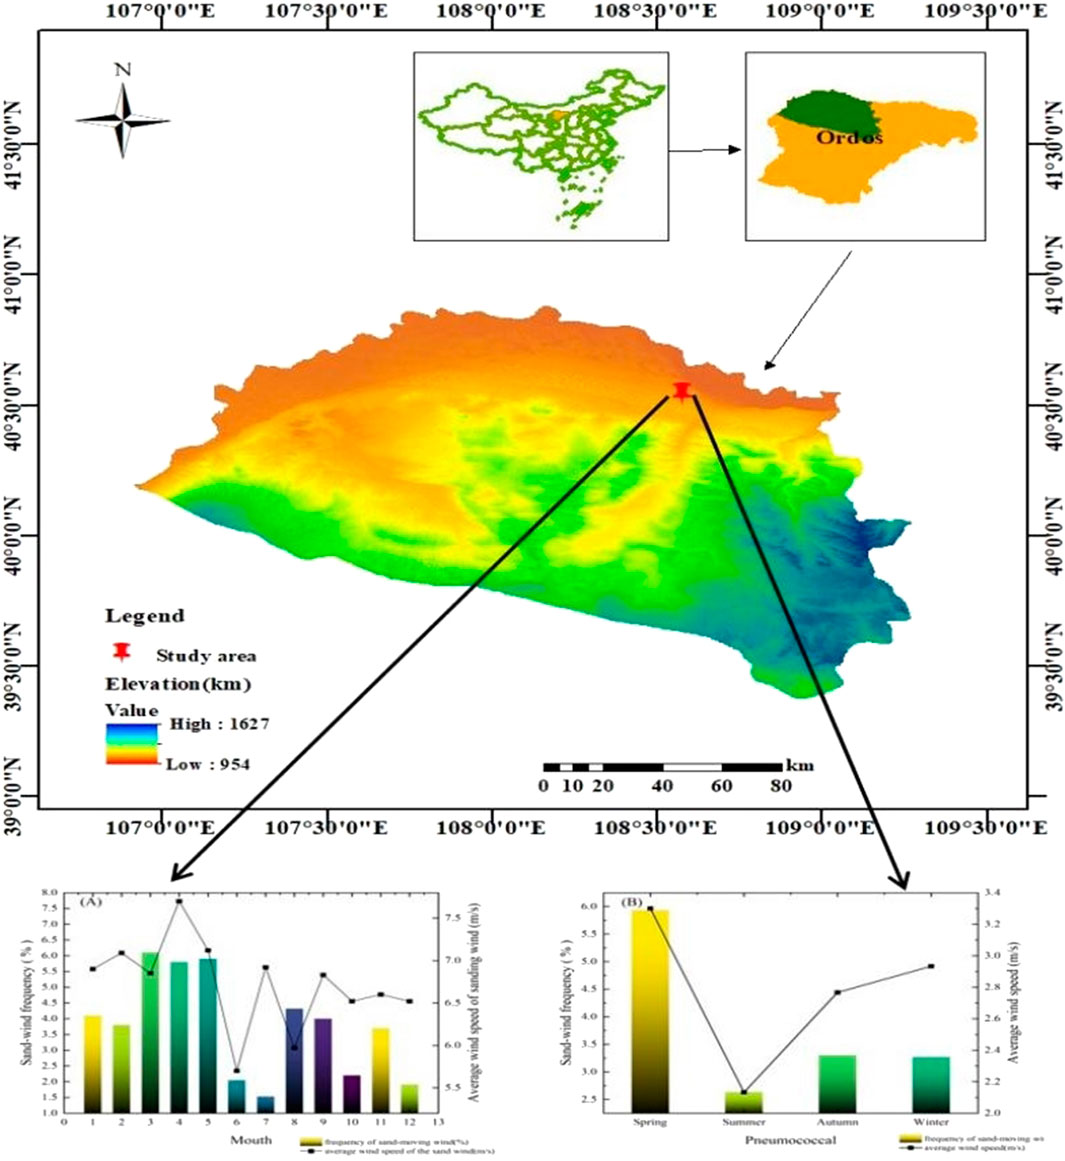
Figure 1. Overview map of the research area.
2.2 Field sampling
Soil samples were collected at 12 sample points throughout the photovoltaic array, including 3 sample points from an open area outside the photovoltaic array (A), 3 sample points from the outer perimeter of the photovoltaic array near the wind measurement (B), 3 sample points from the middle of the photovoltaic array (C), and 3 sample points from the inner part of the photovoltaic array near the leeward measurement (D). The average wind speed of the four regional sampling points is A>C>B > D. For each sample point, a 1 m × 1 m plot was established, and five samples were obtained using a soil auger from the four corners and center. We mixed soil samples from the same depth (0–5 cm, 5–10 cm, and 10–30 cm) for each plot. In the lab, the soil was sieved through a 2.0 mm sieve and divided into two subsamples: one for air-dried physical and chemical analysis, including particle size classification and organic carbon and nitrogen determination, and one for ring knife soil bulk density (BD) sampling Equation 1.
where V is the ring knife volume (cm3); W1 is the weight of the soil + ring knife after drying (g); and W0 is the ring knife weight (g).
2.3 Soil particle size determination and classification
The soil samples were air-dried, sieved through 2 mm, then evaluated using PSD. The material was dispersed with sodium hexametaphosphate, organic debris removed with 10% hydrogen peroxide, and carbonates removed with 10% hydrochloric acid. We assessed PSD for each sample after pretreatment. We used a Mastersizer 3,000 laser particle size analyzer to make the measurements. Each sample was measured three times, and the average was used as the final measurement. We used a volume percentage unit with a repeatability of less than 0.5% and an accuracy error of less than 1%. USDA soil texture classification standard (Folk and Ward, 1957), and the soil particle size is divided into four grades according to the actual situation of the sample plot: very fine sand particles (50–100 μm), fine sand particles (100–250 μm), medium sand particles (250–500 μm), and coarse sand particles (500–1,000 μm). Soil particle size classification methods are important because different methods often lead to different conclusions depending on the technology used (Smith and Waring, 2019; Xu et al., 2017). Ultrasonic dispersion, chemical and density classification, and wet and dry sieving are the most commonly used methods (Gregorich et al., 2006; Moni et al., 2012). The tiny proportion of clay in the soil distribution of the experimental plot is even undetectable, so dry sieving has a less significant effect on the organic carbon of sandy soil. Place 100 g of soil in a sieve containing fine sand and medium sand, and connect the sieve cover to the sieve shaker (Mendes et al., 1999; Schutter and Dick, 2002). The soil particles were dried at 120°C for 48 h and weighed after shaking the sieve at 600 r min−1 for 2 min until no change in soil mass occurred. We repeated these steps twice for each soil sample. We held the soil in plastic bags until we determined C and N. We estimated the soil mass fractions for each particle size class using the Equations 2, 3.
The soil quality recovery rate R is calculated and announced as follows:
2.4 Determination of soil organic carbon and nitrogen
Soil particles <250 μm and <500 μm were used to measure organic carbon and nitrogen levels. 1.0 g of dry soil was treated with 0.1 mol/L HCl at 25°C for 24 h to remove carbonates (Midwood and Boutton, 1998), washed with ultrapure water until neutral, air-dried, crushed, and sieved through a 0.149 mm SOC, and TN were measured with a complete C/N analyzer. Soil organic C (g C kg−1), total N (g N kg−1), and particle size <250 and <500 μm concentrations were estimated from dry soil mass (1 g) before HCl treatment. Soil organic carbon (Mg C ha−1) and nitrogen (Mg N ha−1) stocks were calculated as follows Equations 4, 5:
where T represents the soil thickness (cm), BD represents soil bulk density (g/cm−3), C represents soil organic C concentration (g/kg),N represents soil total N concentration (g/kg).
3 Results and analysis
3.1 Soil particle size composition
In the four areas of this study, the wind speed decreased from CK to the interior of the photovoltaic array and then increased before decreasing again. The overall trend was A > C > B > D. As can be seen in Figure 2, in the 0–30 cm soil of the study area, particle composition is dominated by fine sand (53.83%–66.62%) and medium sand (27.76%–38.77%), with a low content of very fine sand (0.57%–4.92%). The volume percentage of fine sand in the soil generally decreases with increasing soil depth, while the volume percentage of coarse particles changes with soil depth in the opposite direction to fine sand. There are significant differences in the soil particle size distribution in each region of the same soil layer with wind speed. The content of medium and fine sand in 0–5 cm is significantly higher than that in other regions at each wind speed gradient. The content of coarse particles in different soil layers at points A and B is significantly different. Wind speed activities also clearly affect fine particles.
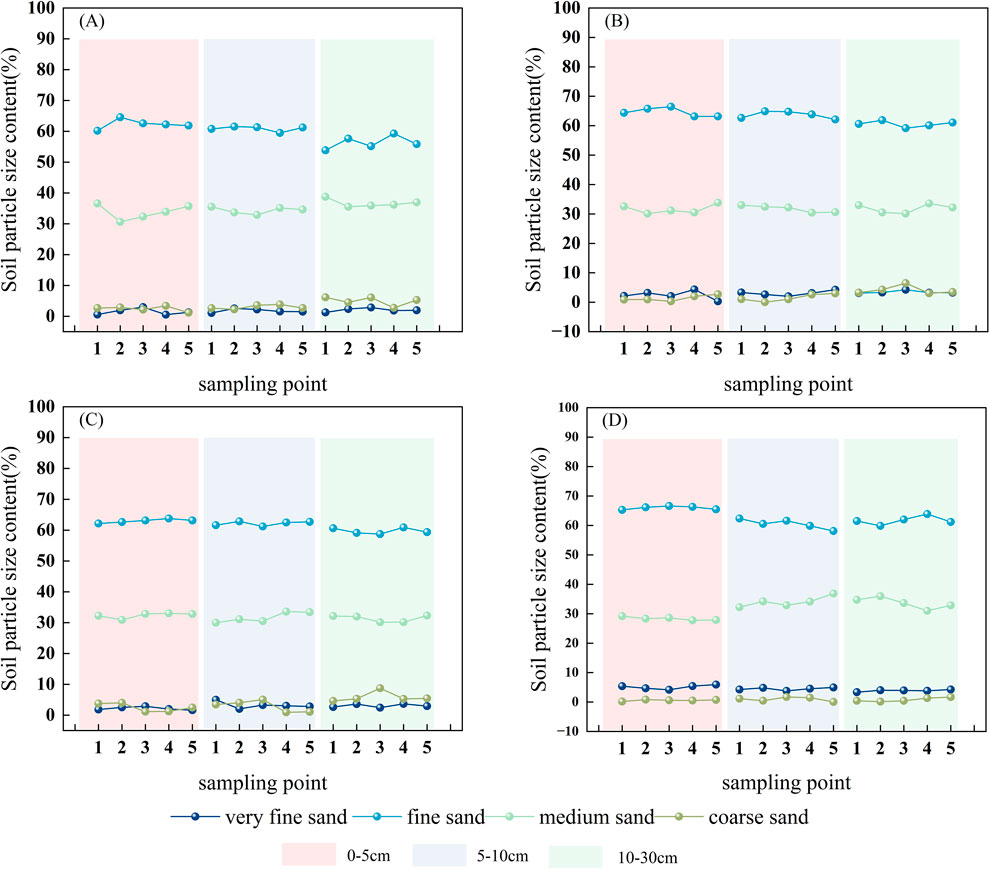
Figure 2. Soil particle size composition by region (A–D) in the figure represent 4 samples respectively).
3.2 Soil carbon and nitrogen storage and particle size distribution
The C and N storage in the top 30 cm of soil decreased linearly with increasing wind speed gradient, from 70.76 Mg C ha−1 to 53.82 Mg C ha−1 and from 13.96 Mg N ha−1 to 8.12 Mg N ha−1, respectively (Figures 3, 4). The soil organic C (OC250) and N (N 250) contents of the <250 μm particle size decreased linearly with the increase of wind speed gradient. The organic C (OC500) and N (N500) in soil particles <500 μm increased with the wind speed gradient, among which N500, but the difference was not significant. With the increase of wind speed gradient, the proportion of soil organic carbon reserves in <250 μm soil to total soil carbon reserves (OC250/SOC) decreased from 98.6% to 63.70%, and the proportion of N (N250/TN) decreased from 98.6% to 60.3%. At the same time, the proportion of soil particle composition with organic carbon reserves of <500 μm (OC500/SOC) decreased from 35.2% to 0.8%, and N 500/TN decreased from 7.8% to 0.4%.
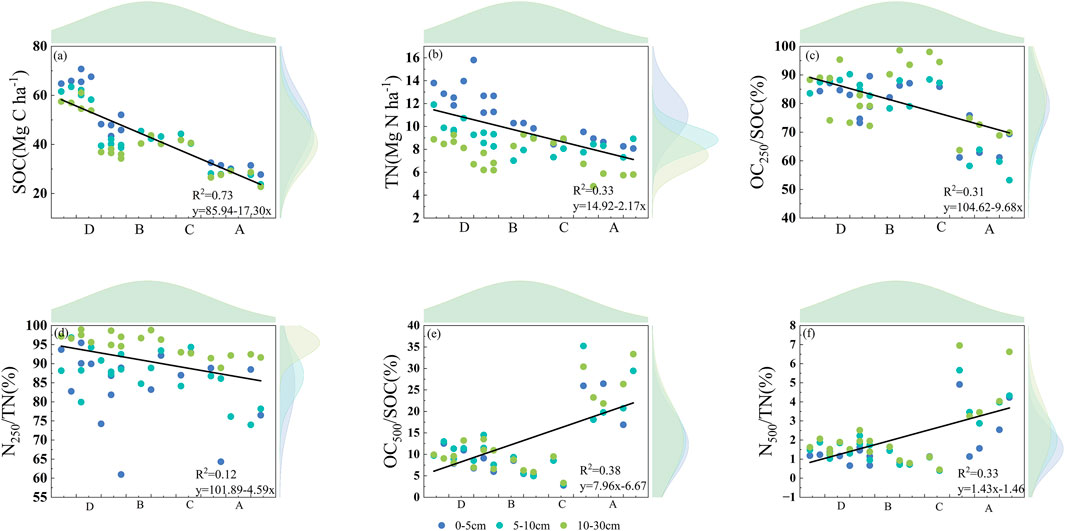
Figure 3. The proportion of organic C and N reserves in the two particle size groups to the soil organic reserves in the 0–30 cm soil layer as a function of wind speed (a–d) in the figure represent 4 samples respectively; Wind speeds show an increasing trend from D to A, at the same time, (a, c, e) represents C index, (B, D, F) represents N index.).
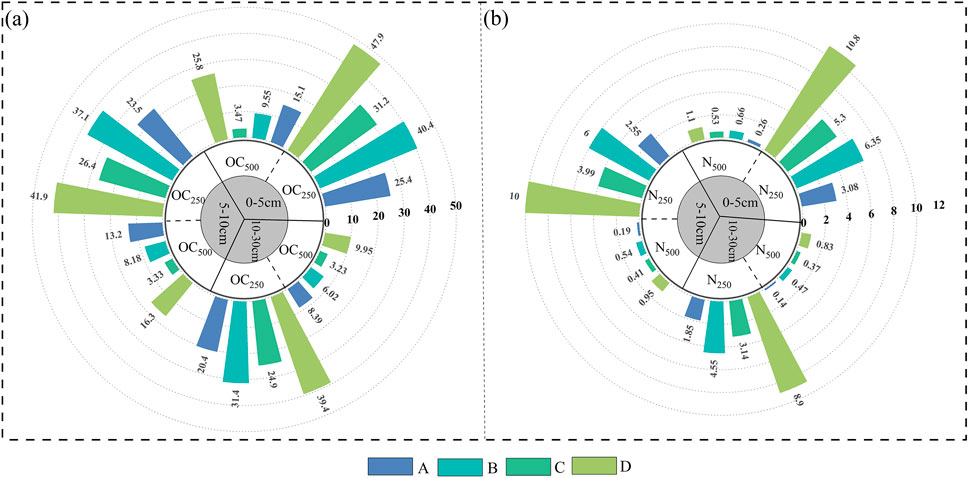
Figure 4. Relationship between organic carbon (nitrogen) storage and soil organic carbon (nitrogen) storage in two of the three soil layers in each region (a–d) in the figure represent 4 samples respectively, (a) the content of OC250 and OC500 in each soil layer, (b) the content of N250 and N500 in each soil layer).
3.3 Relationship between soil organic carbon and nitrogen stocks and soil particle size and non-particle size
Soil carbon and nitrogen stocks in the two particle size ranges are positively correlated with soil stocks throughout the soil depth and in each part of the photovoltaic array. In the soil of each part, the OC250 stock linearly increases with the increase of organic C stock. Ordinary least squares regression analysis of the slopes in each location ranged from 0.01 to 1.60 for C and 0.01 to 1.37 for N, and the relationship between soil organic C and soil fine-particle organic C had a higher coefficient of determination. The relationship between soil organic carbon and OC500 was not affected by depth across the entire soil depth range (Figure 5). In addition, the organic carbon content of both soil particle sizes increased linearly with the total organic carbon content of the soil, indicating that the soil was not saturated with organic carbon. The relationship between soil particle size nitrogen content and total soil nitrogen content was similar to that of organic carbon.
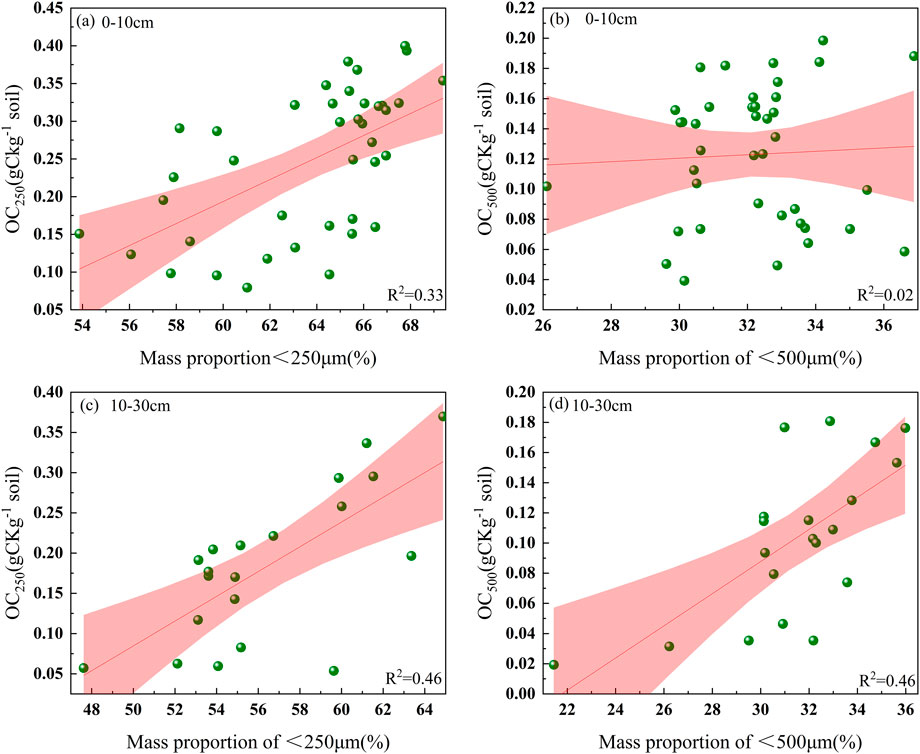
Figure 5. Relationship between soil organic carbon content in the two grain sizes and the mass fractions of organic carbon in the 0–10 cm and 10–30 cm grain sizes (a): OC250 content at 0–10 cm, (b): OC500 content at 0–10 cm, (c): OC250 content at 10–30 cm, (d): OC500 content at 0–10 cm).
3.4 Distribution of soil organic carbon by particle size
Both OC250 and OC500 showed a continuous increase with their mass fraction (Figure 6); in addition, the mass fraction of the OC250 soil particle size component explained the 95% confidence interval of the organic carbon content to a greater extent. The soil organic carbon content in areas C and D was higher than in areas A and B. Moreover, the soil organic carbon content in all areas was essentially 10–30 cm higher than that in 0–10 cm areas. The soil <250 µm particle size component (OC250/OCmax250) organic carbon content as a percentage of the maximum organic carbon content was basically the same in each soil layer. The OC250 content in area D was extremely low, with an average value of 0.24 g/kg. OC500 is low in area D and high in areas A and B. Area D shows the lowest OC500/OCmax500 (76.78%) and the highest OC250/OCmax250 (104.29%) (Figure 7). Overall, area D shows a higher OC250/OCmax250.
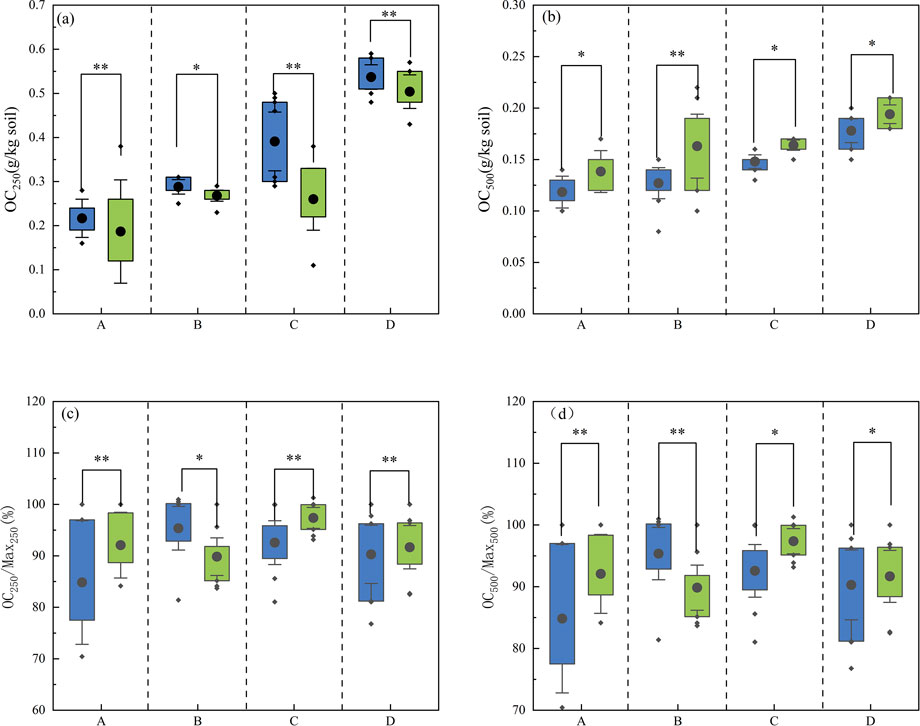
Figure 6. Soil organic C content in each region and its proportion of the maximum organic C content in each particle size class (a): OC250 content of two soil layers in four sampling sites, (b): OC500 content of two soil layers in four sampling sites, (c): OC250/Max250 in two soil layers at four sampling sites,(d): OC500/Max500 in two soil layers at four sampling sites, at the same time, blue represents 0–10 cm and green represents 10–30 cm).
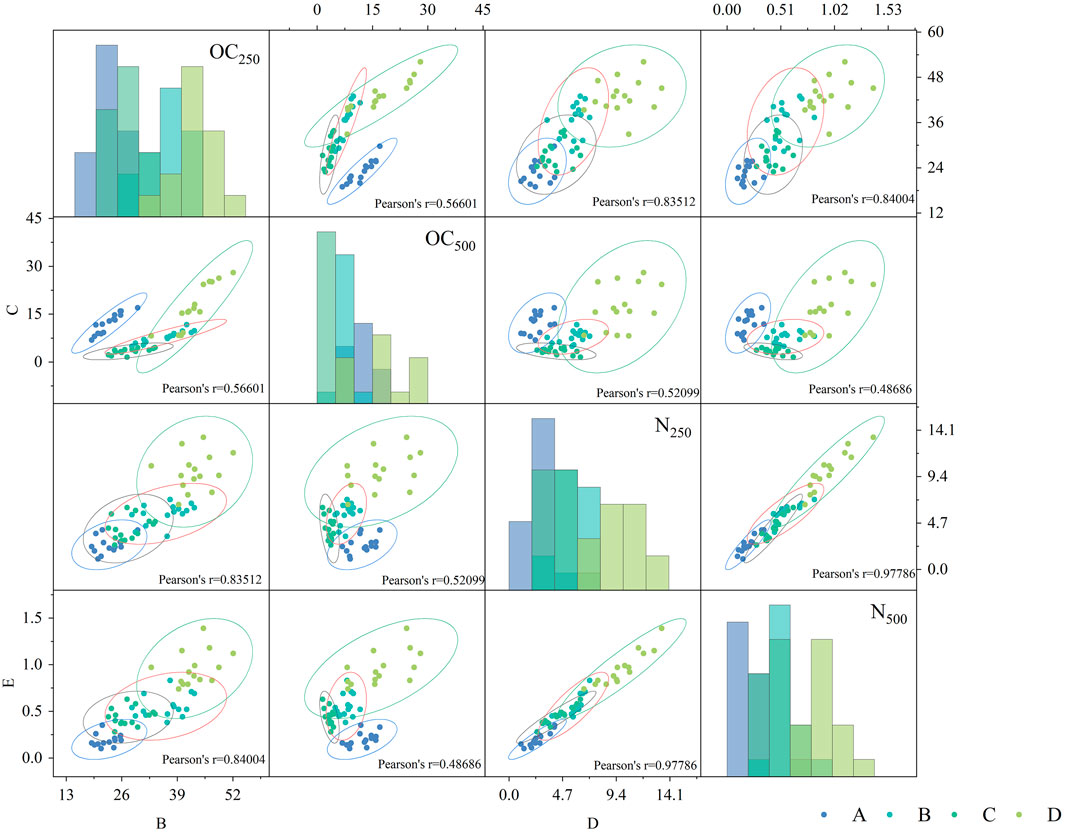
Figure 7. Correlation between organic matter and nitrogen storage for each grain size in each region (A-D) represents four sampling points).
4 Discussion
Wind is caused by the movement of air currents, and changes in wind speed and direction serve as important indicators of local airflow variations (Ehrenberg, 1847). While causing deformation of the Earth’s surface, wind also alters other soil properties. The installation of solar panels in photovoltaic (PV) power stations alters the properties of the underlying surface and modifies the surrounding airflow. Research has shown that photovoltaic arrays can create a range of effects on nearby airflow, including blocking and dragging, which subsequently impacts wind speed and direction, leading to changes in the wind field (Zhao et al., 2022). It has been observed that, compared to open areas (A), the establishment of photovoltaic arrays acts as a windbreak in desert regions. Wind speeds within the photovoltaic array are significantly lower than those in open areas, dropping to as low as 44.5% of the wind speed in the surrounding open regions as one moves inward from the edges. Additionally, fluctuations in wind speed correspond with minor changes in soil particle size, mainly concentrated at depths of 0–10 cm. This may be related to the alteration of the local microclimate due to the construction of the photovoltaic power station, which reduces surface wind speeds and diminishes the transport capacity of sand materials, resulting in more fine particles remaining on the soil surface. Previous studies have concluded that when the intersection angle exceeds 45°, the photovoltaic panel array exhibits a notable “sand interception effect,” with an average sand transport rate above the array reduced by 82.58% compared to moving dunes, while significant wind and sand activity primarily occurs at the edges (Tang et al., 2021). Furthermore, reduced wind speeds increase the potential surface moisture content and enhance soil temperature and humidity, making soil particles less susceptible to erosion (Tanner et al., 2020). The negative correlation between fine particles and wind speed observed in this study is consistent with these findings.
Changes in terrain within photovoltaic (PV) areas in deserts can lead to variations in microclimate, resulting in increased ground temperatures and altered precipitation patterns. These factors affect the accumulation and decomposition rates of soil organic matter, the mineralization of organic carbon, and the nutrient content in the soil (Aryal, 2022), all of which influence the carbon storage and distribution in the region. Research indicates that rising temperatures can further promote the decomposition of soil organic matter, thereby increasing the availability of nutrients and enhancing mineralization rates (Williams et al., 2009). This study shows that soil organic carbon (SOC) and total nitrogen (TN) levels are higher within the PV arrays compared to the external areas, with a more pronounced increase on nutrient content found in the fine particles of the surface soil. The construction of PV stations alters the surface microenvironment, raising surface temperatures and moisture levels while potentially stimulating soil microbial and enzymatic activity, which accelerates the decomposition process. Additionally, the interception of rainfall by PV panels redistributes precipitation, concentrating acidic substances on the soil surface, which further speeds up microbial decomposition. Furthermore, reduced wind speeds lead to a greater retention of fine particles on the soil surface, enriching the nutrient content. The changes in soil nutrient levels within the PV arrays may be influenced by variations in wind speed that affect the deposition of particles or differences in parent material. The nitrogen levels in this area exhibit greater stability, likely due to the low vegetation cover in desert regions that limits external nitrogen consumption; moreover, the efficiency of nitrogen-decomposing soil microorganisms and enzymes is significantly lower under drought and sandstorm conditions compared to those decomposing carbon. As illustrated in the data, there is a positive correlation between fine sand content and organic carbon across various sampling locations. The correlation of soil organic carbon with different particle sizes follows a consistent pattern, with the strongest correlation in the size range of 100–250 μm, followed by 250–500 μm, 50–100 μm, and finally 500–1,000 μm (Harry et al., 2000; Zhang et al., 2017). This finding aligns with previous research, indicating that soil with predominant particle sizes contains higher levels of organic carbon.
5 Conclusion
The research investigated the composition of soil particle size components in the three soil depths inside and outside the photovoltaic power plant, the content and storage of organic carbon, and organic nitrogen in the two soil particle size components of the main particle size composition. Fine sand particles (particle size 100–250 μm) are the main component of the soil in this area. Compared with other particle size components, soil components with a particle size of <250 μm can better estimate soil organic carbon and nitrogen reserves. Wind speed From the outside to the inside of the photovoltaic array, the wind speed experienced a weakening-strengthening-weakening process. Particle size and wind speed showed an opposite trend, and the organic matter and total nitrogen reserves also showed an increasing-decreasing-increasing trend, while the reserves stored in the surface layer were more abundant. In future photovoltaic projects, it is necessary to carry out scientific vegetation construction based on the threshold of soil environment in the region, long-term ecological research results, the growth status of sand-fixing vegetation and the demand of plant species for nutrient elements.
Data availability statement
The datasets generated during and/or analyzed during the current study are available from the corresponding author on reasonable request. Requests to access the datasets should be directed to MTEwOTU5MjMwMkBxcS5jb20=.
Author contributions
FZ: Conceptualization, Writing–original draft. ZM: Writing–review and editing. YL: Investigation, Writing–original draft, Writing–review and editing. PL: Writing–review and editing. GT: Writing–review and editing, Methodology.
Funding
The author(s) declare that financial support was received for the research, authorship, and/or publication of this article. This research was supported by Ordos Science and Technology Major Project (2022EEDSKJZDZX020-4); National Natural Science Foundation of China (NSFC)(42201012). Inner Mongolia Autonomous Region Forestry Research Institute Open Subjects (KF2024ZD02). Sub-project of Science and Technology Project of China Huaneng Group Co., Ltd. - Research on Low-cost and Biodegradable Sand Barriers for Flow Sand Fixation in Sandy Areas for Photovoltaic Power Stations.
Acknowledgments
Thank you to all the authors and to the editors and reviewers who contributed to the improvement of this article!
Conflict of interest
The authors declare that the research was conducted in the absence of any commercial or financial relationships that could be construed as a potential conflict of interest.
Generative AI statement
The author(s) declare that no Generative AI was used in the creation of this manuscript.
Publisher’s note
All claims expressed in this article are solely those of the authors and do not necessarily represent those of their affiliated organizations, or those of the publisher, the editors and the reviewers. Any product that may be evaluated in this article, or claim that may be made by its manufacturer, is not guaranteed or endorsed by the publisher.
References
Arayal, D. R. (2022). Grazing intensity in grassland ecosystems: implications for carbonstorage and functional properties. CABI Rev. 13 (12), 2162. doi:10.1079/cabireviews202217032
Barron-Gafford, G. A., Minor, R. L., Allen, N. A., Cronin, A. D., Brooks, A. E., and Pavao-Zuckerman, M. A. (2016). The Photovoltaic Heat Island Effect:Larger solar power plants increase local temperatures. Sci. Rep. 6, 35070–35077. doi:10.1038/srep35070
Christensen, B. T. (1992). Physical fractionation of soil and organic matter in primary particle size and density separates. Adv. Soil Sci. N. Y., 20. doi:10.1007/978-1-4612-2930-8_1
Cotrufo, M. F., Ranalli, M. G., Haddix, M. L., Six, J., and Lugato, E. (2019). Soil carbon storage informed by particulate and mineral-associated organic matter. Nat. Geosci. 12, 989–994. doi:10.1038/s41561-019-0484-6
Deng, L., Zhang, Z. N., and Shangguan, Z. P. (2014). Long-term fencing effects on plant diversity and soil properties in China. Soil and Tillage Res. 137, 7–15. doi:10.1016/j.still.2013.11.002
Ding, C. X., and Liu, Y. (2021). Effects of solar photovoltaic park construction on soil microbial community in alpine desert of qinghai tibet plateau. ACTA AGRESTIA SIN. 29, 1061–1069. doi:10.11733/j.issn.1007-0435.2021.05.023
Ehrenberg, C. G. (1847). The sirocco dust that fell at genoa on the 16th may. 1846. QJ Geol. Soc. Lond 3, 25–26. doi:10.1007/978-3-642-11476-2
Folk, R. L., and Ward, W. C. (1957). A study in the significance of grain-size parameters. J. Sediment. Petrology 27, 3–27. doi:10.1306/74d70646-2b21-11d7-8648000102c1865d
Georgiou, K., Jackson, R. B., Vinduškov´a, O., Abramoff, R. Z., Ahlstr¨om, A., Feng, W., et al. (2022). Global stocks and capacity of mineral-associated soil organic carbon. Nat. Commun. 13, 3797. doi:10.1038/s41467-022-31540-9
Gregorich, E. G., Beare, M. H., McKim, U. F., and Skjemstad, J. O. (2006). Chemical and biological characteristics of physically uncomplexed organic matter. Soil Sci. Soc. Am. J. 70, 975–985. doi:10.2136/sssaj2005.0116
Harry, J. P., Roger, L. P., and Neal, A. S. (2000). Factors controlling soil carbon levels in New Zealand grasslands:Isclay content important? Soil Sci. Soc. Ameri-ca J. 64, 1623–1630. doi:10.2136/sssaj2000.6451623x
Hassink, J. (1997). The capacity of soils to preserve organic C and N by their association with clay and silt particles. Plant Soil 191, 77–87. doi:10.1023/a:1004213929699
He, Y. T., He, Y. J., Wang, P., and Xie, H. S. (2023). Effects of different forest management regimes on soil organic carbon in aggregate fractions in natural secondary Quercus mongolica forests. Ecol. Environ. Sci. 32, 11–17. doi:10.16258/j.cnki.1674-5906.2023.01.002
Heckman, K., Hicks Pries, C. E., Lawrence, C. R., Rasmussen, C., Crow, S. E., Hoyt, A. M., et al. (2022). Beyond bulk: density fractions explain heterogeneity in global soil carbon abundance and persistence. Glob. Change Biol. 28, 1178–1196. doi:10.1111/gcb.16023
Lavallee, J. M., Soong, J. L., and Cotrufo, M. F. (2020). Conceptualizing soil organic matter into particulate and mineral-associated forms to address global change in the 21st century. Glob. Change Biol. 26, 261–273. doi:10.1111/gcb.14859
Lei, L., Zhang, K., Zhang, X., Wang, Y. P., Xia, J., Piao, S., et al. (2019). Plant feedback aggravates soil organic carbon loss associated with wind erosion in northwest China. J. Geophys. Res. Biogeosci. 124, 825–839. doi:10.1029/2018jg004804
Li, D., Wang, X. M., Li, k. Y., and Gu, Y. P. (2024). Estimation of soil organic carbon content in the bohu basin based on synthetic images and multi-variables. Environ. Sci. doi:10.13227/j.hjkx.202406088
Li, J. W., Li, M. Y., Dong, L. B., Wang, K., Liu, Y., Hai, X., et al. (2020). Plant productivity and microbial composition drive soil carbon and nitrogen sequestrations foll owing cropland abandonment. Sci. Total Environ. 744, 140802. doi:10.1016/j.scitotenv.2020.140802
Liu, J., Su, Y., Li, Y., and Huang, G. (2021a). Shrub colonization regulates δ13C enrichment between soil and vegetation in deserts by affecting edaphic variables. Catena 203, 105365. doi:10.1016/j.catena.2021.105365
Liu, Z., Sun, H., Lin, K., Zhou, C., and Huang, W. (2021b). Occurrence regularity of silt–clay minerals in wind eroded deserts of northwest China. Sustainability 13, 2998. doi:10.3390/su13052998
Lopez, B. R., and Bacilio, M. (2020). Weathering and soil formation in hot, dry environments mediated by plant–microbe interactions. Biol. Fertil. Soils 56, 447–459. doi:10.1007/s00374-020-01456-x
Lützow, M. V., Kögel-knabner, I., Ekschmitt, K., Matzner, E., Guggenberger, G., Marschner, B., et al. (2006). Stabilization of organic matter in temperate soils: mechanisms and their relevance under different soil conditions – a review. Eur. J. Soil Sci. 57, 426–445. doi:10.1111/j.1365-2389.2006.00809.x
Mendes, I. C., Bandick, A. K., Dick, R. P., and Bottomley, P. J. (1999). Microbial biomass and activities in soil aggregates affected by winter cover crops. Soil Sci. Soc. Am. J. 63, 873–881. doi:10.2136/sssaj1999.634873x
Midwood, A. J., and Boutton, T. W. (1998). Soil carbonate decomposition by acid has littleeffect on δ13C of organic matter. Soil Biol. biochem. 30, 1301–1307. doi:10.1016/s0038-0717(98)00030-3
Moni, C., Derrien, D., Hatton, P. J., Zeller, Z., and Kleber, M. (2012). Density fractions versus size separates: does physical fractionation isolate functional soil compartments? Biogeosciences 9, 5181–5197. doi:10.5194/bg-9-5181-2012
Ni, H. B., Zhang, L. P., Zhang, D. R., Wu, X. Y., and Fu, X. T. (2018). Weathering of pisha-sandstones in the wind-water erosion crisscrossregion on the Loess Plateau. J. Mt. Sci. 5, 340–349. doi:10.1007/s11629-008-0218-5
Poulter, B., Frank, D., Ciais, P., Myneni, R. B., Andela, N., Bi, J., et al. (2014). Contribution of semi-arid ecosystems to interannual variability of the global carbon cycle. Nature 509 (7502), 600–603. doi:10.1038/nature13376
Pratt, R. N., and Kopp, G. A. (2013). Velocity measurements around low-profile, tilted, solar arrays mounted on large flat-roofs, for wall normal wind directions. J. Wind Eng. Industrial Aerodynamics 123, 226–238. doi:10.1016/j.jweia.2013.09.001
Qu, Q., Deng, L., Gunina, A., Hai, X., Deng, J., Shangguan, Z., et al. (2024). Grazing exclusion increases soil organic C through microbial necromass of root-derived C as traced by 13C labelling photosynthate. Biol. Fertil. Soil 60, 407–420. doi:10.1007/s00374-024-01807-y
Qu, Q., Zhang, J., Hai, X. Y., Wu, J., Fan, J., Wang, D., et al. (2022). Long-term fencing alters the vertical distribution of soil δ13C and SOC turnover rate: revealed by MBC- δ13C. Agric. Ecosyst. Environ. 339, 108119. doi:10.1016/j.agee.2022.108119
Schutter, M. E., and Dick, R. P. (2002). Microbial community profiles and activities among aggregates of winter fallow and cover-cropped soil. Soil Sci. Soc. Am. J. 66, 142–153. doi:10.2136/sssaj2002.1420
Slessarev, E. W., Chadwick, O. A., Sokol, N. W., Nuccio, E. E., and Pett-Ridge, J. (2022). Rock weathering controls the potential for soil carbon storage at a continental scale. Biogeochemistry 157, 1–13. doi:10.1007/s10533-021-00859-8
Smith, K. R., and Waring, B. G. (2019). Broad-scale patterns of soil carbon (C) pools and fluxes across semiarid ecosystems are linked to climate and soil texture. Ecosystems 22, 742–753. doi:10.1007/s10021-018-0299-0
Sokol, N. W., and Bradford, M. A. (2019). Microbial formation of stable soil carbon is more efficient from belowground than aboveground input. Nat. Geosci. 12, 46–53. doi:10.1038/s41561-018-0258-6
Sokol, N. W., Whalen, E. D., Jilling, A., Kallenbach, C., Pett-Ridge, J., and Georgiou, K. (2022). Global distribution, formation and fate of mineral-associated soil organic matter under a changing climate: a trait-based perspective. Funct. Ecol. 36, 1411–1429. doi:10.1111/1365-2435.14040
Srivastava, P., Singh, R., Bhadouria, R., Tripathi, S., and Raghubanshi, A. S. (2020). Temporal change in soil physicochemical, microbial, aggregate and available C characteristic in dry tropical ecosystem. Catena 190, 104553. doi:10.1016/j.catena.2020.104553
Tang, G. D., Meng, Z. J., Gao, Y., and Dang, X. (2021). Impact of utilityscale solar photovoltaic array on the aeolian sediment transport in Hobq Desert, China. J. Arid Land 13, 274–289. doi:10.1007/s40333-021-0096-y
Tanner, K. E., Moore-O′Leary, K. A., Parker, I. M., Pavlik, B. M., and Hernandez, R. R. (2020). Simulated solar panels create altered microhabitats in desert landforms. Ecosphere 211, e03089. doi:10.1002/ecs2.3089
Williams, C. A., Hanan, N., Scholes, R. J., and Kutsch, W. (2009). Complexity in water and carbondioxide fluxes following rain pulses in an African savanna. Oecologia 161 (3), 469–480. doi:10.1007/s00442-009-1405-y
Xu, S., Silveira, M. L., Ngatia, L. W., Normand, A. E., Sollenberger, L. E., and Ramesh Reddy, K. (2017). Carbon and nitrogen pools in aggregate size fractions as affected by sieving method and land use intensification. Geofis. Int. 305, 70–79. doi:10.1016/j.geoderma.2017.05.044
Zhang, J. M., Chi, F. Q., Han, J. Z., Zhou, B. K., and Kuang, E. J. (2017). SOC distribution characteristics of mollisols aggregates in different long-term fertilization systems. Soils Crops 6, 49–54. doi:10.11689/j.issn.2095-2961.2017.01.008
Zhang, L. am., Xu, M. G., Lou, Y. H., Xiao-li, WANG, and Zhong-fang, L. I. (2014). Soil organic carbon fractionation methods. Acta Pedol. Sin. (4), 1–6. doi:10.11838/sfsc.20140401
Zhang, Y. F., Chen, L., Zhang, B. B., and Li, X. B. (2023). Characteristics of organic carbon particle size composition and carbon pool management index in surface soil of desert grassland. J. Soil Water Conservation 37, 283–290. doi:10.13870/j.cnki.stbcxb
Zhao, W., Liu, L., Chen, J., and Ji, J. (2019). Geochemical characterization of major elements in desert sediments and implications for the Chinese loess source. Sci. China Earth Sci. 62, 1428–1440. doi:10.1007/s11430-018-9354-y
Keywords: photovoltaic, soil particle-size fraction, soil organic C, wind speed, arid desert region
Citation: Zhao F, Meng Z, Liu Y, Li P and Tang G (2025) Soil carbon and nitrogen changes due to soil particles redistribution caused by photovoltaic array. Front. Environ. Sci. 13:1552447. doi: 10.3389/fenvs.2025.1552447
Received: 02 January 2025; Accepted: 07 March 2025;
Published: 13 June 2025.
Edited by:
Tianjiao Feng, Beijing Forestry University, ChinaCopyright © 2025 Zhao, Meng, Liu, Li and Tang. This is an open-access article distributed under the terms of the Creative Commons Attribution License (CC BY). The use, distribution or reproduction in other forums is permitted, provided the original author(s) and the copyright owner(s) are credited and that the original publication in this journal is cited, in accordance with accepted academic practice. No use, distribution or reproduction is permitted which does not comply with these terms.
*Correspondence: Zhongju Meng, bWVuZ3pob25nanVAMTI2LmNvbQ==