 M. Sami Zitouni
 Leena Elneel
 Naseeb Assad Albakri
 Mohammed Q. Alkhatib
 Hussain Al-Ahmad
- College of Engineering and IT, University of Dubai, Dubai, United Arab Emirates
Climate change has significantly impacted vulnerable communities globally, with rising temperatures caused by greenhouse gas emissions accelerating global Sea Level Rise (SLR), threatening coastal infrastructure and ecosystems. This study evaluates statistical and deep learning models, including the Autoregressive Integrated Moving Average (ARIMA) and Long Short-Term Memory (LSTM) networks, for predicting SLR and visualizing potentially inundated areas in the United Arab Emirates (UAE) via an interactive web interface. Historical mean sea level (MSL) data from the National Oceanic and Atmospheric Administration (NOAA), spanning 1992 to 2024, were used for training and model evaluation. An interactive web platform was developed to visualize forecasted inundation areas and support decision-making. The enhanced LSTM model, integrated with a Squeeze-and-Excitation (SE) block, achieved the highest accuracy, with a Root Mean Square Error (RMSE) of 2.27, representing an improvement of 8.81% over the standalone LSTM (RMSE 2.47) and 13.66% over ARIMA (RMSE 2.58). The model forecasts sea level changes up to 2100, highlighting critical risks for low-lying coastal regions such as Umm Al Quwain, Abu Dhabi, and Dubai. The findings underscore the value of advanced AI-driven forecasting in enhancing climate resilience, assisting policymakers and urban planners in risk assessment, optimizing emergency response strategies, and implementing coastal adaptation measures. Future work should integrate additional environmental factors influencing MSL.
1 Introduction
The rapid increase in global temperatures has triggered significant changes and phenomena that have adversely impacted the climate and human lives. This rise, driven primarily by greenhouse gas emissions (Mohajan, 2011), poses a serious threat to ecosystems and the environment. Among these changes, Sea Level Rise (SLR) emerges as a critical global challenge (Meehl et al., 2005; Vermeer and Rahmstorf, 2009), endangering cities and communities located in coastal areas, particularly low-lying lands. This creates considerable vulnerability among human societies. The inevitable future increase in SLR underscores the need for studies that address this issue by capturing the regional dynamics of SLR (Elneel et al., 2024b). SLR is primarily caused by two factors: the thermal expansion of seawater as it warms, and the melting of polar glaciers. Both of these processes are driven by rising global temperatures, which are closely linked to the widespread use of fossil fuels (Church and White, 2011). In addition to global drivers, regional factors also influence sea level trends. These lead to significant variations in Mean Sea Level (MSL) across different locations. Local variations include climatic factors such as the effects of wave action during natural disasters, rainfall, and changes in the water budget between different water bodies caused by water mass movement due to differences in water warming. Human activities, such as groundwater extraction and alterations to shorelines, also contribute to these variations (Elneel et al., 2024b). Global MSL has risen at an accelerating rate in recent years (Nerem et al., 2018). The Intergovernmental Panel on Climate Change (IPCC) projects that, under extreme emission scenarios, MSL could rise by up to 1 m by 2100 (IPCC, 2019). Therefore, understanding SLR and predicting future rates are essential for mitigating the catastrophic consequences of inaction.
Several studies have examined SLR and its implications, emphasizing the urgent need for accurate forecasting due to climate change. (Rahmstorf, 2007). investigated the relationship between global temperature and SLR, suggesting that previous estimates might underestimate actual SLR if current warming trends persist. (Rignot et al., 2011). investigated contributions from the Antarctic and Greenland ice sheets using satellite imagery and ice sheet models, revealing an accelerating rate of ice melt. Similarly (Hansen et al., 2016), projected that rapid ice melting could result in SLR exceeding 1 m this century, highlighting the necessity of robust predictive models.
Given these uncertainties, various predictive approaches have been employed to model SLR. Traditional statistical models such as the Autoregressive Integrated Moving Average (ARIMA) method have been widely used for time-series forecasting. ARIMA combines moving averages with differences between measurements to identify trends (Box et al., 2015). Its simplicity and interpretability make it a popular choice, but its assumption of linearity limits its effectiveness in capturing complex climate dynamics (Makridakis et al., 2018). Despite this limitation, ARIMA serves as a useful benchmark for evaluating more advanced models.
Autoregressive models have been applied to SLR forecasting in various regions. For example (Tabassum et al., 2019), used autoregressive models to predict seasonal SLR in the Bay of Bengal based on historical observations. Univariate and multivariate autoregressive models have been utilized to forecast MSL in Malaysia, demonstrating effectiveness even in areas with significant tidal influences (Balogun and Adebisi, 2021). Additionally (Elneel et al., 2023), applied autoregressive models to forecast global MSL under the influence of additional water mass from Antarctic ice melts. Recent studies have also integrated autoregressive models with alternative approaches, such as Facebook’s Prophet model, to improve forecasting accuracy over extended periods (Elneel et al., 2024a). Furthermore, autoregressive models combined with unified structural equation modeling have been employed to assess the global warming potential of greenhouse gases on SLR trends (Song et al., 2023).
While traditional models provide a foundation for SLR prediction, their limitations in handling non-linear dependencies and long-term temporal relationships have led to the adoption of machine learning approaches. Long Short-Term Memory (LSTM) networks, a type of recurrent neural network, address these challenges by effectively modeling non-linear data (Qin et al., 2017). LSTM employs gating mechanisms to retain relevant information over time, making it particularly suitable for climate forecasting (Hochreiter and Schmidhuber, 1997). The integration of LSTM with attention mechanisms has further improved predictive performance by dynamically assigning weights to temporal features (Liu et al., 2022).
Deep learning methods have shown significant promise in SLR prediction by leveraging large datasets and capturing both spatial and temporal dependencies. (Liu et al., 2020) demonstrated the effectiveness of combining LSTM with attention mechanisms for MSL prediction in the South China Sea, achieving high accuracy with a correlation coefficient of 0.999. Similarly, (Nieves et al., 2021), applied machine learning to model coastal MSL variability, successfully accounting for internal climate variations. Other studies have evaluated hybrid approaches, such as combining linear regression with adaptive neuro-fuzzy inference systems, to improve short-term SLR predictions (Tur et al., 2021). Moreover, (Adebisi and Balogun, 2022), assessed various LSTM configurations for MSL prediction along Malaysia’s coastline, showing that multivariate models incorporating ocean-atmospheric variables yielded superior results.
In summary, SLR forecasting has evolved from statistical time-series models to more sophisticated deep learning approaches, addressing the increasing complexity of climate dynamics. Traditional models like ARIMA and autoregressive methods remain useful for benchmarking, but the superior performance of LSTM and hybrid models highlights the importance of advanced techniques in improving predictive accuracy.
Several interactive platforms have been developed globally to visualize and communicate the risks associated with sea level rise. For instance, NOAA’s Sea Level Rise Viewer provides community-level impact visualizations for the U.S. coastlines NOAA, (2024a). NASA’s Sea Level Projection Tool offers global projections based on IPCC scenarios NASA Sea Level Change Team (2024). Climate Central’s Coastal Risk Screening Tool enables global assessments of coastal flood risks Climate Central (2024). Additionally, the University of Washington has developed interactive visualizations for Washington State’s coastline University of Washington Climate Impacts Group (2023).
Despite global advancements, deep learning-based long-term SLR forecasting in the Arabian Gulf region remains limited, particularly the application of deep learning models tailored to this region’s unique coastal dynamics. This study introduces a novel methodological enhancement by integrating a Squeeze-and-Excitation (SE) attention mechanism with LSTM. This integration improves forecasting accuracy over standard models (LSTM, ARIMA) by effectively capturing non-linear temporal dependencies critical for accurate SLR predictions. Further, Unlike many previous studies, this framework translates model predictions into actionable insights through an interactive, web-based visualization platform that highlights potentially inundated areas in the UAE. In this paper, variations in sea level whether increasing or decreasing will be referred to as MSL, while rising sea level will be referred to as SLR.
Given the UAE’s vision for a sustainable, knowledge-based economy, (Melville-Rea et al., 2021), proposed a roadmap to guide SLR research and establish a national climate change research network. The UAE’s coastal infrastructure, economic hubs, and marine ecosystems are vulnerable to SLR. Key sectors at risk include tourism, as major resorts and developments are located along the Arabian Gulf coastline, trade could be affected as well, since critical ports such as the Jebel Ali port are vital in the global supply chain. Moreover, marine ecosystems like mangroves and coral reefs could be greatly affected, which in return will affect the fish population since these provide natural habitat and protection for some fish species. Building upon this framework, this study focuses on advancing SLR prediction techniques to support mitigation strategies and informed decision-making.
2 Methodology
To effectively analyze and predict SLR, this study follows a structured methodological approach, as illustrated in Figure 1. The process begins with data collection and pre-processing, leveraging historical MSL data from reputable sources, including satellite altimetry records. The dataset is then subjected to resampling and normalization to ensure consistency and eliminate noise. Following data preparation, statistical and deep learning models are developed and trained using both univariate and multivariate approaches. The primary models include ARIMA and LSTM networks, with further enhancements introduced through SE blocks to improve the performance of LSTM. The evaluation phase involves rigorous testing of the models and validation against historical data. The best-performing model is subsequently used to forecast future SLR scenarios, and the results are visualized through an interactive web platform, offering dynamic representations of potentially inundated areas. This comprehensive methodology ensures robust, data-driven predictions that contribute to enhanced climate resilience planning.
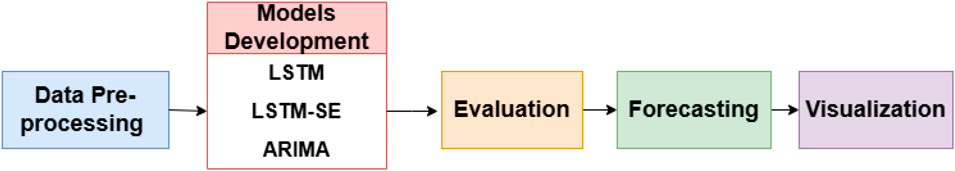
Figure 1. Methodology for MSL prediction and visualization framework.
2.1 Models development
2.1.1 LSTM model
LSTM is an advance type of Recurrent Neural Network (RNN) incorporating special gating mechanisms within their architecture: the forget gate, the input gate, and the output gate. These gates enable the model to selectively retain, update, or discard information over the next time intervals, making LSTM models effective in sequential data tasks, including language modeling and time-series prediction (Sherstinsky, 2020).
In this study, an LSTM model was developed consisting of two LSTM layers, each containing four hidden units. The output layer employs a linear activation function to generate continuous-valued predictions. Adam optimizer was used with a learning rate of 0.001 to ensure efficient weight updates, and the He uniform initialization was applied to the kernel weights while using constant bias initialization for improved training stability. To prevent overfitting, an early stopage strategy was implemented, halting training when validation loss ceased to improve over multiple epochs.
2.1.1.1 Squeeze and excitation block
The Squeeze-and-Excitation (SE) block is an architectural component designed to enhance the representational power of a neural network by modeling and recalibrating the interdependencies between its feature channels. It consists of two main steps: squeeze and excitation. In the squeeze step, global spatial information is condensed into a channel descriptor using global average pooling, capturing dependencies across all feature channels. In the excitation step, this descriptor passes through a simple gating mechanism with sigmoid activation, enabling the network to dynamically recalibrate the channel-wise feature responses. The SE block helps the network prioritize significant features while minimizing computational cost, thereby improving overall performance (Hu et al., 2018).
Mathematical Formulation. Let
In the excitation operation,
where
The effect of using an SE block with LSTM was examined by developing two models: LSTM and LSTM-SE. This was done to demonstrate the potential of the SE block in improving the model’s ability to learn temporal patterns effectively. The training process began with scaling the data to ensure numerical stability and creating structured sequences of length 3, where each sequence served as input to predict the next step. The LSTM architecture consisted of two LSTM layers with four hidden units each, utilizing the He uniform kernel initializer and constant bias initialization for efficient parameter initialization. In the second model, a custom SE block was integrated between the LSTM layers. The squeeze step involved computing a channel descriptor by applying a fully connected layer that reduces the dimensionality, followed by the excitation step, which restores the channel dimension and applies a sigmoid activation to generate scaling factors for each channel. Thus, the SE block enhances learning by helping the model focus more on important features and suppress less relevant ones. This improves the model’s ability to adapt to changes in the data, especially when sea-level patterns fluctuate over time. The final output layer used a linear activation function to produce continuous-valued predictions. Both models were trained using Adam optimizer with a learning rate of 0.001, ensuring efficient weight updates. Training and validation loss was monitored throughout the 100 training epochs, with performance visualized through loss plots. An early stopping mechanism was implemented to halt training based on validation loss values, preventing overfitting. After training, predictions were generated iteratively using a sliding window approach, and the results were scaled back to the original range for validation. Figure 2 illustrates the structure of LSTM with SE integration. The primary distinction between the LSTM and LSTM-SE models lies in the incorporation of the attention mechanism. Table 1 provides a detailed overview of the LSTM-SE model’s configuration.
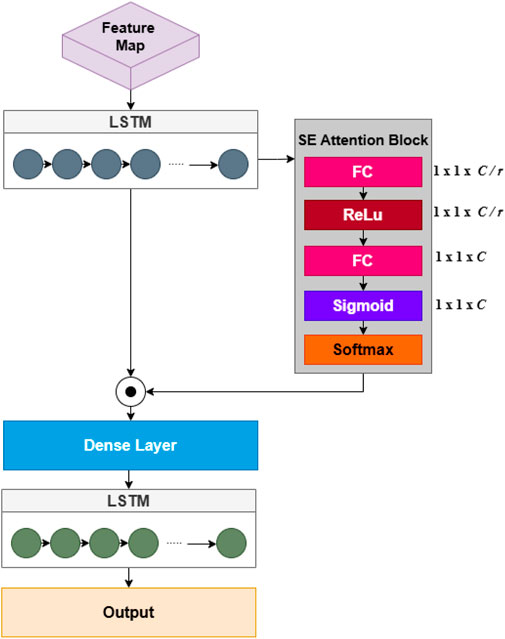
Figure 2. LSTM-SE model architecture.
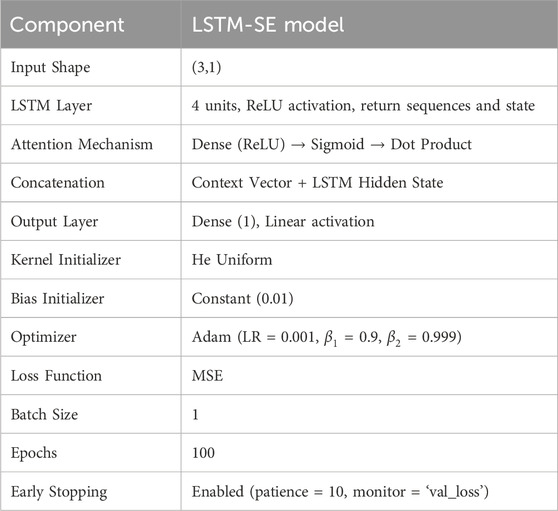
Table 1. Summary of configuration setup of the LSTM-SE model.
2.1.2 ARIMA model
ARIMA is a popular time-series forecasting model that integrates autoregressive (AR) and moving average (MA) components with differencing to address non-stationary data. It effectively identifies and forecasts patterns in univariate time-series data. The AR component models the linear relationship between an observation and its previous values, while the MA component captures the impact of past forecast errors. The “integrated” aspect refers to the differencing process used to achieve stationarity, allowing the model to be applied to a wider variety of time-series. The ARIMA model is defined by three parameters: ‘p’ (AutoRegressive), ‘d’ (Integrated), and ‘q’ (Moving Average), which specify the respective component values for model fitting (Hyndman and Athanasopoulos, 2018). For the given dataset, the optimal (p, d, q) values were found to be 2, 1, 1, respectively.
2.2 Evaluation
The Mean Squared Error (MSE) loss function was used with LSTM models to measure the training loss and identify fitting issues for parameter tuning. For the ARIMA model, the Akaike Information Criterion (AIC) was used to identify the optimal combination of parameters. AIC is a statistical metric used to balance model fit and complexity. The ‘auto_arima’ function from the Python library ‘pmdarima’ was used to automatically test different combinations of p, d, and q values. The combination with the lowest AIC was selected as the model’s optimal parameters.
To compare and evaluate the prediction results of all the developed models, Root Mean Square Error (RMSE), a common metric in machine learning, was used to measure prediction accuracy. RMSE was chosen for its sensitivity to large errors, making it suitable for time-series forecasting where minimizing deviations is critical. Unlike Mean Absolute Error (MAE), which treats all errors equally, RMSE penalizes larger errors more, emphasizing major discrepancies. Furthermore, RMSE maintains the same unit as the predicted variable (SLR), enhancing interpretability. While MAE could offer additional insights, such as robustness to outliers and more stable measure of typical errors, RMSE was prioritized for capturing overall predictive accuracy. Additionally, the confidence score for each model’s predictions was computed, and statistical analysis, particularly paired t-tests, was conducted to compare the performance of the model. The t-statistic measures the difference between paired predictions by analyzing the mean prediction error, while the p-value determines whether this difference is statistically significant.
2.3 Forecasting
To help visualize the potentially inundated areas over the years, a forecasting analysis was conducted using the trained model to predict MSL for the upcoming years, particularly until the end of the current century (the year 2100). Since this study only focuses on univariate time-series, the forecasted MSL represents dependencies on its previous values, independent of other factors that can influence the forecasting results, such as greenhouse gas emissions and seasonal extreme events. Instead, MSL values from the IPCC and other literature were used to model the MSL forcasted in such scenarios.
2.4 Visualization
The best forecast result was selected after a comparison of the models to serve as input for visualization of the actual inundated areas for each year. The visualization platform was developed using OpenLayers, an open-source JavaScript-based tool designed to create dynamic and interactive web maps. Functionalities provided by OpenLayers were utilized to enable effective visualization and interaction with spatial data. The platform was built with HTML, CSS, and JavaScript, leveraging npm and Node. js for local deployment. Key visualization features include sliders for adjusting SLR level and year selections and show the inundated areas accordingly, as well as predefined locations of interest, including the seven emirates, to allow quick navigation.
OpenLayers and MapTiler maps were used as the base maps to provide both OpenStreetMap and satellite imagery for a comparative view of the affected regions. The inundation mapping process was performed using RGB-encoded elevation data from MapTiler maps (Sloup, 2019), which provided detailed topographic information. Elevation values were extracted and processed to identify areas at risk of flooding. The mapping algorithm recolored regions based on their elevation and projected MSL values, selecting all points below the estimated MSL threshold for visualization. To account for extreme conditions, a 2-m high wave estimate from (Al Kabban, 2019) was added to MSL values to refine the inundation predictions. Estimated MSL values associated with IPCC RCP (Representative Concentration Pathway) scenarios, particularly RCP 2.6 (lowest emissions) and RCP 8.5 (extreme emissions), were also displayed. The values of these RCP scenarios were obtained from (Horton et al., 2020), offering a comprehensive understanding of potential SLR impacts under different climate change scenarios.
Although the developed platform provides effective visualization of inundated areas under different SLR scenarios, it has certain limitations related to data accuracy. The precision of the elevation data depends on MapTiler’s dataset, which has an approximate resolution of 30 m and may not capture fine-scale topographical variations. Furthermore, data on dynamic oceanic factors, such as tides, storm surges, and coastal defenses, were not publicly available for the selected study area, which may cause discrepancies between the mapped flood areas and real-world scenarios.
Nevertheless, the tool serves as a useful means for estimating and visualizing potentially inundated areas, providing insight into the impacts under different SLR scenarios. Future improvements could include integrating real-time tide data and hydrodynamic models, as well as incorporating higher-resolution elevation datasets and in-situ measurements to enhance accuracy.
3 Results and discussion
3.1 Dataset
This study focuses on the Arabian Gulf, with particular emphasis on the Emirate of Dubai, a major economic and tourism hub characterized by densely populated coastal regions. The study area is depicted in Figure 3. Data utilized in the analysis were sourced from the National Oceanic and Atmospheric Administration (NOAA), comprising seasonal MSL measurements spanning 1992 to 2024. These measurements were obtained using radar satellite altimeters, including TOPEX/Poseidon (T/P), Jason-1, Jason-2, Jason-3, and Sentinel-6MF where the MSL time-series has been adjusted using an inverted barometer correction by the dataset provider (NOAA, 2024b). The data pre-processing began by converting timestamps to datetime format. The data were resampled to compute yearly average MSL values. While monthly or seasonal MSL data could capture finer short-term fluctuations, such as tidal or monsoonal effects, these records were incomplete or inconsistent for the UAE region. Therefore, annual aggregation was selected to ensure continuity and support robust long-term trend analysis aligned with the study’s strategic planning focus. The product time-series, as shown in Figure 4, indicates an increasing trend over the years.
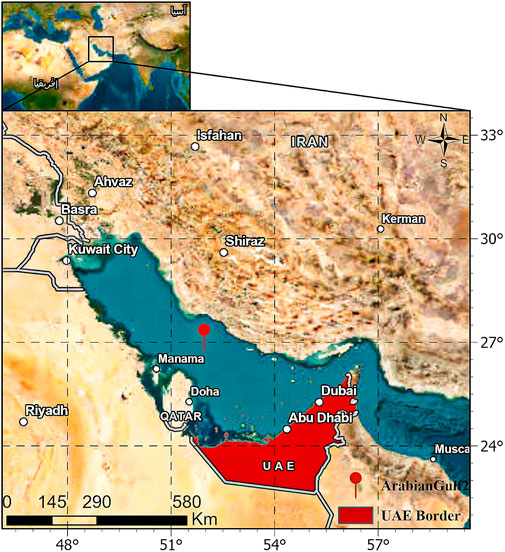
Figure 3. Study area: coastal regions of the United Arab Emirates (UAE). Map Credit: Esri, TomTOM, FAO, NOAA, USGS, Earthstar Gepgraphics.
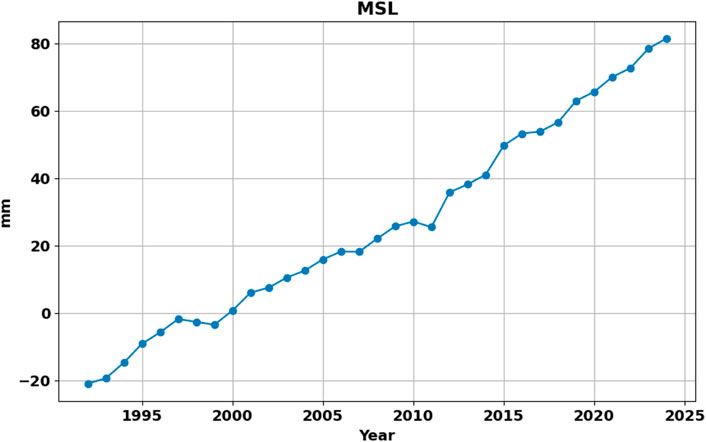
Figure 4. Annual MSL anomalies from 1992 to 2024. The y-axis represents MSL deviations in millimeters relative to the 1992 baseline, and the x-axis represents the year.
3.2 Working environment
The development of deep learning and linear regression models was conducted using Python v3.10.12, TensorFlow v2.12.1, and Kera v3.5.0 running on the Google Colab environment. Google Colab provides a cloud-based platform with GPU support, enabling the efficient computation capabilities needed to train the models. Various Python libraries were utilized in training the models, including Keras, which provided numerous tools to develop, train, and evaluate the performance of the LSTM deep learning model. Additionally, the Statsmodels library was used to develop the linear regression model, specifically the ARIMA model. Other libraries, such as scikit-learn for pre-processing and Matplotlib for visualizing the results, were also utilized in this research.
3.3 Models results
Figure 5 illustrates a comparative analysis between the actual MSL data and the predictions generated by the three models. The plot reveals that all models closely follow the actual data trend, with varying degrees of accuracy. The ARIMA model exhibits a steady upward trajectory but occasionally overshoots actual values, indicating its reliance on linear assumptions. Conversely, the LSTM model aligns closely with the observed data but experiences minor deviations during periods of sharp MSL increase. The LSTM-SE model provides the most accurate fit, particularly in the post-2010 period when the MSL rise accelerated. This suggests that the SE block’s recalibration mechanism effectively enhances the model’s adaptability to fluctuations, contributing to superior performance. Specifically, the squeeze step aggregates temporal features across each channel, which captures meaningful interdependencies among temporal features. In the subsequent excitation step, these aggregated representations pass through fully connected dense layers, applying a sigmoid activation function to produce channel-wise weights. This process assigns higher weights to features critical for predicting significant sea-level variations. Consequently, the SE mechanism enables the LSTM-SE model to better handle irregular patterns and abrupt changes, stabilizing the long-term predictions and thereby reducing overall forecasting errors.
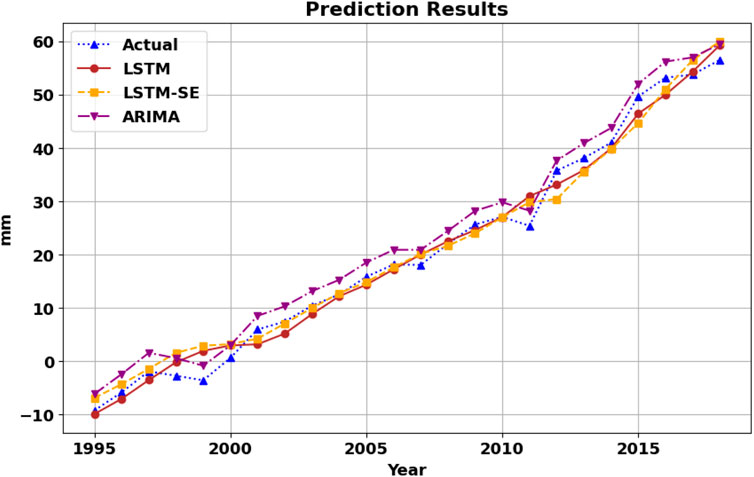
Figure 5. Comparison of actual and predicted results using LSTM, LSTM-SE, and ARIMA Models.
Table 2 presents quantitative evaluation of the used models: ARIMA, LSTM, and LSTM-SE. An ablation study was conducted to isolate and quantify the specific contribution of the SE attention mechanism within the LSTM-SE model. The ARIMA model recorded an RMSE of 2.58, while the LSTM model achieved a lower RMSE of 2.47, reflecting its ability in better capturing non-linear dependencies. The LSTM-SE model further improved performance by approximately 8.81%, reducing RMSE to 2.27. Figure 6 illustrates a comparison of models’ performance using RMSE with 95% confidence intervals. LSTM-SE is the most accurate and stable, followed by LSTM, which still outperforms ARIMA. ARIMA’s higher RMSE and wider confidence interval, resulting in slightly increased variability and reduced reliability in predictions. Table 3 shows the statistical significant t-test results. To evaluate the proposed framework, paired t-tests were conducted based on absolute prediction errors. The LSTM-SE model significantly outperformed the ARIMA model
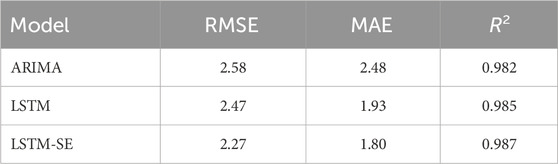
Table 2. Quantitative evaluation of the used models.
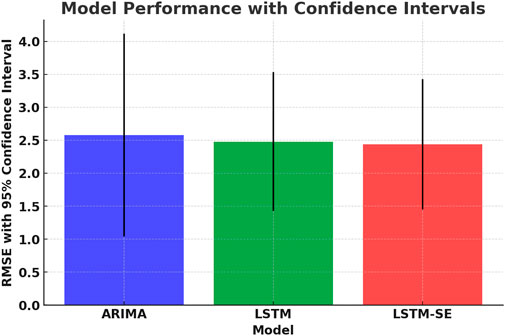
Figure 6. Comparison of models’ performance with 95% confidence intervals.
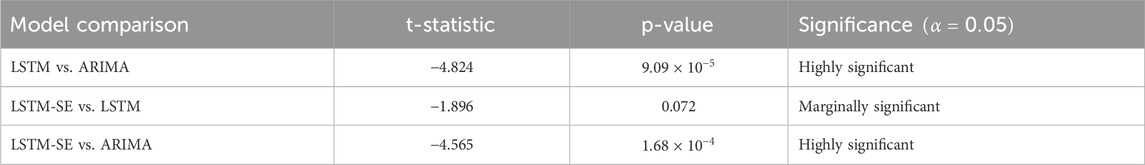
Table 3. Statistical comparison of model performance using paired t-tests.
The errors observed across models are the result of their functional characteristics. ARIMA models effectively capture long-term linear trends during stable periods but fail to account for complex temporal patterns, making them less reliable during rapid fluctuations. In contrast, LSTM models excel at capturing gradual changes but struggle with sharp variations, particularly between 1995–1997 and 2008–2010, due to the vanishing gradient problem and saturation effects, which limit their ability to retain long-term dependencies. LSTM-SE mitigates these issues by incorporating attention mechanisms, improving alignment between predicted and actual values and enhancing the capture of long-term dependencies. These results highlight the superiority of deep learning models, particularly LSTM with attention, over traditional statistical methods like ARIMA in short-term forecasting.
Figures 7–9 illustrate the long-term forecasting capabilities of each model. In Figure 7, LSTM accurately forecasts MSL until approximately 2025, after which the predictions plateau, reflecting the model’s limitation in extrapolating trends over extended periods without external inputs. Figure 8 presents predictions from the LSTM-SE model, which maintain accurate forecasts slightly longer, highlighting the effectiveness of attention mechanisms in capturing temporal dependencies. However, both LSTM-based models exhibit saturation, primarily due to their inherent limitations in capturing long-range dependencies, resulting in stabilized forecasts instead of an expected upward trend. A potential solution to this issue could involve using hybrid architectures, such as LSTM-transformer models or CNN-LSTM hybrids, which are better equipped to handle complex temporal patterns and mitigate memory constraints. In contrast, Figure 9 shows that the ARIMA model projects a consistent linear increase in MSL through 2100. While this aligns with historical trends, ARIMA’s assumption of linearity may underestimate potential accelerations in SLR driven by non-linear climatic factors.
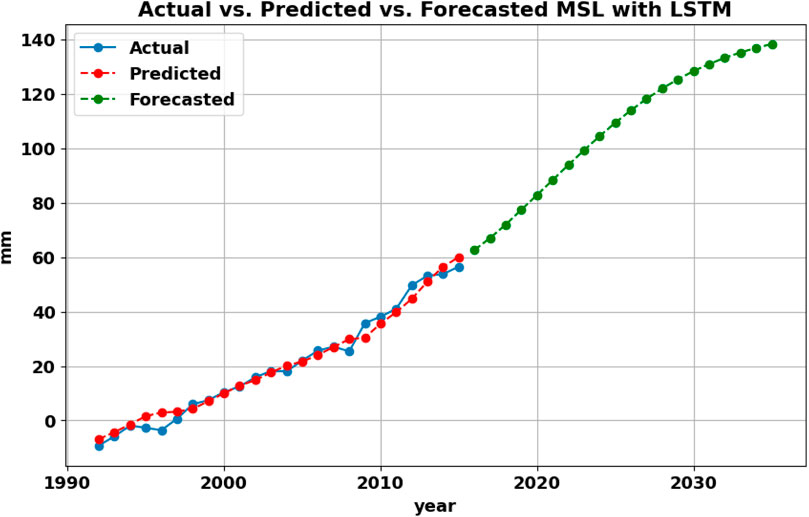
Figure 7. MSL forecasting results using LSTM model.
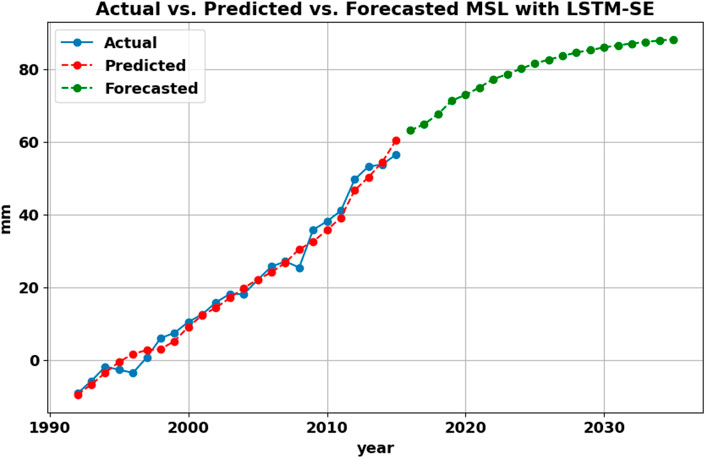
Figure 8. MSL forecasting results using LSTM-SE model.
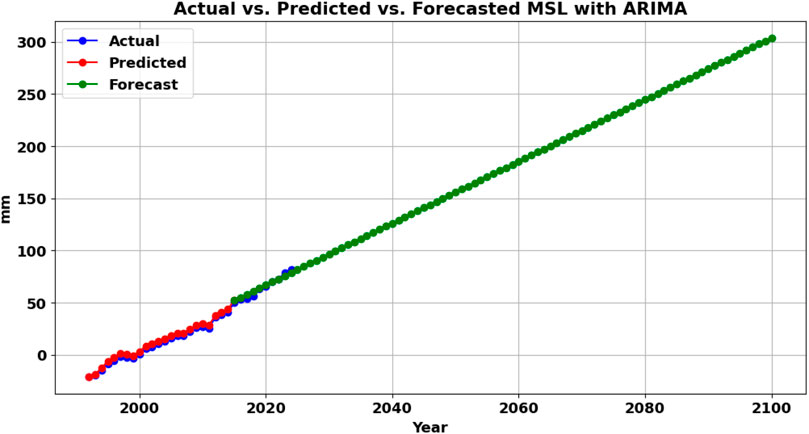
Figure 9. Long-term MSL forecasting results using ARIMA model.
The results reveal that the LSTM-SE model offers the highest accuracy, making it well-suited for short-term forecasts. On the other hand, ARIMA, despite its lower accuracy in the short term, demonstrates stable long-term projections, making it valuable for scenario planning and infrastructure resilience assessments extending toward the end of the century. The findings of this study align with previous research, confirming that LSTM and deep learning models generally outperform traditional statistical methods like ARIMA in short-term forecasting. Studies such as (Balogun and Adebisi, 2021) (Malaysia) (Alenezi et al., 2023), (the Arabian Gulf), and (Nieves et al., 2021; Hassan et al., 2021) (Global) have shown that LSTM-based models consistently provide more accurate predictions for short-term MSL forecasting compared to ARIMA, which tends to struggle with capturing non-linear relationships in the data. The integration of attention mechanisms in this study has further enhanced model accuracy, reinforcing the advantages of advanced deep learning architectures. Additionally, some studies have employed multivariate LSTM models (Adebisi and Balogun, 2022) (Malaysia) and multimodel LSTM (Accarino et al., 2021) (the Mediterranean Sea), as well as hybrid LSTM models combined with other machine learning or deep learning approaches (Sorkhabi et al., 2023) (Gothenburg). These studies integrate oceanic and atmospheric variables (Balogun and Adebisi, 2021; Accarino et al., 2021; Sorkhabi et al., 2023), such as sea surface temperature, wind speed, and atmospheric pressure. These enhancements have been shown to improve prediction performance, offering a more comprehensive understanding of the factors influencing sea-level variability.
Despite its advantages, LSTM’s limitation in long-term forecasting has been persistent across all previous studies. The saturation observed in LSTM-based models highlights the inherent difficulty of making extended projections, particularly without integrating additional environmental factors such as greenhouse gas emissions, ice-sheet melting rates, or oceanographic influences. Furthermore, unlike studies that utilize daily or monthly MSL data, this study is based on annual data, which effectively captures long-term trends but may overlook finer seasonal variations. Higher-frequency seasonal data in other studies have improved prediction accuracy by providing insights into seasonal effects on SLR, particularly in regions affected by monsoons, tidal variations, and extreme weather events. Additionally, some studies have used spatially distributed sea-level measurements across multiple locations, allowing for a more regionally comprehensive analysis. However, this study was constrained by the lack of publicly available spatially distributed sea-level data, limiting its ability to model regional variations in SLR. Improving data accessibility could enhance future research by enabling more detailed, region-specific predictions.
Future work will address the limitations of LSTM in long-term forecasting by incorporating additional environmental variables and hybrid modeling approaches. Expanding future models to include spatially distributed oceanic and atmospheric data could further improve the accuracy of long-term sea-level forecasts. Future research should also evaluate multivariate LSTM models with higher-frequency and spatially distributed datasets to enhance prediction accuracy and applicability for extended periods.
3.4 Visualization results
Figure 10 illustrates the potentially inundated areas in the UAE across different years, based on ARIMA forecasting results. The analysis indicates that the majority of coastal areas will face inundation by the year 2100, with the MSL rise estimated to reach approximately 2.6 m. Figures 11, 12 shows the potentially inundated areas in Palm Jumeriah and Khor Dubai regions. A closer inspection of the map highlights that low-lying coastal areas such as Umm Al Quwain, Abu Dhabi, and the Khor Dubai regions are particularly vulnerable to MSL rise. This could have significant impacts on the existing ecosystems and may trigger population shifts in affected regions. Additionally, artificial lands along the UAE’s coastline are also at risk of SLR. However, protective measures such as constructing these lands at higher elevations and building breakwaters to safeguard the shoreline against SLR and high-intensity waves may mitigate some of the risks.
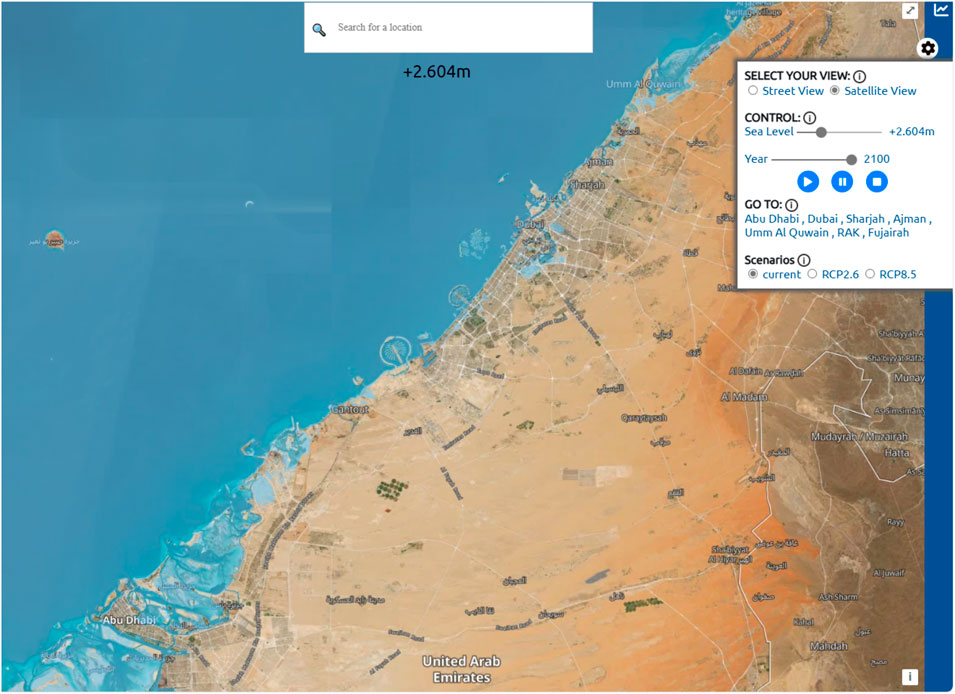
Figure 10. Illustration of the inundated areas in UAE by the year 2100.
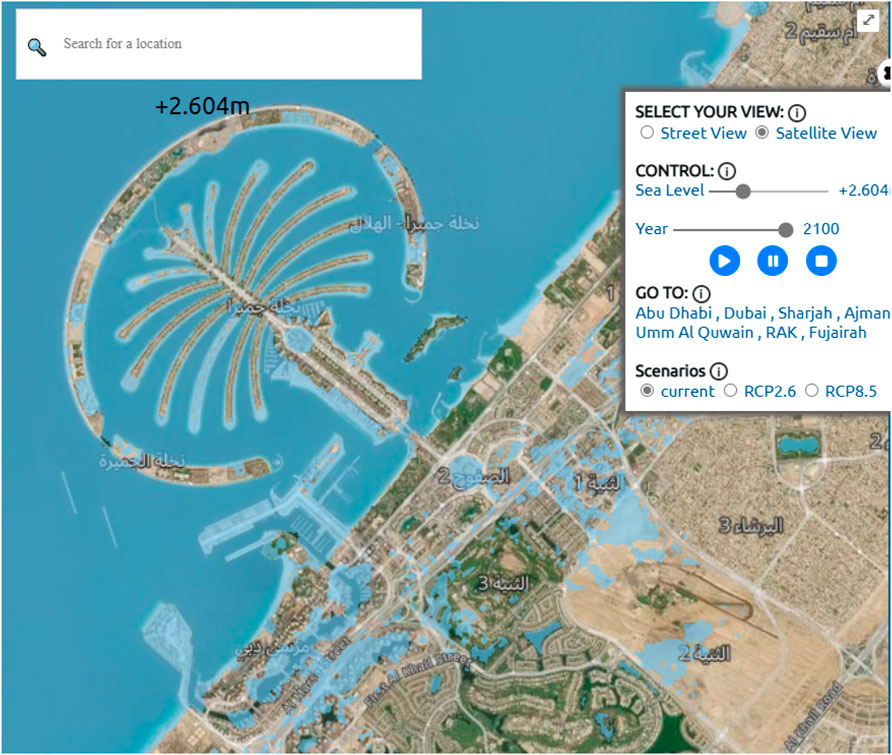
Figure 11. A close-up visualization of the areas inundated by 2100 in Palm Jumeirah.
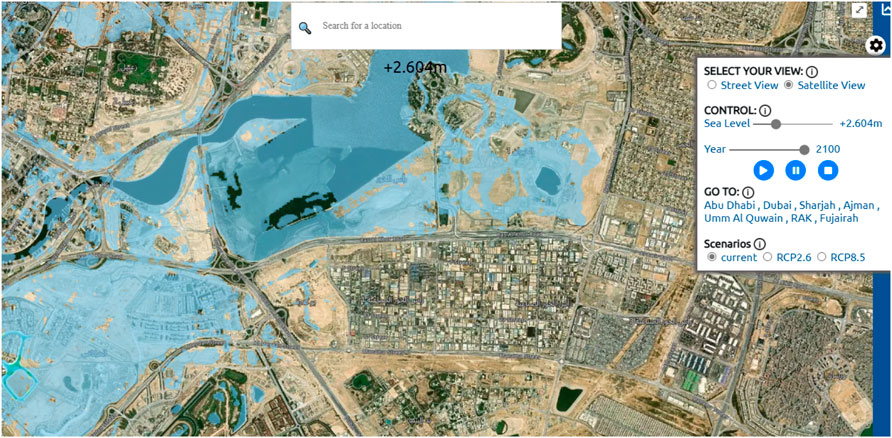
Figure 12. A close-up visualization of the areas inundated by 2100 in Khor Dubai.
It is important to note that the analysis does not account for other factors influencing SLR, such as storm surges, tidal effects, and seasonal winds, which could exacerbate the impacts of SLR and should be considered in future studies. However, the current visualization platform serves as an effective tool for understanding these impacts, identifying vulnerable areas, and raising awareness about the urgency and criticality of this issue. Further, although the platform is qualitative, the results were verified by manually cross-checking elevation-based flood extents with known coastal topography. This can be extended to include usability studies and expert feedback to formally validate its functionality and impact.
3.5 Mitigation and adaptation measures
Policymakers should prioritize enhancing urban planning policies to build resilience against climate change impacts. This includes regular maintenance of vulnerable areas, investment in climate-resilient infrastructure, and the integration of smart technologies to improve adaptive capacity. Strengthening collaboration between academia, industry, and government agencies is essential to drive innovation, improve urban sustainability, and ensure that climate adaptation strategies are science-driven and effective. Additionally, expanding national initiatives that promote green infrastructure, such as urban reforestation and nature-based solutions, can help mitigate the effects of extreme weather events, reduce urban heat, and enhance flood resilience. In the UAE, national campaigns aimed at increasing vegetation in urban areas, such as large-scale mangrove planting initiatives, help mitigate climate change impacts, including extreme heat waves and SLR. Expanding both ecosystem-based and structural protection measures provides additional natural defenses (42, 2019). For example, in Umm Al Quwain, shipwrecks along the coast have been strategically used to reduce coastal erosion (Subraelu et al., 2022). Similarly, ongoing mangrove plantation projects across the UAE contribute to coastal protection and carbon sequestration (Lincoln et al., 2021). Infrastructure improvements, particularly in drainage systems, are also a priority. Following the April 2024 floods, which saw unprecedented rainfall rates causing severe damage to transportation and infrastructure, Dubai has launched major drainage upgrades to enhance flood resilience against both SLR and heavy rainfall (Leggate, 2024). Additionally, advancing research and data-sharing capabilities is crucial for climate adaptation. Establishing a centralized data hub will enable the integration of real-time climate data, facilitating the development of early warning systems for extreme weather events. By leveraging technology, improving natural defenses, and fostering collaboration across sectors, the UAE is taking proactive steps to enhance urban climate resilience and infrastructure sustainability.
4 Conclusion and future work
This study introduced and evaluated multiple forecasting models for MSL in the Arabian Gulf region, comparing traditional statistical methods (ARIMA) to deep learning approaches (LSTM and LSTM-SE). The key contributions include demonstrating that SE block enhances LSTM’s capacity to capture temporal dependencies in short-term forecasts while offering a clear benchmark against ARIMA’s stable but less flexible predictions. In addition, we developed an interactive visualization platform that highlights potentially inundated coastal areas, providing a practical resource for policymakers and stakeholders.
Despite these advancements, the study faces limitations primarily due to data constraints: various environmental factors such as tides, storm surges, and comprehensive greenhouse gas emission scenarios could not be incorporated because of limited publicly available datasets for the region. Moreover, LSTM-based models exhibited signs of saturation in extended forecasting horizons, pointing to the need for more sophisticated architectures or supplementary input variables to capture long-range dependencies.
Future research would benefit from integrating multivariate data sources, including atmospheric and anthropogenic indicators, and from adopting advanced or hybrid architectures (e.g., CNN-LSTM or transformer-based) to address memory bottlenecks. Extending the visualization platform to support real-time data streams, higher-resolution elevation models, and multi-scenario simulations can further enhance its applicability for adaptive management and climate resilience planning.
Data availability statement
The datasets used in this study are publicly available. Altimetry data of MSL are provided by the NOAA Laboratory for Satellite Altimetry at https://www.star.nesdis.noaa.gov/socd/lsa/SeaLevelRise/LSA_SLR_timeseries.php. RGB-encoded elevation data provided by Maptiler is provided at https://www.maptiler.com/news/2019/03/rgb-encoded-elevation-data-in-maptiler-cloud/.
Author contributions
MZ: Conceptualization, Methodology, Supervision, Writing – original draft, Writing – review and editing. LE: Data curation, Methodology, Validation, Visualization, Writing – original draft, Writing – review and editing. NA: Investigation, Writing – original draft. MA: Writing – review and editing, Validation. HA-A: Writing – review and editing.
Funding
The author(s) declare that no financial support was received for the research and/or publication of this article.
Conflict of interest
The authors declare that the research was conducted in the absence of any commercial or financial relationships that could be construed as a potential conflict of interest.
Generative AI statement
The author(s) declare that Generative AI was used in the creation of this manuscript. The author(s) verify and take full responsibility for the use of generative AI in the preparation of this manuscript. Generative AI was used for proofreading.
Publisher’s note
All claims expressed in this article are solely those of the authors and do not necessarily represent those of their affiliated organizations, or those of the publisher, the editors and the reviewers. Any product that may be evaluated in this article, or claim that may be made by its manufacturer, is not guaranteed or endorsed by the publisher.
References
Accarino, G., Chiarelli, M., Fiore, S., Federico, I., Causio, S., Coppini, G., et al. (2021). A multi-model architecture based on long short-term memory neural networks for multi-step sea level forecasting. Future Gener. Comput. Syst. 124, 1–9. doi:10.1016/j.future.2021.05.008
Adebisi, N., and Balogun, A.-L. (2022). A deep-learning model for national scale modelling and mapping of sea level rise in Malaysia: the past, present, and future. Geocarto Int. 37, 6892–6914. doi:10.1080/10106049.2021.1958015
Alenezi, N., Alsulaili, A., and Alkhalidi, M. (2023). Prediction of sea level in the arabian gulf using artificial neural networks. J. Mar. Sci. Eng. 11, 2052. doi:10.3390/jmse11112052
Al Kabban, M. (2019). Sea level rise vulnerability assessment for abu dhabi, United Arab Emirates. Master Thesis Geogr. Inf. Sci. Available online at: https://lup.lub.lu.se/student-papers/search/publication/8998495
Author Anonymous (2019). Adaptation of the UAEs infrastructure to climate change. Available online at: https://www.moccae.gov.ae/assets/download/370644a8/05-NCCAP%20Environment%20DRAFT3.pdf.aspx?view=true Tech. Rep. Natl. Clim. Change Adapt. Program, Ministry Clim. Change Environ.
Balogun, A. L., and Adebisi, N. (2021). Sea level prediction using arima, svr and lstm neural network: assessing the impact of ensemble ocean-atmospheric processes on models’ accuracy. Geomatics, Nat. Hazards Risk 12, 653–674. doi:10.1080/19475705.2021.1887372
Box, G. E., Jenkins, G. M., Reinsel, G. C., and Ljung, G. M. (2015). Time series analysis: forecasting and control. John Wiley and Sons.
Church, J. A., and White, N. J. (2011). Sea-level rise from the late 19th to the early 21st century. Surv. Geophys. 32, 585–602. doi:10.1007/978-94-007-2063-3_17
Climate Central (2024). Coastal risk screening tool. Available online at: https://www.cakex.org/tools/coastal-risk-screening-tool (Accessed April 30, 2025).
[Dataset] University of Washington Climate Impacts Group (2023). Interactive sea level rise data visualizations. Available online at: https://cig.uw.edu/projects/interactive-sea-level-rise-data-visualizations (Accessed April 30, 2025).
Elneel, L., Zitouni, M. S., Mukhtar, H., and Al-Ahmad, H. (2023). “Forecasting global mean sea level rise using autoregressive models,” in 2023 30th IEEE international Conference on electronics, Circuits and systems (ICECS) (IEEE), 1–4. doi:10.1109/ICECS58634.2023.10382721
Elneel, L., Zitouni, M. S., Mukhtar, H., and Al-Ahmad, H. (2024a). Examining sea levels forecasting using autoregressive and prophet models. Sci. Rep. 14, 14337. doi:10.1038/s41598-024-65184-0
Elneel, L., Zitouni, M. S., Mukhtar, H., Galli, P., and Al-Ahmad, H. (2024b). Exploring key aspects of sea level rise and their implications: an overview. Water 16, 388. doi:10.3390/w16030388
Hansen, J., Sato, M., Hearty, P., Ruedy, R., Kelley, M., Masson-Delmotte, V., et al. (2016). Ice melt, sea level rise and superstorms: evidence from paleoclimate data, climate modeling, and modern observations that 2°c global warming could be dangerous. Atmos. Chem. Phys. 16, 3761–3812. doi:10.5194/acp-16-3761-2016
Hassan, K. M. A., Haque, M. A., and Ahmed, S. (2021). “Comparative study of forecasting global mean sea level rising using machine learning,” in 2021 international conference on electronics, communications and information technology (ICECIT) (IEEE), 1–4. doi:10.1109/ICECIT54077.2021.9641339
Hochreiter, S., and Schmidhuber, J. (1997). Long short-term memory. Neural Comput. 9, 1735–1780. doi:10.1162/neco.1997.9.8.1735
Horton, B. P., Khan, N. S., Cahill, N., Lee, J. S., Shaw, T. A., Garner, A. J., et al. (2020). Estimating global mean sea-level rise and its uncertainties by 2100 and 2300 from an expert survey. npj Clim. Atmos. Sci. 3, 18. doi:10.1038/s41612-020-0121-5
Hu, J., Shen, L., and Sun, G. (2018). “Squeeze-and-excitation networks,” in Proceedings of the IEEE conference on computer vision and pattern recognition, 7132–7141.
Hyndman, R. J., and Athanasopoulos, G. (2018). Forecasting: principles and practice. Australia: OTexts. Available online at: https://otexts.com/fpp3/
IPCC (2019). Special report on the ocean and cryosphere in a changing climate. Intergovernmental Panel on Climate Change IPCC. Cambridge, UK and New York: Cambridge University Press. doi:10.1017/9781009157964
Leggate, J. (2024). Dubai announces plans to build $8b stormwater drainage network. Eng. News-Record Accessed.
Lincoln, S., Buckley, P., Howes, E. L., Maltby, K. M., Pinnegar, J. K., Ali, T. S., et al. (2021). A regional review of marine and coastal impacts of climate change on the ropme sea area. Sustainability 13, 13810. doi:10.3390/su132413810
Liu, J., Jin, B., Wang, L., and Xu, L. (2022). Sea surface height prediction with deep learning based on attention mechanism. IEEE Geoscience Remote Sens. Lett. 19, 1–5. doi:10.1109/lgrs.2020.3039062
Makridakis, S., Spiliotis, E., and Assimakopoulos, V. (2018). Statistical and machine learning forecasting methods: concerns and ways forward. PloS one 13, e0194889. doi:10.1371/journal.pone.0194889
Meehl, G. A., Washington, W. M., Collins, W. D., Arblaster, J. M., Hu, A., Buja, L. E., et al. (2005). How much more global warming and sea level rise? science 307, 1769–1772. doi:10.1126/science.1106663
Melville-Rea, H., Eayrs, C., Anwahi, N., Burt, J. A., Holland, D., Samara, F., et al. (2021). A roadmap for policy-relevant sea-level rise research in the United Arab Emirates. Front. Mar. Sci. 8, 670089. doi:10.3389/fmars.2021.670089
Mohajan, H. (2011). Greenhouse gas emissions increase global warming. Int. J. Econ. Political Integration 1, 21–34.
NASA Sea Level Change Team (2024). Ipcc ar6 sea level projection tool. Available online at: https://sealevel.nasa.gov/ipcc-ar6-sea-level-projection-tool (Accessed April 30, 2025).
Nerem, R. S., Beckley, B. D., Fasullo, J. T., Hamlington, B. D., Masters, D., and Mitchum, G. T. (2018). Climate-change–driven accelerated sea-level rise detected in the altimeter era. Proc. Natl. Acad. Sci. 115, 2022–2025. doi:10.1073/pnas.1717312115
Nieves, V., Radin, C., and Camps-Valls, G. (2021). Predicting regional coastal sea level changes with machine learning. Sci. Rep. 11, 7650. doi:10.1038/s41598-021-87460-z
NOAA (2024a). Laboratory for satellite altimetry/sea level rise. Available online at: https://www.star.nesdis.noaa.gov/socd/lsa/SeaLevelRise/LSA_SLR_timeseries.php.
NOAA (2024b). Sea level rise viewer. Available online at: https://coast.noaa.gov/digitalcoast/tools/slr.html (Accessed April 30, 2025).
Qin, Y., Song, D., Chen, H., Cheng, W., Jiang, G., and Cottrell, G. (2017). A dual-stage attention-based recurrent neural network for time series prediction. Adv. Neural Inf. Process. Syst. (NeurIPS) 30, 1–11. doi:10.48550/arXiv.1704.02971
Rahmstorf, S. (2007). A semi-empirical approach to projecting future sea-level rise. Science 315, 368–370. doi:10.1126/science.1135456
Rignot, E., Velicogna, I., van den Broeke, M. R., Monaghan, A., and Lenaerts, J. T. (2011). Acceleration of the contribution of the Greenland and antarctic ice sheets to sea level rise. Geophys. Res. Lett. 38. doi:10.1029/2011gl046583
Sherstinsky, A. (2020). Fundamentals of recurrent neural network (rnn) and long short-term memory (lstm) network. Phys. D. Nonlinear Phenom. 404, 132306. doi:10.1016/j.physd.2019.132306
Sloup, P. (2019). Rgb-encoded elevation data in maptiler cloud. Available online at: https://www.maptiler.com/news/2019/03/rgb-encoded-elevation-data-in-maptiler-cloud/(Accessed December 15, 2024).
Song, J., Tong, G., Chao, J., Chung, J., Zhang, M., Lin, W., et al. (2023). Data driven pathway analysis and forecast of global warming and sea level rise. Sci. Rep. 13, 5536. doi:10.1038/s41598-023-30789-4
Sorkhabi, O. M., Shadmanfar, B., and Al-Amidi, M. M. (2023). Deep learning of sea-level variability and flood for coastal city resilience. City Environ. Interact. 17, 100098. doi:10.1016/j.cacint.2022.100098
Subraelu, P., Ebraheem, A. A., Sherif, M., Sefelnasr, A., Yagoub, M., and Rao, K. N. (2022). Land in water: the study of land reclamation and artificial islands formation in the uae coastal zone: a remote sensing and gis perspective. Land 11, 2024. doi:10.3390/land11112024
Tabassum, A., Rabbani, M., and Omar, S. B. (2019). “An approach to study on time series components and by using them to enumerate the height of sea level alteration for both global mean sea level (gmsl) and bay of bengal (bob),” in 2019 IEEE international conference on electrical, computer and communication technologies (ICECCT) (IEEE), 1–7. doi:10.1109/ICECCT.2019.8869397
Tur, R., Tas, E., Haghighi, A. T., and Mehr, A. D. (2021). Sea level prediction using machine learning. Water 13, 3566. doi:10.3390/w13243566
Keywords: sea level rise, LSTM, ARIMA, attention networks, visualization
Citation: Zitouni MS, Elneel L, Assad Albakri N, Alkhatib MQ and Al-Ahmad H (2025) Forecasting sea level rise using enhanced deep learning models. Front. Environ. Sci. 13:1552834. doi: 10.3389/fenvs.2025.1552834
Received: 29 December 2024; Accepted: 23 May 2025;
Published: 12 June 2025.
Edited by:
Peng Liu, Chinese Academy of Sciences (CAS), ChinaReviewed by:
Aman Srivastava, Indian Institute of Technology Kharagpur, IndiaDaoheng Zhu, Guangdong Ocean University, China
Basri Badyalina, MARA University of Technology, Malaysia
Copyright © 2025 Zitouni, Elneel, Assad Albakri, Alkhatib and Al-Ahmad. This is an open-access article distributed under the terms of the Creative Commons Attribution License (CC BY). The use, distribution or reproduction in other forums is permitted, provided the original author(s) and the copyright owner(s) are credited and that the original publication in this journal is cited, in accordance with accepted academic practice. No use, distribution or reproduction is permitted which does not comply with these terms.
*Correspondence: M. Sami Zitouni, bXppdG91bmlAdWQuYWMuYWU=; Leena Elneel, bGVsbmVlbEB1ZC5hYy5hZQ==