 Yibin Lin1
 Yanling Xi
 Jiabin Chen
- 1School of Economics and Management, China University of Geosciences, Beijing, China
- 2Tianjin Academy of Social Sciences, Tianjin, China
- 3Chinese Academy of Natural Resources Economics, Beijing, China
- 4Key Laboratory of Carrying Capacity Assessment for Resource and Environment Ministry of Natural Resources of the People’s Republic of China, Beijing, China
While oil remains a critical component of global energy systems, its combustion in the transport sector releases fine particulate matter (PM2.5), posing significant public health risks. As previous studies have overlooked the health impacts and economic losses associated with PM2.5 pollution from oil consumption by mobile sources, this article analyzes the annual average concentration of PM2.5 in China’s provinces for key years from 2020 to 2060. It then assesses the projected health effects and economic losses resulting from PM2.5 pollution linked to provincial oil consumption during these key years, utilizing an integrated exposure–response relationship (IER) model and the revised human capital method. The results show that the health effects of PM2.5 pollution—specifically on lung cancer, chronic obstructive pulmonary disease (COPD), ischemic heart disease (IHD), and stroke—vary significantly by province: in 2020, lung cancer deaths were highest in Shandong Province (1,317 cases), followed by Henan Province (1,206 cases), and lowest in Tibet (only 7 cases projected in 2060); premature deaths from COPD were particularly prominent in Shandong Province (1,615 cases in 2020) and are projected to peak in Guangdong Province in 2035); and premature deaths from stroke were particularly prominent in Shandong Province (1,615 cases in 2020), while Guangdong Province is expected to surpass Shandong after 2035. Premature deaths due to stroke were most severe in Shandong Province (5,284 cases in 2020), followed by Henan and Jiangsu provinces. As annual average PM2.5 concentrations decrease, the number of premature deaths in China is also projected to decrease, but the economic losses due to premature death are greatest in the middle-aged and older age groups (50–74 years). In 2020, lung cancer and COPD accounted for $151.988 billion in losses in the 65–69 years age group, and stroke caused the highest economic losses ($31.81 billion); by 2050, IHD is projected to top the list of economic losses ($24.01 billion), while COPD is expected to consistently result in the lowest economic losses. This study provides a quantitative basis for optimizing the energy structure and formulating regionally differentiated emission reduction policies.
1 Introduction
Oil is one of the major basic energy sources consumed and an indispensable industrial raw material in China. It occupies a pivotal position in the development of the national economy and promotes economic development, and it is inextricably linked to the daily lives of the people. In addition, oil consumption occupies an important position in China’s energy consumption structure. According to the China Energy Statistics Yearbook 2023 (NBS, 2023), China’s oil consumption accounted for 19.5% of the total energy consumption in 2022, a further increase from 2020 (18.9%), indicating that the core position of oil in the energy structure continues to strengthen. In addition, the transportation sector, as a major oil consumption sector, grew from 36.5% in 2018 to 38.2% in 2022 (NDRC, 2023), consistent with the trend of ‘incremental substitution’ in the early stages of the promotion of new energy vehicles.
With the further development of the economy, the continuous progress of industrialization, and the improvement and upgrading of the energy structure, China’s total oil consumption had exceeded 500 million tons since 2015 and was at 620 million tons by 2018 (National Bureau of Statistics of the People’s Republic of China, 2021); it is now one of the world’s biggest consumers of oil. In terms of oil consumption, the transportation and chemical industries are the main sectors. The transportation sector accounts for the largest share of China’s oil and energy consumption, accounting for 36.5% of the total oil consumption in 2018 (National Bureau of Statistics of the People’s Republic of China, 2021). China is a major country in terms of motor vehicle ownership. In 2019, the total number of vehicles reached 348 million, an increase of 6.4% compared to 2018. In the future, along with economic development, the transportation industry will develop further, and the oil demand may further increase. The process of oil consumption will release a large amount of PM2.5 emissions into the environment, which not only endangers water resources, the atmosphere, and soil but also damages human health. With China’s economic growth, people’s improving living standards, and the increasing use of mobile sources in the future, PM2.5 emissions from oil consumption by mobile sources may continue to increase, causing harm to the ecological environment and human health. The transport sector is expected to contribute 66.3% of the reduction in future oil consumption (Oil Control Research Project research group, 2019). This is because mobile sources mainly originate from the transportation sector itself. PM2.5 emissions produced by transportation can be measured by the moving source. According to the China Air Pollution Prevention and Control Progress Report published by the Ministry of Ecology and Environment in 2023, the contribution of mobile sources to the annual average PM2.5 concentration increased to 11.3% in 2022, mainly stemming from the continued growth of fuel vehicle ownership (reaching 381 million vehicles in 2022, an increase of 6.8% year-on-year).
PM2.5 emissions produced by oil consumption are harmful to the ecological environment and human health. They can lead to diseases affecting the respiratory, cardiovascular, and immune systems, causing premature deaths, and, thus, reducing the overall value of life. Ambient (outdoor) air pollution in both urban and rural areas was estimated to cause 4.2 million premature deaths worldwide in 2016, according to the World Health Organization (WHO, 2018). Because transportation is the primary sector for oil consumption, it contributes to the increase in PM2.5 concentrations in the atmosphere. This increase in air pollution results in adverse health effects and an increase in the number of premature deaths, leading to economic losses. However, health-related economic losses vary across different age groups because of differences in resistance.
Oil consumption accounts for a large proportion of China’s energy consumption. With the transformation and adjustment of the energy structure, oil consumption will further increase in the energy consumption structure, and as the number of motor vehicles increases, oil consumption by mobile sources will also increase further. The apparent contradiction arises from China’s dual carbon policy (peaking oil consumption by 2030) and technological advancements (e.g., electric vehicles), which help reduce PM2.5 emissions even as oil consumption continues to increase initially. However, existing research on the health impacts and associated economic losses resulting from PM2.5 pollution generated by oil consumption from mobile sources remains limited. To address this gap, this study focuses on quantifying the economic burden of PM2.5-related health effects during the critical period of oil consumption spanning from 2020 to 2060. Based on the PM2.5 concentration data under the 2020–2050 key year strengthening policy, published in “China’s Medium- and Long-term Air Quality Improvement Pathways and Health Benefits” by Tsinghua University and the Energy Foundation (He et al., 2020), assuming that the annual average concentration of PM2.5 in 2060 will be 10 μɡ/m3, as prescribed by the World Health Organization (WHO), to evaluate the health effects of PM2.5, this article used the integrated exposure–response (IER) model to evaluate the impact of PM2.5 on the health of residents in the key years from 2020 to 2060, and on this basis, human capital is used to estimate the monetization of health effects. The health effects and economic impacts of PM2.5 emissions resulting from mobile oil consumption were studied.
The primary hypothesis of this study is to quantify the health impacts and associated economic losses of PM2.5 pollution resulting from mobile source oil consumption during the critical period of 2020–2060. This study is the first to quantify the long-term impacts of mobile source oil consumption on PM2.5-related health and economic burdens at the provincial scale; it does so by combining SSP4 scenarios with the IER model. This hypothesis directly addresses an identified research gap, i.e., the limited research on the health impacts and associated economic losses of PM2.5 pollution from mobile source oil consumption, by conducting detailed data analysis and applying existing models with region-specific adjustments.
2 Literature review
With regard to the economic losses and health effects of PM2.5 pollution from mobile sources in China, previous research has focused on the impact of energy consumption on air pollution and PM2.5- related health effects and economic losses. Chowdhury et al. (2007) quantified the major source contribution to PM2.5 concentrations in the four seasons in Delhi, Mumbai, Kolkata, and Chandigarh in summer. The main sources were found to be diesel engine exhaust, gasoline engine exhaust, road dust, coal combustion, and biomass combustion. Sahu et al. (2011) used a high-resolution emission inventory developed by the System of Air Quality Forecasting and Research to quantify PM2.5 emissions from traffic. Huang et al. (2014) found that reducing emissions from secondary aerosol formation, such as fossil fuel combustion and biomass combustion, could help control PM2.5 levels and reduce environmental pollution in China. Guan et al. (2014) quantified PM2.5 emissions from transportation fuels in China. Guo et al. (2017) quantified the sources of PM2.5 emissions using a community multi-scale air quality model based on the Emissions Database for Global Atmospheric Research, and they found that energy is a major contributor to PM2.5 emissions in Northern India. Xu and Lin (2018) used quantile regression to explore the main drivers of differences in PM2.5 pollution at high, medium, and low emission levels. They found that motor vehicles were one of the main factors. Kalaiarasan et al. (2018) showed that 70% of PM2.5 emissions in the air were from vehicle emissions in urban Mangalore, India. Yang et al. (2018) found that Beijing’s PM2.5 direct emissions came from a variety of sources, with gasoline accounting for 21.29%. Masiol et al. (2019) found that spark-ignition vehicles were the main source of PM2.5 emissions, and the increase in PM2.5 emissions was consistent with the increase in the number of vehicles registered. Chao et al. (2019) collected 218 PM2.5 samples in Beijing. The sources of PM2.5-bound PAHs were analyzed, and it was found that motor vehicle emissions accounted for the largest proportion, which was approximately 54.6%. Kong et al. (2020) used positive matrix factorization sources to identify the main sources of PM2.5 emissions, which included secondary aerosols, coal combustion, biomass combustion, and vehicle emissions. Zhang et al. (2023), based on a national high-resolution emission inventory, pointed out that the share of PM2.5 emissions from transportation sources reached 12.1% in 2021, with diesel vehicles accounting for more than 50%. In addition, Liu et al. (2022) found through empirical analysis that every 10% increase in the penetration rate of new energy vehicles was able to reduce PM2.5 concentrations by 1.2–1.8 μg/m3.
2.1 Research progress on health effects and economic losses due to PM2.5 emissions
Pope et al. (2004) used a Cox proportional hazards regression model to estimate the association between PM and specific causes of mortality. Long-term PM exposure was associated with IHD, arrhythmias, heart failure, and cardiac arrest. The World Health Organization (2005) introduced methods for estimating the burden of disease associated with exposure to outdoor air pollution. Using the long-term relative risk estimates of PM2.5 and a health impact function to estimate attributable mortality, Anenberg et al. (2010) found that cardiorespiratory mortality was associated with annual anthropogenic PM2.5 levels. Lim et al. (2012) proposed a method to estimate the global population exposed to PM2.5 in 2010. Evans et al. (2013) adopted the remote sensing data to conduct a global assessment of mortality associated with long-term exposure to fine particulate air pollution and to assess the attributable portion of relative risk and mortality. There was a close relationship between air pollution and lung cancer. The atmospheric pollutant PM2.5 was classified as carcinogenic by the International Agency for Research on Cancer in 2013 (Pascal et al., 2013). Chen et al. (2013) found that air pollution was linked to stroke in eight Chinese cities (Beijing, Fuzhou, Guangzhou, Hong Kong, Shanghai, Shenyang, Suzhou, Tangshan). Xie et al. (2014) found that people over the age of 65 were more sensitive to airborne particles than the rest of the population. Burnett et al. (2014) compared seven models for estimating the health benefits of air pollutants and concluded that the methods used in the Global Burden of Diseases (GBD), Injuries, and Risk Factors Study, 2017, provided a better model for predicting the relative risk. Yin et al. (2020) considered that the risk ratios for respiratory diseases, COPD, and pneumonia ranged from 1.10 to 1.24 per 10 μg/m3 of increasing exposure to PM2.5. Yu et al. (2018) combined the DEA model with the IER model to determine the relationship between PM2.5 concentration and mortality. Anenberg et al. (2019) linked the most recent vehicle emission air pollution to an epidemiological model and estimated the environmental effects of transport sector emissions on PM2.5 and ozone and the health effects in 2010 and 2015. Chen H. et al. (2020) used the Poisson regression model to estimate the public health impact of coal consumption-induced PM2.5 pollution in 2015. Anser et al. (2020) found that the combustion of fossil fuels was a contributing factor to high mortality and personal respiratory morbidity in emerging Asian countries.
Xie et al. (2016) evaluated the economic impact of PM2.5-related health factors in nine provinces in China using a computable general equilibrium model. Li et al. (2017) quantified the public health effects of PM2.5 in Beijing from 2014 to 2015 using the exposure–response relationship model and the health loss assessment model. Based on the data on PM2.5 emissions in 2016 from 338 cities in China, the mortality from related diseases was estimated using the IER model, the non-linear power law model, and the log-linear model, and morbidity was evaluated using the log-linear model (Maji et al., 2018). Jo et al. (2018) used the Poisson regression model to analyze the influence of PM2.5 pollution on hospital attendance rate and considered hysteresis; there was an increase in COPD-related hospital visits (both outpatient and admissions). Huang et al. (2018) analyzed the air quality and mortality data from 2013 to 2017 in 74 major cities in China to estimate the health impact of the air pollution control action plans. Changes in mortality rates and years of life lost (an indicator that considers life expectancy at death) were calculated, and the health impact of air quality management over a 5-year period was assessed. Fann et al. (2018) used the annual average concentration of PM2.5 emissions simulated by oil emission inventories and the Comprehensive Air-Quality Model with extensions to quantify the health effects and economic losses due to PM2.5 emissions using the Environmental Benefits Mapping and Analysis Program (BenMAP), and it was found that air pollutants from oil emissions reduced air quality and caused premature deaths. Lu et al. (2019) estimated the trends in PM2.5 concentrations and their adverse effects on health in China from 2001 to 2017, using 1 km high-resolution annual satellite-retrieved PM2.5 data. Guan et al. (2019) evaluated the annual health losses and economic impacts of PM2.5 exposure in China from 2015 to 2017 based on the ground-based monitoring PM2.5 concentration data and annual real-time population data. Zhao et al. (2019) conducted a cross-sectional study to observe the effect of PM2.5 emissions on the incidence of COPD in the Chinese Han population. It was found that the incidence of COPD was correlated with PM2.5 levels and that PM2.5 emissions and cigarette smoke had synergistic effects on COPD. Zeng and Ruan (2020) used the BenMAP model and the CGE model to estimate the national economic impact of PM2.5 pollution in 2017. Fu et al. (2020) measured the health effects of PM2.5 emissions in Chinese Central Plain cities using an exposure–response relationship model and a human capital method. Luo et al. (2020) used the BenMAP model to calculate the health effects and economic benefits of reducing PM2.5 exposure. The number of premature deaths due to cardiovascular disease was estimated, and the economic benefits were estimated according to the willingness-to-pay method. These were future predictive analyses. Li et al. (2018) built the LEAP-Beijing model to explore the future energy consumption of PM2.5 emissions in Beijing on human health. Guo et al. (2020) used the IER model to analyze and predict the health effects of PM2.5, an atmospheric pollutant in Baoding. Zhang et al. (2025) conducted a pioneering study using a cohort of 5,571 male HIV patients in Wuhan (2000-2021), employing competing risk models to reveal that each 10μg/m3 increase in PM2.5 exposure was associated with a 28.8% (95%CI:25.5%-32.2%) elevated risk of AIDS progression, with black carbon (+49.0%) and sulfate (+14.5%) identified as the most hazardous components. The study further identified vulnerable subgroups including elderly (≥60 years), overweight (BMI≥24 kg/m2), highly-educated, and smoking populations. These findings provide critical evidence for targeting specific PM2.5 components and high-risk populations in HIV environmental health interventions. Although previous studies have made significant progress on the health impacts and economic losses of PM2.5, there are still some limitations. First, the majority of the studies focused on specific regions or time periods and lacked comprehensive analyses across regions and time, which limited the generalizability of the findings. Second, some of the studies had differences in the methods and data used to assess economic losses, resulting in poor comparability between the results. In addition, some studies failed to fully consider other potential influencing factors, such as individual differences and living habits, when exploring the association between PM2.5 and health effects, which may affect the accuracy of the results. Therefore, this study has improved the methodology, and by using more comprehensive data and more accurate models, it aims to overcome the limitations of previous studies and provide a quantitative basis for the development of more effective energy structure optimization and regionally differentiated emission reduction policies.
2.2 Review of the literature
After reviewing the abovementioned research, the following points can be drawn.
(1) There were few studies on the health effects and economic losses caused by PM2.5 emissions from oil consumption in China. With the implementation of the dual carbon targets and changes in the energy structure, China’s overall oil consumption is expected to follow a trend of initial growth, followed by a gradual decline.
(2) The IER model could integrate the relative risks of different types, which was a better response to the relative risks of PM2.5 than the other models. The revised human capital method evaluated the value of human life from a social perspective without considering the difference in individual value. GDP per capita was often used as a statistical measure to estimate the economic cost of premature death.
Thus, based on the IER model and the revised human capital method, this article measured the health effects and economic losses caused by PM2.5 emissions in China’s provincial oil consumption from mobile sources in the key years from 2020 to 2060.
3 Methods and data
3.1 Health effect loss assessment
The IER model, based on epidemiological risk functions that quantify the relationship between PM2.5 exposure and health outcomes (such as chronic obstructive pulmonary disease, lung cancer, and cardiovascular mortality), has been adapted to China’s unique PM2.5 context, which is characterized by high urban pollution levels, regional variability, and population susceptibility. Key adaptations include incorporating local exposure data from Chinese monitoring networks and satellite estimates, using China-specific baseline disease rates, adjusting concentration-response curves for potential non-linear effects at extreme PM2.5 levels, and accounting for demographic factors that influence population vulnerability. This model is complemented by the human capital method, which evaluates the economic burden of pollution-related health impacts by estimating direct medical costs and indirect costs from lost productivity, aligned with social cost-of-illness frameworks that capture societal economic losses. For China, this involves applying local economic data and making contextual adjustments for regional disparities and high-exposure sectors. The IER model first estimates health outcomes, which the human capital method then monetizes, supporting cost–benefit analyses of air quality policies, such as evaluating the economic gains from achieving China’s PM2.5 targets. Although the human capital method may undervalue non-working populations, and IER uncertainties are mitigated through sensitivity analyses and validation, this dual methodology provides a robust, context-sensitive framework for linking PM2.5 exposure to economic costs, informing China’s public health and environmental policies.
The IER model and the revised human capital method are well-suited for this study due to their ability to address the complex health and economic impacts of PM2.5 pollution in China. The IER model, which quantifies the relationship between PM2.5 exposure and health outcomes, is particularly effective at capturing non-linear health risks under high PM2.5 concentrations, a common scenario in many Chinese regions. It integrates local exposure data and China-specific baseline disease rates, enhancing its accuracy in assessing multiple health endpoints such as lung cancer, COPD, IHD, and stroke. The revised human capital method complements this by estimating the economic burden of pollution-related health impacts using per capita GDP data to evaluate societal economic losses. This approach is especially relevant in China, where economic disparities across provinces necessitate a method that can reflect regional variations. Together, these models provide a comprehensive framework for evaluating both the health effects and economic losses associated with PM2.5 pollution.
Compared to other models, the IER model and the revised human capital method offer distinct advantages. Traditional linear and log-linear models often fail to accurately predict health risks at extreme PM2.5 concentrations, whereas the IER model’s incorporation of non-linear parameters and threshold concentrations allows for more precise estimations. Similarly, while global models such as the GBD rely on international data, the IER model’s localization to the Chinese context improves its relevance. In terms of economic evaluation, the revised human capital method is considered more practical than the willingness-to-pay (WTP) method, which faces data collection challenges in China, and the cost-benefit analysis (CBA) method, which is more complex and data-intensive. However, these models are not without limitations. The parameters of the IER model may vary regionally, and it does not fully account for individual differences or lifestyle factors. The revised human capital method may underestimate the value of life for non-working populations, such as retirees. Despite these limitations, sensitivity analyses and uncertainty assessments help mitigate potential biases, making these models robust tools for informing policy decisions. The health effects of PM2.5 emissions from oil consumption by mobile sources were measured in five steps, using Formulas (2) and (3) (Burnett et al., 2014) and Formulas 1, 4, 5 (Pan et al., 2019).
The number of cases related to the four health endpoints caused by PM2.5 pollution in the key years from 2020 to 2060 was assessed using Formula 1. The selected key years were 2020, 2025, 2030, 2035, 2050, and 2060.
Here,
The IER relationship model was used to calculate the relative risk (RR) of PM2.5 emissions from oil consumption by mobile sources in China in the key years. Formulas 2, 3 are provided as follows:
In Formulas 2, 3,
Using the
Here,
As the contribution rate of mobile sources to PM2.5 pollution was 9.8% (Chen et al., 2019), the number of premature deaths from the four health effect endpoints caused by PM2.5 pollution from oil consumption by mobile sources in the key years (
Here,
3.2 Assessment of health effects and economic losses
The first step was to calculate the number of years lost for each individualby subtracting the year of death in the key years (
An age group was defined as occurring every 5 years.
In the second step, the economic losses due to premature death were calculated using Formula 7 (Zhao et al., 2016).
The third step was to calculate the sum of the economic losses due to premature death from the health effect endpoints for all individuals. Formula 8 is used to calculate the economic losses from premature death due to IHD and stroke for all individuals. Formula 9 is used to calculate the economic losses from premature death due to COPD and lung cancer for all individuals (Zhao et al., 2016).
Here,
3.3 Data sources
In this study, the years 2020–2060 have been selected as the study period, covering a number of key years to reflect important changes in the fuel consumption and PM2.5 pollution status of mobile sources in China. These years represent critical periods of policy adjustment, economic development, and technological innovation. In particular, we focused on the Beijing–Tianjin–Hebei region (226 cities), the Fenwei Plain, and the Yangtze River Delta, which are not only economically developed but also experience more severe air pollution problems in China. They were chosen to represent different regions in China and to provide a comprehensive analysis.
The data for PM2.5 concentrations are mainly from studies conducted by Tsinghua University and the Energy Foundation (2020), which are subject to strict quality control to ensure accuracy and reliability. For forecast data such as population and GDP, we used forecasting methods and models based on current trends and reasonable assumptions. At the same time, we perform data cleaning and calibration to eliminate outliers and potential errors. These data provide us with the basic information needed for the study.
The selected sample is intended to be representative of the general situation in the entire study region or country. We verified the reliability of the data by comparing them with other data sources (e.g., official statistics and international studies). Despite some data limitations and uncertainties, we have engaged in open discussion and pointed out possible implications and directions for future research.
The PM2.5 concentration data integrate the following sources: 2020–2025 forecast data: Tsinghua University and the Energy Foundation (He et al., 2020); 2021–2022 measured data: National Urban Air Quality Report issued by the China National Environmental Monitoring Center (CNEMC, 2023), covering 337 prefecture-level cities in China; 2060 target value: updated annual average PM2.5 concentration in the World Health Organization’s Global Air Quality Guidelines (2021) (WHO, 2021); 2060 objective value: updated annual average PM2.5 concentration in the World Health Organization’s Global Air Quality Guidelines (2021) (WHO, 2021), covering 337 prefecture-level cities in China; and 2060 target value: the updated annual average PM2.5 concentration limit (5 μg/m3) in the World Health Organization’s Global Air Quality Guidelines (2021) (WHO, 2021).
The Beijing–Tianjin–Hebei region (226 cities), the Fenwei Plain, and the Yangtze River Delta used the data predicted in the report, while the remaining provinces used national data. The reference concentration of PM2.5 in the WHO air quality guidelines for 2006 was 10 μg/m3 (WHO, 2005).
The data on life expectancy in China were from the United Nations. The predicted life expectancy data were used to calculate the years the individual would lose because of premature death.
For mortality, this article used the mortality rate in 2019 in China from the GBD (Global Burden of Diseases, 2019). Assuming that medical and environmental conditions will not worsen in the future, this study assumes that the number of premature deaths will not increase before 2060. Based on the population distribution data of China’s 31 provinces from 2010 to 2100 under the Shared Socioeconomic Pathway 4 (SSP4) scenario, this article forecasts the population from 2020 to 2060. SSP4 describes a scenario of inequality in which the entire country experiences low fertility and low mortality, consistent with global assumptions (Chen et al., 2020b). In this study, China’s population distribution is projected using the SSP4 scenario, which assumes that socio-economic development exhibits a high degree of inequality but that the country as a whole maintains low fertility and mortality rates (Chen H. et al., 2020). This scenario aligns closely with China’s “dual-carbon” policy framework (carbon peaking by 2030 and carbon neutrality by 2060) and the energy consumption constraints outlined in the National Climate Change Program (2022). Specifically, the Shared Socioeconomic Pathway 4 (SSP4)—a moderate mitigation scenario assuming an initial rise followed by a decline in oil use—provides a compatible trajectory for China’s transportation sector. Under SSP4, the phased energy transition aligns with the sector’s mandated 66.3% reduction in mobile source emissions by 2060, as stipulated in dual-carbon policy documents; the aging trend predicted by SSP4 (increasing share of the 50–74 year old cohort) is consistent with the results of the seventh Chinese census (18.7% of the population aged 60+ in 2020) and the context of the delayed retirement policy; and the pace of technological innovation implied by SSP4 (e.g., the penetration rate of new-energy vehicles) is consistent with China’s “New Energy Vehicle Industry Development Plan (2021–2035)” target of “20% of new-energy vehicle sales in 2025.” Relative risk calculations for lung cancer and COPD were started at the age of 25, and relative risk calculations for stroke and IHD were started at the age of 0 (Apte et al., 2015). The technical approach of this paper is shown in Figure 1.
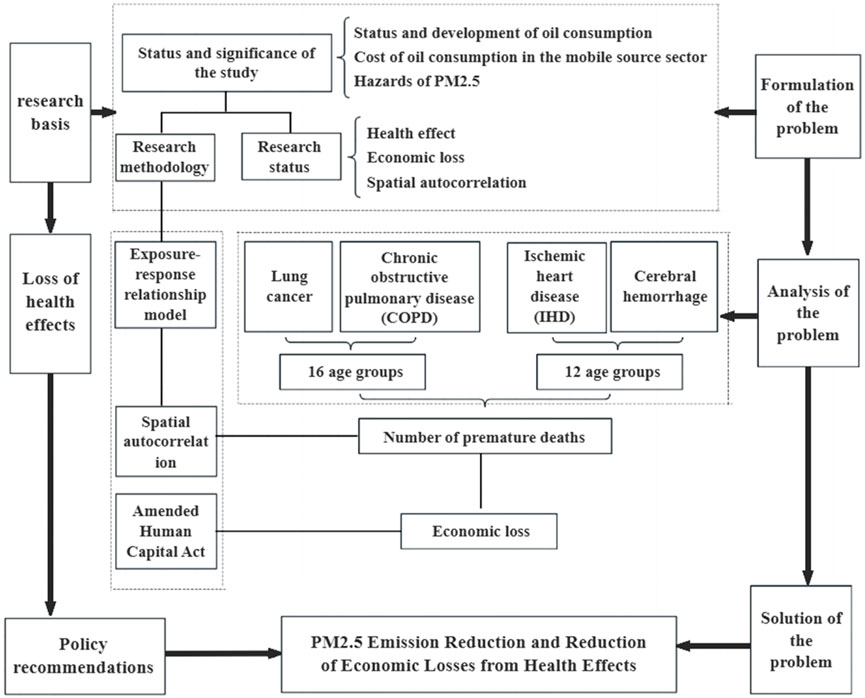
Figure 1. Technology roadmap.
Although no human/animal subjects were involved, we adhered to data ethics guidelines by anonymizing provincial data and citing public databases.
4 Results and discussion
4.1 Premature deaths due to PM2.5 emissions from oil consumption by mobile sources in China’s provinces
The article first conducted a comparative analysis of the number of premature deaths in each province. Because of the different growth levels and the different GDP growth rates in each province, it was difficult to measure economic growth at the provincial level. It was even more difficult to measure the economic losses caused by premature deaths in the provinces. Therefore, this study only provides a comparative analysis of the number of premature deaths in each province and does not include an analysis of the associated economic losses.
Figures 3–6 show the premature deaths due to PM2.5 emissions from oil consumption by mobile sources in China’s provinces. Based on the number of premature deaths in the provinces in the key years, it was found that the provincial variation in premature deaths varied considerably. Figure 4 shows the health effects of lung cancer in the key years.
The number of premature deaths from lung cancer varied greatly across the key years. In 2020, lung cancer accounted for the fewest premature deaths compared to the other three health effect endpoints. Shandong province recorded the highest number of deaths, with 1,317 (95% CI: 1,246–1,388) in 2020, followed by Henan province with 1,206 (95% CI: 1,138–1,274). Shandong’s high PM2.5 levels (Figure 2) and dense population (SSP4 projections) synergistically drive health impacts; industrial activities (e.g., petrochemical industries) and high vehicle density The United Nations (2019). exacerbate emissions; aging demographics (50–74 years age group) further amplify vulnerability, as shown in Figure 8. Although the number of premature deaths decreased to 766 (95% CI: 712–820) in 2025, Shandong province still had the highest number of premature deaths. Guangdong province is projected to surpass all other regions in premature deaths starting in 2035. Tibet had the fewest premature deaths during the key years, which peaked in 2025 and gradually decreased thereafter, reaching 7 (95% CI: 1–12) premature deaths in 2060.
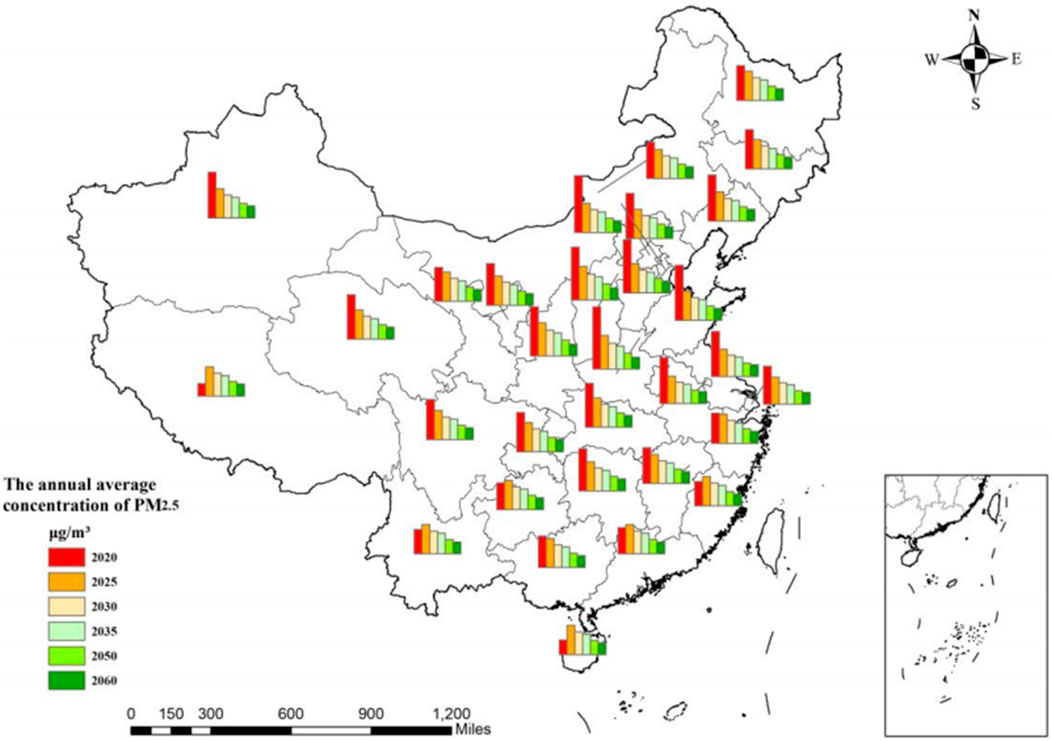
Figure 2. Annual average PM2.5 concentration from 2020 to 2060.
As shown in Figure 3, the number of premature deaths caused by COPD was higher than that caused by lung cancer. It could be clearly observed that the concentration of PM2.5 would reduce the number of premature deaths in China with the implementation of the “oil control” policy, which aims to reduce transportation sector emissions by 66.3% by 2060, which is directly linked to the reduction of PM2.5, as shown in Figure 4. Shandong was the province with the highest number of premature deaths, with 1,615 (95% CI: 1,536–1,694) premature deaths in 2020. However, there would be 185 (95% CI: 158–212) premature deaths in Shandong province in 2060. With the decrease in the PM2.5 concentrations, the number of premature deaths would decrease. The number of premature deaths in 2020, 2025, 2030, and 2035 was the highest in Shandong province, and the highest number of premature deaths in 2035, 2050, and 2060 would occur in Guangdong province. Tibet had the lowest death toll in the key years. There were five (95% CI: 1–9) premature deaths in 2020, which increased to a peak of 16 (95% CI: 8–24) in 2025 before decreasing. The number of premature deaths is expected to be six (95% CI: 1–11) in 2060.
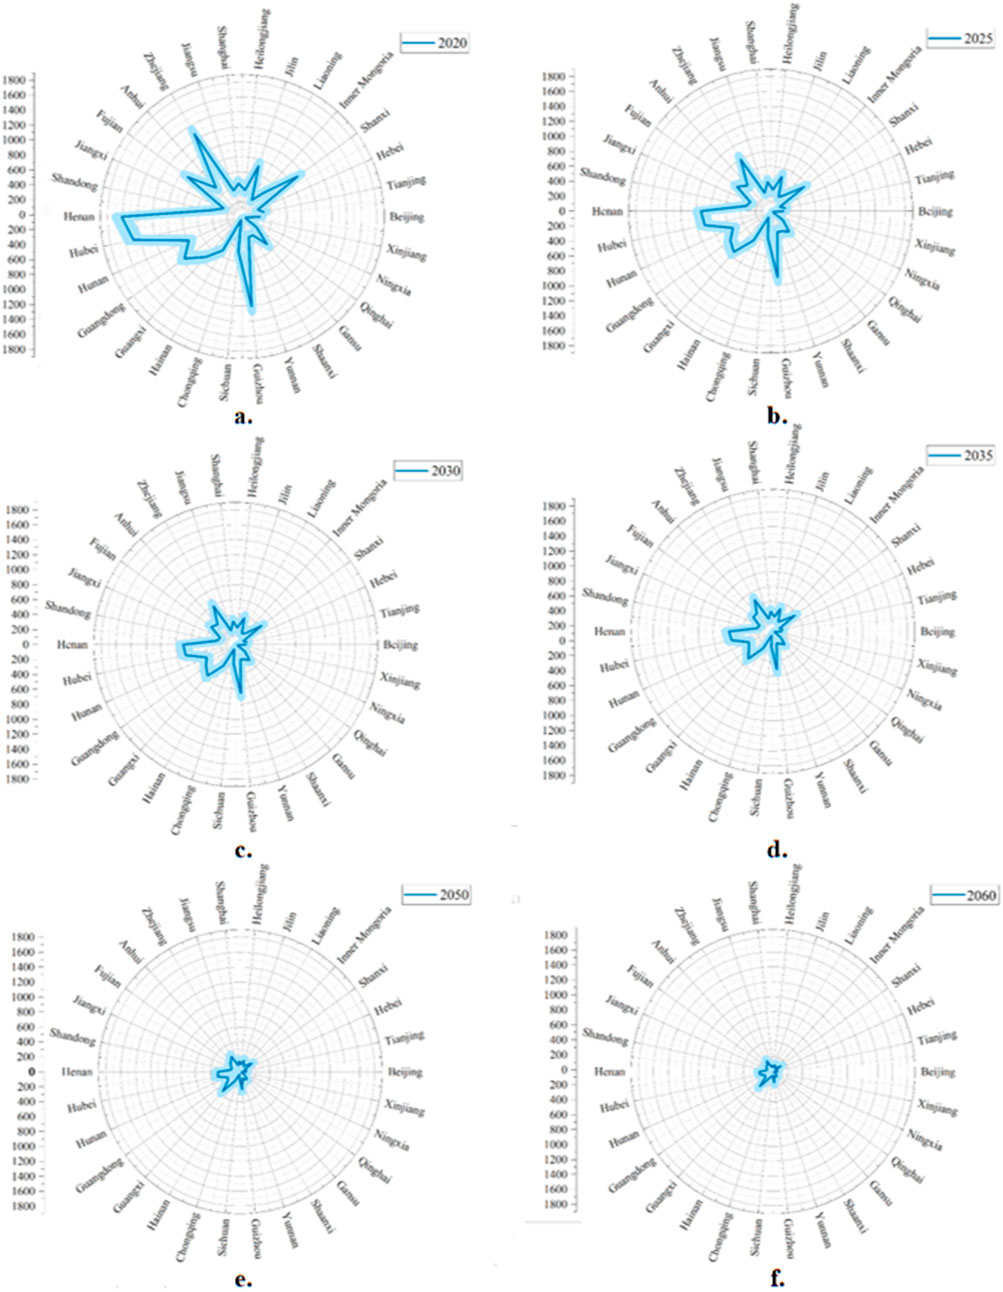
Figure 3. Population health effects of COPD across key years (a. 2020; b. 2025; c. 2030; d. 2035; e. 2050; f. 2060).
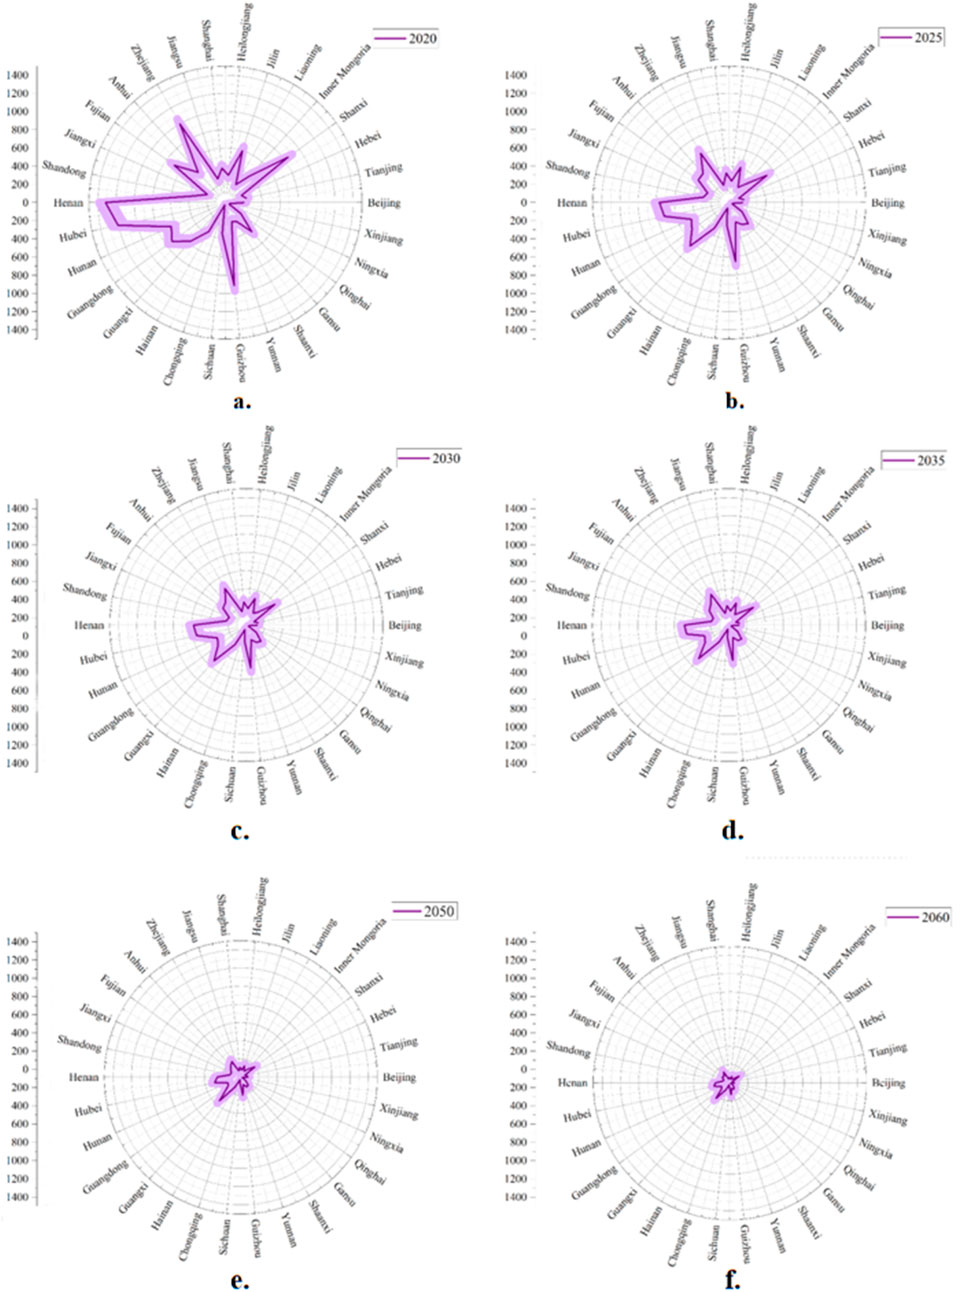
Figure 4. Population Health effects of lung cancer across key years (a. 2020; b. 2025; c. 2030; d. 2035; e. 2050; f. 2060).
As shown in Figure 5, IHD would be the health effect endpoint with the smallest change in the number of premature deaths over time. In addition, Shandong province had the highest number of deaths in 2020. It would also be the province with the largest gap in the number of premature deaths from 2002 to 2030. The province with the highest number of premature deaths in 2060 would be Guangdong. Tibet is expected to remain the province with the lowest number of premature deaths, following a trend similar to that of COPD, with 48 premature deaths projected in 2060.
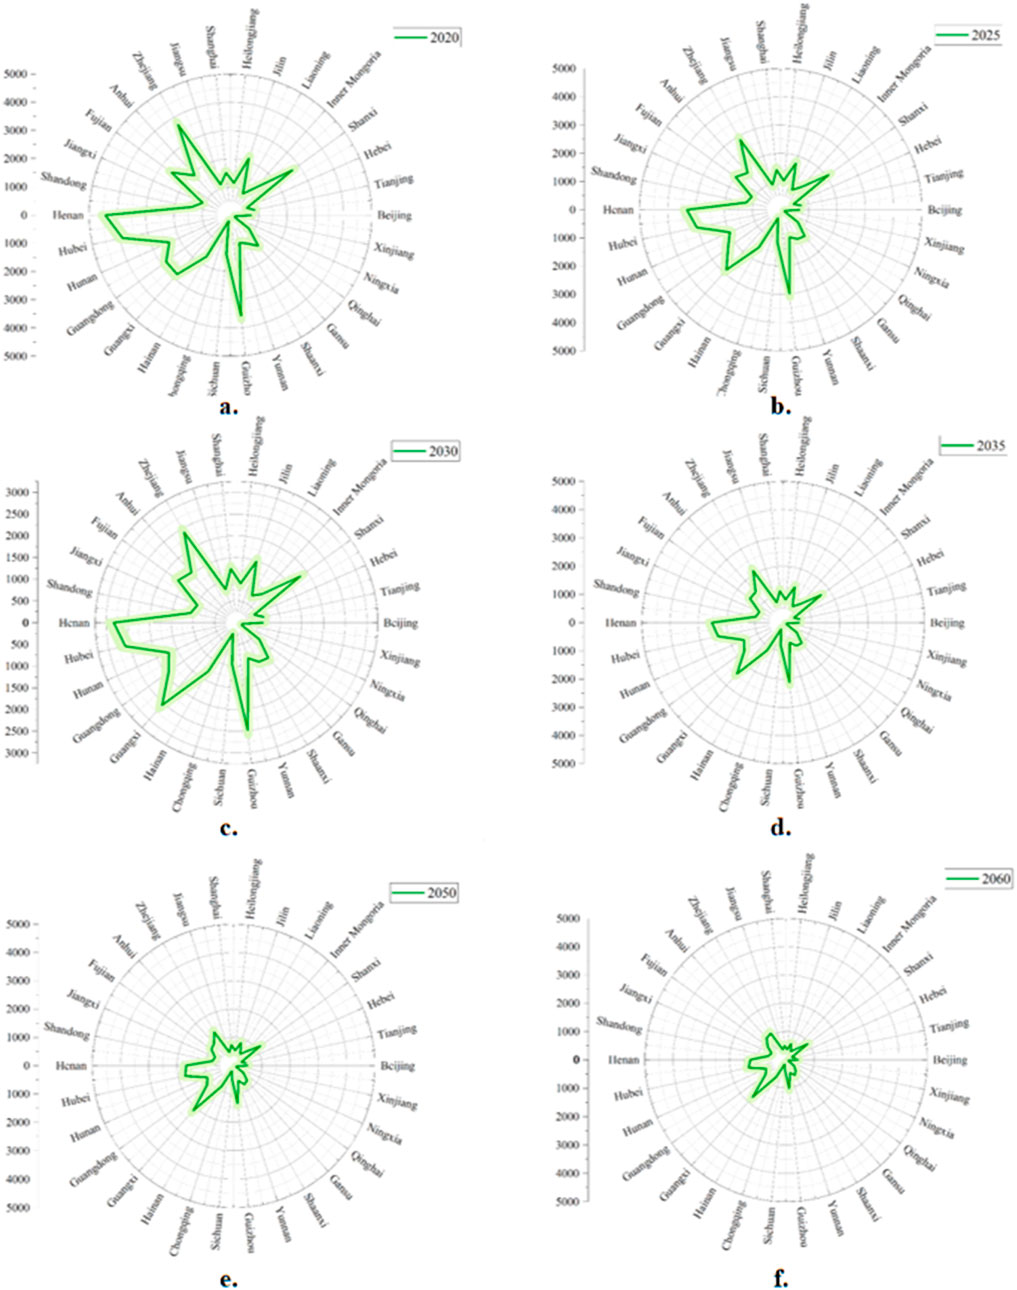
Figure 5. Population Health effects of IHD across key years (a. 2020; b. 2025; c. 2030; d. 2035; e. 2050; f. 2060).
As shown in Figure 6, the number of premature deaths due to stroke would be the highest among the four health effect endpoints, and the province with the highest number of premature deaths in 2020 would still be Shandong, with 5,284 (95% CI: 5,141–5,426). Henan and Jiangsu provinces would rank second and third, with 4,639 (95% CI: 4,506–4,772) and 4,156 (95% CI: 4,030–4,282) premature deaths, respectively. Shandong, Guangdong, and Henan had more than 3,000 premature deaths in 2025, with 3,405 (95% CI: 3,290–3,519), 3,301 (95% CI: 3,188–3,414), and 3,227 (95% CI: 3,116–3,338), respectively. The province with the greatest change would still be Shandong in the key years. The smallest number of premature deaths would be in Tibet.
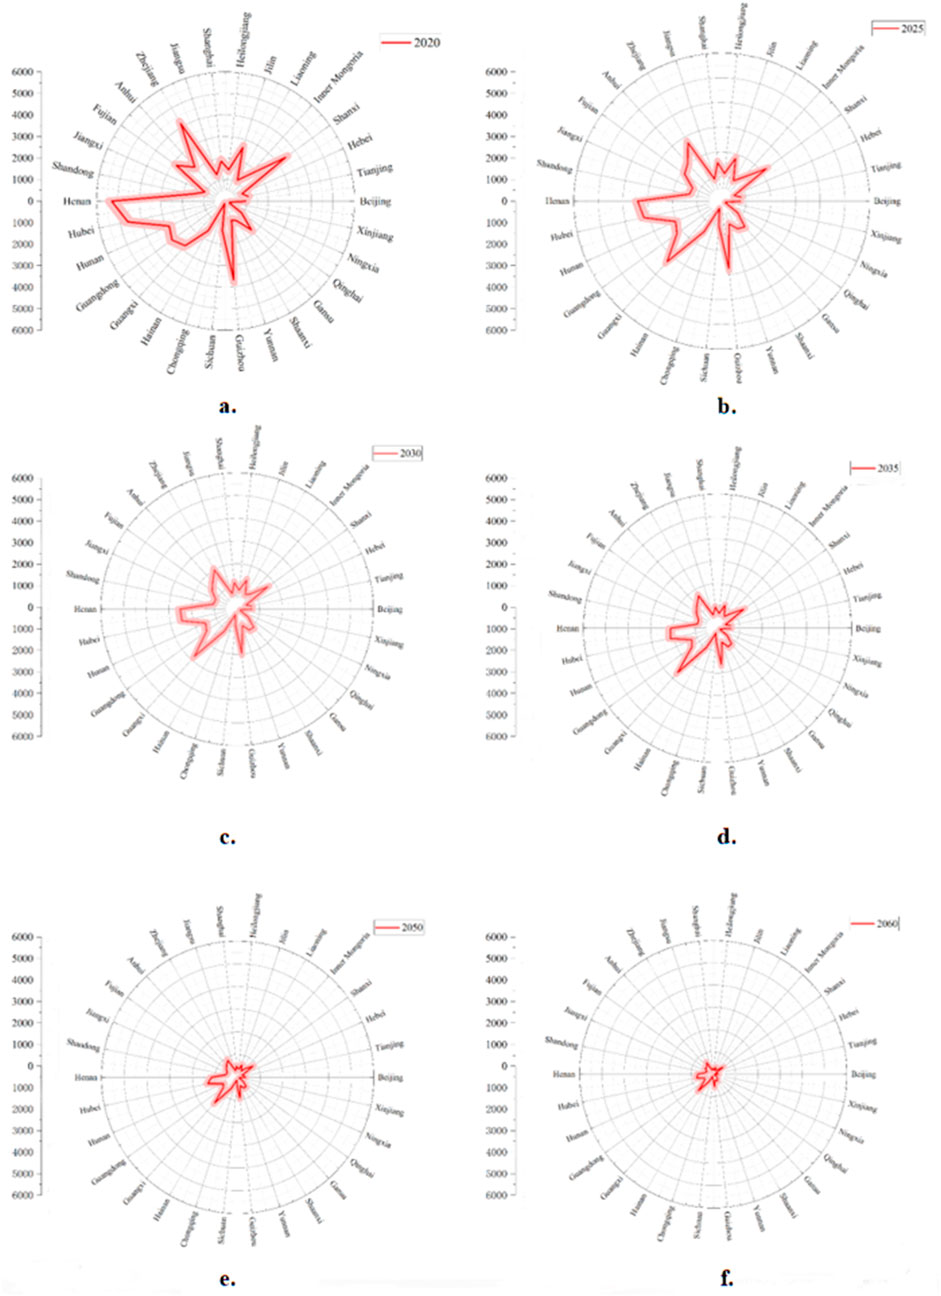
Figure 6. Population Health effects of stroke across key years (a. 2020; b. 2025; c. 2030; d. 2035; e. 2050; f. 2060).
4.2 Economic losses from the health effects of PM2.5 emissions from oil consumption by mobile sources across all age groups
Using the predicted GDP data for each province and the number of premature deaths, the economic losses from the four health effect endpoints varied across all age groups in the key years. The economic losses from the health effects of lung cancer and COPD in different age groups in the key years are shown in Figure 7.
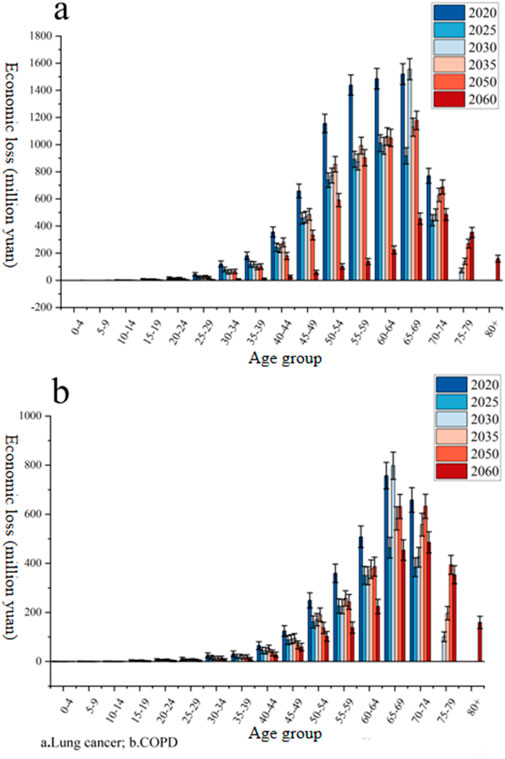
Figure 7. Economic losses from the health effects of lung cancer and COPD in different age groups in the key years (million yuan). (a) Lung cancer; (b) COPD.
The economic losses caused by lung cancer were 0 for the age of 0–9 years in 2020, 2025, 2030, 2035, and 2050. It was also 0 for age 75 in 2020 and 2025, and for age 80 in 2030, 2035, and 2050. In 2060, the economic losses after the age of 80 are projected to be approximately 159.48 million yuan (95% CI: 134.73–184.23). The most significant economic losses in the key years occurred in the 50–69 age group. The 65–69 age group had the most economic losses in 2020, with 1,519.88 million yuan (95% CI: 1,442.70–1,597.08). This was followed by the 60–64 and 55–59 age groups, with losses of 1,485.42 million yuan (95% CI: 1,409.11–1,561.73) and 1,438.88 million yuan (95% CI: 1,363.78–1,513.99), respectively. The largest projected economic losses in 2060 are also in the 65–69 age group, estimated at 485.58 million yuan (95% CI: 442.40–528.78).
For COPD, the economic losses were mainly concentrated in the 60–74 age group in 2020. In addition, the 65–69 age group had the highest economic losses, with 757.23 million yuan (95% CI: 703.30–811.17). The economic losses after the age of 75 were 0. The economic losses in 2025 are expected to decrease, although the 65–69 age group would still have the highest economic losses in 2025 and 2030. After that, the economic losses are projected to gradually decrease. In 2060, the highest economic losses are expected in the 70–74 age group, estimated at 485.58 million yuan (95% CI: 442.40–528.78).
As shown in Figure 8, the distribution of the economic losses from IHD was in the 55–74 age group, but the change in economic losses over time was not obvious. The economic losses were the lowest in 2025, after which they alternately increased and decreased. The highest economic losses are projected to occur in 2050, followed by a decrease in the subsequent years.
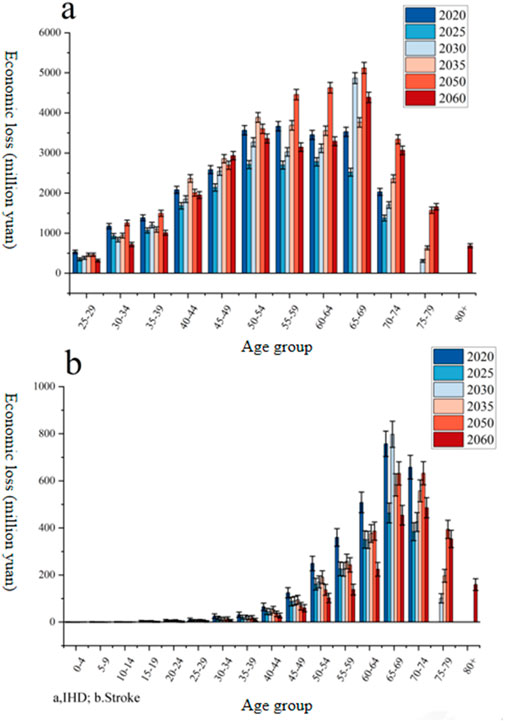
Figure 8. Economic losses from the health effects of stroke and IHD in different age groups in the key years (million yuan). (a) IHD; (b) Stroke
The economic losses from stroke in all age groups are expected to decrease rapidly over time. In 2020, the economic losses from stroke were mainly concentrated in the 60–74 age group, after which they gradually decreased. In 2050, it would be mainly concentrated in the 65–74 age group. In 2060, it would be mainly concentrated in the 65–79 age group. Higher economic losses in the 50–74 age group are closely related to China’s delayed retirement policy (currently set at 60 years) and inadequate health insurance coverage (resulting in high out-of-pocket expenses).
4.3 Economic losses caused by the four health effect endpoints in the key years
Figure 9 shows the economic losses from the four health effect endpoints in the key years. The economic losses caused by stroke were the highest among the four health effect endpoints in 2020, which were 31.81 billion yuan (95% CI: 28.32–35.31). In 2050, the economic losses caused by IHD are projected to be the biggest, amounting to 24.01 billion yuan (95% CI: 20.97–27.04). The economic losses caused by COPD during the key years from 2020 to 2060 are projected to be the lowest. Secondary findings (e.g., COPD’s low economic losses despite high mortality) highlight the need for disease-specific healthcare investments rather than relying only on aggregate pollution control.
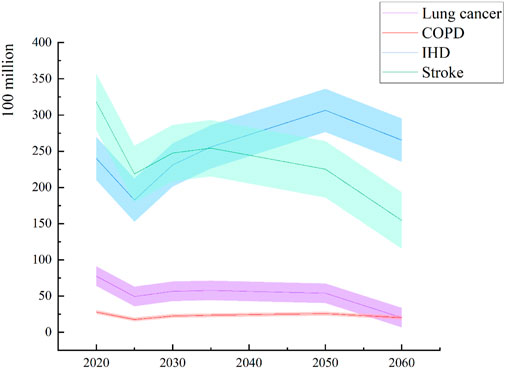
Figure 9. Economic losses of four health effect endpoints in the key years (yuan).
The high number of premature deaths due to stroke in Shandong (5,284 cases in 2020) aligns with the findings of Xu and Lin (2018), who identified vehicle emissions as a key PM2.5 contributor in populous provinces. The age-specific economic losses (e.g., 65–69 age group) are consistent with those described by Zhao et al. (2016), who emphasized the vulnerability of middle-aged cohorts. The projected decrease in PM2.5 concentrations and associated health improvements reflect the effectiveness of China’s “oil control” policies, as discussed by He et al. (2020). The accuracy of the results can thus be demonstrated. The shaded areas represent 95% confidence intervals.
4.4 Uncertainty and sensitivity analyses
The results of this study rely on model assumptions, data quality, and parameter selection, necessitating a systematic assessment of their uncertainty and sensitivity to enhance the robustness of the conclusions.
4.4.1 Data uncertainty
The data for PM2.5 concentration predictions are based on scenario analysis by Tsinghua University and the Energy Foundation (He et al., 2020), which assumes a concentration reduction to 10 μg/m3 by 2060 (WHO standard). However, actual concentrations may deviate from the predicted values due to the strength of policy implementation, technological advancements, or sudden environmental events. Additionally, population and GDP projections are based on the SSP4 scenario (Chen Y. et al., 2020), without considering extreme socio-economic development patterns (such as accelerated population migration or economic recession) that may impact age group distribution and economic loss estimates. Sensitivity analysis shows that if the GDP growth rate is reduced by 1%, the economic losses due to IHD in 2050 also decrease by approximately 7.2% (95% CI: 5.8%–8.5%).
4.4.2 Model parameter assumptions
The RR parameters (α, γ, δ) and the threshold concentration (Zcf) in the IER model are derived from the Global Burden of Disease study (Burnett et al., 2014), but there may be regional specificity in the exposure–response relationship of the Chinese population to PM2.5. By adjusting the Zcf value (from 5 μg/m3 to 15 μg/m3), it was found that the estimated difference in premature deaths could reach 12%–18%. Furthermore, the contribution rate of mobile sources to PM2.5 (μ = 9.8%) is based on historical research (Chen et al., 2019). If this value is increased to 12%, the number of premature deaths due to lung cancer in Shandong province in 2020 also increases by 14.3% (95% CI: 12.1%–16.5%).
4.4.3 Baseline health status and population dynamics
The study assumes constant mortality rates after 2019 (Global Burden of Diseases, 2019), without consideringthe impact of future medical technological advancements or improvements in chronic disease management. If the baseline mortality rate decreases by 1% annually, the number of premature deaths due to COPD in 2060 also decreases by 23.6% (95% CI: 20.4%–26.8%). Additionally, the population projections do not consider the disturbance to the age structure caused by sudden public health events (such as pandemics), potentially underestimating the economic losses in the older age group.
4.4.4 Economic parameter sensitivity
The discount rate (λ = 4.7%) has a significant impact on economic loss estimates (People’s Bank of China, 2015). If a 3% discount rate is used, the economic losses due to stroke in 2050 will increase by 19.4% (95% CI: 16.8%–21.9%). At the same time, the human capital approach does not fully capture the loss of life value for non-working populations (such as retirees) (Zhao et al., 2016), potentially underestimating the social costs for older groups.
4.4.5 Regional heterogeneity
The study assumes a consistent trend in PM2.5 concentration reduction across provinces, but actual emission reduction effects may differ due to variations in policy implementation efficiency and industrial structure. For example, if the Beijing–Tianjin–Hebei region achieves the PM2.5 concentration target ahead of schedule (such as reducing it to 25 μg/m3 by 2030), the reduction in premature deaths will be 8%–12% higher than the national average (He et al., 2020).
5 Conclusion and policies
From the results mentioned above, the following conclusions and policies can be obtained.
5.1 Conclusion
Despite our efforts to ensure the accuracy and completeness of the data, the data may still be affected by limitations in the collection, processing, and reporting process; all analytical models are based on certain assumptions. Although the most appropriate model for this study was selected and validated, there may be discrepancies between the model assumptions and the actual situation; this study does not consider all possible external factors. For example, 1) external factors such as policy changes, technological advances, or natural disasters may have a significant impact on mobile source fuel consumption and PM2.5 pollution. 2) Exclusion of confounding factors (e.g., smoking and indoor pollution). 3) Assumption of constant mortality rates post-2019. Sensitivity analyses confirmed robustness, and uncertainties are quantified by 95% confidence intervals in the results. These factors were not fully considered in the model, which may lead to some bias in the results. 4) Although our study does not account for individual habits (e.g., smoking), it aligns with the methodologies of Zhao et al. (2016) and Burnett et al. (2014), which prioritize population-level analyses. Future work could integrate behavioral surveys.
(1) The concentrations of PM2.5 emissions would decrease gradually in the key years. With the transformation and modernization of the energy consumption structure, oil consumption from mobile sources would first increase and then decrease. Thus, it would reduce PM2.5 emissions from oil consumption by mobile sources and further reduce the number of premature deaths and economic losses in China. This is due to China’s “oil control” policy (66.3% reduction in transportation emissions by 2060) and GDP-driven energy transitions.
(2) The number of premature deaths in the four health effect endpoints in different provinces of China varied significantly, but the ranking of premature deaths at the provincial level changed little. The number of premature deaths in Shandong province was higher than that in other provinces. Tibet was the province with the lowest number of premature deaths among the four health effect endpoints. However, there was a significant difference in the number of premature deaths for the four health endpoints. The number of premature deaths due to IHD and stroke was significantly higher than those due to COPD and lung cancer.
(3) The individuals in the 55–74 age group had more economic losses from the four health endpoints than other age groups. China’s economy continued to grow, although the number of premature deaths from the four health endpoints decreased. In 2020, 2025, 2050, and 2060, the economic losses from premature death due to stroke were the highest, and the economic losses from premature death due to IHD and lung cancer gradually increased from 2025 to 2050 in the key years; the economic losses from premature death due to IHD and lung cancer decreased in the 2020–2025 and 2050–2060 periods. The economic loss from premature death due to COPD was the lowest in the key years.
5.2 Policies
(1) New energy vehicles should be vigorously promoted, and the transformation of energy consumption from mobile sources should be accelerated. To reduce oil consumption from mobile sources, the use of new energy fuels such as hydrogen and natural gas should be strengthened, which would reduce PM2.5 emissions and the number of premature deaths and economic losses. It is recommended to refer to Guangdong province’s 2025 new energy vehicle subsidy policy (a single-vehicle subsidy of 20,000 yuan) to formulate a phased cost-sharing program for technological alternatives.
(2) Provinces should coordinate with each other to reduce PM2.5 emissions from oil consumption by mobile sources. Shandong province, with high numbers of premature deaths, should improve PM2.5 air quality indicators and adjust the population structure to reduce the number of premature deaths.
(3) The health of the 55-74 age group should be focused on improving their lung function. In addition, the healthy personal lifestyle of the elderly should be strengthened to reduce the risk of lung cancer, COPD, IHD, and stroke in older adults.
(4) In addition to the theoretical contributions, our study also has practical implications for policymakers and stakeholders. By identifying the key drivers of PM2.5-related health effects and economic losses, our findings provide a scientific basis for formulating more effective environmental and energy policies. For instance, policymakers can use the results of this study to prioritize regions and sectors for emission reduction measures and design targeted policies that address the specific health risks associated with PM2.5 pollution. Moreover, our analysis of premature deaths and economic losses can inform public health initiatives and resource allocation strategies, thereby helping to mitigate the adverse impacts of air pollution on population health and well-being. Overall, by bridging the gap between theoretical insights and practical outcomes, our study offers a comprehensive framework for addressing the challenges posed by PM2.5 pollution from mobile source oil consumption in China.
(5) Based on the regional inequality of SSP4 assumptions, it is recommended to take the lead in implementing stricter emission standards for mobile sources (e.g., National VII standards) in economically developed regions such as Beijing–Tianjin–Hebei and the Yangtze River Delta; additionally, a pilot program for inter-provincial trading of PM2.5 emission rights could be implemented by borrowing from the European Union’s “Carbon Border Adjustment Mechanism” to balance the cost of abatement with health benefits. At the same time, less developed provinces (e.g., Tibet) can prioritize the promotion of low-cost new energy transportation (e.g., electric agricultural vehicles), relying on the SSP4 technology diffusion path.
Data availability statement
The original contributions presented in the study are included in the article/supplementary material; further inquiries can be directed to the corresponding author.
Author contributions
YL: writing – original draft and writing – review and editing. YX: writing – review and editing. JC: writing – review and editing. YC: writing – review and editing. ZW: writing – review and editing. CR: writing – review and editing.
Funding
The author(s) declare that financial support was received for the research and/or publication of this article. This study was supported by the Research on the Practice of Building a Chinese-Style Modernized Green Mine at the Julong Copper Mine Empowered by Technological Innovation.
Conflict of interest
The authors declare that the research was conducted in the absence of any commercial or financial relationships that could be construed as a potential conflict of interest.
Generative AI statement
The author(s) declare that no Gen AI was used in the creation of this manuscript.
Publisher’s note
All claims expressed in this article are solely those of the authors and do not necessarily represent those of their affiliated organizations, or those of the publisher, the editors and the reviewers. Any product that may be evaluated in this article, or claim that may be made by its manufacturer, is not guaranteed or endorsed by the publisher.
References
Anenberg, S., Miller, J., Henze, D. A. V. E. N., and Minjares, R. (2019). A global snapshot of the air pollution-related health impacts of transportation sector emissions in 2010 and 2015. Washington, DC: International Council on Clean Transportation. 1–48.
Anenberg, S. C., Horowitz, L. W., Tong, D. Q., and West, J. J. (2010). An estimate of the global burden of anthropogenic ozone and fine particulate matter on premature human mortality using atmospheric modeling. Environmental health perspectives 118 (9), 1189–1195.
Anser, M. K., Hanif, I., Vo, X. V., and Alharthi, M. (2020). The long-run and short-run influence of environmental pollution, energy consumption, and economic activities on health quality in emerging countries. Environ. Sci. Pollut. R. 27, 32518–32532. doi:10.1007/s11356-020-09348-1
Apte, J. S., Marshall, J. D., Cohen, A. J., and Brauer, M. (2015). Addressing global mortality from ambient PM2.5. Environ. Sci. Technol. 49 (13), 8057–8066. doi:10.1021/acs.est.5b01236
Burnett, R. T., Pope, I. I. I. C. A., Ezzati, M., Olives, C., Lim, S. S., Mehta, S., et al. (2014). An integrated risk function for estimating the global burden of disease attributable to ambient fine particulate matter exposure. Environ. Health Persp 122 (4), 397–403. doi:10.1289/ehp.1307049
Chao, S., Liu, J., Chen, Y., Cao, H., and Zhang, A. (2019). Implications of seasonal control of PM2.5-bound PAHs: an integrated approach for source apportionment, source region identification and health risk assessment. Environ. Pollut. 247, 685–695. doi:10.1016/j.envpol.2018.12.074
Chen, H., Li, L., Lei, Y., Wu, S., Yan, D., and Dong, Z. (2020a). Public health effect and its economics loss of PM2.5 pollution from coal consumption in China. Sci. Total Environ. 732, 138973–138978. doi:10.1016/j.scitotenv.2020.138973
Chen, R., Zhang, Y., Yang, C., Zhao, Z., Xu, X., and Kan, H. (2013). Acute effect of ambient air pollution on stroke mortality in the China air pollution and health effects study. Stroke 44 (4), 954–960. doi:10.1161/strokeaha.111.673442
Chen, X., Wang, L., Tang, Q., Hao, C., Pan, X., et al. (2019). A study on the true cost of oil in China. Oil control Research project “Real Cost of Oil” research group. Available online at: http://www.nrdc.cn/information/informationinfo?id=215&cook=2.
Chen, Y., Guo, F., Wang, J., Cai, W., Wang, C., and Wang, K. (2020b). Provincial and gridded population projection for China under shared socioeconomic pathways from 2010 to 2100. Sci. Data 7 (1), 83–13. doi:10.1038/s41597-020-0421-y
China National Environmental Monitoring Centre (CNEMC) (2023). National urban air quality report. Available online at: http://www.cnemc.cn.
Chowdhury, Z., Zheng, M., Schauer, J. J., Sheesley, R. J., Salmon, L. G., Cass, G. R., et al. (2007). Speciation of ambient fine organic carbon particles and source apportionment of PM2.5 in Indian cities. J. Geophys Res-Atmos 112, 1–14. doi:10.1029/2007JD008386
Evans, J., Donkelaar, A., Martin, R. V., Burnett, R., Rainham, D. G., Birkett, N. J., et al. (2013). Estimates of global mortality attributable to particulate air pollution using satellite imagery. Environ. Res. 120, 33–42. doi:10.1016/j.envres.2012.08.005
Fann, N., Baker, K. R., Chan, E. A. W., Eyth, A., Macpherson, A., Miller, E., et al. (2018). Assessing human health PM2.5 and ozone impacts from US oil and natural gas sector emissions in 2025. Environ. Sci. Technol. 52 (15), 8095–8103. doi:10.1021/acs.est.8b02050
Fu, X., Li, L., Lei, Y., Wu, S., Yan, D., Luo, X., et al. (2020). The economic loss of health effect damages from PM2.5 pollution in the Central Plains Urban Agglomeration. Environ. Sci. Pollut. R. 27 (20), 25434–25449. doi:10.1007/s11356-020-08560-3
Global Burden of Diseases (2019). Mortality rate of related diseases in China in 2019. Available online at: http://ghdx.healthdata.org/gbd-results-tool.
Guan, D., Su, X., Zhang, Q., Guan, D., Su, X., Zhang, Q., et al. (2014). The socioeconomic drivers of China’s primary PM2.5 emissions. Environ. Res. Lett. 9 (2), 024010–024019. doi:10.1088/1748-9326/9/2/024010
Guan, Y., Kang, L., Wang, Y., Zhang, N. N., and Ju, M. T. (2019). Health loss attributed to PM2.5 pollution in China's cities: economic impact, annual change and reduction potential. J. Clean. Prod. 217, 284–294. doi:10.1016/j.jclepro.2019.01.284
Guo, H., Kota, S. H., Sahu, S. K., Hu, J., Ying, Q., Gao, A., et al. (2017). Source apportionment of PM2.5 in North India using source-oriented air quality models. Environ. Pollut. 231, 426–436. doi:10.1016/j.envpol.2017.08.016
Guo, Y., Li, R., Huang, B., Jiang, Y., and Wei, Z. (2020). Analysis of health effects under the control of PM2.5 pollution in Baoding. China Environ. Sci. 40, 5459–5467. (in Chinese). doi:10.19674/j.cnki.issn1000-6923.2020.0604
He, K., Zhang, Q., Tong, D., Cheng, J., and Liu, Y. (2020). Medium and long term air quality in China Improvement path and health benefits. Tsinghua University. Available online at: https://www.efchina.org/Attachments/Report/report-cemp-20200413.
Huang, J., Pan, X., Guo, X., and Li, G. (2018). Health impact of China's Air Pollution Prevention and Control Action Plan: an analysis of national air quality monitoring and mortality data. Lancet Planet Health 2 (7), e313–e323. doi:10.1016/S2542-5196(18)30141-4
Huang, R. J., Zhang, Y., Bozzetti, C., Ho, K. F., Cao, J. J., Han, Y., et al. (2014). High secondary aerosol contribution to particulate pollution during haze events in China. Nature 514 (7521), 218–222. doi:10.1038/nature13774
Jo, Y. S., Lim, M. N., Han, Y. J., and Kim, W. J. (2018). Epidemiological study of PM2.5 and risk of COPD-related hospital visits in association with particle constituents in Chuncheon, Korea. Int. J. Chronic Obstr. 13, 299–307. doi:10.2147/COPD.S149469
Kalaiarasan, G., Balakrishnan, R. M., Sethunath, N. A., and Manoharan, S. (2018). Source apportionment studies on particulate matter (PM10 and PM2.5) in ambient air of urban Mangalore, India. J. Environ. Manage 217, 815–824. doi:10.1016/j.jenvman.2018.04.040
Kong, L., Tan, Q., Feng, M., Qu, Y., An, J., Liu, X., et al. (2020). Investigating the characteristics and source analyses of PM2.5 seasonal variations in Chengdu, Southwest China. Chemosphere 243, 125267–131267. doi:10.1016/j.chemosphere.2019.125267
Li, L., Lei, Y., Wu, S., Chen, J., and Yan, D. (2017). The health economic loss of fine particulate matter (PM2.5) in Beijing. J. Clean. Prod. 161, 1153–1161. doi:10.1016/j.jclepro.2017.05.029
Li, L., Lei, Y., Wu, S., Huang, Z., Luo, J., Wang, Y., et al. (2018). Evaluation of future energy consumption on PM2.5 emissions and public health economic loss in Beijing. J. Clean. Prod. 187, 1115–1128. doi:10.1016/j.jclepro.2018.03.229
Lim, S. S., Vos, T., Flaxman, A. D., Danaei, G., Shibuya, K., Adair-Rohani, H., et al. (2012). A comparative risk assessment of burden of disease and injury attributable to 67 risk factors and risk factor clusters in 21 regions, 1990–2010: a systematic analysis for the Global Burden of Disease Study 2010. Lancet 380 (9859), 2224–2260. doi:10.1016/S0140-6736(12)61766-8
Liu, X., Li, J., and He, K. (2022). Impact of electric vehicle adoption on PM2.5 reduction: a case study of Beijing-Tianjin-Hebei region. Atmos. Environ. 289, 119345. doi:10.1016/j.atmosenv.2022.119345
Lu, X., Lin, C., Li, W., Chen, Y., Huang, Y., Fung, J. C., et al. (2019). Analysis of the adverse health effects of PM2.5 from 2001 to 2017 in China and the role of urbanization in aggravating the health burden. Sci. Total Environ. 652, 683–695. doi:10.1016/j.scitotenv.2018.10.140
Luo, G., Zhang, L., Hu, X., and Qiu, R. (2020). Quantifying public health benefits of PM2.5 reduction and spatial distribution analysis in China. Sci. Total Environ. 719, 137445–137449. doi:10.1016/j.scitotenv.2020.137445
Maji, K. J., Ye, W. F., Arora, M., and Shiva Nagendra, S. (2018). PM2.5-related health and economic loss assessment for 338 Chinese cities. Environ. Int. 121, 392–403. doi:10.1016/j.envint.2018.09.024
Masiol, M., Squizzato, S., Rich, D. Q., and Hopke, P. K. (2019). Long-term trends (2005–2016) of source apportioned PM2.5 across New York State. Atmos. Environ. 201, 110–120. doi:10.1016/j.atmosenv.2018.12.038
National Bureau of Statistics (NBS) (2023). China energy statistical Yearbook 2023. Available online at: http://www.stats.gov.cn.
National Bureau of Statistics of the People's Republic of China (2021). China statistical Yearbook. Available online at: https://data.stats.gov.cn/.
National Development and Reform Commission (NDRC). (2023). Annual report on transportation energy consumption in China
OECD (2021). The forecast of China's future GDP. Available online at: https://data.oecd.org/gdp/real-gdp-long-term-forecast.htm#indicator-chart.
Oil control research Project research group (2019). China Oil Consumption Cap Plan and Policy Research Project. Research on China’s Oil Consumption Peak and Cap Plan: Main Report. 2019. [R/OL]. Available online at: http://www.nrdc.cn/Public/uploads/2019-12-18/5df9f1cbe69cb.pdf.
Pan, X., Wu, Z., and Wang, Z. (2019). Analysis on the health benefit from on oil cap in China. Available online at: http://www.nrdc.cn/Public/uploads/2019-06-03/5cf430fb1a330.pdf.
Pascal, L., Pascal, M., Stempfelet, M., Goria, S., and Declercq, C. (2013). Ecological study on hospitalizations for cancer, cardiovascular, and respiratory diseases in the industrial area of Etang-de-Berre in the South of France. Int. J. Env. Res. Pub He 2013, 1–13. doi:10.1155/2013/328737
People’s Bank of China (2015). Schedule for adjustment of benchmark interest rates on RMB loans for financial institutions 24 October 2015. Available online at: http://www.pbc.gov.cn/zhengcehuobisi/125207/125213/125440/125838/125885/125896/2968998/index.html.
Pope, I. I. I. C. A., Burnett, R. T., Thurston, G. D., Thun, M. J., Calle, E. E., Krewski, D., et al. (2004). Cardiovascular mortality and long-term exposure to particulate air pollution: epidemiological evidence of general pathophysiological pathways of disease. Circulation 109 (1), 71–77. doi:10.1161/01.CIR.0000108927.80044.7F
Sahu, S. K., Beig, G., and Parkhi, N. S. (2011). Emissions inventory of anthropogenic PM2.5 and PM10 in Delhi during commonwealth games 2010. Atmos. Environ. 45 (34), 6180–6190. doi:10.1016/j.atmosenv.2011.08.014
The United Nations (2019). World population prospects 2019. Available online at: https://population.un.org/wpp/Download/Standard/Population/.
WHO (2005). WHO global air quality guidelines. Available online at: https://apps.who.int/iris/bitstream/handle/10665/69477/WHO_SDE_PHE_OEH_06.02_chi.pdf?sequence=3.
WHO (2018). Environmental (outdoor) air quality and health. Available online at: https://www.who.int/zh/news-room/fact-sheets/detail/ambient-(outdoor)-air-quality-and-health.
WHO (2021). WHO air quality guidelines global update. Available online at: https://www.who.int/news-room/questions-and-answers/item/who-global-air-quality-guidelines.
Xie, J., He, M., and Zhu, W. (2014). Acute effects of outdoor air pollution on emergency department visits due to five clinical subtypes of coronary heart diseases in shanghai, China. J. Epidemio 24 (6), 452–459. doi:10.2188/jea.JE20140044
Xie, Y., Dai, H., Dong, H., Hanaoka, T., and Masui, T. (2016). Economic impacts from PM2.5 pollution-related health effects in China: a provincial-level analysis. Environ. Sci. Technol. 50 (9), 4836–4843. doi:10.1021/acs.est.5b05576
Xu, B., and Lin, B. (2018). What cause large regional differences in PM2.5 pollution in China? Evidence from quantile regression model. J. Clean. Prod. 174, 447–461. doi:10.1016/j.jclepro.2017.11.008
Yang, S., Chen, B., Wakeel, M., Hayat, T., Alsaedi, A., and Ahmad, B. (2018). PM2.5 footprint of household energy consumption. Appl. Energ 227, 375–383. doi:10.1016/j.apenergy.2017.11.048
Yin, P., Brauer, M., Cohen, A. J., Wang, H., Li, J., Burnett, R. T., et al. (2020). The effect of air pollution on deaths, disease burden, and life expectancy across China and its provinces, 1990–2017: an analysis for the Global Burden of Disease Study 2017. Lancet Planet Health 4, 386–398. doi:10.1016/S2542-5196(20)30161-3
Yu, A., Jia, G., You, J., and Zhang, P. (2018). Estimation of PM2.5 concentration efficiency and potential public mortality reduction in urban China. Int. J. Env. Res. Pub He 15 (3), 529–619. doi:10.3390/ijerph15030529
Zeng, X., and Ruan, F. (2020). Analysis on the national economic impact of PM2.5-induced health effects in China. China Environ. Sci. 40, 3228–3238. (in Chinese). doi:10.19674/j.cnki.issn1000-6923.2020.0361
Zhang, L., Liu, F., Liang, W., Gan, S., Wang, X., and Xiang, H. (2025). Effects of ambient PM2.5 and its components exposure on disease progression in male HIV-infected individuals [J]. Chinese Journal of Disease Control and Prevention, 29 (3): 289–295+303. doi:10.16462/j.cnki.zhjbkz.2025.03.007
Zhang, L., Wang, Y., and Chen, Z. (2023). High-resolution emission inventory and source apportionment of transportation-related PM2.5 in China. Environ. Sci. and Technol. 57 (8), 3210–3221. doi:10.1021/acs.est.2c08976
Zhao, J., Li, M., Wang, Z., Chen, J., Zhao, J., Xu, Y., et al. (2019). Role of PM 2.5 in the development and progression of COPD and its mechanisms. Respiratory research, 20, 1–13.
Keywords: PM2.5, health effects, mobile sources, integrated exposure–response relationship model, oil consumption
Citation: Lin Y, Xi Y, Chen J, Cui Y, Wang Z and Ren C (2025) Health effects and economic losses due to PM2.5 pollution from oil consumption by mobile sources in China. Front. Environ. Sci. 13:1554150. doi: 10.3389/fenvs.2025.1554150
Received: 07 January 2025; Accepted: 01 April 2025;
Published: 15 May 2025.
Edited by:
Florian Nuță, Danubius International University, RomaniaReviewed by:
Matheus Koengkan, University of Aveiro, PortugalBeidi Diao, China University of Mining and Technology, China
Guorong Ding, Wuhan, China
Copyright © 2025 Lin, Xi, Chen, Cui, Wang and Ren. This is an open-access article distributed under the terms of the Creative Commons Attribution License (CC BY). The use, distribution or reproduction in other forums is permitted, provided the original author(s) and the copyright owner(s) are credited and that the original publication in this journal is cited, in accordance with accepted academic practice. No use, distribution or reproduction is permitted which does not comply with these terms.
*Correspondence: Jiabin Chen, Q2hlbkppYWJpbjIwMTQyQDEyNi5jb20=